

Enhanced Intrusion Detection Using Conditional-Tabular-Generative-Adversarial-Network-Augmented Data and a Convolutional Neural Network: A Robust Approach to Addressing Imbalanced Cybersecurity Datasets


Abstract
1. Introduction
- (1)
- Validation of CTGAN in creating realistic minority class samples in IDS dataset.
- (2)
- Integration of CTGAN along with the CNN classifier to enhance the detection performance.
- (3)
- Comparative analysis of the proposed method with traditional oversampling techniques showing superior accuracy and class balance.
2. Literature
3. Proposed Work
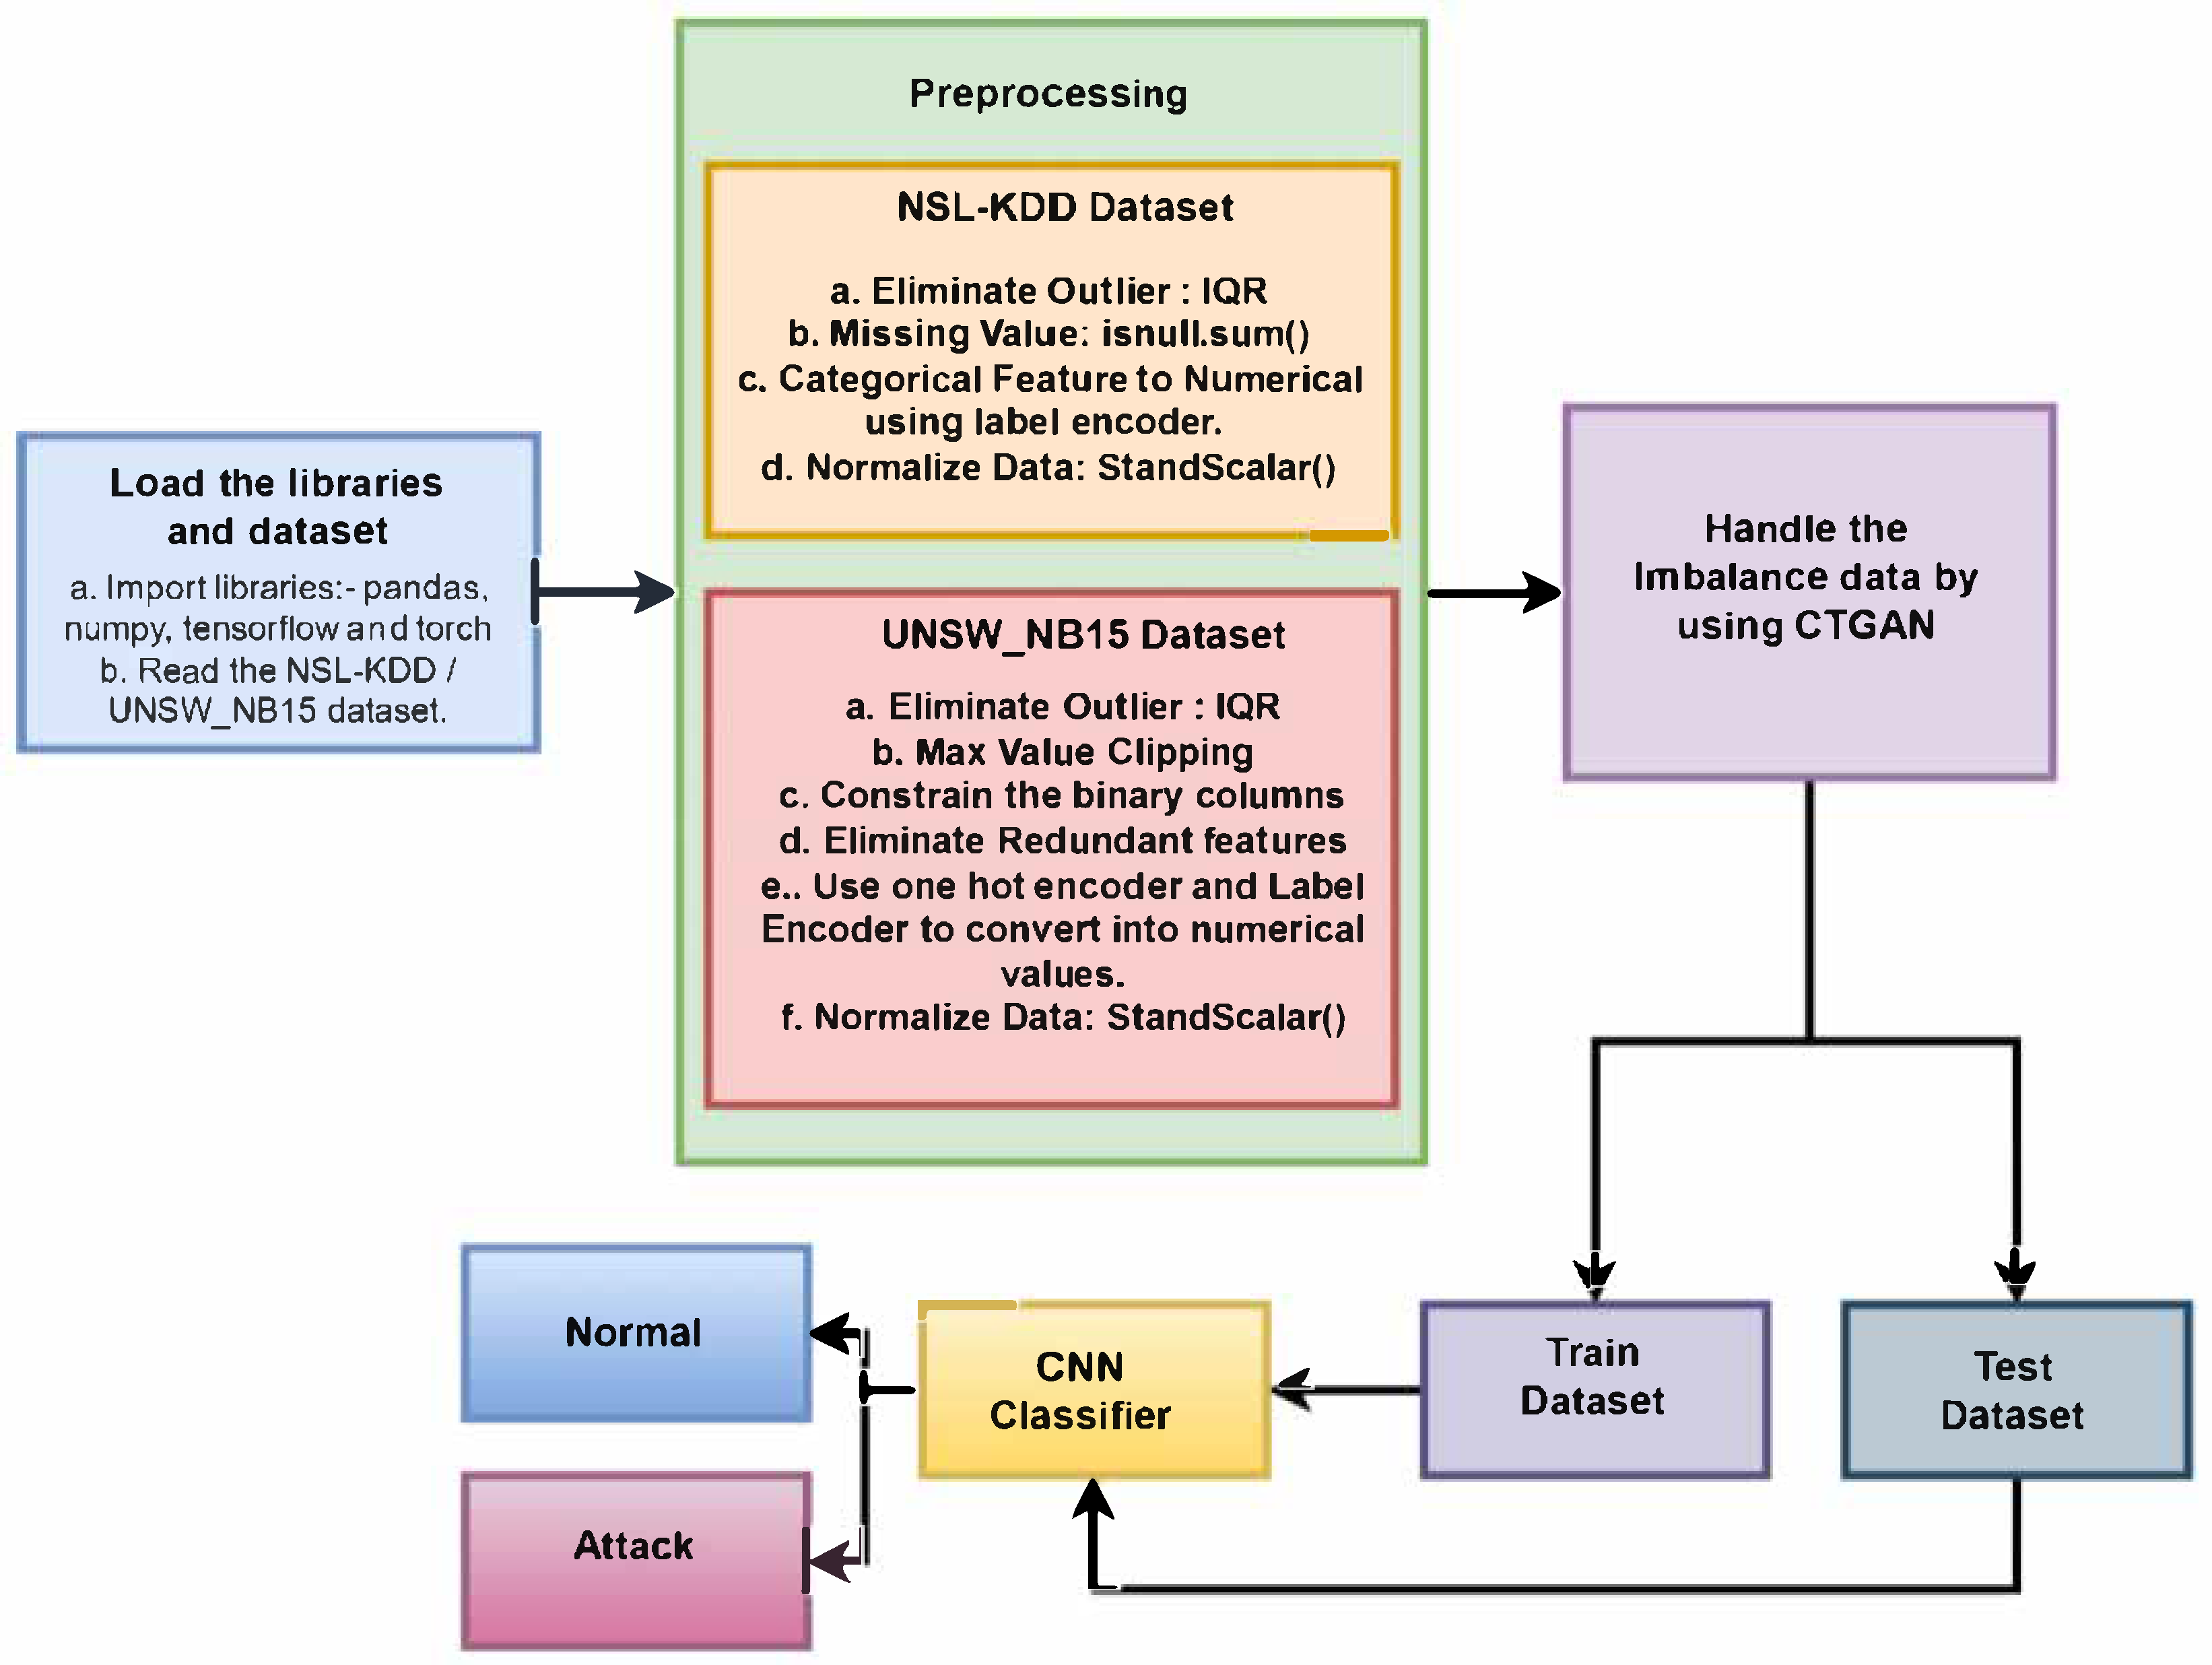
3.1. Data Pre-Processing and Feature Engineering
3.2. Classification Model
3.3. Algorithm for NSL_KDD Dataset
- (1)
- The first layer consists of 64 filters, with kernel size 3, and the activation function of ReLU.
- (2)
- The second layer is also called the max pooling layer, with a pool size 2.
- (3)
- The third layer contains 128 filters, kernel size 3, and ReLU.
- (4)
- The max pooling layer, which is the fourth layer, has a pool size of 2.
- (5)
- Flatten is the fifth layer.
- (6)
- The sixth layer, which has 64 neurons and ReLU as an activation function, is completely coupled.
- (7)
- The last layer is the output layer that performs binary classification with a single neuron and the sigmoid activation function.
3.4. Algorithm for UNSW_NB15 Data Set
- (1)
- First layer comprises 64 filters, kernel size 3, and ReLU activation function;
- (2)
- The next layer is also called the max pooling layer, with a pool size of 2;
- (3)
- The third layer contains 128 filters, kernel size 3, and ReLU as the activation function;
- (4)
- The max pooling layer, which is the fourth layer, has a pool size of 2;
- (5)
- Flatten is the fifth layer;
- (6)
- The sixth layer, which has 64 neurons and ReLU as an activation function, is completely coupled;
- (7)
- The last layer is the outputs of a binary classification, with a single neuron and sigmoid as the activation function.
3.5. Performance Evaluation
- 1.
- Accuracy: Accuracy tells how well a model is correctly predicting the test record. It is calculated using number of accurate predictions divided by all the predictions.
- 2.
- Precision: Precision informs how well a model can correctly predict positive records. It is calculated from the records accurately categorized as positive divided by records correctly categorized as favourable and falsely classified positive records.
- 3.
- Recall: Recall classifies positive records and is the ratio of correctly classified positive records, the sum of accurately categorized records, and the positive records classified negatively.
- 4.
- F1-score: The F1-score measures models’ performance by combining precision and recall.
- 5.
- Specificity: This is the model’s capacity to accurately predict harmful records. It is obtained by taking the fraction of correctly classified negative records divided by the sum of correctly classified negative records and falsely classified positive records.
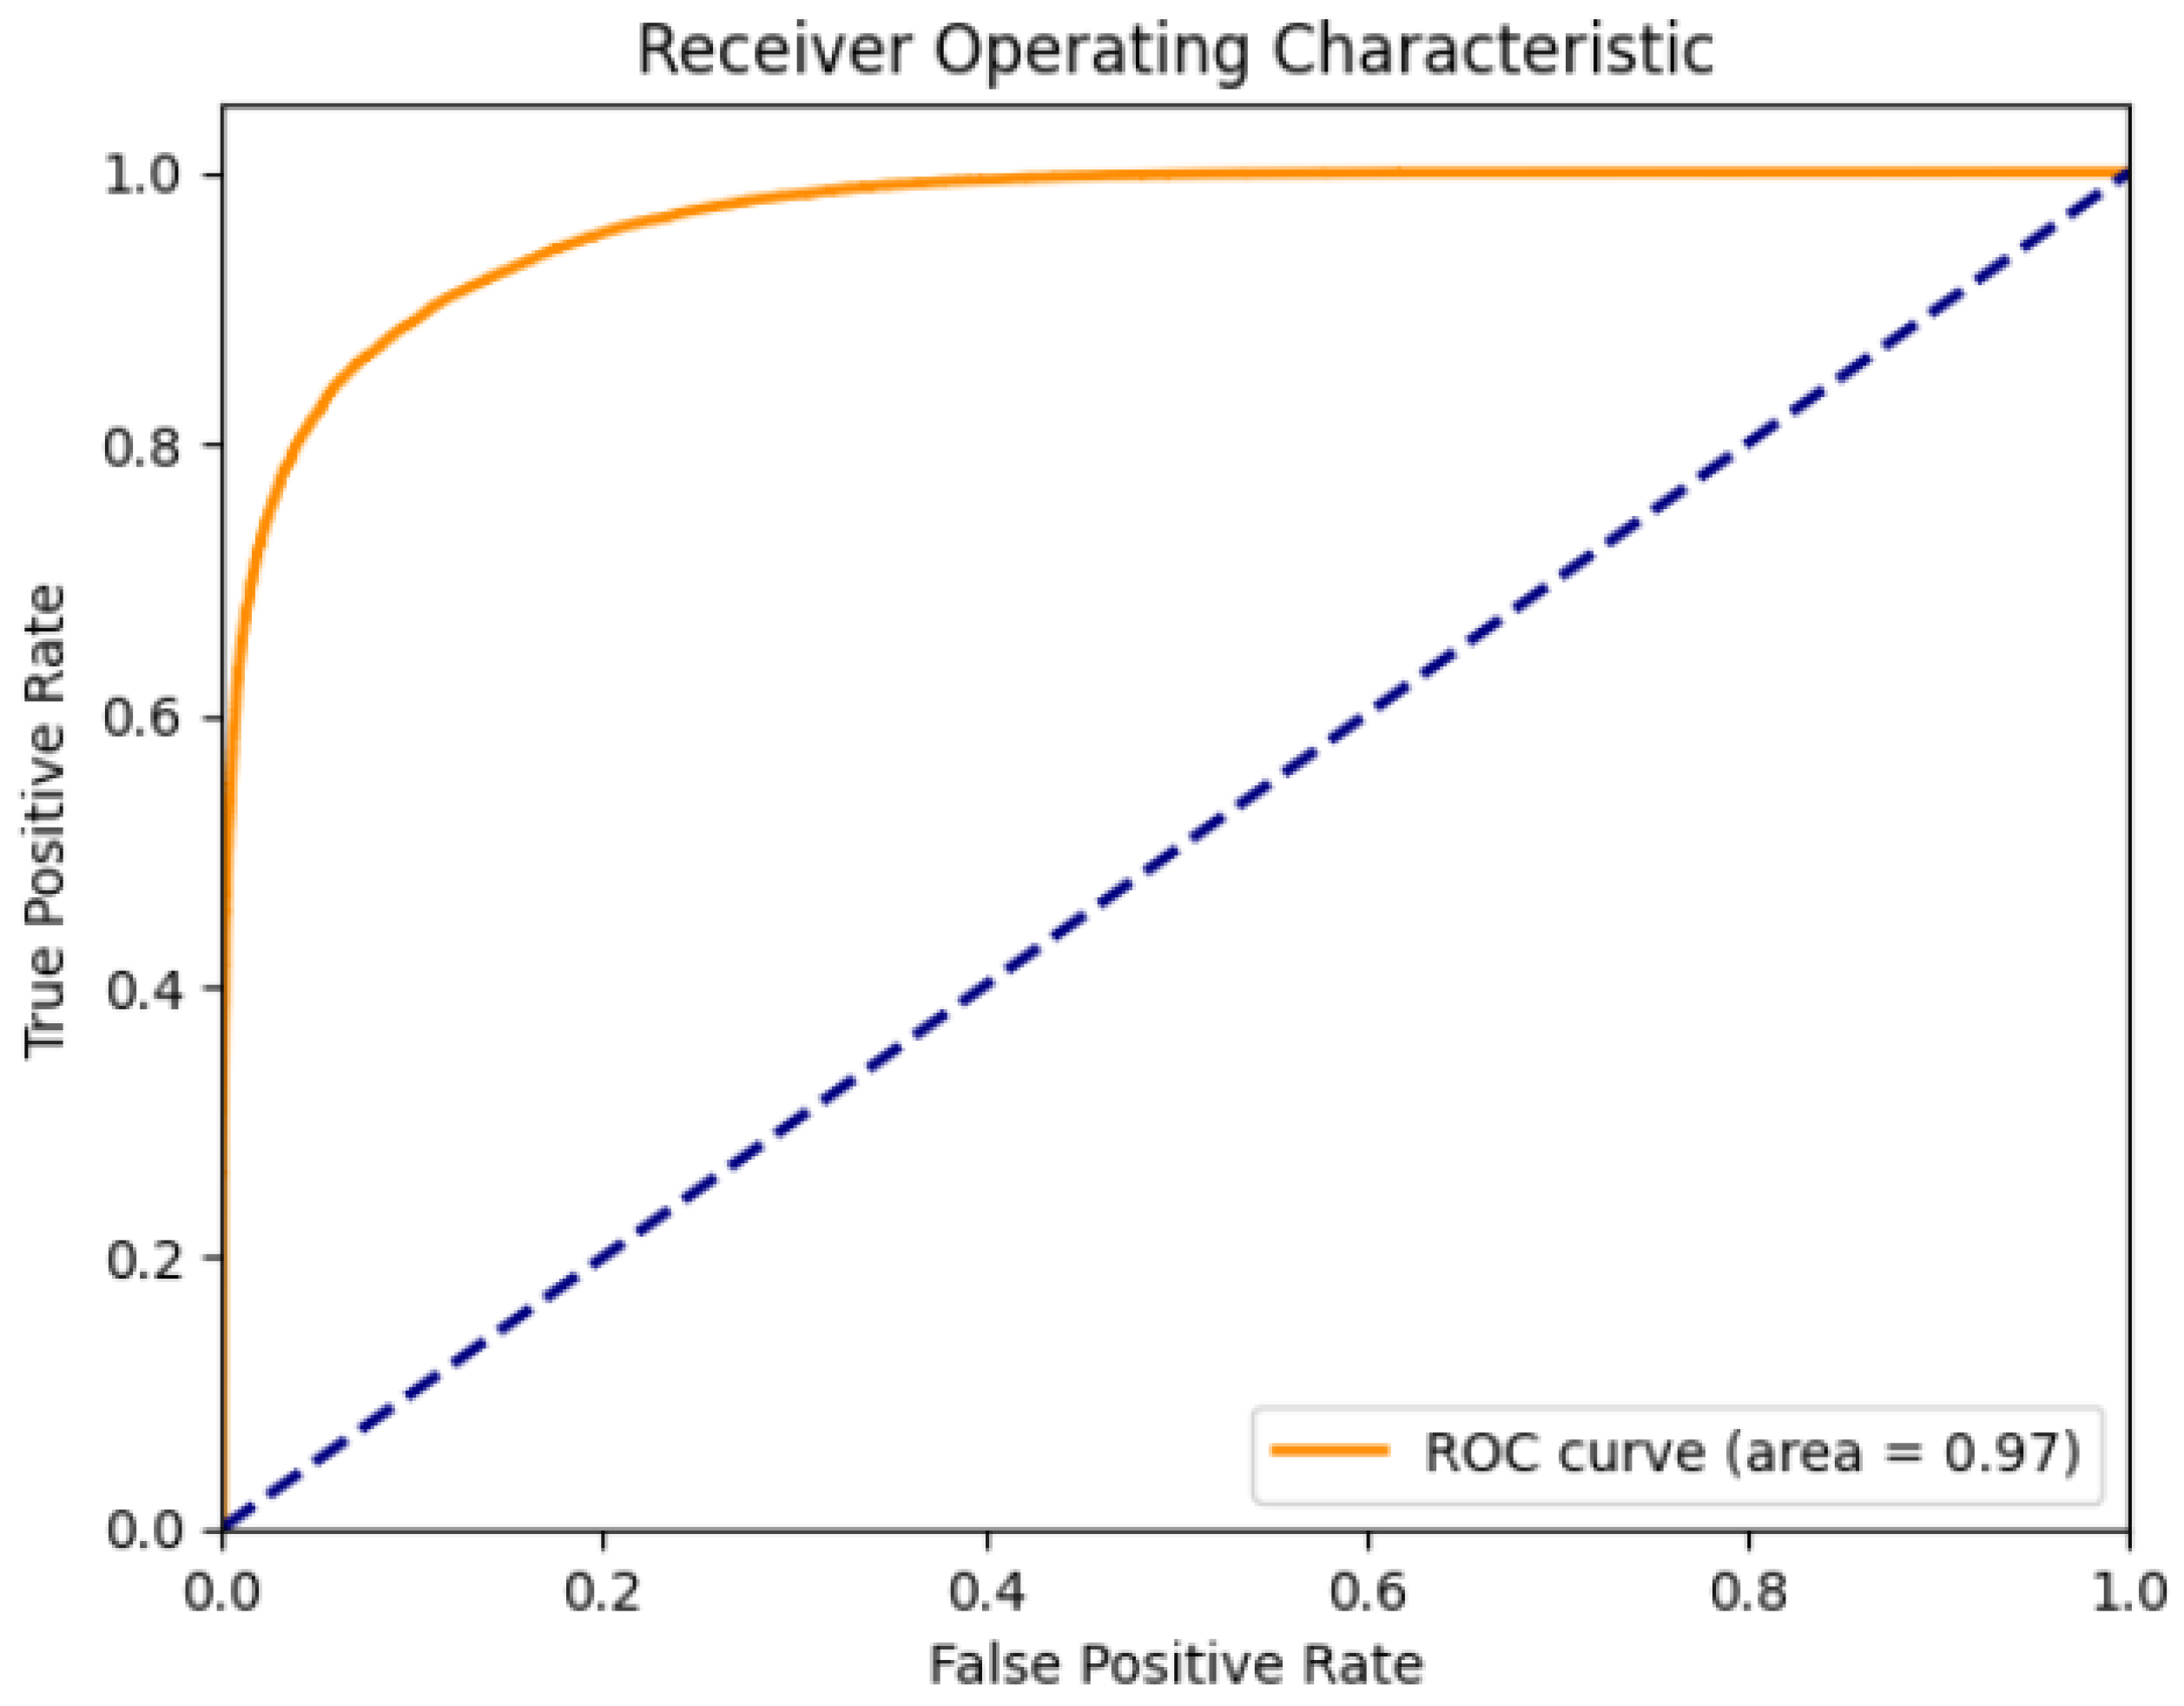
- 6.
- ROC and AUC curve: The ROC curve shows the ability of a model to classify the records using a graph. The AUC curve focuses on positive records that rank higher than negative records.
4. Results
5. Conclusions and Future Work
Author Contributions
Funding
Data Availability Statement
Conflicts of Interest
References
- Mo, J.; Ke, J.; Zhou, H.; Li, X. Hybrid network intrusion detection system based on sliding window and information entropy in imbalanced dataset. Appl. Intell. 2025, 55, 433. [Google Scholar] [CrossRef]
- Ren, H.; Tang, Y.; Dong, W.; Ren, S.; Jiang, L. DUEN: Dynamic ensemble handling class imbalance in network intrusion detection. Expert Syst. Appl. 2023, 229, 120420. [Google Scholar] [CrossRef]
- Louk, M.H.L.; Tama, B.A. Exploring ensemble-based class imbalance learners for intrusion detection in industrial control networks. Big Data Cogn. Comput. 2021, 5, 72. [Google Scholar] [CrossRef]
- Abdulganiyu, O.H.; Tchakoucht, T.A.; Saheed, Y.K.; Ahmed, H.A. XIDINTFL-VAE: XGBoost-based intrusion detection of imbalance network traffic via class-wise focal loss variational autoencoder. J. Supercomput. 2025, 81, 16. [Google Scholar] [CrossRef]
- Yang, Y.; Cheng, J.; Liu, Z.; Li, H.; Xu, G. A multi-classification detection model for imbalanced data in NIDS based on reconstruction and feature matching. J. Cloud Comput. 2024, 13, 31. [Google Scholar] [CrossRef]
- Balla, A.; Habaebi, M.H.; Elsheikh, E.A.A.; Islam, R.; Suliman, F.M. The Effect of Dataset Imbalance on the Performance of SCADA Intrusion Detection Systems. Sensors 2023, 23, 758. [Google Scholar] [CrossRef]
- Abdelkhalek, A.; Mashaly, M. Addressing the class imbalance problem in network intrusion detection systems using data resampling and deep learning. J. Supercomput. 2023, 79, 10611–10644. [Google Scholar] [CrossRef]
- Le, T.-T.; Shin, Y.; Kim, M.; Kim, H. Towards unbalanced multiclass intrusion detection with hybrid sampling methods and ensemble classification. Appl. Soft Comput. 2024, 157, 111517. [Google Scholar] [CrossRef]
- Turukmane, A.v.; Devendiran, R. M-MultiSVM: An efficient feature selection assisted network intrusion detection system using machine learning. Comput. Secur. 2024, 137, 103587. [Google Scholar] [CrossRef]
- Meliboev, A.; Alikhanov, J.; Kim, W. Performance Evaluation of Deep Learning Based Network Intrusion Detection System across Multiple Balanced and Imbalanced Datasets. Electronics 2022, 11, 515. [Google Scholar] [CrossRef]
- Rani, M. Gagandeep Effective network intrusion detection by addressing class imbalance with deep neural networks multimedia tools and applications. Multimed. Tools Appl. 2022, 81, 8499–8518. [Google Scholar] [CrossRef]
- Gu, H.; Lai, Y.; Wang, Y.; Liu, J.; Sun, M.; Mao, B. DEIDS: A novel intrusion detection system for industrial control systems. Neural Comput. Appl. 2022, 34, 9793–9811. [Google Scholar] [CrossRef]
- Bedi, P.; Gupta, N.; Jindal, V. I-SiamIDS: An improved Siam-IDS for handling class imbalance in network-based intrusion detection systems. Appl. Intell. 2021, 51, 1133–1151. [Google Scholar] [CrossRef]
- Bedi, P.; Gupta, N.; Jindal, V. Siam-IDS: Handling class imbalance problem in Intrusion Detection Systems using Siamese Neural Network. Procedia Comput. Sci. 2020, 171, 780–789. [Google Scholar] [CrossRef]
- Mulyanto, M.; Faisal, M.; Prakosa, S.W.; Leu, J.-S. Effectiveness of focal loss for minority classification in network intrusion detection systems. Symmetry 2021, 13, 4. [Google Scholar] [CrossRef]
- Hilal, A.M.; Al-Otaibi, S.; Mahgoub, H.; Al-Wesabi, F.N.; Aldehim, G.; Motwakel, A.; Rizwanullah, M.; Yaseen, I. Deep learning enabled class imbalance with sand piper optimization based intrusion detection for secure cyber physical systems. Clust. Comput. 2023, 26, 2085–2098. [Google Scholar] [CrossRef]
- Ding, H.; Chen, L.; Dong, L.; Fu, Z.; Cui, X. Imbalanced data classification: A KNN and generative adversarial networks-based hybrid approach for intrusion detection. Futur. Gener. Comput. Syst. 2022, 131, 240–254. [Google Scholar] [CrossRef]
- Yuan, L.; Yu, S.; Yang, Z.; Duan, M.; Li, K. A data balancing approach based on generative adversarial network. Futur. Gener. Comput. Syst. 2022, 141, 768–776. [Google Scholar] [CrossRef]
- Yang, H.; Xu, J.; Xiao, Y.; Hu, L. SPE-ACGAN: A Resampling Approach for Class Imbalance Problem in Network Intrusion Detection Systems. Electronics 2023, 12, 3323. [Google Scholar] [CrossRef]
- Korium, M.S.; Saber, M.; Beattie, A.; Narayanan, A.; Sahoo, S.; Nardelli, P.H. Intrusion detection system for cyberattacks in the Internet of Vehicles environment. Ad Hoc Netw. 2023, 153, 103330. [Google Scholar] [CrossRef]
- Zhang, H.; Huang, L.; Wu, C.Q.; Li, Z. An effective convolutional neural network based on SMOTE and Gaussian mixture model for intrusion detection in imbalanced dataset. Comput. Netw. 2020, 177, 107315. [Google Scholar] [CrossRef]
- Toralkar, P.; Mainalli, K.; Allagi, S.; Debnath, S.K.; Bagchi, S.; Leong, W.Y.; Khan, M.N.A. Enhanced Intrusion Detection with Advanced Deep Features and Ensemble Classifier Techniques. SN Comput. Sci. 2025, 6, 381. [Google Scholar] [CrossRef]
- Allagi, S.; Pawan, T.; Mainalli, K.; Dharwadkar, N. Leveraging AI and ML for Predictive Analysis and Feature Attribution in Abnormal Network Behavior Detection. In Proceedings of the 2024 2nd World Conference on Communication and Computing, Raipur, India, 12–14 July 2024. [Google Scholar] [CrossRef]
- Widodo, A.O.; Setiawan, B.; Indraswari, R. Machine Learning-Based Intrusion Detection on Multi-Class Imbalanced Dataset Using SMOTE. Procedia Comput. Sci. 2024, 234, 578–583. [Google Scholar] [CrossRef]
- Albasheer, F.O.; Haibatti, R.R.; Agarwal, M.; Nam, S.Y. A Novel IDS Based on Jaya Optimizer and Smote-ENN for Cyberattacks Detection. IEEE Access 2024, 12, 101506–101527. [Google Scholar] [CrossRef]
- Eid, A.M.; Soudan, B.; Nassif, A.B.; Injadat, M. Enhancing intrusion detection in IIoT: Optimized CNN model with multi-class SMOTE balancing. Neural Comput. Appl. 2024, 36, 14643–14659. [Google Scholar] [CrossRef]
- Talukder, A.; Sharmin, S.; Uddin, A.; Islam, M.; Aryal, S. MLSTL-WSN: Machine learning-based intrusion detection using SMOTETomek in WSNs. Int. J. Inf. Secur. 2024, 23, 2139–2158. [Google Scholar] [CrossRef]
- Osa, E.; Orukpe, P.E.; Iruansi, U. Design and implementation of a deep neural network approach for intrusion detection systems. e-Prime—Adv. Electr. Eng. Electronics Energy 2024, 7, 100434. [Google Scholar] [CrossRef]
- Pramanick, N.; Srivastava, S.; Mathew, J.; Agarwal, M. Enhanced IDS Using BBA and SMOTE-ENN for Imbalanced Data for Cybersecurity. SN Comput. Sci. 2024, 5, 875. [Google Scholar] [CrossRef]
- Eid, A.M.; Soudan, B.; Nassif, A.B.; Injadat, M. Comparative study of ML models for IIoT intrusion detection: Impact of data preprocessing and balancing. Neural Comput. Appl. 2024, 36, 6955–6972. [Google Scholar] [CrossRef]
- Kumari, T.A.; Mishra, S. Tachyon: Enhancing stacked models using Bayesian optimization for intrusion detection using different sampling approaches. Egypt. Informatics J. 2024, 27, 100520. [Google Scholar] [CrossRef]
- Thiyam, B.; Dey, S. CIIR: An approach to handle class imbalance using a novel feature selection technique. Knowl. Inf. Syst. 2024, 66, 5355–5388. [Google Scholar] [CrossRef]
- Srinivasan, M.; Senthilkumar, N.C. Class imbalance data handling with optimal deep learning-based intrusion detection in IoT environment. Soft Comput. 2024, 28, 4519–4529. [Google Scholar] [CrossRef]
- Wang, S.; Xu, W.; Liu, Y. Res-TranBiLSTM: An intelligent approach for intrusion detection in the Internet of Things. Comput. Networks 2023, 235, 109982. [Google Scholar] [CrossRef]
- Balaji, S.; Narayanan, S.S. Dynamic distributed generative adversarial network for intrusion detection system over internet of things. Wirel. Netw. 2023, 29, 1949–1967. [Google Scholar] [CrossRef]
- Damtew, Y.G.; Chen, H. SMMO-CoFS: Synthetic Multi-minority Oversampling with Collaborative Feature Selection for Network Intrusion Detection System. Int. J. Comput. Intell. Syst. 2023, 16, 12. [Google Scholar] [CrossRef]
- Soliman, S.; Oudah, W.; Aljuhani, A. Deep learning-based intrusion detection approach for securing industrial Internet of Things. Alex. Eng. J. 2023, 81, 371–383. [Google Scholar] [CrossRef]
- Elnakib, O.; Shaaban, E.; Mahmoud, M.; Emara, K. EIDM: Deep learning model for IoT intrusion detection systems. J. Supercomput. 2023, 79, 13241–13261. [Google Scholar] [CrossRef]
- Wang, H.; Singhal, A.; Liu, P. Tackling imbalanced data in cybersecurity with transfer learning: A case with ROP payload detection. Cybersecurity 2023, 6, 2. [Google Scholar] [CrossRef]
- Bacevicius, M.; Paulauskaite-Taraseviciene, A. Machine Learning Algorithms for Raw and Unbalanced Intrusion Detection Data in a Multi-Class Classification Problem. Appl. Sci. 2023, 13, 7328. [Google Scholar] [CrossRef]
- Wu, T.; Fan, H.; Zhu, H.; You, C.; Zhou, H.; Huang, X. Intrusion detection system combined enhanced random forest with SMOTE algorithm. EURASIP J. Adv. Signal Process. 2022, 2022, 39. [Google Scholar] [CrossRef]
- Gan, B.; Chen, Y.; Dong, Q.; Guo, J.; Wang, R. A convolutional neural network intrusion detection method based on data imbalance. J. Supercomput. 2022, 78, 19401–19434. [Google Scholar] [CrossRef]
- Arafah, M.; Phillips, I.; Adnane, A.; Hadi, W.; Alauthman, M.; Al-Banna, A.-K. Anomaly-based network intrusion detection using denoising autoencoder and Wasserstein GAN synthetic attacks. Appl. Soft Comput. 2024, 168, 112455. [Google Scholar] [CrossRef]
- Long, H.; Li, H.; Tang, Z.; Zhu, M.; Yan, H.; Luo, L.; Yang, C.; Chen, Y.; Zhang, J. BOA-ACRF: An intrusion detection method for data imbalance problems. Comput. Electr. Eng. 2025, 124, 110320. [Google Scholar] [CrossRef]
- Yao, Q.; Zhao, X. An intrusion detection imbalanced data classification algorithm based on CWGAN-GP oversampling. Peer-to-Peer Netw. Appl. 2025, 18, 121. [Google Scholar] [CrossRef]
- Zeghida, H.; Boulaiche, M.; Chikh, R.; Bamhdi, A.M.; Barros, A.L.B.; Zeghida, D.; Patel, A. Enhancing IoT cyber attacks intrusion detection through GAN-based data augmentation and hybrid deep learning models for MQTT network protocol cyber attacks. Clust. Comput. 2025, 28, 58. [Google Scholar] [CrossRef]
- Feng, S.; Gao, L.; Shi, L. CGFL: A Robust Federated Learning Approach for Intrusion Detection Systems Based on Data Generation. Appl. Sci. 2025, 15, 2416. [Google Scholar] [CrossRef]
- Leong, W.Y.; Leong, Y.Z.; Leong, W.S. Advances in AI for Fraud Detection. In Proceedings of the 2024 IET International Conference on Engineering Technologies and Applications (ICETA), Taipei, Taiwan, 24–25 October 2024. [Google Scholar]


| S. No. | Author Details | Methodology | Dataset | Algorithms | Accuracy In % |
|---|---|---|---|---|---|
| 1 | Thi-Thu-Huong Le et al. [8] | ensemble classification using hybrid sampling | CHAD2020 and IoTID20 | SMOTE, Borderline SMOTETomek Links, Edited Nearest Neighbors, CatBoost, LightGBM, XGBoost | BorderlineSMOTETomek + XGBoost achieved 98% accuracy |
| 2 | Anil V Turukmane et al. [9] | M-MultiSVM | CSE-CIC-IDS 2018 and UNSW-NB15 datasets. | M-SvD and ONgO, ASmoT | 99.89% |
| 3 | Mohamed SelimKorium et al. [20] | Use of SMOTE and SMOTE-ENN to balance dataset | CIC-IDS-2017, CSE-CIC-IDS-2018, and CIC-DDoS-2019 | Hyperopt, regression model, SMOTE, SMOTE-ENN, RF, Categorical Boosting, Extreme Gradient Boosting, LGB Machine | Random Forest with 99.80% |
| 4 | AkdeasOktanaeWidodo et al. [24] | log normalization with SMOTE and RFE | NSL_KDD and CIC-IDS2017 | RFE, SMOTE, RF and XGBoost | RF and XGBoost achieved 99.56% and 99.64%, respectively. |
| 5 | F. Omer Albasheer et al. [25] | jaya optimization with SMOTE-ENN | UNSW_NB15 and NSL_KDD | Decision Tree (DT), RF, Bagging, J48, and extra tree classifiers | extra tree classifier achieved 99.13% on UNSW_NB15 and 99.94% on NSL_KDD |
| 6 | Eid A M et al. [26] | SMOTE and systematic optimization-CNN | IIoT-specific WUSTL-IIOT-2021 and UNSW_NB15 | SMOTE, CNN | 99.9% |
| 7 | Talukder et al. [27] | SMOTE-TomekLink to balance dataset | WSN-DS | Decision Trees (DT), Random Forests (RF), Multilayer Perception (MLP), K-Nearest Neighbor (KNN), Extreme boosting (XGB), and Light gradient boosting (LGB) | Random Forest achieves accuracy of 99.78% for binary and 99.92% for multiclass |
| 8 | EdosaOsa et al. [28] | Deep neural networks for intrusion detection | CICIDS 2017 | Deep neural networks, SMOTE and Random Sampling | 99.68% |
| 9 | Pramanick et al. [29] | binary bat algorithm for feature selection and use of SMOTE-ENN for balancing | UNSW_NB15 and NSL_KDD | XGBoost, KNN, random forest, and LightGBM | Random Forest achieved an accuracy of 99.7% on NSL_KDD and 97.3% on UNSW_NB, thus outperforming the other classifier |
| 10 | Eid et al. [30] | Five different techniques to balance dataset | WUSTL-IIOT-2021 | Random under-sampling, random over-sampling, SMOTE, bagging and pasting, RF, DT, KNN, SVM, LR, NB | Random under-sampling, SMOTE and bagging and pasting achieved an accuracy of 99.67%. DT and RF achieved the highest accuracy of 99.98% compared to the other algorithm using SMOTE |
| 11 | Shiyu Wang et al. [34] | temporal and spatial feature extraction | NSL_KDD, MQTTset and CIC-IDS2017 | Res-TranBiLSTM, SMOTE | 99.56%, 99.15% and 90.99% on MQTTset, CIC-IDS2017, NSL_KDD dataset |
| 12 | Balaji et al. [35] | Dynamic Distributed Generative Adversarial Network | HAR | SMOTE, Modified Principal Component Analysis, IFL, Hybrid DL based CNN, Adaptive Neuro-Fuzzy Inference System | 94% |
| 13 | Sahar Soliman et al. [37] | Machine learning and deep learning classifier for intrusion detection | ToN_IoT | SMOTE, SVD, LSTM, Bi-LSTM, Bagging, Decision Tree, KNN | 99% |
| 14 | Omar Elnakib et al. [38] | EIDM for intrusion detection | CICIDS2017 | EIDM | 95% |
| 15 | Tao Wu et al. [41] | K-means with SMOTE to balance dataset | NSL_KDD | K-means, SMOTE and Enhanced Random Forest | 78.47% |
| 16 | Gan et al. [42] | CNN based Intrusion detection | NSL_KDD | SMOTE, CNN, log loss and gradient coordination mechanism | Accuracies of 98.73% and 94.55% were obtained for binary and multiclass classification |
| S. No. | Author Details | Methodology | Dataset | Algorithms | Accuracy In % |
|---|---|---|---|---|---|
| 1 | Assad Balla et al. [6] | SCADA System | morris power and CICIDS2017 | ADASYN, SMOTE random sampling, near miss, and OSS, CNN-LSTM | 99% |
| 2 | T. Anitha Kumari et al. [31] | Exploring Sampling Techniques | IoTID2020 | SMOTE, ROSE, b-SMOTE and ADASYN | 99.8% |
| 3 | Thiyam et al. [32] | Causal Inference Imbalanced Ratio | CIC-DDoS2019, UNSW-NB15, ML-EdgeIIoT and WUSTL-IIoT2021. | ADASYN-IHT and Boruta-ROC | 99% |
| S. No. | Author Details | Methodology | Dataset | Algorithms | Accuracy In % |
|---|---|---|---|---|---|
| 1 | Jingrong Mo et al. [1] | ENS_CLSTM | NSL-KDD,CICIDS, UNSW-NB15 and ISCX-IDS2012 | CNN, Bi-LSTM, DNN | 99.99% |
| 2 | Oluwadamilare Harazeem Abdulganiyu et al. [4] | XIDINTFL-VAE | NSL-KDD and CSE-CIC-IDS2018 | CWFL, VAE, XGBoost | 99.79% |
| 3 | Yue Yang et al. [5] | Reconstruction and feature matching using deep learning | CICIDS2017 | Autoencoder, CNN-LSTM, Adaptive Scaling, Deep autoencoder | 99.81% |
| 4 | Ahmed Abdelkhalek et al. [7] | AYATL for intrusion detection | NSL-KDD | Adaptive Synthetic, Tomek Links, MLP, CNN, DNN, CNN-BLSTM | 99.98% |
| 5 | Damtew et al. [36] | SMMO for data balancing | NSL_KDD | J48, BayesNet, random forest and AdaBoostM1 | 99.84% |
| 6 | Haizhou Wang et al. [39] | ROP | ASL-guided dataset | RNN, Hierarchical RNN | 98.99% |
| 7 | Mohammad Arafah et al. [43] | AE-WGAN | NSL-KDD and CICIDS-2017 | denoising autoencoder and Wasserstein generative adversarial network | 99.99%. |
| 8 | Hancheng Long et al. [44] | BOA-ACRF | CIC-IDS-2017, CIC-UNSW-NB15 and NSL-KDD | ACGAN, BOA, RF | 99% |
| 9 | Qinglei Yao et al. [45] | CWGAN-GP | NSL-KDD and UNSW-NB15 | CWGAN-GP | 99% |
| 10 | Hayette Zeghida et al. [46] | GAN based argumentation technique | MQTT | CNN RNN, CNN-LSTM, and CNN-GRU | 99.99% |
| 11 | Shu Feng et al. [47] | CGFL | CIC-IDS2017, NSL-KDD, and CSE-CIC-IDS2018 | CGFL, ResNet20, EfficientNet-B0 | 96.89% on NSL-KDD, 92.19% on CIC-IDS2017 and 89.08% on CSE-CIC-IDS2018 |
| S. No. | Author (s) | Metrics Used | Strength | Weakness |
|---|---|---|---|---|
| 1 | Jingrong Mo et al. [1] | Accuracy, Precision, Recall, F1-score | Achieved highest accuracy (99.99%) using ENS_CLSTM | Complex architecture with high resource demand |
| 2 | Oluwadamilare Harazeem Abdulganiyu et al. [4] | AUC, F1-score, Accuracy | Strong results with VAE and XGBoost hybrid | Methodology complexity may hinder real-time applicability |
| 3 | Yue Yang et al. [5] | F1-score, Accuracy | Deep learning with adaptive scaling and reconstruction | May be prone to overfitting due to deep autoencoder |
| 4 | Assad Balla et al. [6] | Accuracy | Deep learning (CNN-LSTM) with ADASYN on SCADA datasets | Dataset-specific results may not generalize well |
| 5 | Ahmed Abdelkhalek et al. [7] | Precision, Recall | High accuracy with adaptive synthetic methods and hybrid DL models | Overhead due to multiple complex methods used together |
| 6 | Thi-Thu-Huong Le et. al. [8] | F1-score, AUC | Hybrid sampling improved ensemble classifier performance | Lower accuracy (98%) compared to others |
| 7 | Anil V Turukmane et al. [9] | Accuracy, TPR | Novel SVM approach with high accuracy | Method details (ASmoT, ONgO) not fully explained |
| 8 | Mohamed Selim Korium et al. [20] | Precision, Recall | Multiple dataset validation, strong RF performance | Complexity due to many algorithms and hybrid techniques |
| 9 | Akdeas Oktanae Widodo et al. [24] | Precision, Recall, F1-score | High accuracy using RF and XGBoost with SMOTE + RFE | Limited to NSL_KDD and CIC-IDS2017 datasets |
| 10 | F. Omer Albasheer et al. [25] | Accuracy, Detection Rate | Excellent results with Extra Tree on NSL_KDD and UNSW_NB15 using Jaya-SMOTE-ENN | Model showed generalizability to real-world data untested |
| 11 | Eid A Met et al. [26] | Accuracy, F1-score | CNN with SMOTE yielded high accuracy on IIoT dataset | CNN performance can be dataset-sensitive and computationally heavy |
| 12 | Talukder et al. [27] | Accuracy, Recall | Achieved high accuracy in both binary and multiclass using SMOTE-Tomek | Computational cost increases with multiple classifiers |
| 13 | Edosa Osa et al. [28] | Accuracy, F1-score | High performance of DNN with SMOTE | Lacks interpretability of deep learning models |
| 14 | Pramanick et al. [29] | Accuracy, F1, DR | Robust feature selection and balance using SMOTE-ENN | Performance on UNSW_NB15 (97.3%) worse than other methods |
| 15 | Eid et al. [30] | Accuracy, Precision, Recall | Comprehensive comparison across balancing methods and classifiers | Dataset-specific optimization may not generalize |
| 16 | T. Anitha Kumari et al. [31] | AUC, Accuracy | Compared multiple techniques including ADASYN; very high accuracy | No insight on computational cost or practical deployment |
| 17 | Thiyam et al. [32] | Accuracy, Recall | ADASYN-IHT and Boruta-ROC offer 99% accuracy on diverse datasets | Techniques not explained in depth |
| 18 | Shiyu Wang et al. [34] | Accuracy, Precision | Used advanced Res-Trans-BiLSTM for temporal–spatial feature extraction | Lower performance (90.99%) on NSL_KDD compared to other datasets |
| 19 | Balaji et al. [35] | Accuracy, F1-score | Combination of GAN and hybrid DL methods | Comparatively lower accuracy (94%) |
| 20 | Damtew et al. [36] | F1-score, AUC | SMMO shows robust accuracy with various classifiers | Less known method, limited comparative validation |
| 21 | Sahar Soliman et al. [37] | Accuracy, Recall | Multiple ML and DL classifiers tested | Lack of method-specific performance insights |
| 22 | Omar Elnakib et al. [38] | Accuracy, F1-score | Novel EIDM technique | Accuracy (95%) is moderate compared to top performers |
| 23 | Haizhou Wang et al. [39] | AUC, Accuracy | Hierarchical RNN on ASL-guided dataset | Dataset is unique, limits generalizability |
| 24 | Tao Wu et al. [41] | Accuracy, DR | K-means + SMOTE with enhanced RF | Low accuracy (78.47%) |
| 25 | Gan et al. [42] | Accuracy, Precision | Good performance using CNN and gradient coordination mechanism | Less effective in multiclass setting (94.55%) |
| Attributes Names | Data Types |
|---|---|
| duration, srv_count, src_bytes, count,dst_bytes, is_guest_login, land, is_host_login, wrong_fragment, urgent, hot, num_failed_logins,num_file_creations, logged_in, num_compromised,num_shells, root_shell, su_attempted, num_root, num_access_files, dst_host_count, num_outbound_cmds, dst_host_srv_count, level | Integer |
| serror_rate,diff_srv_rate, srv_serror_rate, same_srv_rate, rerror_rate, srv_rerror_rate, srv_diff_host_rate | Float |
| service, protocol_type, flag, outcome | Objects |
| Attributes Names | Data Types |
|---|---|
| Spkts, dwin, dpkts, sbytes, dbytes, sloss, ct_src_dport_ltm, dloss, swin, stcpb, ct_flw_http_mthd, dtcpb, smean, ct_ftp_cmd, dmean, trans_depth, response_body_len, ct_dst_sport_ltm, is_ftp_login, is_sm_ips_ports and label | Integer |
| Dur, rate, synack, sload, dinpkt, dload, sinpkt, sjit, djit, tcprtt, and ackdat | Float |
| Proto, state, service, and attack_cat | Objects |
| Step | NSL-KDD | UNSW-NB15 | Reason for Difference |
|---|---|---|---|
| Outlier Handling | IQR method | IQR + Max value clipping | UNSW-NB15 has more numeric features with extreme values that require clipping. |
| Feature Encoding | Label Encoding | One-Hot + Label Encoding | UNSW-NB15 has mixed categorical types; NSL-KDD has fewer and simpler categorical features. |
| Feature Selection | Not applied | Drop redundant and highly correlated features | UNSW-NB15 has more features; selection reduces noise and improves training efficiency. |
| Binary Columns | Converted after normalization | Constrained to valid binary values | UNSW-NB15 binary fields contain unexpected or inconsistent values needing correction. |
| Normalization | StandardScaler | StandardScaler | Common step to standardize input for CNN model. |
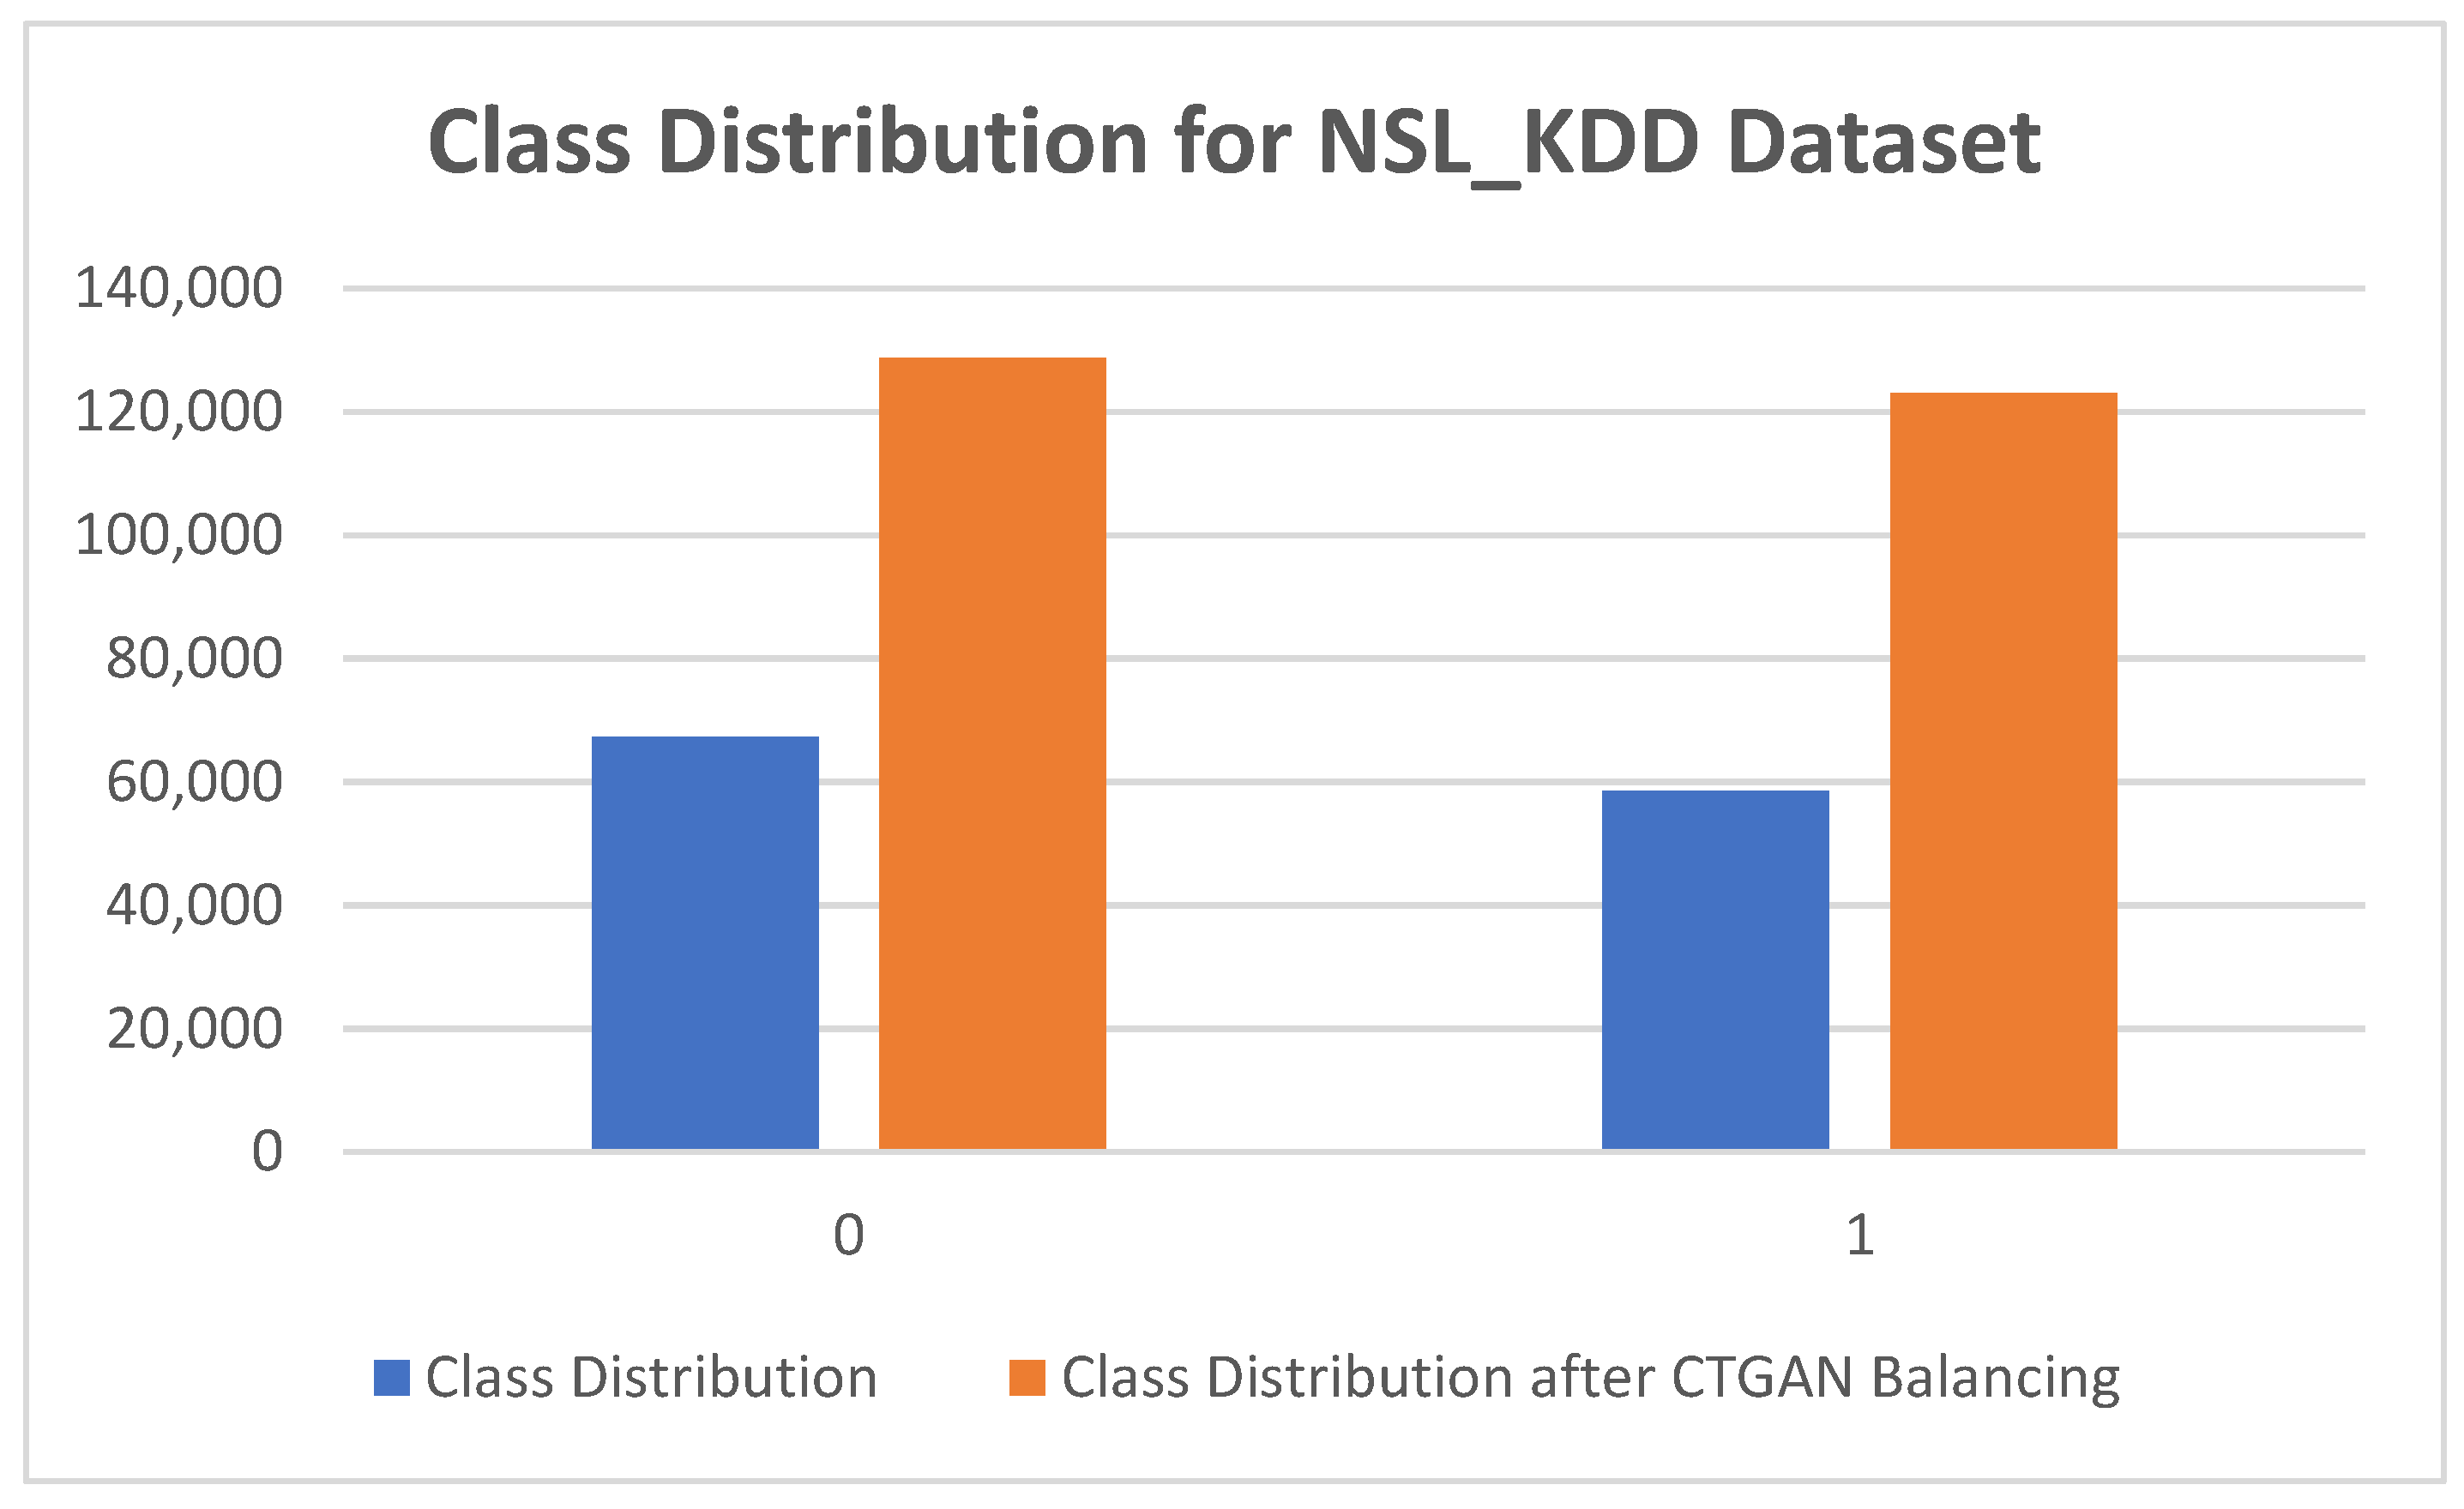
| Class Distribution | Class Distribution After CTGAN Balancing | |
|---|---|---|
| 0 | 67,342 | 128,825 |
| 1 | 58,630 | 123,119 |
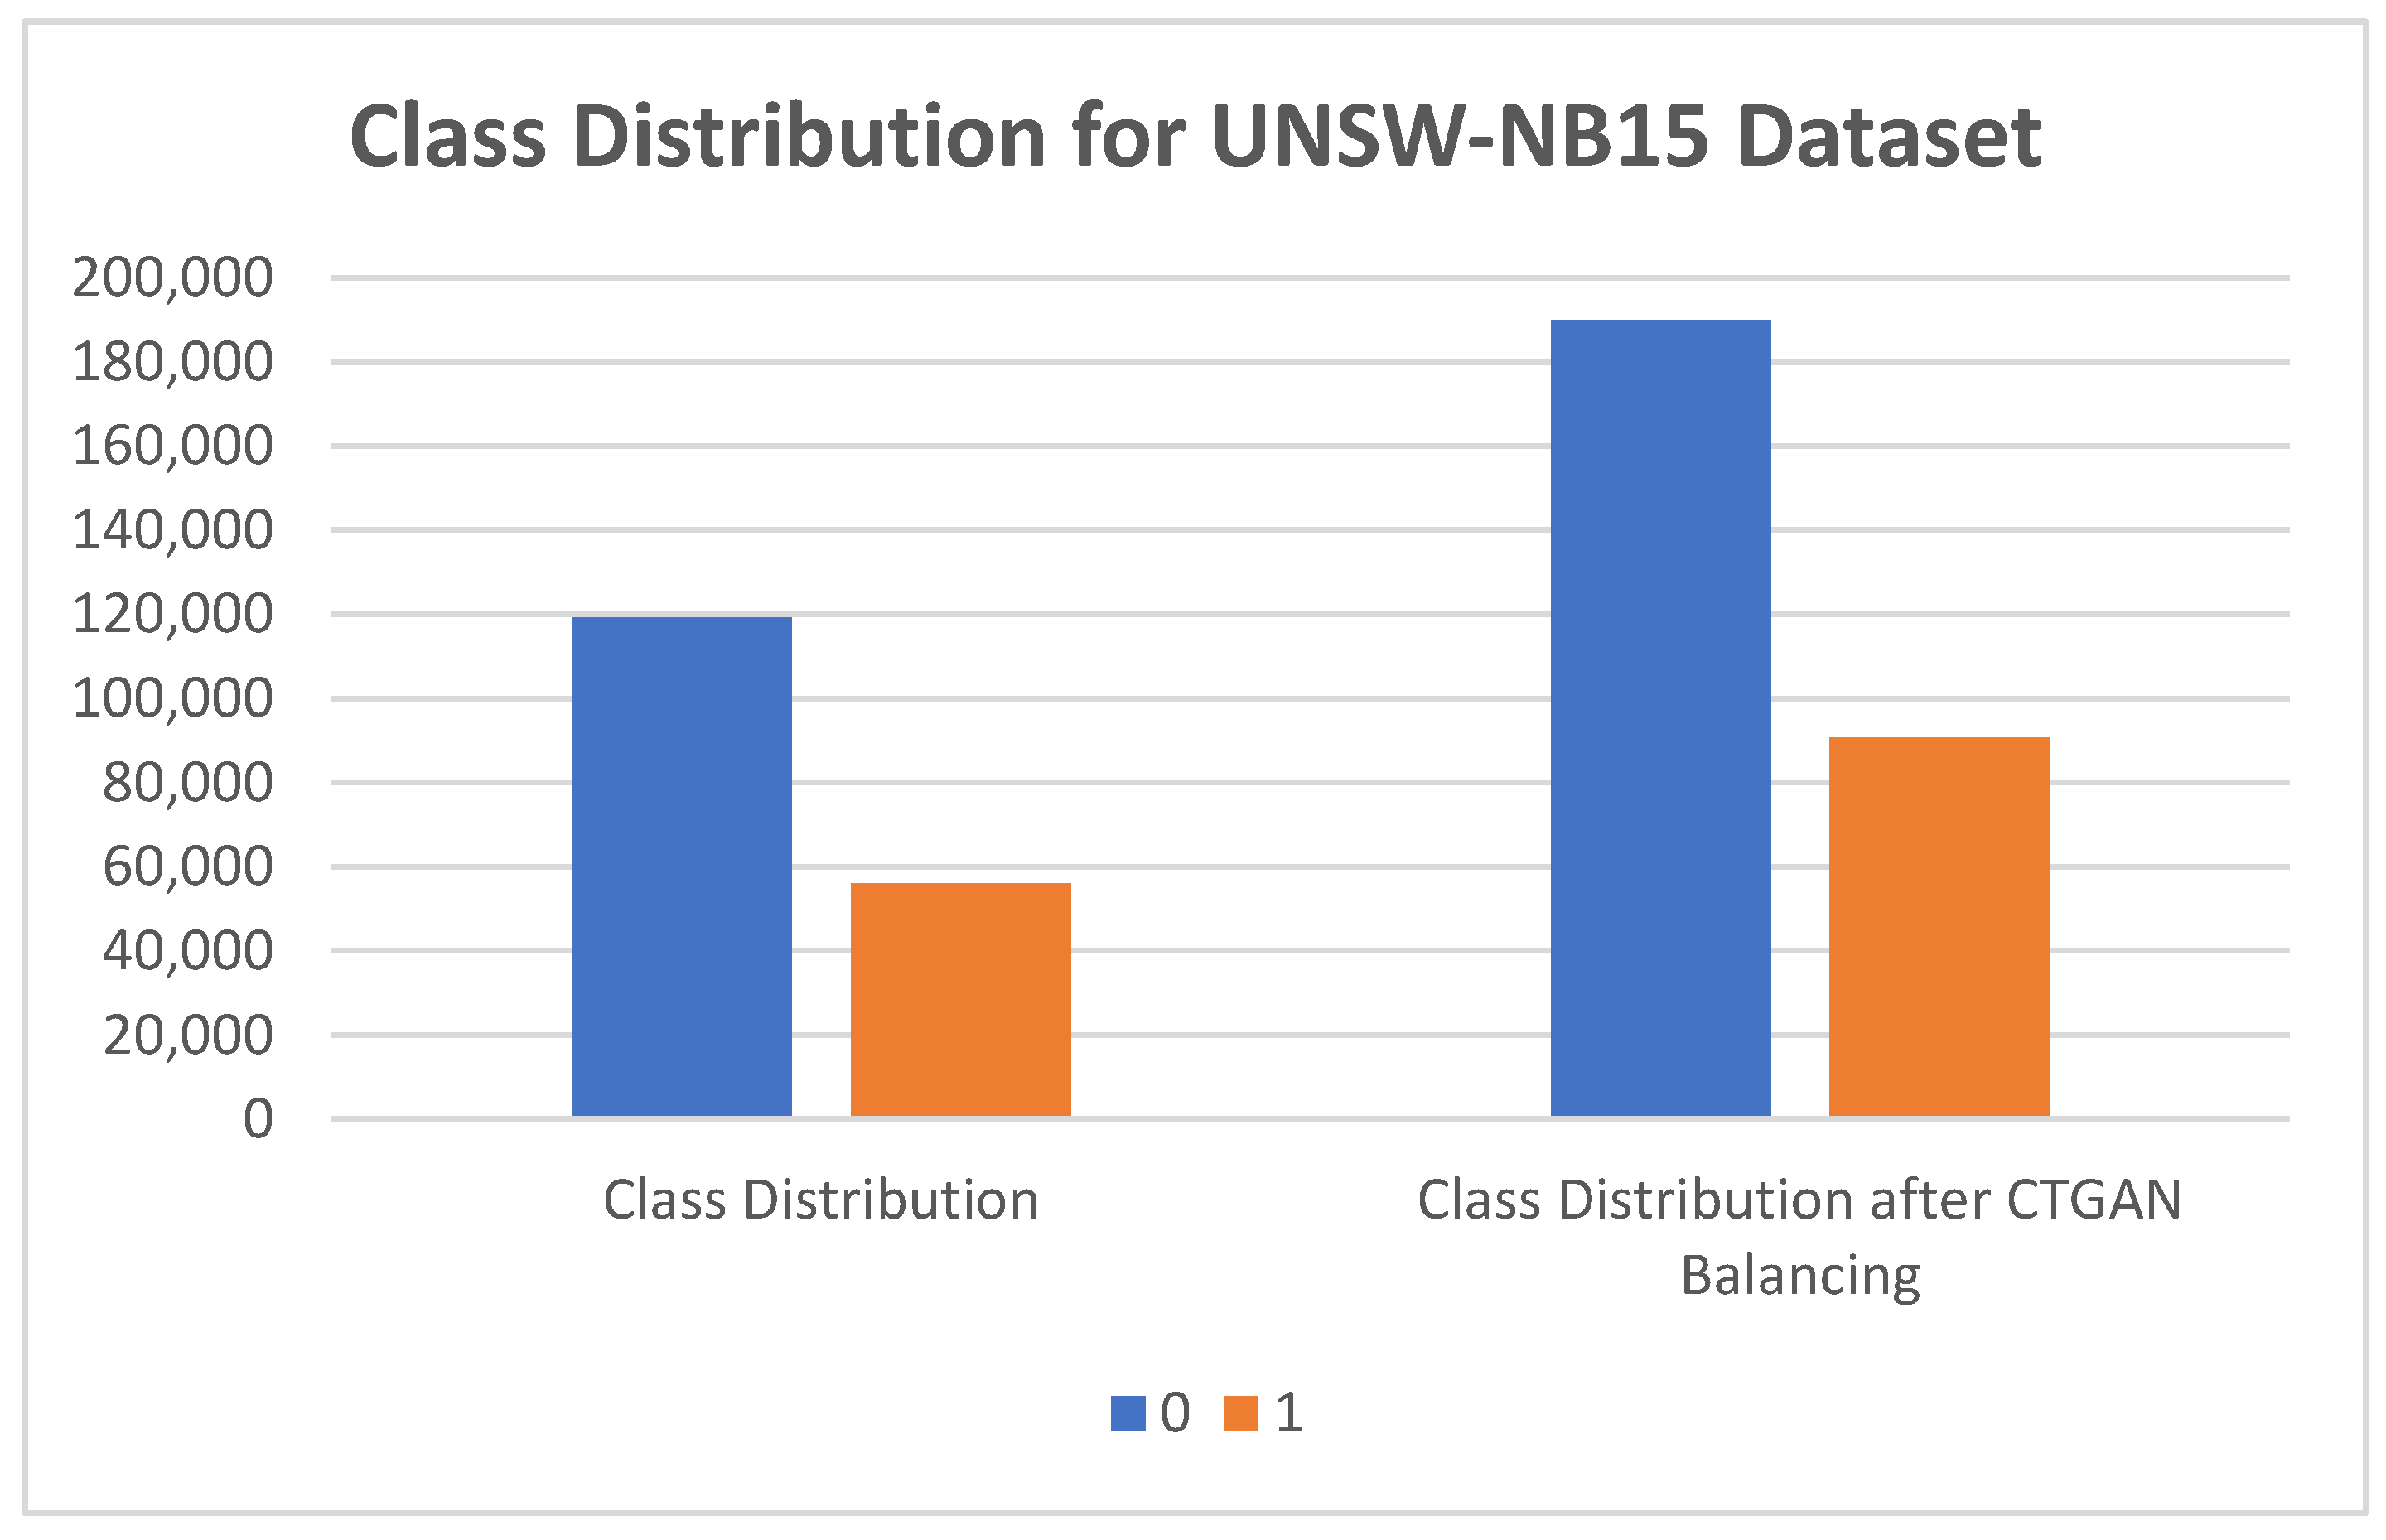
| Class Distribution | Class Distribution After CTGAN Balancing | |
|---|---|---|
| 0 | 119,341 | 189,842 |
| 1 | 56,000 | 90,702 |
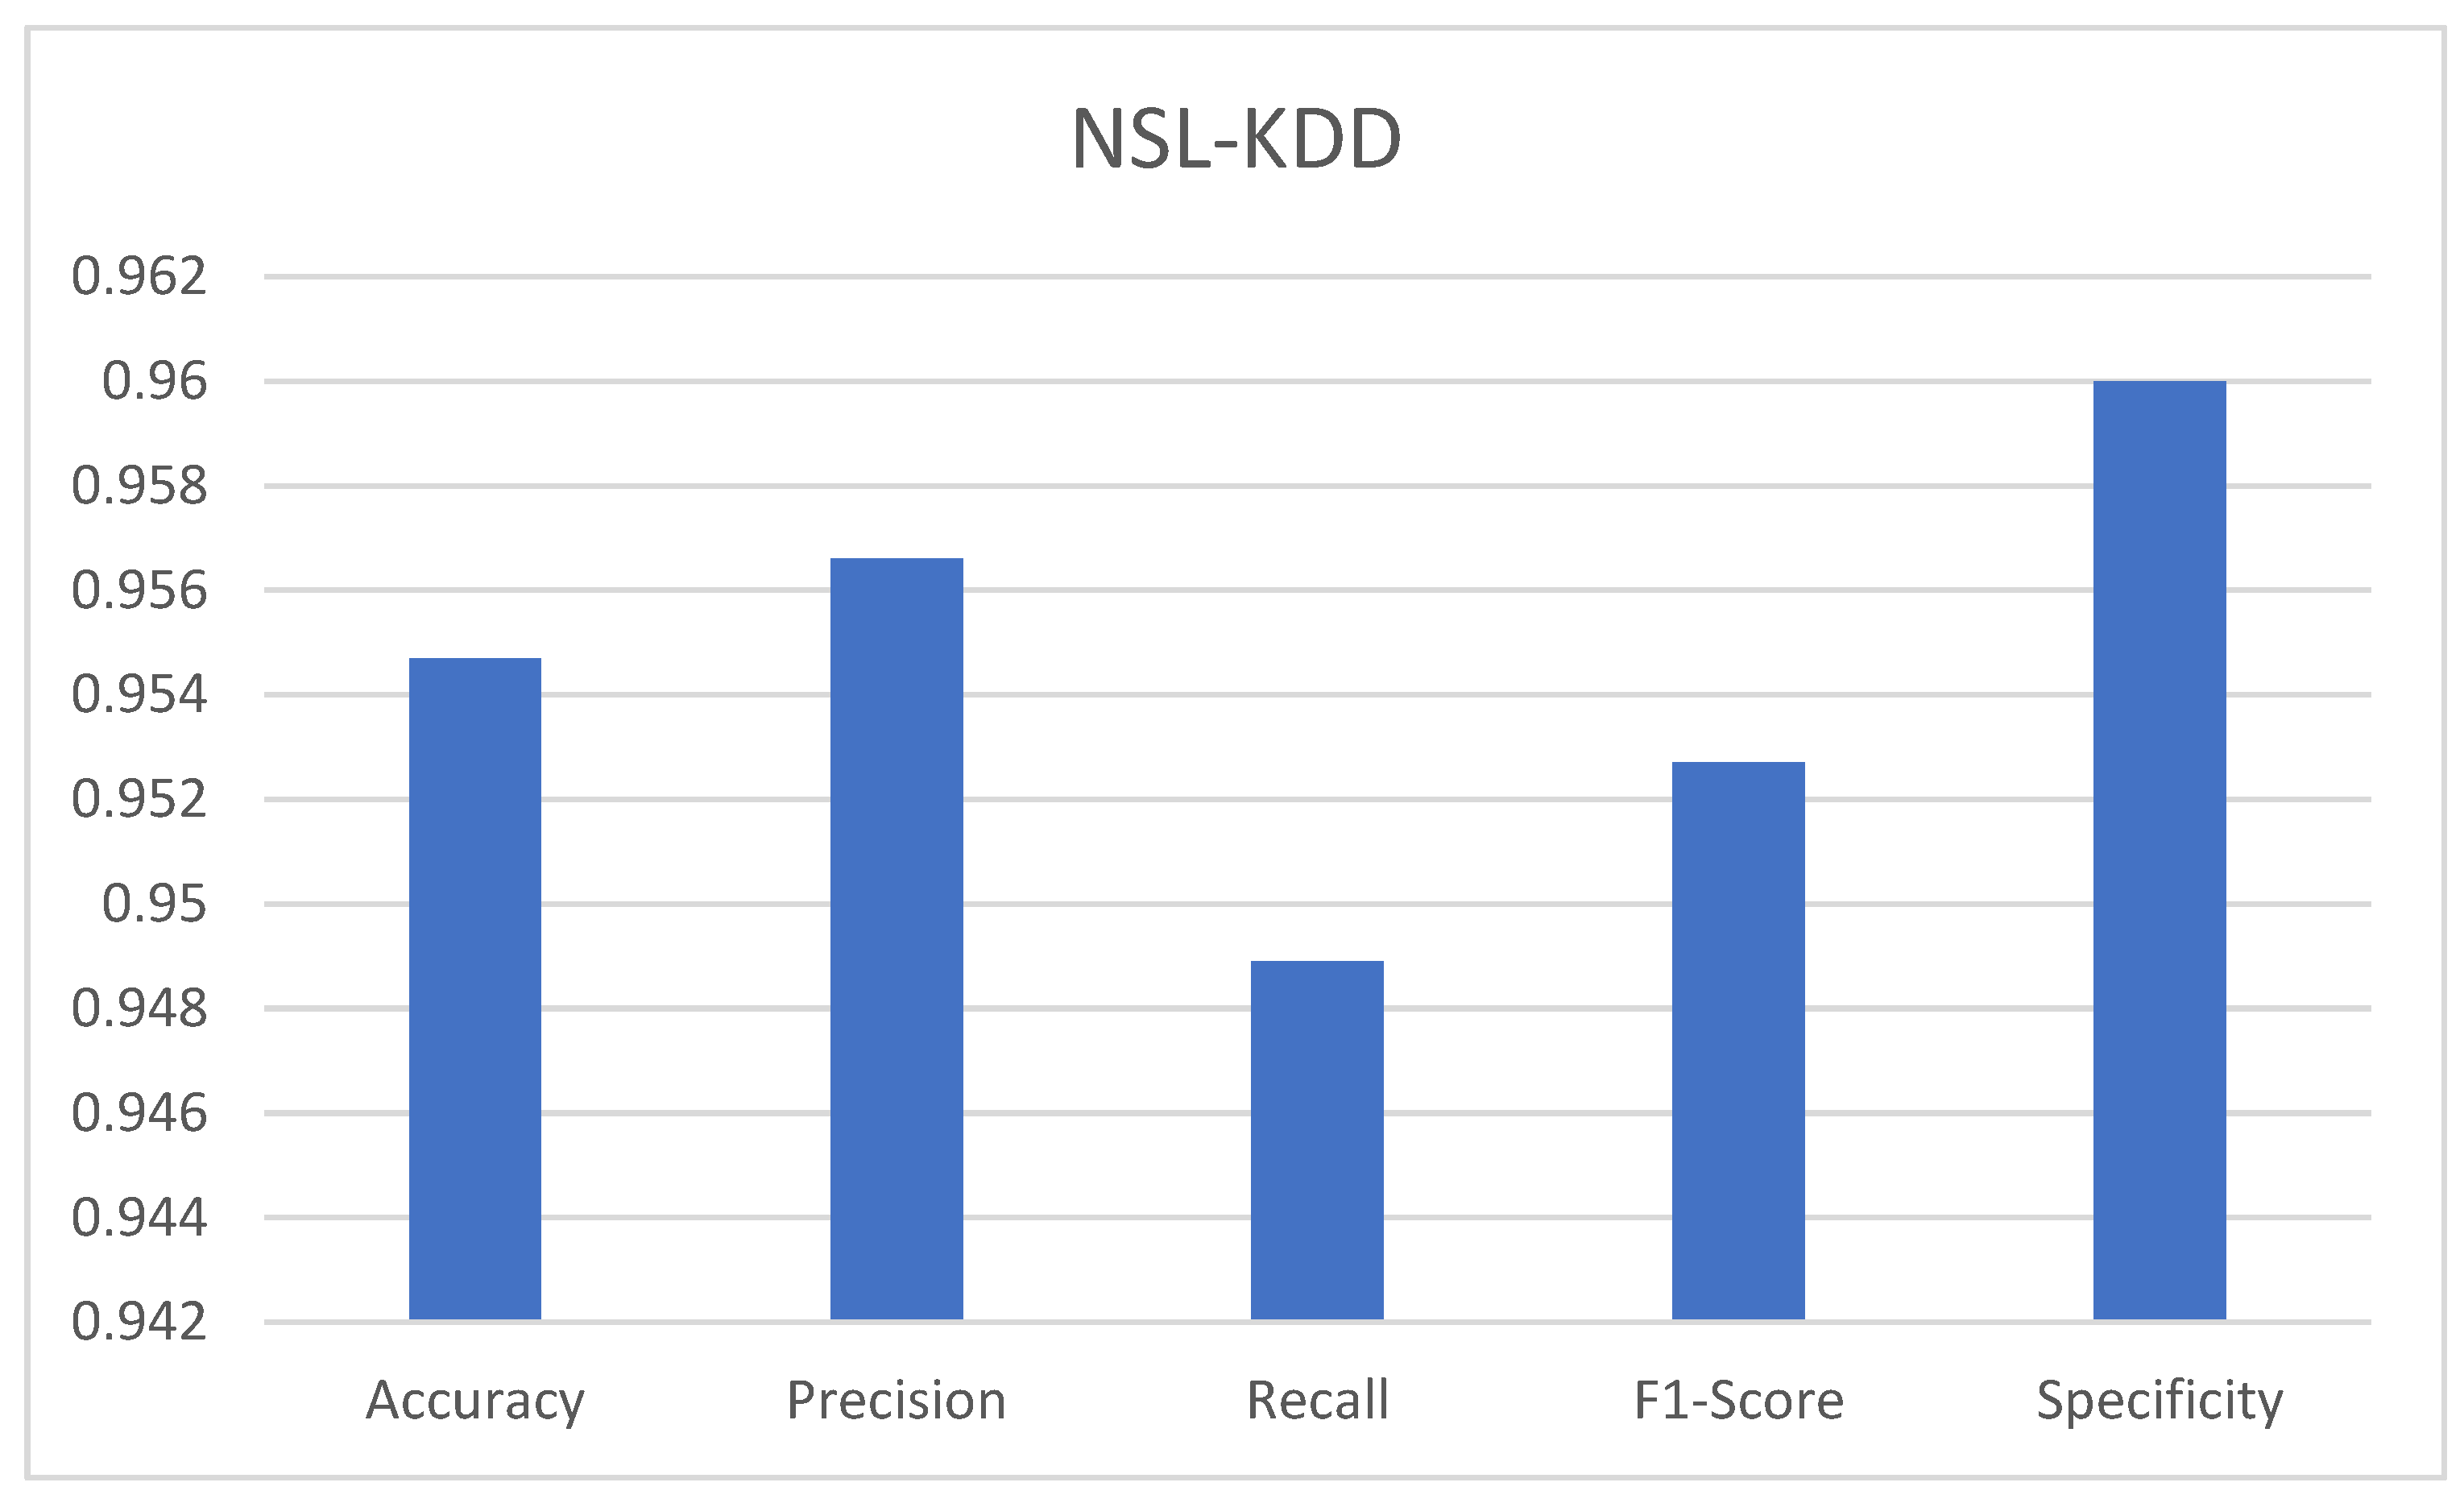
| Dataset | Accuracy | Precision | Recall | F1-Score | Specificity |
|---|---|---|---|---|---|
| NSL_KDD | 0.9547 | 0.9566 | 0.9489 | 0.9527 | 0.96 |
| UNSW_NB15 | 0.9052 | 0.9171 | 0.9452 | 0.9309 | 0.8216 |
Disclaimer/Publisher’s Note: The statements, opinions and data contained in all publications are solely those of the individual author(s) and contributor(s) and not of MDPI and/or the editor(s). MDPI and/or the editor(s) disclaim responsibility for any injury to people or property resulting from any ideas, methods, instructions or products referred to in the content. |
© 2025 by the authors. Licensee MDPI, Basel, Switzerland. This article is an open access article distributed under the terms and conditions of the Creative Commons Attribution (CC BY) license (https://creativecommons.org/licenses/by/4.0/).
Share and Cite
Allagi, S.; Pawan, T.; Leong, W.Y. Enhanced Intrusion Detection Using Conditional-Tabular-Generative-Adversarial-Network-Augmented Data and a Convolutional Neural Network: A Robust Approach to Addressing Imbalanced Cybersecurity Datasets. Mathematics 2025, 13, 1923. https://doi.org/10.3390/math13121923
Allagi S, Pawan T, Leong WY. Enhanced Intrusion Detection Using Conditional-Tabular-Generative-Adversarial-Network-Augmented Data and a Convolutional Neural Network: A Robust Approach to Addressing Imbalanced Cybersecurity Datasets. Mathematics. 2025; 13(12):1923. https://doi.org/10.3390/math13121923
Chicago/Turabian StyleAllagi, Shridhar, Toralkar Pawan, and Wai Yie Leong. 2025. "Enhanced Intrusion Detection Using Conditional-Tabular-Generative-Adversarial-Network-Augmented Data and a Convolutional Neural Network: A Robust Approach to Addressing Imbalanced Cybersecurity Datasets" Mathematics 13, no. 12: 1923. https://doi.org/10.3390/math13121923
APA StyleAllagi, S., Pawan, T., & Leong, W. Y. (2025). Enhanced Intrusion Detection Using Conditional-Tabular-Generative-Adversarial-Network-Augmented Data and a Convolutional Neural Network: A Robust Approach to Addressing Imbalanced Cybersecurity Datasets. Mathematics, 13(12), 1923. https://doi.org/10.3390/math13121923