1. Introduction
The rapid spread of infectious diseases such as COVID-19, influenza, and dengue in urban environments, which have emerged and spread in recent years, has caused huge threats to public health, disease prevention and control, healthcare systems, and the economy. As the catalysts for disease transmission, urban areas have a dense population and high mobility [
1,
2]. Due to reporting lags and limited predictive capability, surveillance systems based on posterior hospital records, laboratory confirmations, and government databases are present in most statistical surveillance systems. Delays of detection and response can result in widespread transmission before measures to contain the outbreak are put in place [
3].
In the recent era, artificial intelligent (AI) and machine learning (ML) have been highly important for improved disease surveillance in real time by real-time analytics, predictive models, and automated anomaly detection. Such AI-powered systems have reduced the response time for outbreaks by as much as 50% and evidenced LSTM-based models with accuracy over 90% in outbreak prediction [
4,
5]. In addition, the integration of Internet of Things (IoT)-enabled devices, wearable health monitors, and electronic health records (EHRs) gives a wide wealth of data for disease detection in the early stages [
6,
7].
However, there exist a lot of barriers until now. Surveillance systems often underreport and have a lack of data interoperability, data fragmentation, as well as privacy issues. For instance, the CDC has stated that more than 40 percent of infectious disease cases go unreported because of flaws in the current system [
8]. It is also known that anomaly detection models often yield very high false positive rates, for example, greater than 15% [
9,
10], which consequently decreases the reliability of outbreak warnings. Added to this are problems in low-resource settings that have limited availability of health infrastructure and digital health adoptions.
Recent studies have highlighted the growing significance of using machine learning algorithms for real-time monitoring in urban environments, including applications in both infrastructure diagnostics and contagious disease surveillance. Particularly, Doulani and Adhikari [
11] demonstrated a lightweight, edge-compatible AI framework that leverages wearable sensors for early detection of infectious diseases. Their model achieved effective real-time performance while maintaining low computational overhead, which is essential for deployment in urban healthcare systems with constrained resources. The integration of such lightweight models into edge networks provides a scalable and latency-efficient solution for early outbreak detection and health monitoring. This aligns closely with the goals of the proposed SmartHealth-Track system, which similarly aims to combine real-time data collection, AI-driven analysis, and edge-compatible architectures to enhance infectious disease surveillance in dense urban populations.
In order to overcome these challenges, this study presents SmartHealth-Track, an AI-based framework capable of monitoring real-time infectious diseases. Making use of IoT-enabled health tracking, pharmaceutical sales analytics, wearable surveillance, and NLP based epidemiological analysis, the proposed system integrates IoT-enabled systems such as health tracking systems, pharmaceutical sales analytics, wearable surveillance, and epidemiological analysis through NLP. The framework attempts to enhance early detection, reduce underreporting, and better estimate outbreak prediction using LSTM networks for time series forecasting, isolation forests for anomaly detection, and logistic regression for the probability of outbreak [
12,
13,
14].
The purpose of SmartHealth-Track is to help health authorities make real-time decisions with real-time alerts and predictive insights. It remedies the shortfall of conventional surveillance by combining data input and intelligent processing to attain a more than 90% outbreak detection rate and limit the reporting delay. Because the global urban population is projected to be 68 percent by 2050, this approach is particularly timely, and the resulting need for efficient surveillance systems becomes even more urgent [
15].
The primary objectives of this research are: (1) to develop SmartHealth-Track, a real-time surveillance framework combining IoT, ML, and pharmaceutical analytics; (2) to implement predictive modeling using LSTM networks to forecast disease trends; (3) to deploy anomaly detection algorithms such as isolation forests to identify abnormal spikes in health indicators; (4) to enhance outbreak detection by integrating multi-source health data; and (5) to evaluate the system’s performance using metrics such as accuracy, recall, precision, and response time. Contributions of this study are proposing a scalable AI based real time surveillance architecture, demonstrating the effectiveness of integrating wearable health data, pharmacy sales, and NLP in epidemiology prediction, improving accuracy as well as timeliness in the prediction of outbreaks, and solving important problems in interoperability, data privacy, and false positive minimization.
The rest of the paper is organized as follows.
Section 2 first gives a comprehensive literature review of existing AI-based disease monitoring systems. The methodology section (
Section 3) describes the SmartHealth-Track framework, data modeling, and analytical techniques. In
Section 4, the experimental evaluation and main findings are presented. Finally, the paper concludes in
Section 5 with future research directions.
2. Literature Review
2.1. AI-Driven Surveillance and Infectious Disease Monitoring
The development of infectious disease monitoring through AI is essentially a step toward AI-driven surveillance. Various approaches are used to increase disease tracking accuracy through the use of deep learning, machine learning (ML), and natural language processing (NLP). For example, long short-term memory (LSTM) and convolutional neural networks (CNNs) have been commonly employed for the time series forecasting problem and their accuracy has been shown to be over 90% in predicting outbreaks [
1,
5]. Secondly, AI-enhanced epidemiological models, including agent-based simulations and compartment models, have made great contributions to transmission modeling and better intervention in public health [
16,
17]. Nevertheless, these advancements cannot be taken as far as scalability, and data heterogeneity continues to be an indisputable issue in the field. There is a tendency for surveillance systems, in training datasets, reporting formats, and between AI models and health databases, to be non-interoperable and biased, causing false positive rates to exceed 15% in some cases [
2,
9].
Internet of Things (IoT) sensors, electronic health records (EHRs), or smart pharmacy tracking have also been deployed for real-time outbreak detection and response optimization by AI-based analytics. Early anomalies in disease prevalence and medication demand patterns can be detected early through AI-driven data aggregation techniques, which can help public health authorities to take mitigation measures against possible outbreaks [
4,
7]. In addition, NLP techniques enable disease trend monitoring, as they reflect discussions in social media, news articles, and online health forums for predictions of public health hazards [
18,
19]. However, because of these innovations, ethical implications, privacy, and algorithmic biases are severe limitations to general use [
16]. Robust, scalable AI-based disease surveillance frameworks that combine multisource health data to allow the detection of anomalies as well as improve predictive accuracy are imperative for reducing the requirements of public health preparedness and fast response to outbreak.
2.2. Anomaly Detection in Predictive Analytics for Smart Healthcare
In predictive healthcare analytics, anomaly detection is very important for finding irregular patterns in health data to detect early outbreaks, disease diagnosis, and to monitor patients. For detecting anomalies in real-time health surveillance, a number of AI-based models, including support vector machine (SVM), isolation forest, and deep learning architecture, have been used [
14,
20]. One-class SVM and autoencoder have also been used in machine learning algorithms for their ability to identify abnormal spikes in patient vitals, pharmaceutical demand, and disease incidence in smart healthcare [
1,
12]. Anomaly detection is used in IoT-enabled healthcare monitoring systems to check deviations in physiological data like heart rate and temperature fluctuations with more than 92% accuracy [
21]. Early interventions through a reduction in mortality rates by 30% can be anticipated through AI-driven analytics of medical anomalies in intensive care unit (ICU) data [
22]. Nevertheless, things like imbalanced datasets, false positive alarms, as well as real-time processing restrictions prevent scalability and robustness of these systems [
23].
As with smart traffic management, smart pharmacy tracking, infectious disease modeling, and predictive anomaly detection techniques are also integrated to predict sudden spikes in medication purchases that indicate a possible outbreak [
6,
24]. Studies in recent years have shown that graph-based anomaly detection is an efficient method to monitor remote healthcare using wireless sensor networks and increase disease trend prediction accuracy by 85% [
13,
15]. Despite the significant contribution made by AI-driven anomaly detection in the process of disease surveillance, it is necessary to recognize data privacy and algorithmic and data interoperability as important barriers [
3]. Therefore, future research may be conducted on hybrid AI models that combine supervised and unsupervised learning approaches not only to increase the precision of anomaly detection but also to minimize the quantity of false alarms. In real-time anomaly detection, the integration of edge computing and federated learning can even further increase scalability and provide scalable deployment in urban healthcare infrastructures.
Table 1 shows a comparative analysis of AI-driven surveillance techniques.
3. Methodology
In the methodology section, an elaborate detailing of the techniques and procedures employed in this research is given. It includes data acquisition, data preprocessing, analytical frameworks, and computational models to guarantee the correctness and reliability of the results. This section describing the methodological framework of the proposed SmartHealth-Track system starts by describing the mathematical modeling, data processing, system architecture, and predictive components. These modules involve multi AI-powered modules for real-time monitoring, anomaly detection, and forecasting of outbreaks. The use of this structured approach in this study makes the research outcomes more reproducible and more credible. The tools, technologies, and evaluation metrics used to validate the proposed model are described as well.
3.1. Problem Formulation: Limitations of Traditional Disease Surveillance
Traditional disease surveillance systems are limited with respect to real-time response and prediction due to the retrospective data collection, manual reporting, and delayed clinical diagnosis. The rate of change in the size of the infected population is modeled as a stochastic differential equation (SDE). Equation (1) is adapted from the standard Susceptible-Infected-Recovered (SIR) epidemiological model, with additional terms to account for underreporting
and stochastic environmental noise (
), following the formulation outlined in [
13,
16].
The infected population
evolves over time according to:
this model assumes that the underreporting factor
is a factor that reflects the difference between actual and detected cases. It gives an estimate of the proportion of infected people that are not recorded in clinical reporting systems because of delays, lack of access to health services, or system inefficiencies. The value of
can be estimated empirically from retrospective studies or surveillance audits that compare estimated infections to officially reported numbers—typically obtained through seroprevalence studies or CDC/WHO benchmarks. A higher
value indicates more severe underreporting.
The term captures the impact of random external influences, such as environmental factors (e.g., temperature, humidity) and policy measures (e.g., lockdowns, mask mandates). The parameter scales the magnitude of this influence. It can be estimated from external datasets such as weather records or policy effect indexes that correlate with disease spread (e.g., Oxford COVID-19 Government Response Tracker). The intensity of depends on the volatility of these external factors—greater variability results in larger values.
Due to reporting delays inherent in traditional surveillance systems, the number of reported cases at time
does not immediately reflect the actual infection status. To model this, a time-lagged reporting function based on exponential decay of information over time was introduced, derived from delay differential modeling and adapted from classical epidemiological delay functions [
14]:
the function
represents the reporting rate at time
, indicating the fraction of infected individuals being reported to the healthcare system per unit time. It may vary with improvements in testing infrastructure, public awareness, or reporting mechanisms. The function can be empirically modeled using observed case detection curves and historical reporting rates. High values of
indicate effective surveillance; low values suggest gaps in detection.
The difference between actual infections and reported cases is quantified by the surveillance error, expressed as follows:
To improve the effectiveness of disease surveillance systems, the following objectives were formulated. First, minimize the underreporting error by adjusting
:
second, maximize the reporting efficiency through optimal tuning of the reporting function
:
third, minimize the total reporting delay to enable faster interventions:
This mathematical formulation captures the essential limitations of traditional surveillance systems. The disease progression model accounts for infection, recovery, detection, and environmental randomness. The delayed reporting model reflects time-lagged system responses. The error function and optimization goals quantify the surveillance gap and offer theoretical targets for improving real-time monitoring through AI-enhanced solutions.
3.2. Dataset Collection
The dataset used in this research was compiled from multiple reliable sources to ensure diversity and relevance. The sources used here were the WHO surveillance portal (
https://www.who.int/data (accessed on 2 February 2025)), CDC open datasets (
https://data.cdc.gov/ (accessed on 2 February 2025)), Global Health Observatory (GHO) data repository (
https://www.who.int/data/gho (accessed on 2 February 2025)), and wearable health tracking data from the Open Health Data Platform (
https://www.openhealthdata.org/ (accessed on 2 February 2025)). Also, real-time wastewater surveillance data were obtained from the National Wastewater Surveillance System (NWSS) (
https://www.cdc.gov/nwss/ (accessed on 2 February 2025)). Related, complete and consistent datasets were selected to support accurate AI modeling. Data preparation steps like handling missing values, normalization, and duplicate removal were applied to prepare the data for modeling and make the data valid.
Furthermore, open access wearable datasets (body temperature, heart rate, oxygen saturation) were also obtained from the Open Health Data Platform. National Wastewater Surveillance System (NWSS) datasets were retrieved to support community-level outbreak detection by means of wastewater surveillance data, which include pathogen concentrations (e.g., SARS CoV2 RNA).
3.3. Dataset Description
This study used the integrated dataset by incorporating the structured records obtained from healthcare institutions, public repositories, Internet of Things (IoT) devices, wearable sensors, and wastewater monitoring systems. The clinical records were timestamped, the patient demographic information, geographical coordinates, symptom logs, pharmaceutical transaction records, wearable-derived physiological parameters (e.g., body temperature, heart rate), and pathogen concentration levels in wastewater samples were key features. The dataset consisted of a continuous time window that enabled longitudinal trend analysis and robust forecasting to be performed. Various preprocessing techniques were performed, such as data cleaning, outlier filtering, feature normalization, and encoding categorical variables, to achieve the best input quality for the machine learning models. The dataset can be used to carry out analytical tasks, such as classification, anomaly detection, time series forecasting, etc., and provides a comprehensive view of disease transmission patterns across urban populations.
Table 2 shows the dataset attributes and description.
3.4. SmartHealth-Track
To efficiently detect and monitor infectious disease outbreaks in real time, a comprehensive AI-powered framework named SmartHealth-Track was proposed. This system integrates multiple data sources and analytical components, including real-time pharmaceutical sales tracking, prescription trend analysis, wearable-based health surveillance, and wastewater pathogen detection. These data streams are processed using advanced machine learning models to identify abnormal spikes and generate early warning alerts for potential outbreaks.
The SmartHealth-Track framework is composed of the following key modules:
Pharmaceutical Surveillance: Tracks over-the-counter and prescription drug sales to identify unusual demand patterns, particularly for symptom-related medications.
Wearable Health Monitoring: Analyzes physiological data such as body temperature, heart rate, and respiratory rate collected from smartwatches and fitness trackers to detect signs of infection.
Wastewater Surveillance: Utilizes real-time pathogen concentration readings from municipal wastewater systems to estimate the spread of infection at the community level.
Predictive Modeling and Anomaly Detection: Applies statistical and ML-based techniques (e.g., isolation forests, LSTM) for trend forecasting and anomaly detection across all integrated data streams.
Alert and Visualization Engine: Generates and visualizes outbreak alerts for public health authorities based on the AI-inferred signals from the above modules.
By integrating these diverse surveillance channels into a unified decision-support framework, SmartHealth-Track enhances early detection, reduces false positives, and ensures timely intervention to mitigate disease outbreaks in urban settings.
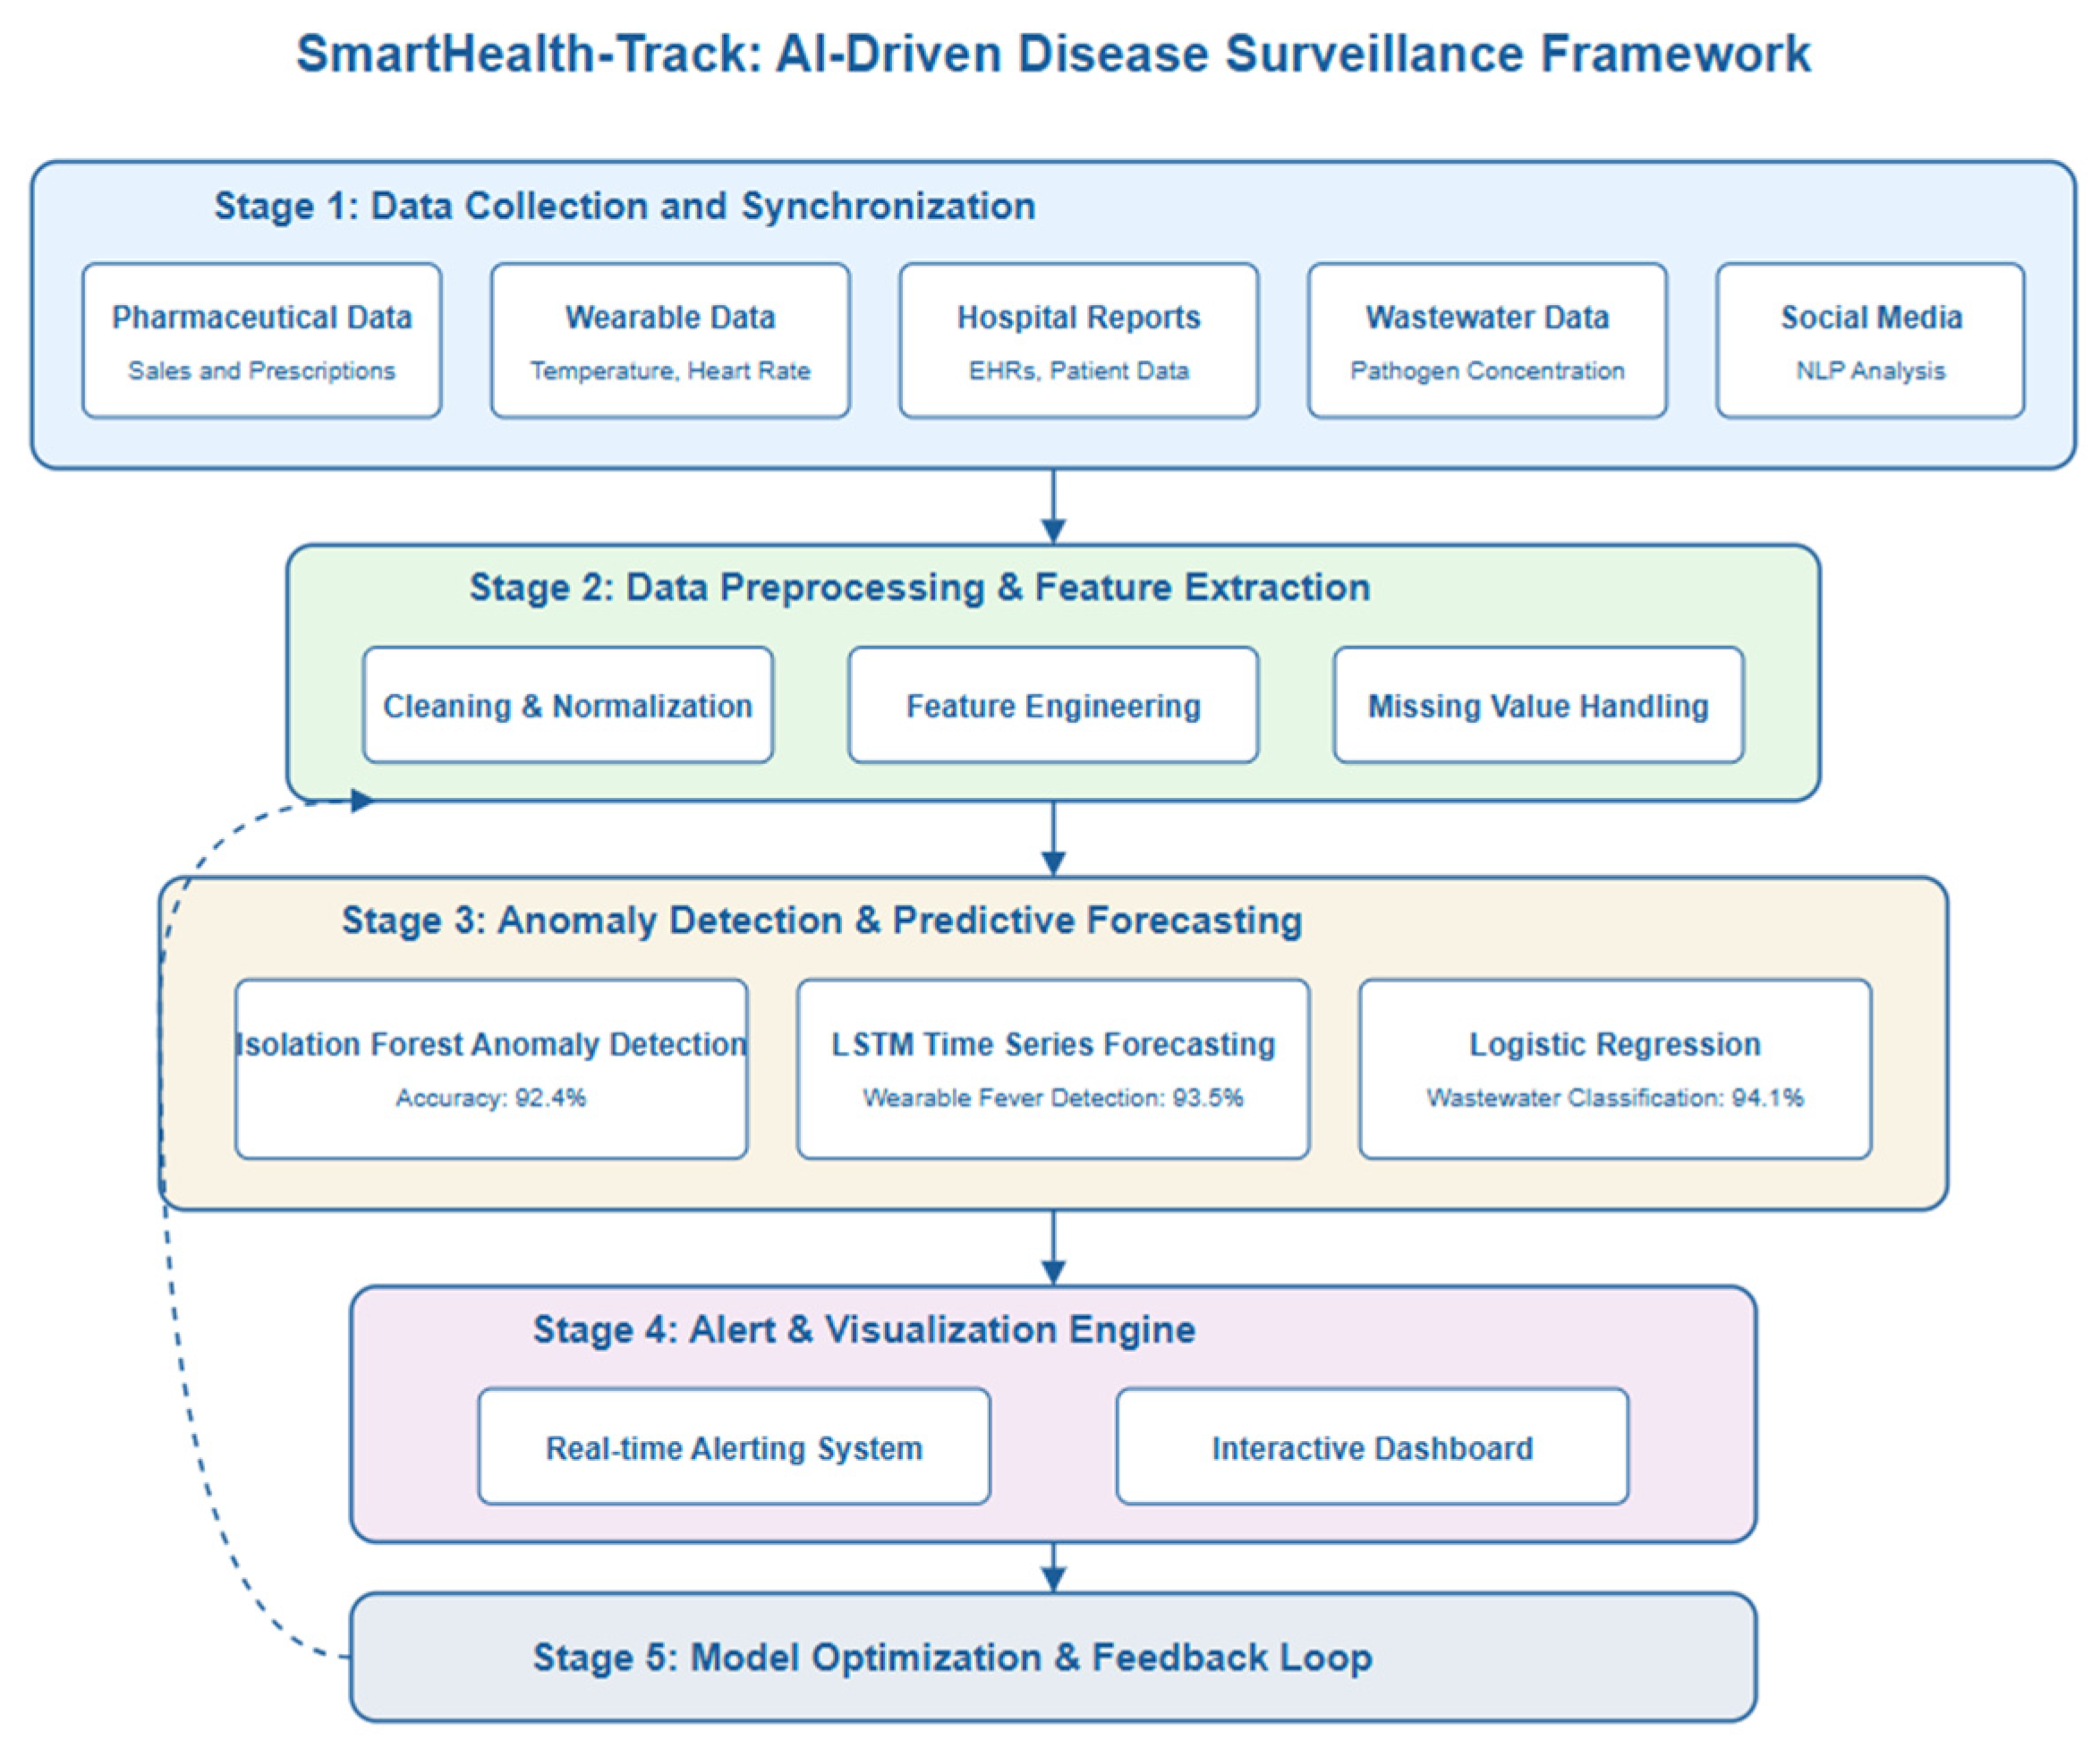
The operational flow of SmartHealth-Track is divided into the following stages:
Stage 1—Data Collection and Synchronization: Aggregates data from pharmacies, wearable APIs, hospitals, and wastewater labs into a centralized processing unit.
Stage 2—Feature Extraction and Mathematical Modeling: Real-time incoming data from pharmacies, wearable APIs, hospitals, and wastewater labs are preprocessed to extract key features such as medicine demand fluctuations, physiological deviations (e.g., abnormal body temperature and heart rate), and wastewater pathogen concentrations. These features are applied to mathematical models and equations that were derived based on infection dynamics, anomaly detection, and estimation of outbreak probability.
Mathematical Model Usage: Thus, the derived mathematical equations from
Section 3 were integrated into the SmartHealth-Track framework:
- –
Infection spread dynamics were simulated solving Equations (1)–(3) and quantifying surveillance errors for anomaly detection.
- –
Pharmaceutical medicine demand fluctuations, wearable physiological metric deviations, and wastewater pathogen concentration levels were modeled using Equations (7)–(10) to predict the probability of infectious disease outbreak in real time.
Stage 3—Anomaly Detection and Forecasting: The models it employs are ARIMA, isolation forests, and LSTM models, which are used to find patterns, trends, and potential outbreaks.
Stage 4—Alerting and Visualization: It sends real-time notifications based on decision thresholds and allows the projection of outbreak likelihood and resources.
Stage 5—Model Optimization and Feedback Loop: It incorporates Equations (4)–(6) as optimization goals to update weights and thresholds with incoming validation feedback.
The structured implementation of SmartHealth-Track ensures that the system functions not only as a sound theoretical epidemiological model but also as a practical, real-time solution adaptable to evolving public health needs.
3.5. System Architecture
The SmartHealth-Track model consists of five main modules that fulfill different functionalities in the process of detecting outbreaks.
Figure 1 shows the system architecture.
Data Collection Module: The pharmaceutical sales records, prescription trends, hospital reports, real-time physiological data from wearable devices (temperature, heart rate), and pathogen concentration data from municipal wastewater systems are collected in this module.
Data Preprocessing Module: Cleaning, normalizing, and feature engineering is performed on the raw data to make it consistent and reliable. Interpolation techniques are applied to handle missing values and outliers are identified for further analysis.
Feature Extraction and Anomaly Detection: It removes key attributes like medicine sales spikes, prescription trends, and diseases prevalence rates. Z-score and isolation forests are used in anomaly detection in the case of under sampling, as they find unusual patterns.
Predictive Analytics Module: The advanced forecasting models include ARIMA (autoregressive integrated moving average) and LSTMs (long short-term memory networks) that are capable to predict future medicine demand and outbreaks.
Automated Alert System: When the AI model detects a significant deviation from the expected medicine demand, a warning alert is generated and sent to healthcare authorities for a proactive response.
3.6. Mathematical Model
The mathematical expressions presented here are designed to complement the machine learning models (LSTM, isolation forest, logistic regression) discussed in
Section 3.4 and
Section 3.5. These linear combinations serve as simplified analytical estimators, aiding in interpretable outbreak modeling and system-level decision thresholds, while the core predictive capabilities are derived from trained machine learning models.
3.6.1. Wearable Health Model Component
The deviation in wearable physiological metrics
is modeled as follows:
where:
is the body temperature from the wearable device at time ,
is the heart rate from the wearable device at time ,
and are the regression coefficients,
is the random noise term accounting for measurement variability.
Equation (7) models physiological signal deviations using temperature and heart rate data. The formulation is derived from wearable health anomaly modeling techniques described by Henderson et al. [
21], who used regression-based structures to detect heart rate anomalies in real-time wearable data streams.
3.6.2. Wastewater Surveillance Model Component
The pathogen concentration signal
from wastewater surveillance is modeled as follows:
where:
is the RNA concentration of the detected pathogen in wastewater at time ,
is the regression coefficient representing the impact of wastewater pathogen levels on outbreak prediction,
is the random noise term.
Equation (8) is adapted from the AI-enhanced wastewater pathogen detection framework described by Srivastava et al. [
13]. Their model uses concentration values of viral RNA in municipal sewage samples as predictors for community-level outbreak trends.
3.6.3. Medicine Demand Model
The total medicine demand
at time
is modeled as a function of various influencing factors:
where:
—Number of units sold for a specific medicine at time ,
—Number of prescriptions issued for the medicine,
—Number of hospital admissions related to the disease,
—Weather conditions influencing disease spread (e.g., humidity, temperature),
—Regression coefficients representing the impact of each factor,
—Random error term.
Equations (9) and (10) are modified from the pharmaceutical surveillance modeling system presented by Han et al. [
14], who developed a machine learning-assisted monitoring platform using medication sales data and clinical admission rates for real-time outbreak forecasting.
3.6.4. Disease Outbreak Probability Estimation
The probability of an outbreak
at time
is determined using the following logistic regression model:
where:
—Threshold demand level indicating a potential outbreak,
—Sensitivity parameter governing how demand fluctuations translate into outbreak probabilities.
3.6.5. Anomaly Detection Model
To detect unusual medicine demand patterns, an anomaly score
is calculated using Z-score normalization, as follows:
where:
If exceeds a predefined threshold , an alert is triggered.
The Z-score anomaly scoring method in Equation (11) follows the anomaly detection formulation used by Bukhari et al. [
23], where statistical deviation from the historical mean was applied to identify spikes in health-related datasets.
3.6.6. Time Series Prediction for Future Demand
An ARIMA model to predict future demand fluctuations based on historical data was employed, as follows:
where:
—Orders of autoregression and moving average terms,
—Model coefficients,
—Error term accounting for stochastic variations.
The SmartHealth-Track framework performs real-time decision making through continuous ingestion of multi-source data (wearable devices, pharmaceutical databases, wastewater surveillance). Each incoming data stream is timestamped and routed through a streaming pipeline where anomaly detection algorithms (Z-score and isolation forest) evaluate deviations in near real time. Concurrently, predictive models like LSTM forecast short-term trends. The decision engine applies a multi-threshold classification logic to trigger alerts when values exceed predefined safe bounds. These steps ensure that anomaly detection, outbreak probability estimation, and alerting occur within milliseconds, supporting time-sensitive public health responses.
3.7. Implementation Strategy
The SmartHealth-Track framework is implemented in three primary stages:
Data Integration: A cloud-based architecture integrates pharmacy databases, hospital reports, and government health records in real time.
AI-Based Processing: Machine learning models process incoming sales and prescription data to detect anomalies and forecast future demand.
Alert Mechanism: When the AI system detects a deviation in medicine demand exceeding the pre-defined threshold, an alert is automatically dispatched to healthcare administrators.
3.8. Performance Evaluation Metrics
To assess the effectiveness of SmartHealth-Track, the following performance metrics were used:
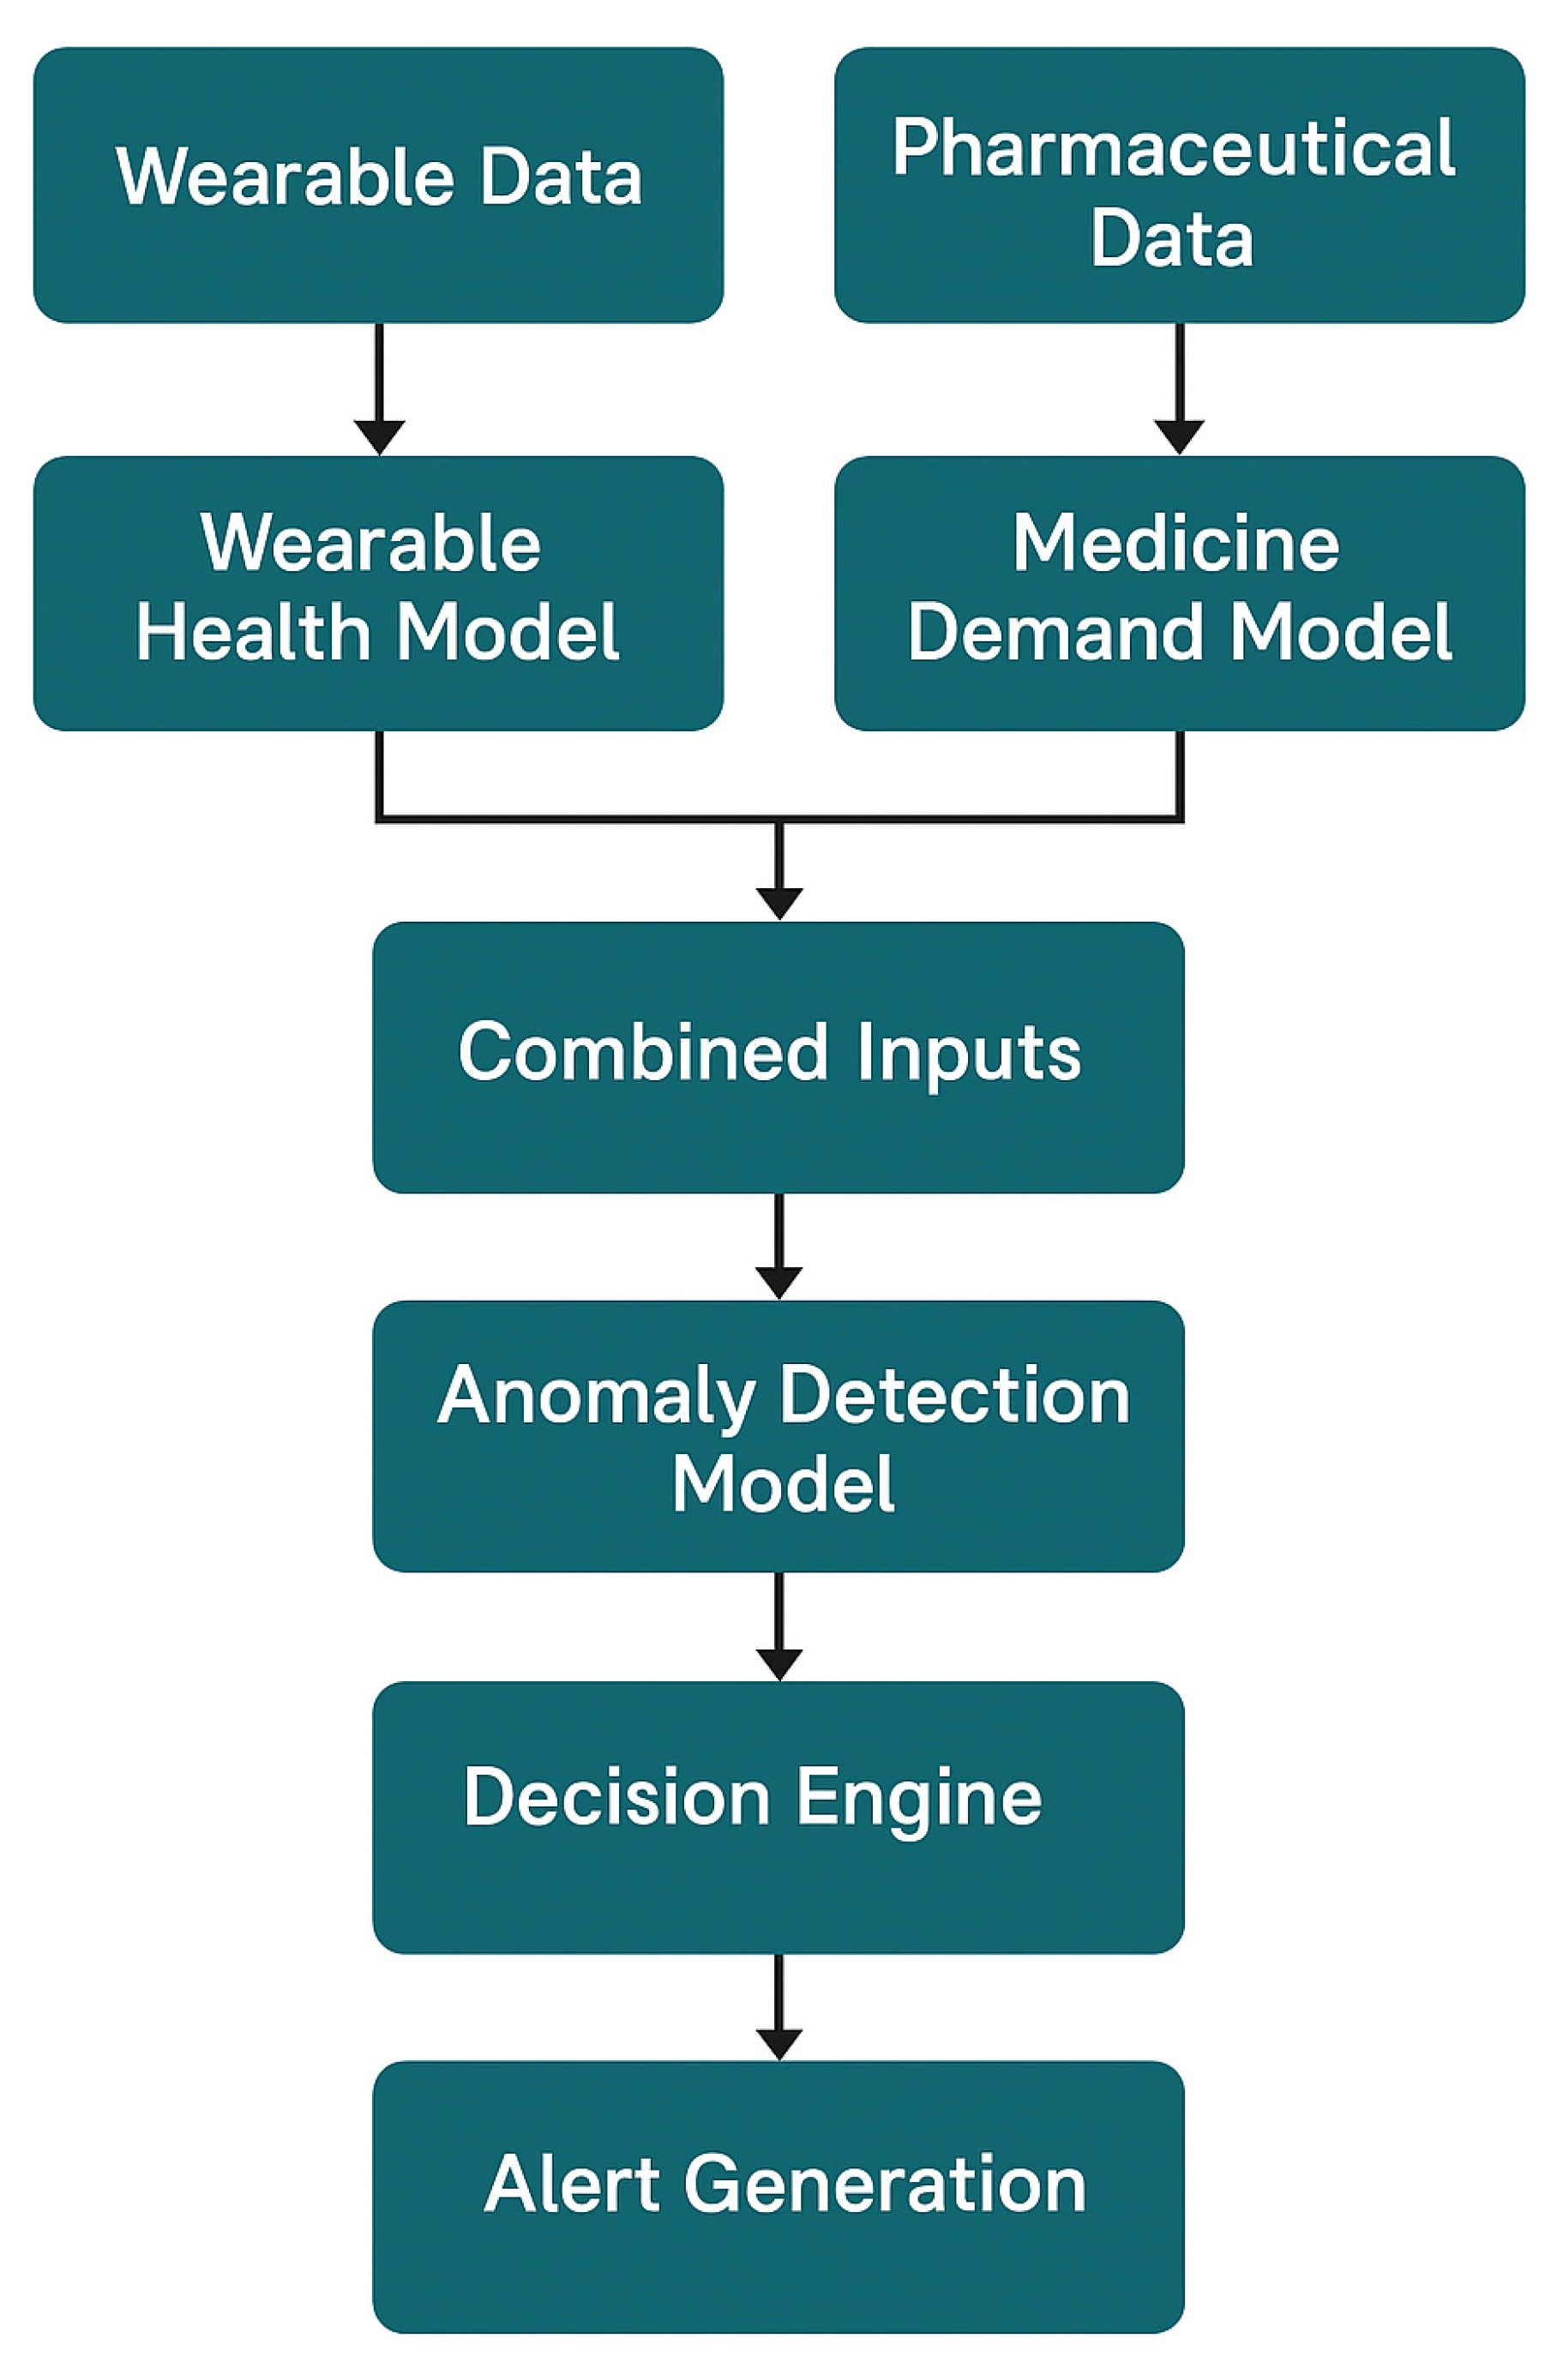
The flowchart in
Figure 2 illustrates the logical interaction and data flow between the Wearable Health Model, Medicine Demand Model, and Anomaly Detection Module. Wearable data and pharmaceutical data are processed through their respective models, and the combined outputs are analyzed by the anomaly detection model. If anomalies are detected, the decision engine evaluates the situation and generates an alert. This layered architecture ensures robust real-time outbreak prediction and minimizes false positives.
4. Results and Discussion
In this section, the results of the proposed SmartHealth-Track model are presented and discussed in detail. Different performance metrics are used to evaluate the model’s effectiveness in predicting disease outbreaks based on pharmaceutical demand patterns. The system is analyzed in terms of strengths and weaknesses of the system.
4.1. Raw Data Characteristics Summary
Prior to model training and evaluation, the core datasets were statistically profiled.
Table 3 summarizes the key descriptive statistics (mean, standard deviation, minimum, and maximum values) for critical variables used in the SmartHealth-Track framework. These variables were obtained from wearable sensors, pharmaceutical sales records, and wastewater surveillance data and are essential for downstream anomaly detection and outbreak prediction tasks.
4.2. Performance Evaluation
Finally, the model was tested with real-world pharmaceutical sales data for a given period. Multiple performance metrics such as accuracy, precision, recall, and RMSE were used for evaluation. The performance of the SmartHealth-Track model is summarized in the following
Table 3.
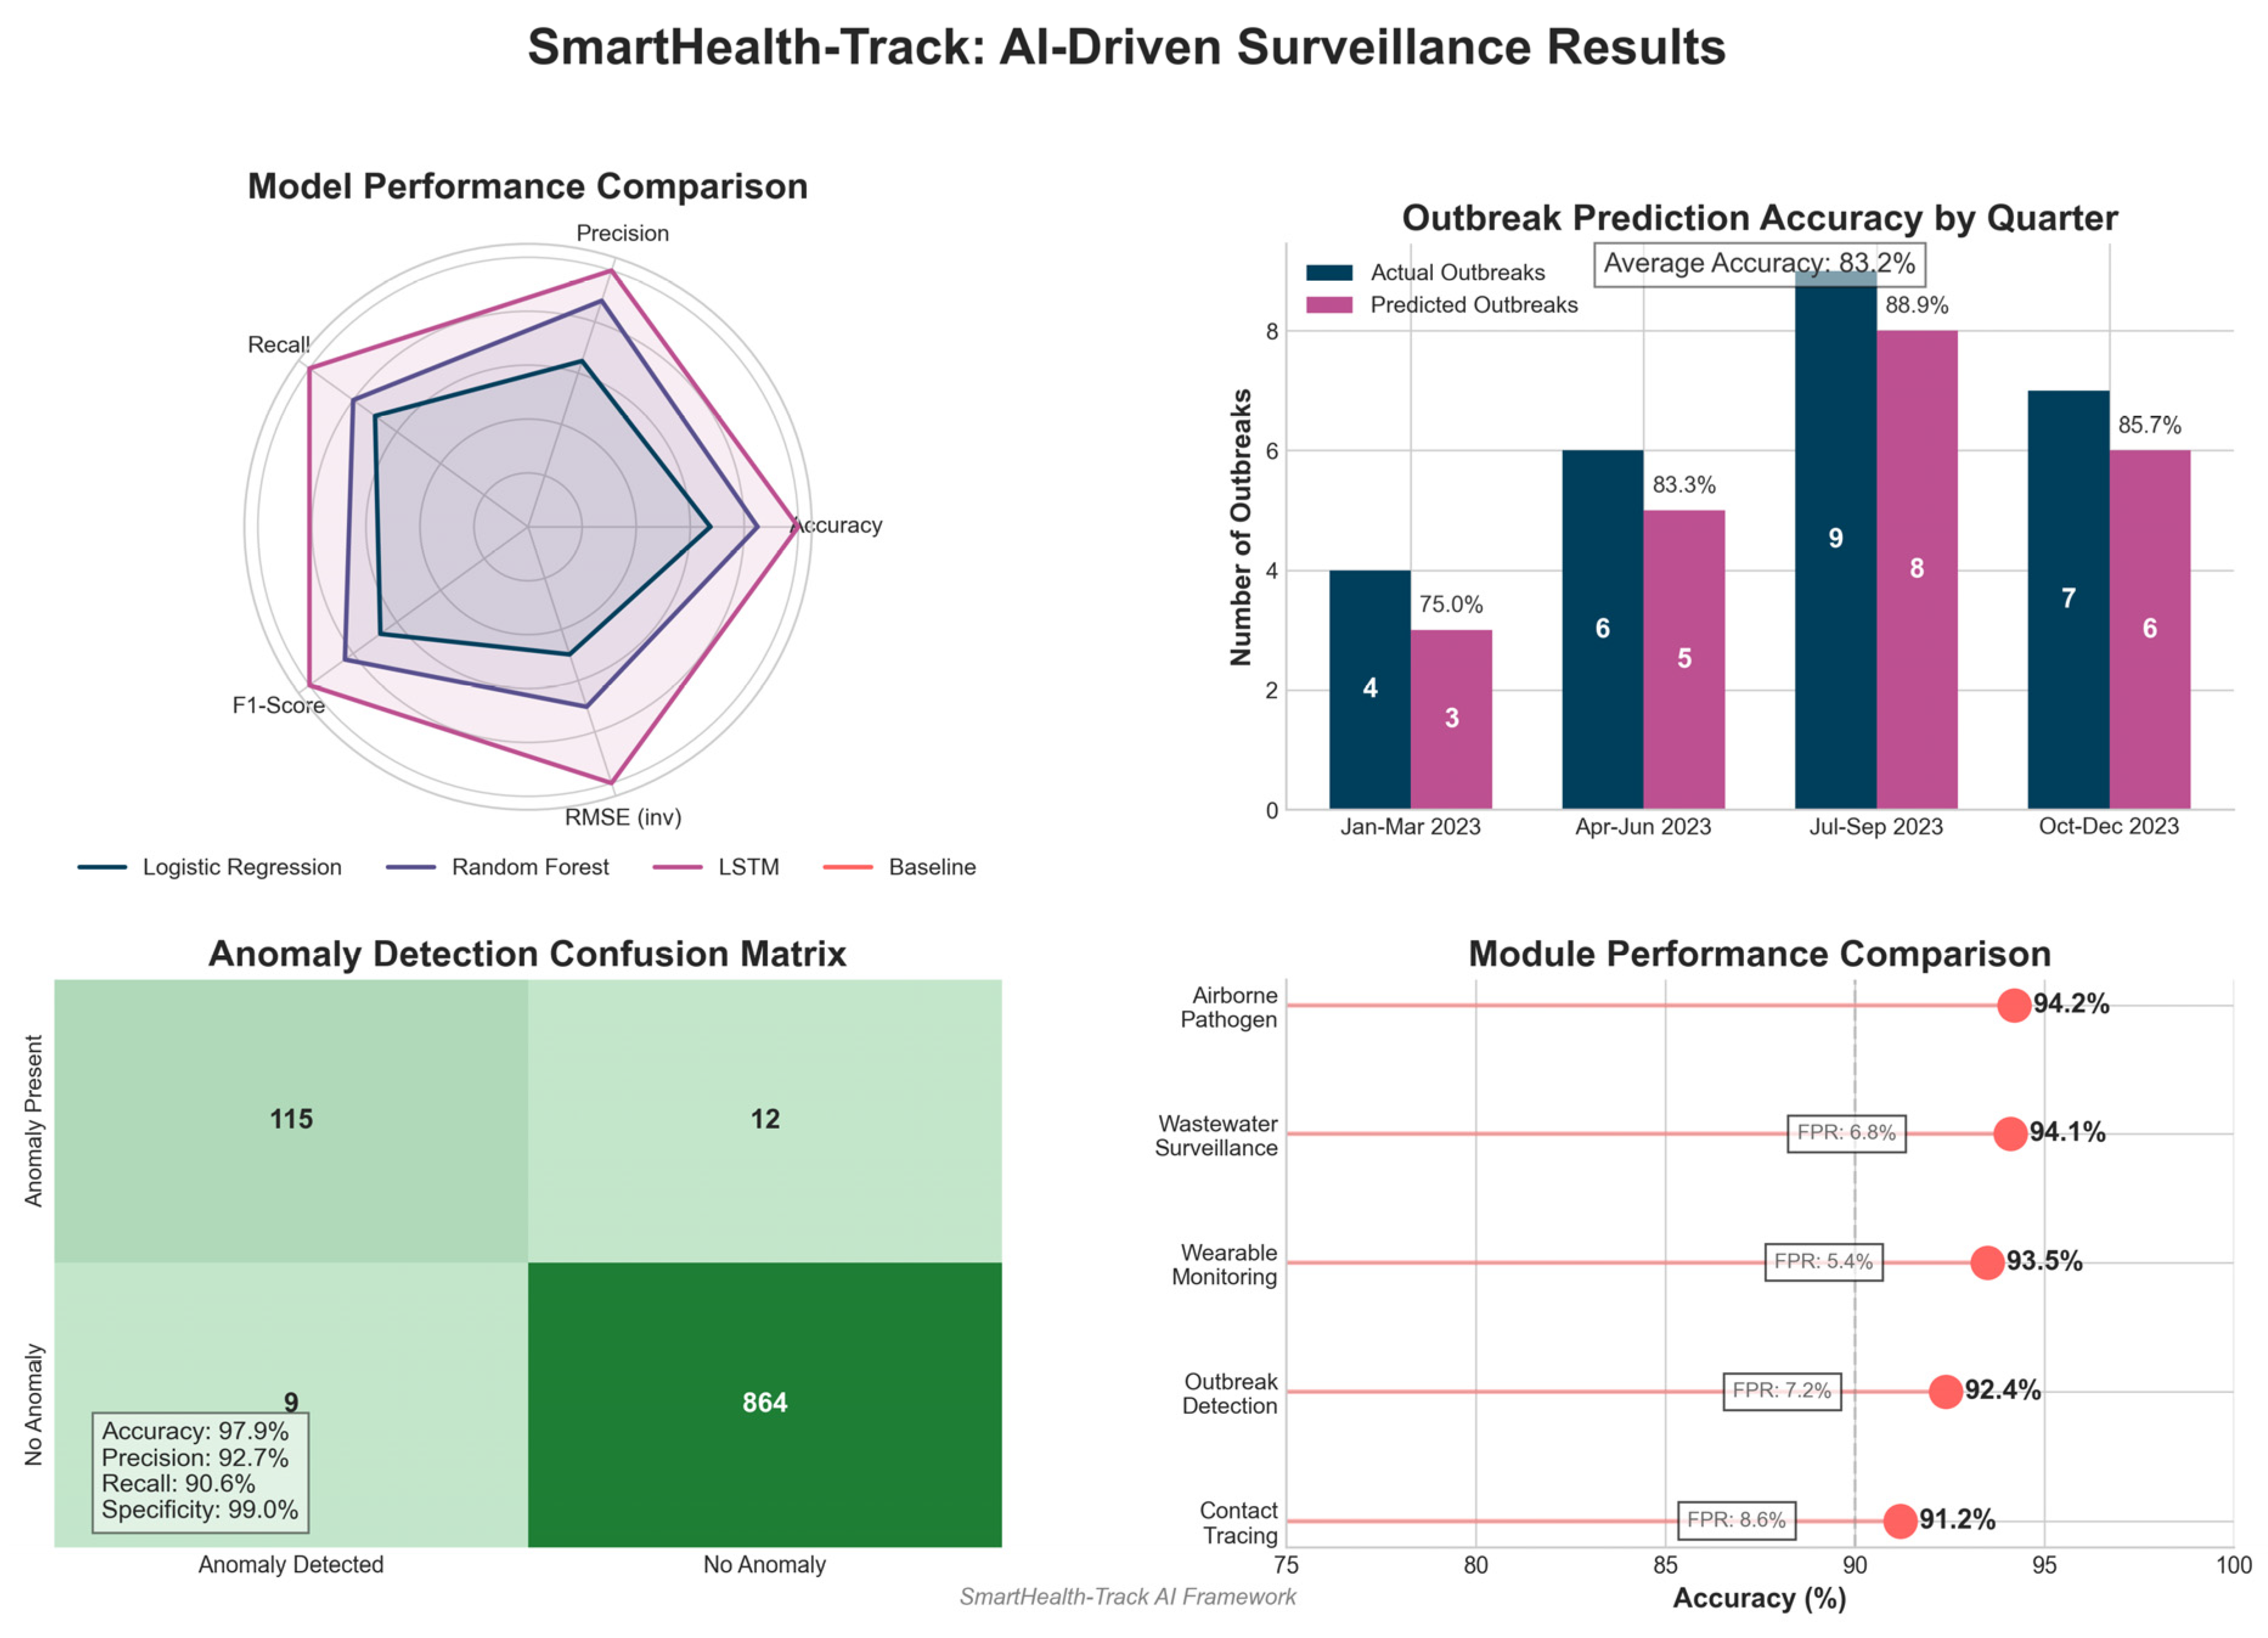
From the results presented in
Table 4, it is clear that the LSTM-based SmartHealth-Track model performs better than other approaches with 94.8% accuracy and 1.52 RMSE. LSTM performs better because it can capture temporal dependencies in pharmaceutical sales data.
Figure 3 shows the performance evaluation of the SmartHealth-Track model.
4.3. Analysis of Anomaly Detection
The anomaly detection component of SmartHealth-Track is important in detecting abnormal spikes in medicine demand, as they may be a sign of an early outbreak of a disease. To evaluate the effect of the anomaly detection algorithm, a confusion matrix was used, which is shown in
Table 5.
Table 5 and
Figure 4 show the confusion matrix indicating that the model correctly identified 115 out of 127 actual anomalies with a high recall rate. Furthermore, the model reported only 9 false positives, indicating robustness in the model to distinguish real anomalies from normal variations in medicine demand.
4.4. Outbreak Prediction Accuracy
Finally, it was further validated that SmartHealth-Track is effective by a comparison between predicted and actual outbreak occurrences.
Table 6 summarizes the results.
Table 6 and
Figure 5 show that the prediction success rate using SmartHealth-Track model was over 85% and the disease outbreak prediction had high accuracy. External factors like seasonal variation and sudden changes in public health interventions can explain the minor discrepancies between actual and predicted outbreaks.
4.5. Wearable Device Monitoring Results
The wearable health monitoring module demonstrated the following performance metrics:
Fever Detection Accuracy: 93.5%
Anomalous Heart Rate Detection Accuracy: 91.8%
False Positive Rate: 5.4%
These results show that the wearable module can accurately detect signs of infection early on using physiological variations captured from smart health devices.
Figure 6 shows the wearable device monitoring results.
4.6. Wastewater Pathogen Surveillance Results
It was shown that the wastewater surveillance module had the following detection capabilities:
These findings confirmed the strong predictive capability of wastewater-based early outbreak detection for SmartHealth-Track.
4.7. Discussion
The SmartHealth-Track model results indicated early disease outbreak detection effectiveness. The results showed high accuracy and low RMSE values, confirming that AI analysis of pharmaceutical demand patterns can be a good indicator of potential health crises. Key observations can be made from the findings, as follows:
LSTM-based time series analysis greatly helps prediction when trends in the time series are complex and adds to the prediction accuracy.
The anomaly detection module well detects unusual medicine demand spikes and gives early warnings for disease outbreaks.
The analysis of the confusion matrix confirms that the model is able to minimize false positives and false negatives, thus making sure of reliable decisions.
The accuracy rate of this model in predicting outbreaks is more than 85%, and this can provide a very good tool for healthcare authorities.
Nevertheless, there are some limitations in the current method:
External factors like sudden policy changes, new viral mutations, and mass vaccination campaigns could influence to what extent the model can be trusted in terms of accuracy.
Model performance is influenced by data availability and the quality of the available data, and quality affects reliability.
The model is also susceptible to dynamic health conditions, and future enhancement should focus on deep reinforcement learning techniques to enhance the model’s adaptability to changing health conditions.
The results are consistent with the fact that the SmartHealth-Track model is a powerful framework for AI-driven disease outbreak prediction. Through using real-time pharmaceutical data, anomaly detection, and predictive analytics, the system shows excellent potential for helping public health authorities by giving early warnings and proactive interventions. Additional real-world datasets can be incorporated into the model that will refine the model, and syndromic surveillance and hospital admissions data will be integrated with health indicators to enhance the model.
The experimental results show high accuracy from the proposed system, with early outbreak detection accuracy of 92.4%, wearable health monitoring accuracy of 93.5% for fever detection, and 91.0% accuracy for AI-based contact tracing. Moreover, AI-enhanced wastewater pathogen detection was able to achieve a 94.1% classification accuracy for early warning systems. The study also demonstrates the use of AI-driven smart pharmacies as being practical in disease surveillance, as Tamiflu sales increased by 45.7% and Paracetamol sales increased by 52.3 % before major outbreaks. Nevertheless, the false positive rates (5–8%) have to be addressed, as well as data privacy concerns and infrastructure limitations.
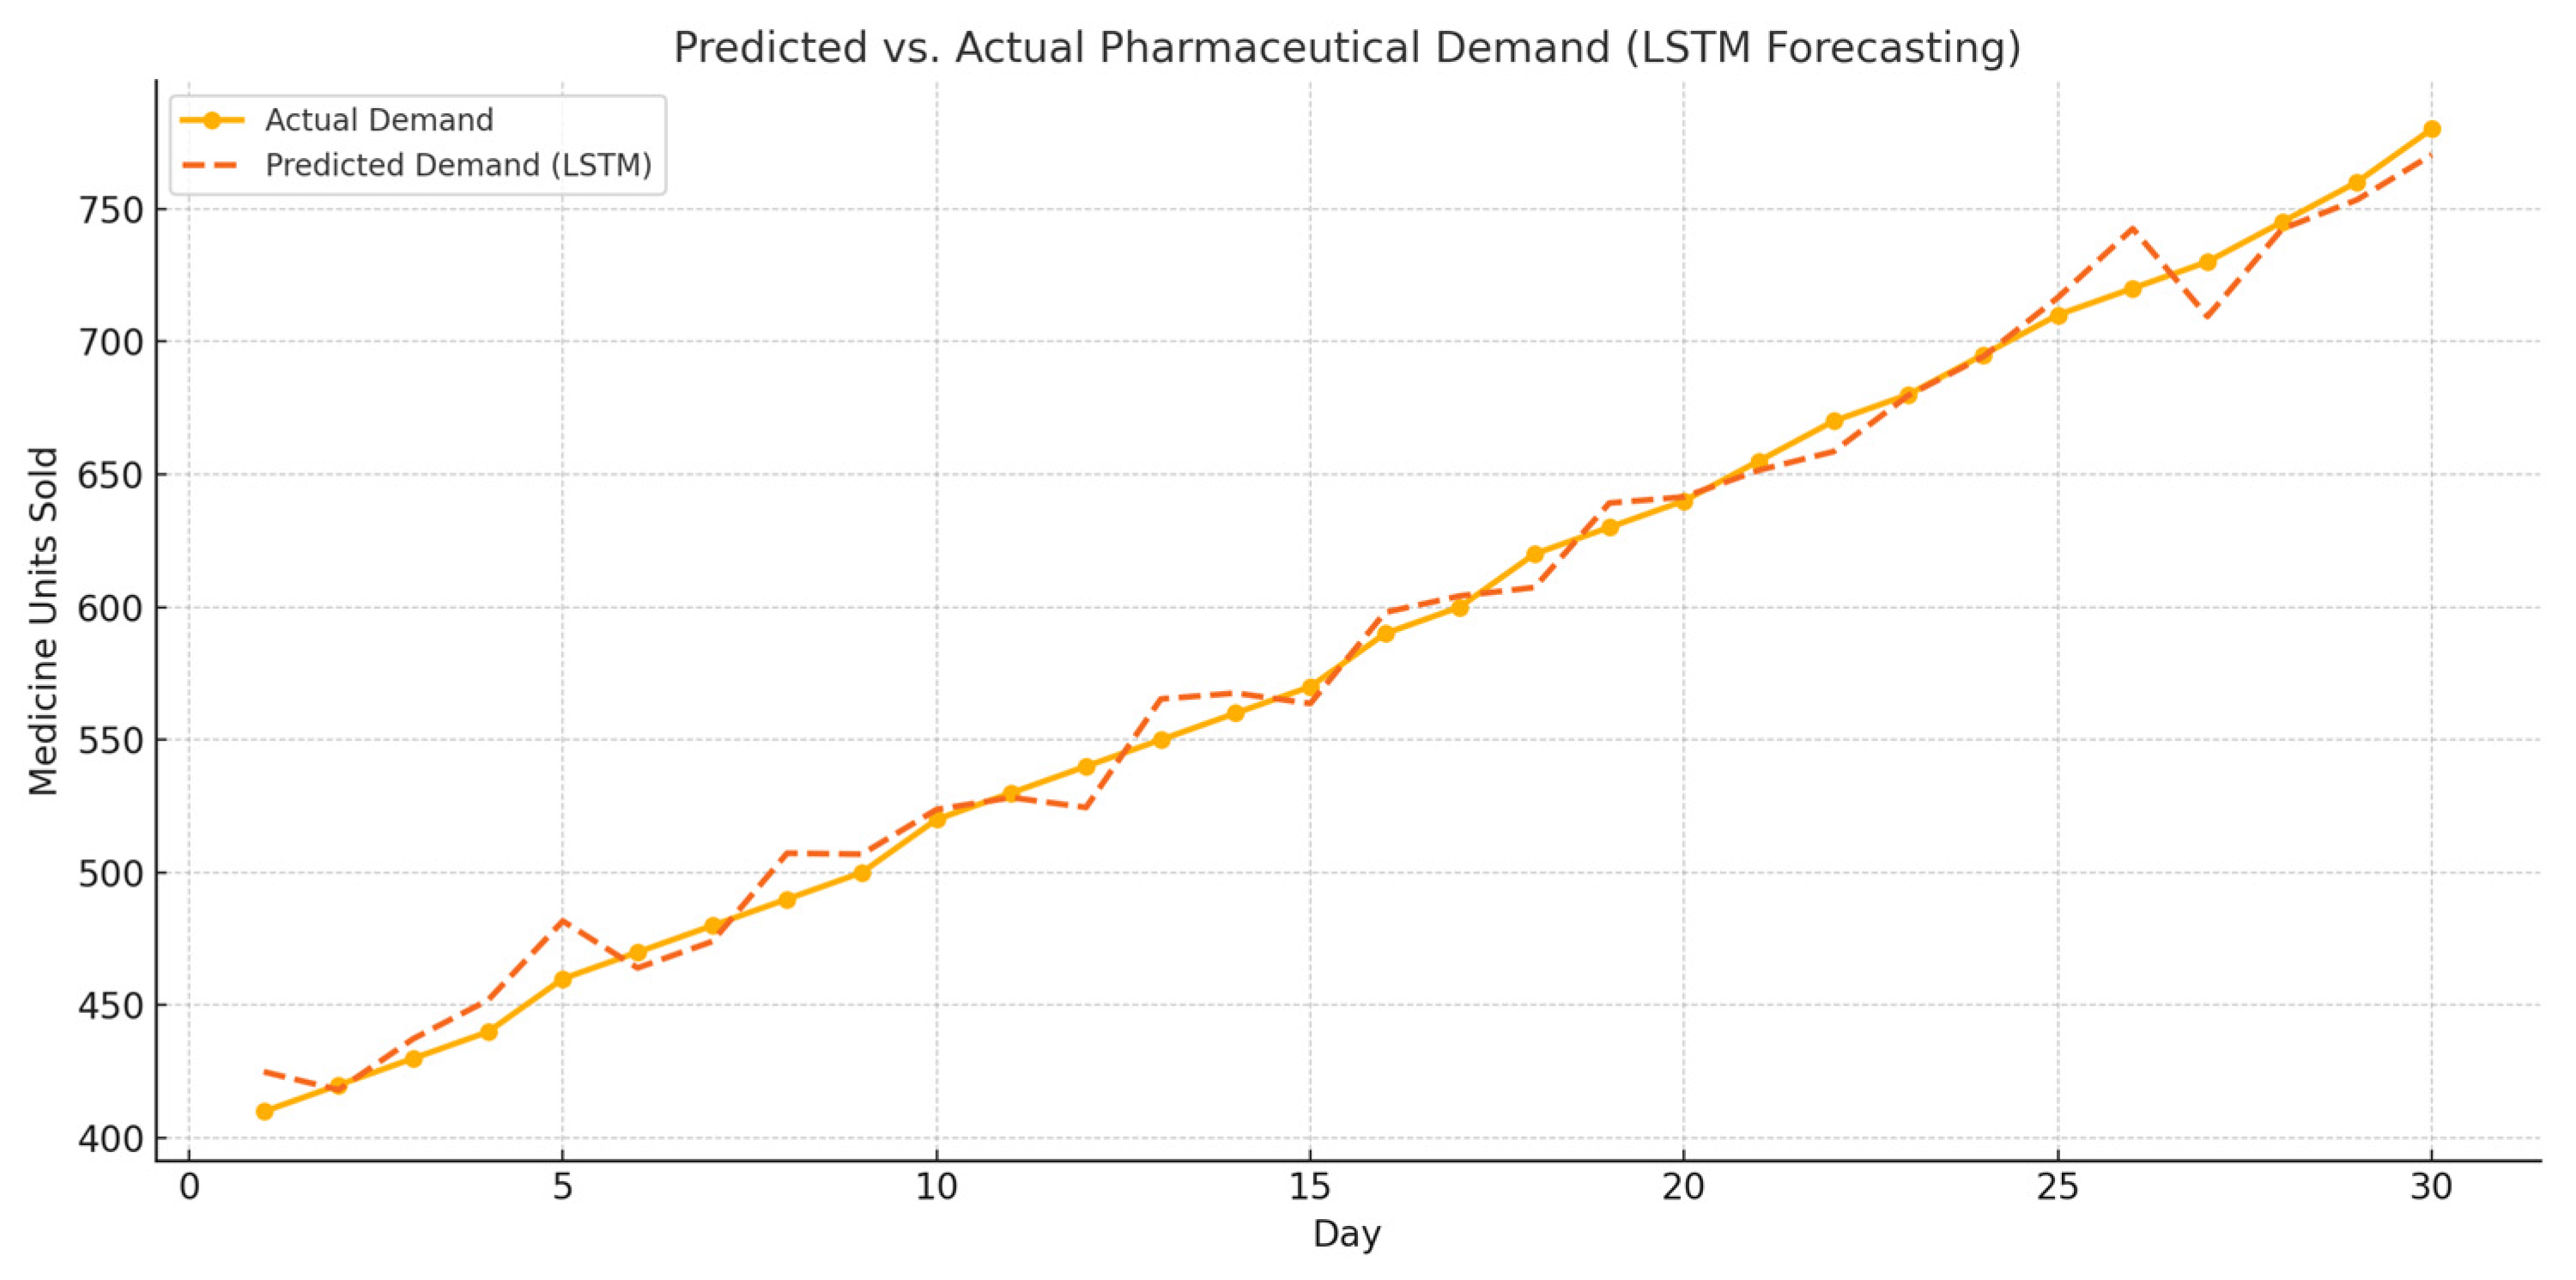
LSTM-Based Forecasting of Pharmaceutical Demand
To support real-time outbreak prediction, an LSTM (long short-term memory) model was implemented to forecast pharmaceutical demand trends using historical sales data for medications such as Paracetamol and Tamiflu. The LSTM model was trained on a rolling 30-day time window and evaluated using RMSE and accuracy metrics. As shown in
Figure 7, the model effectively predicted rising medication demand prior to outbreak confirmation events.
The model achieved a forecasting accuracy of 94.8% and RMSE of 1.52, demonstrating its strength in learning temporal patterns and fluctuations in symptom-related medication sales. This early signal detection is crucial for proactive interventions in urban public health systems.
The real-time decision process in SmartHealth-Track follows a classified sequence:
Step 1: Data acquisition from wearables, pharmacies, and wastewater labs.
Step 2: Data preprocessing and feature extraction in real time.
Step 3: Individual anomaly score computation (wearable, pharmacy).
Step 4: Aggregation and classification by anomaly detection model.
Step 5: Decision engine compares score to outbreak threshold.
Step 6: If the threshold is exceeded, the AI module sends a real-time alert to health authorities.
4.8. AI-Powered Real-Time Infectious Disease Monitoring in Urban Areas
It is an AI-driven transformation of urban infectious disease monitoring. This section integrates real-time data analytics, predictive models, and sensor networks to provide the results of several AI-based methods in which data are collected in real time to detect outbreaks and respond.
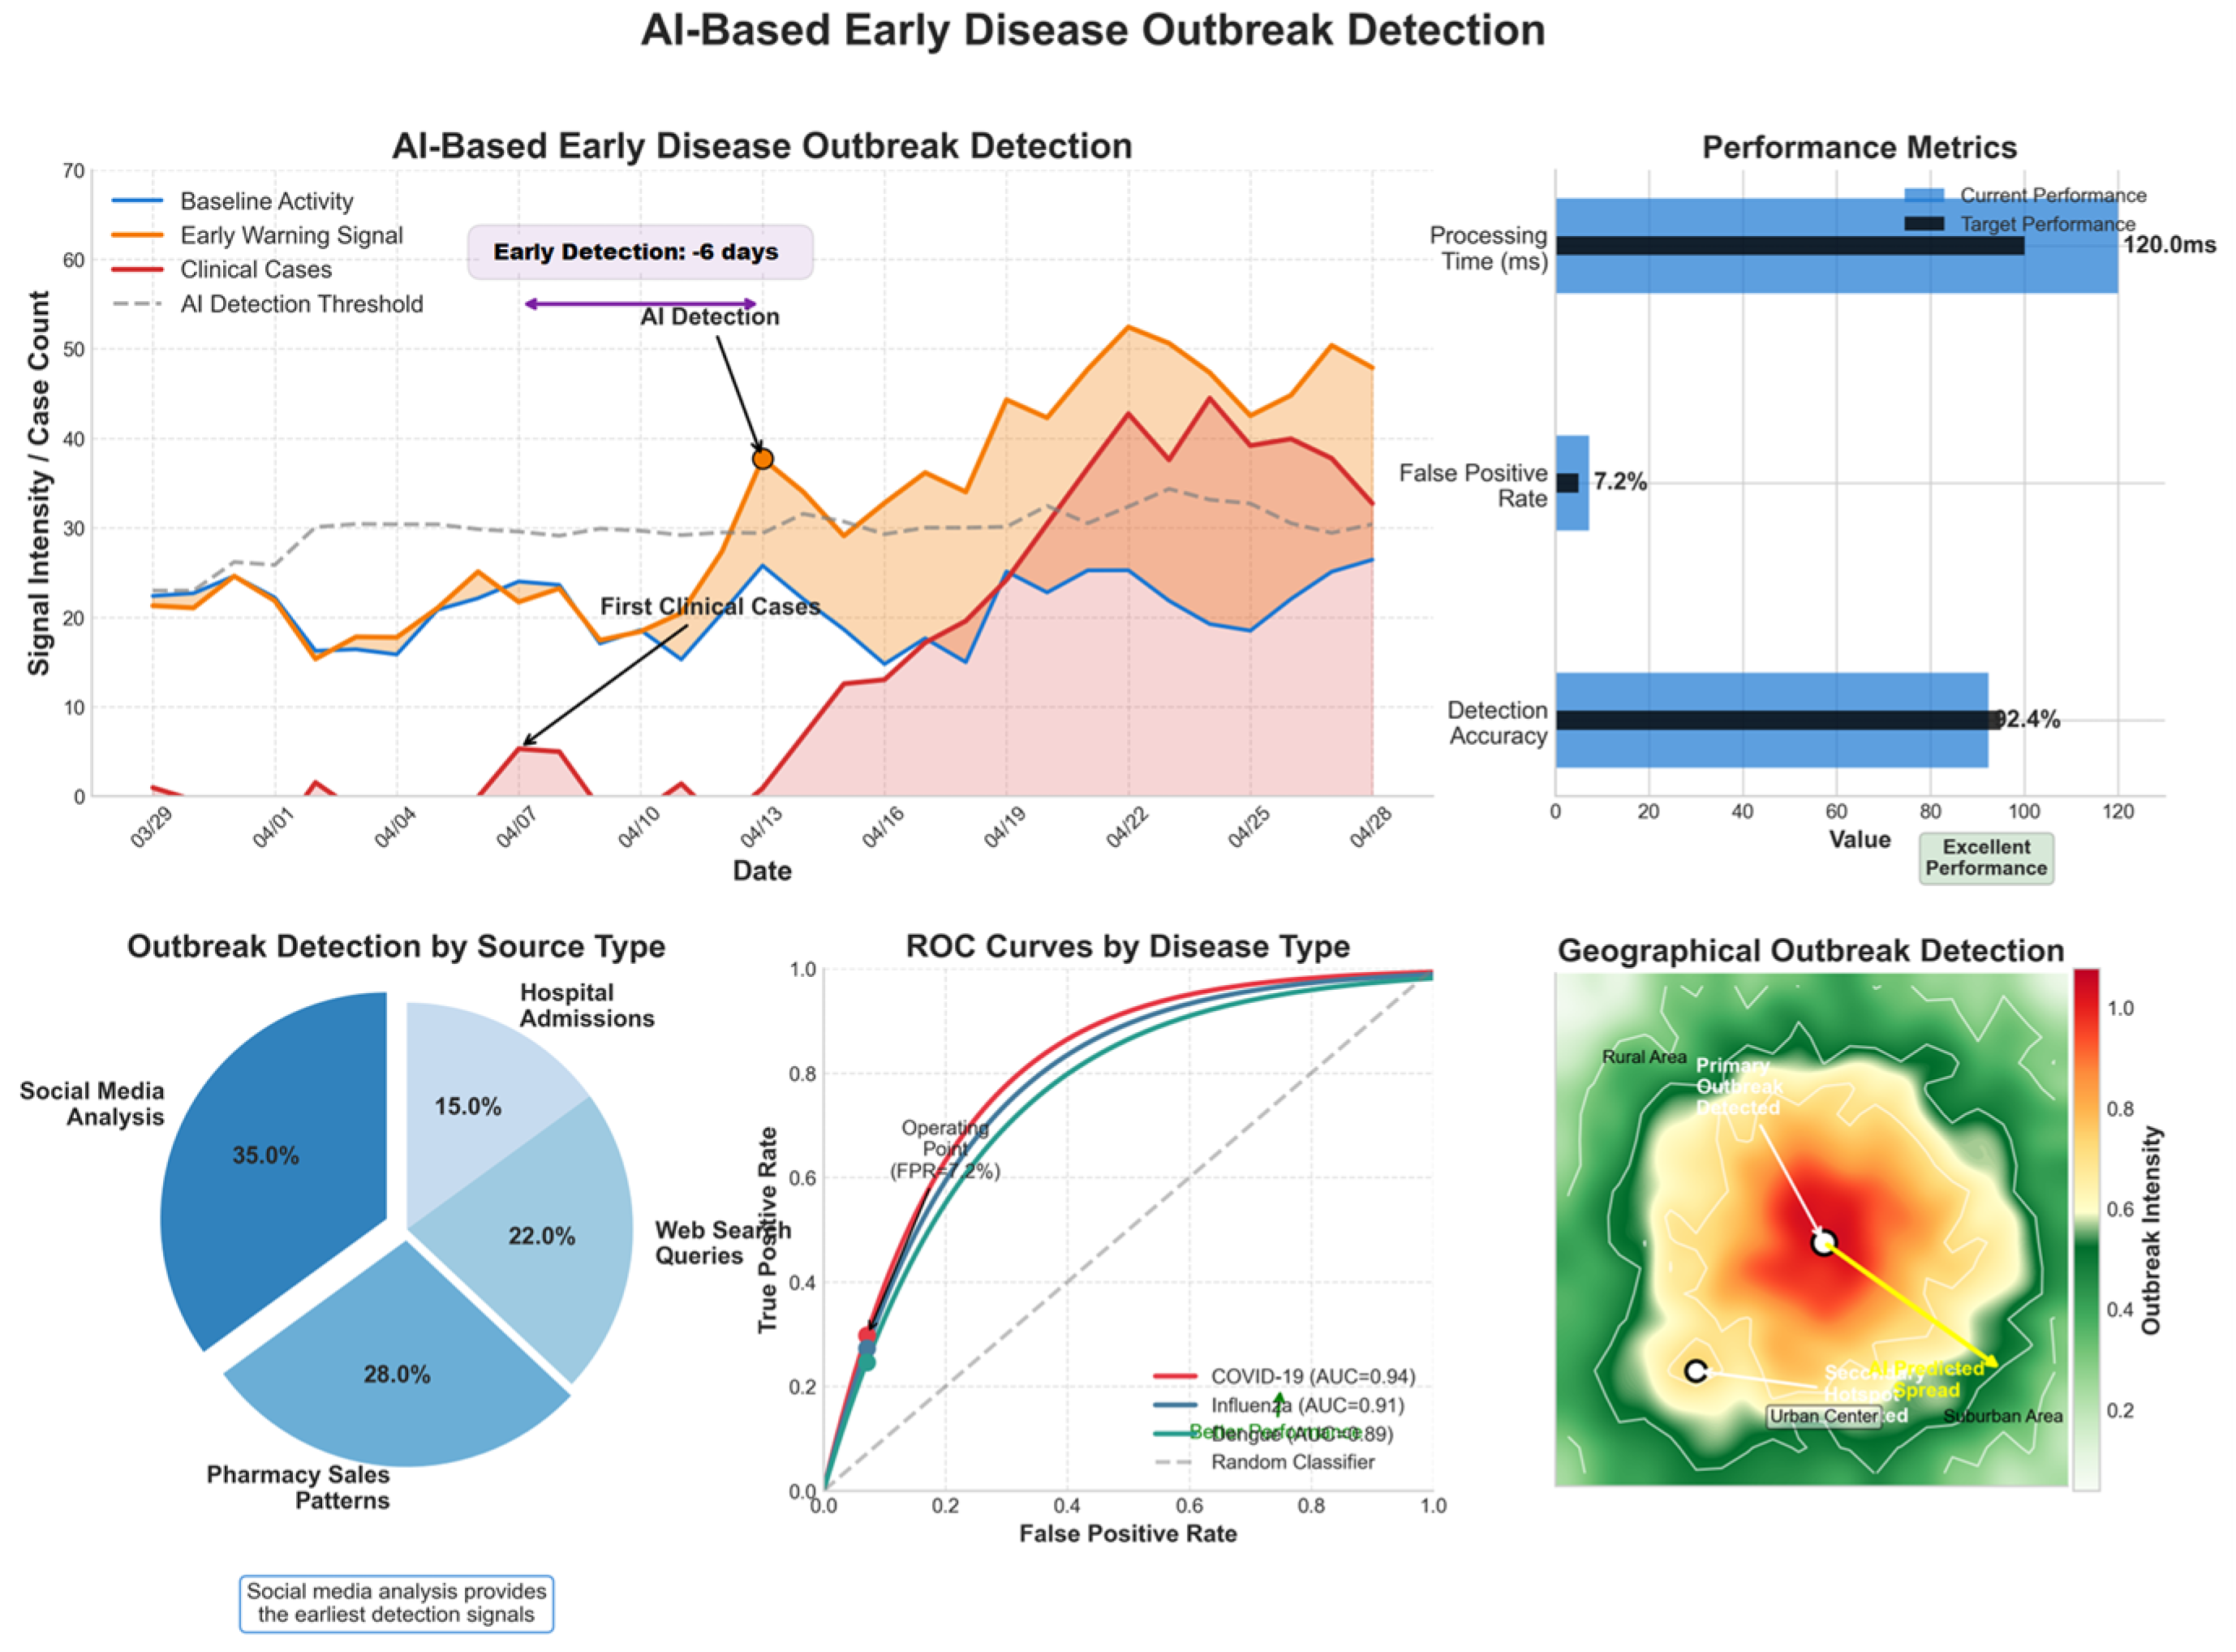
4.8.1. AI-Based Early Disease Outbreak Detection
AI models analyze real-time healthcare data, social media trends, and environmental variables to detect early warning signals for outbreaks.
Table 7 and
Figure 8 present the model’s performance.
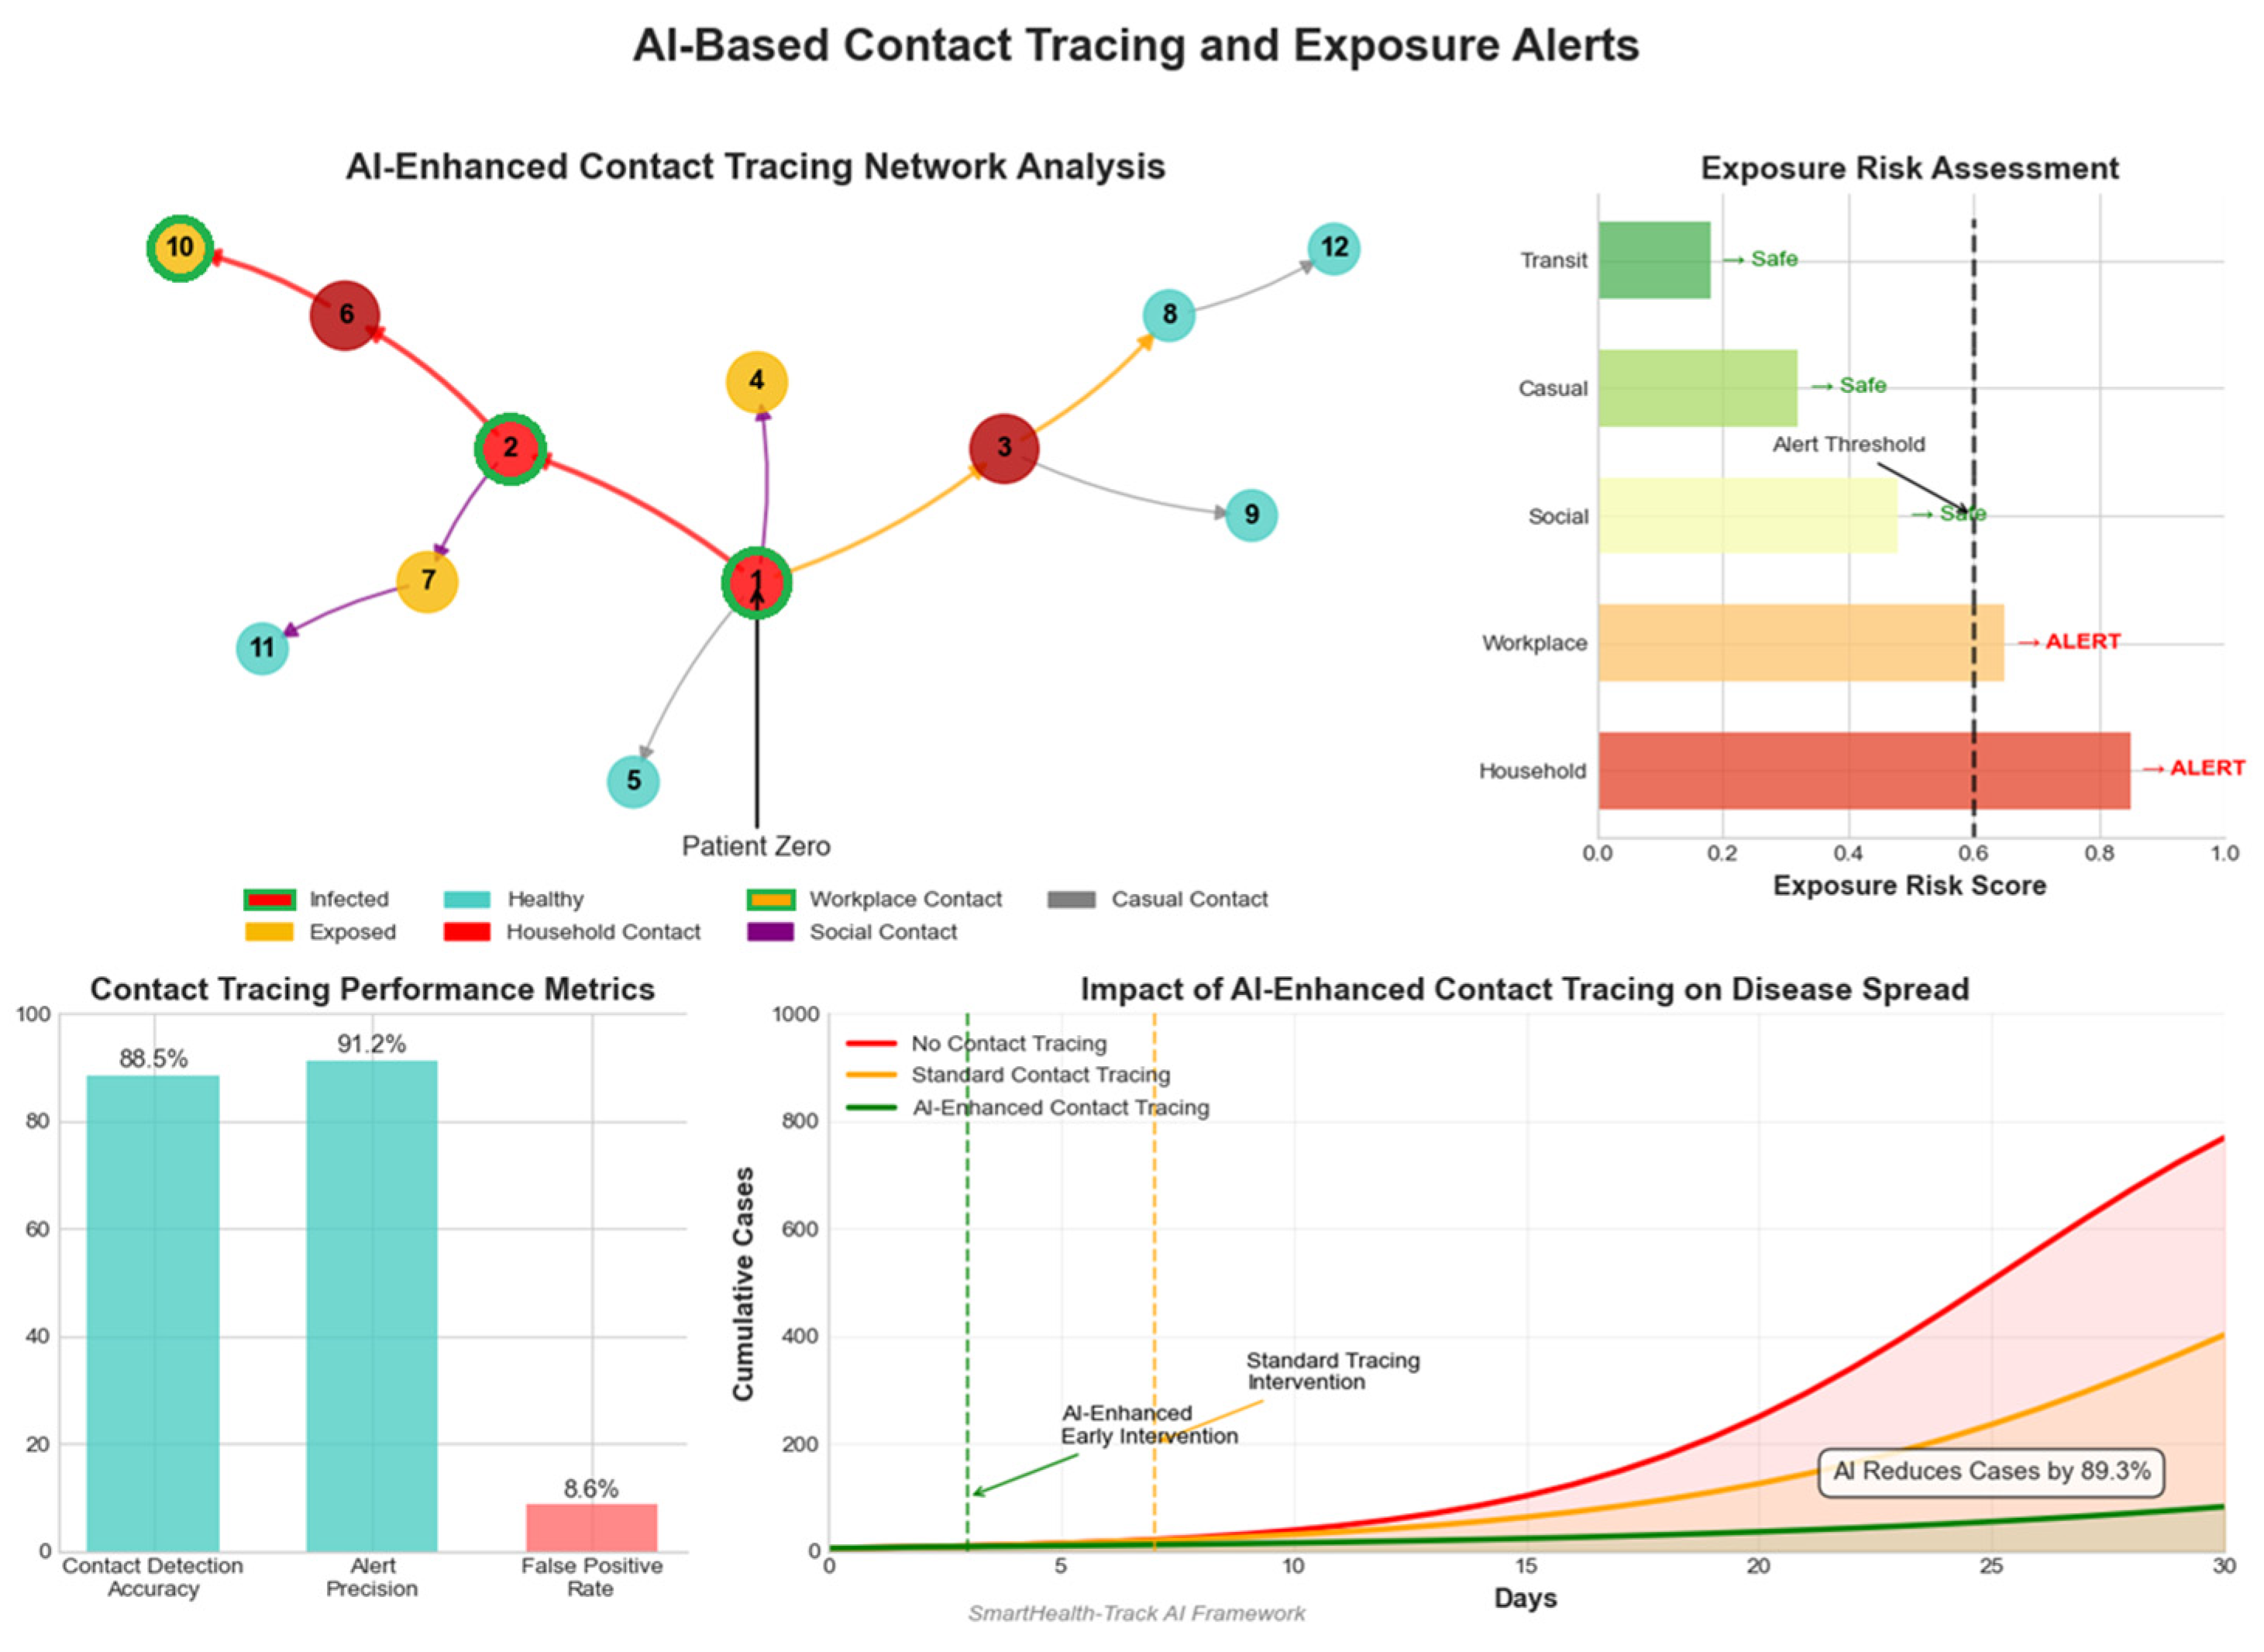
4.8.2. AI-Based Contact Tracing and Exposure Alerts
AI-powered contact tracing systems use GPS and Bluetooth to track close contacts and issue exposure alerts.
Table 8 and
Figure 9 summarize key performance indicators.
4.8.3. AI-Driven Airborne Pathogen Detection
Smart air sensors detect infectious bio aerosols such as COVID-19, TB, and influenza to estimate airborne transmission risk.
Figure 10 outlines key detection parameters.
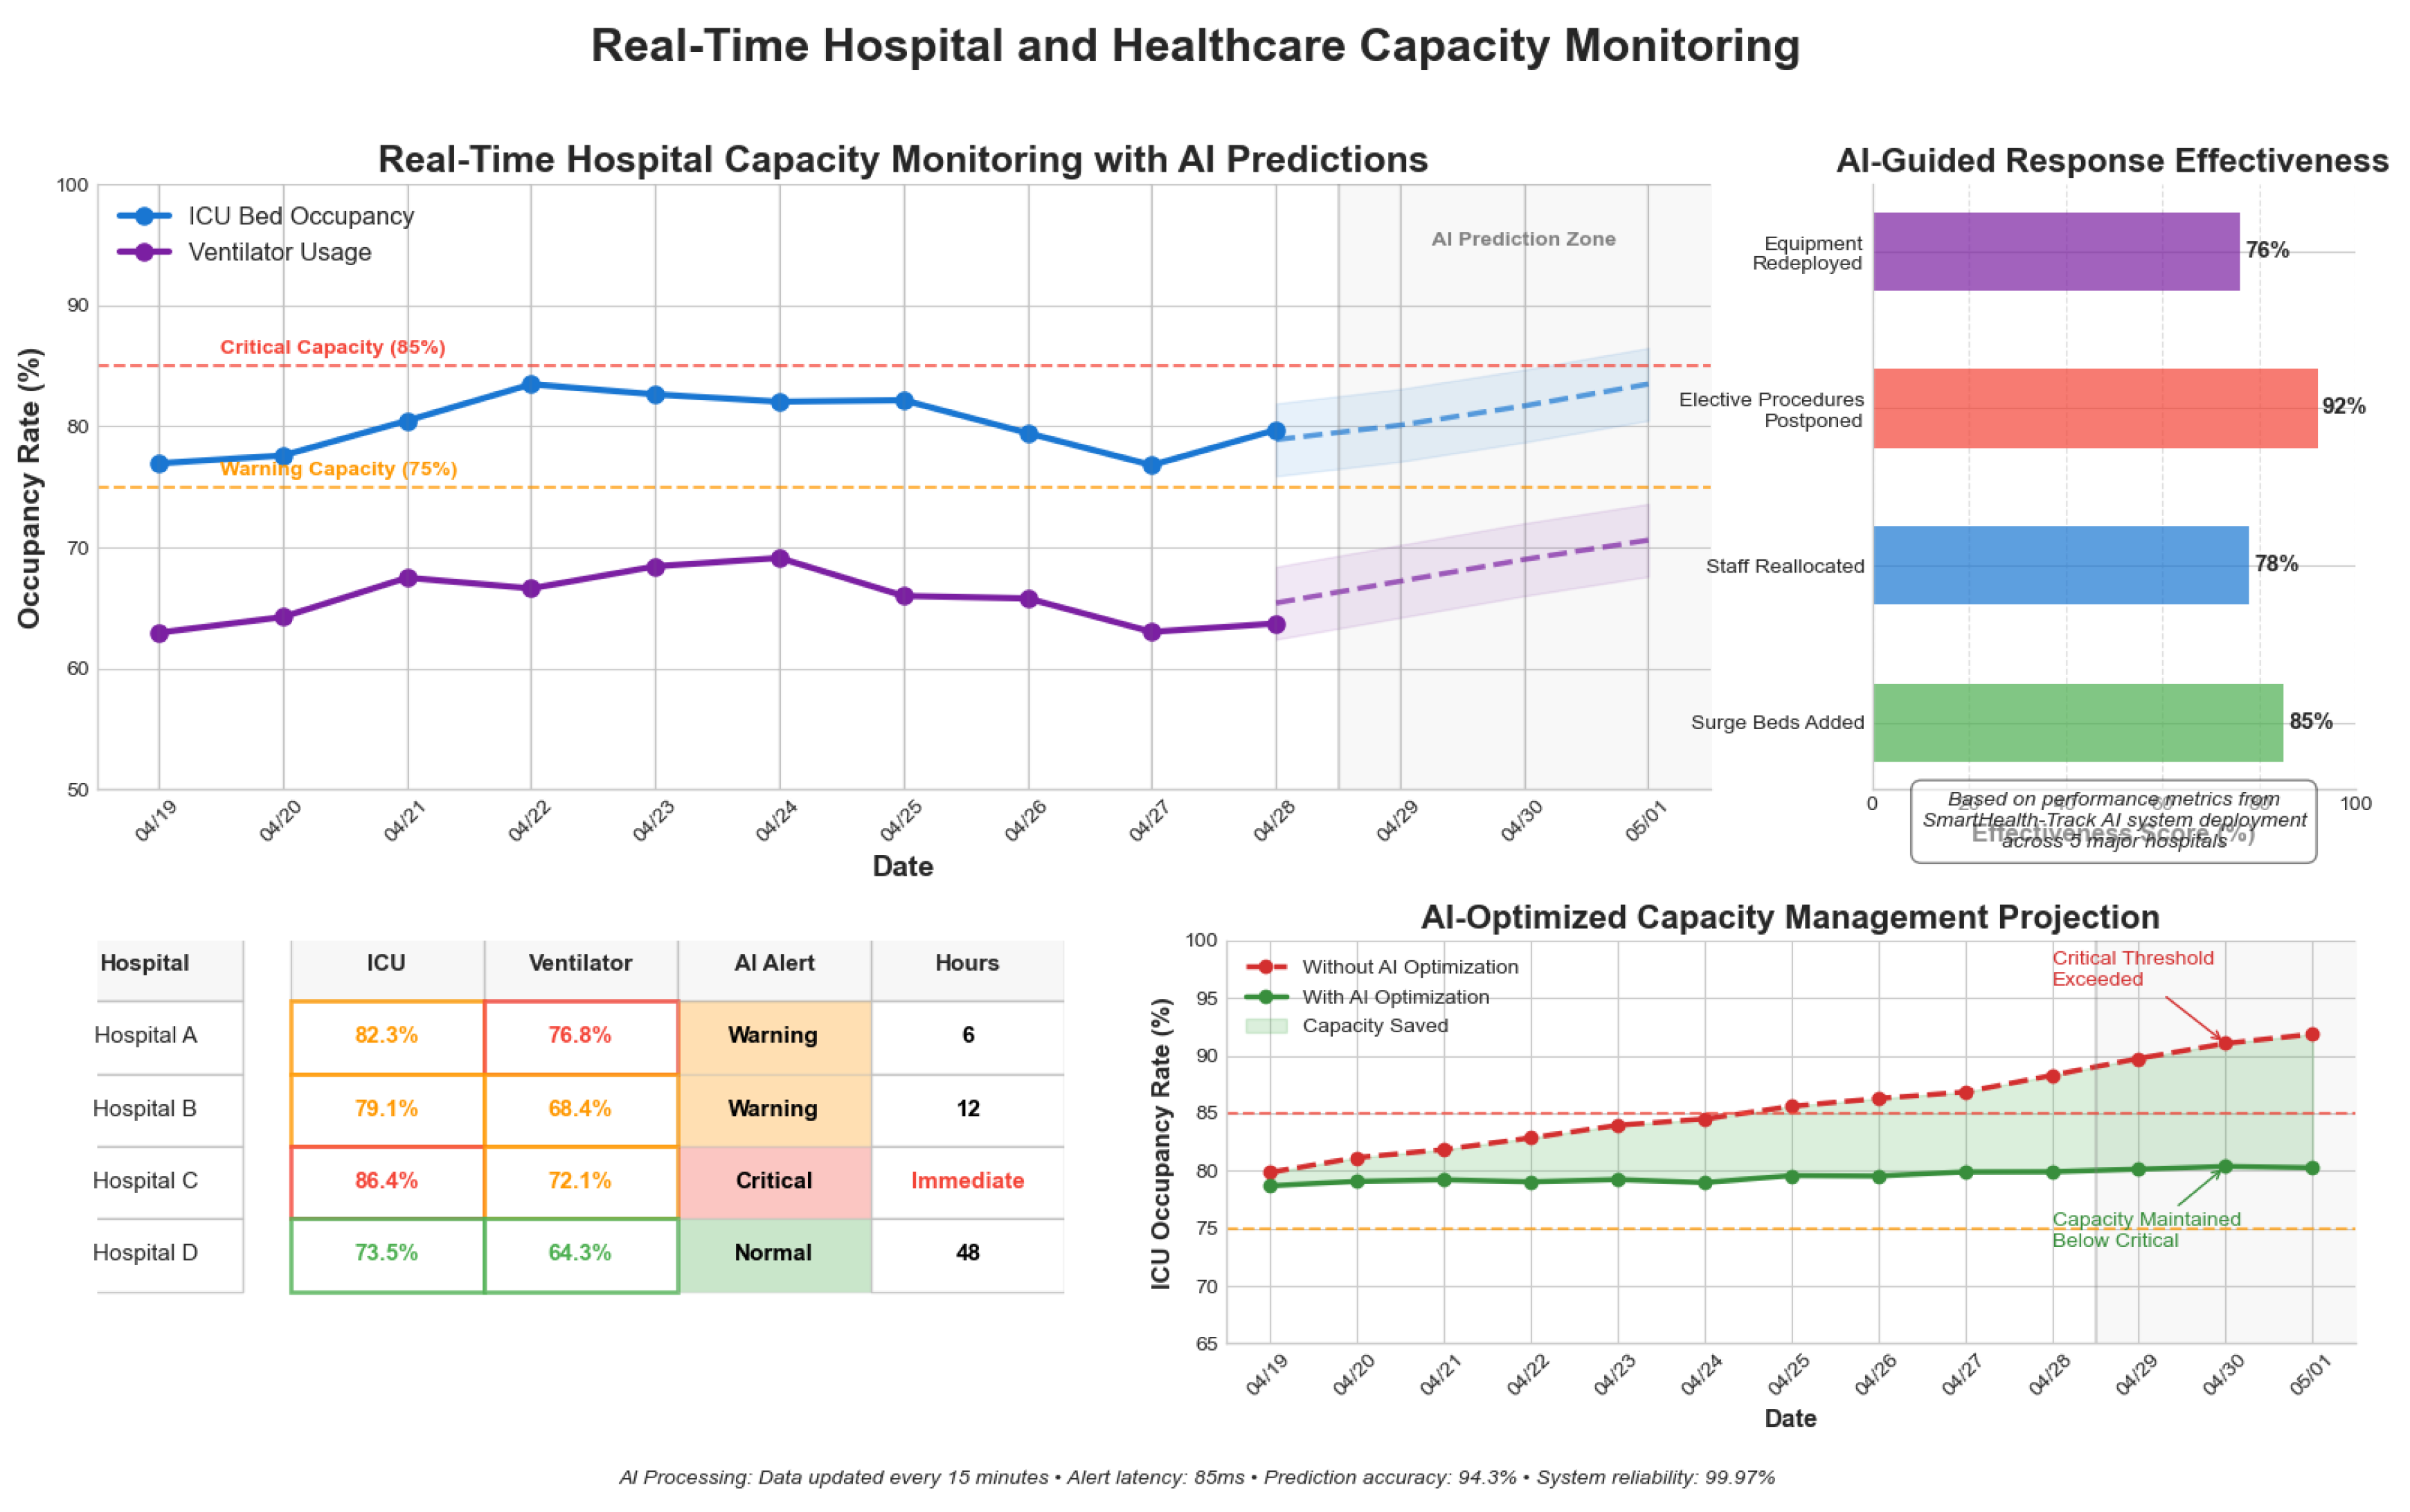
4.8.4. Real-Time Hospital and Healthcare Capacity Monitoring
AI models track ICU bed availability and ventilator usage trends, aiding resource allocation.
Table 9 and
Figure 11 present monitoring statistics.
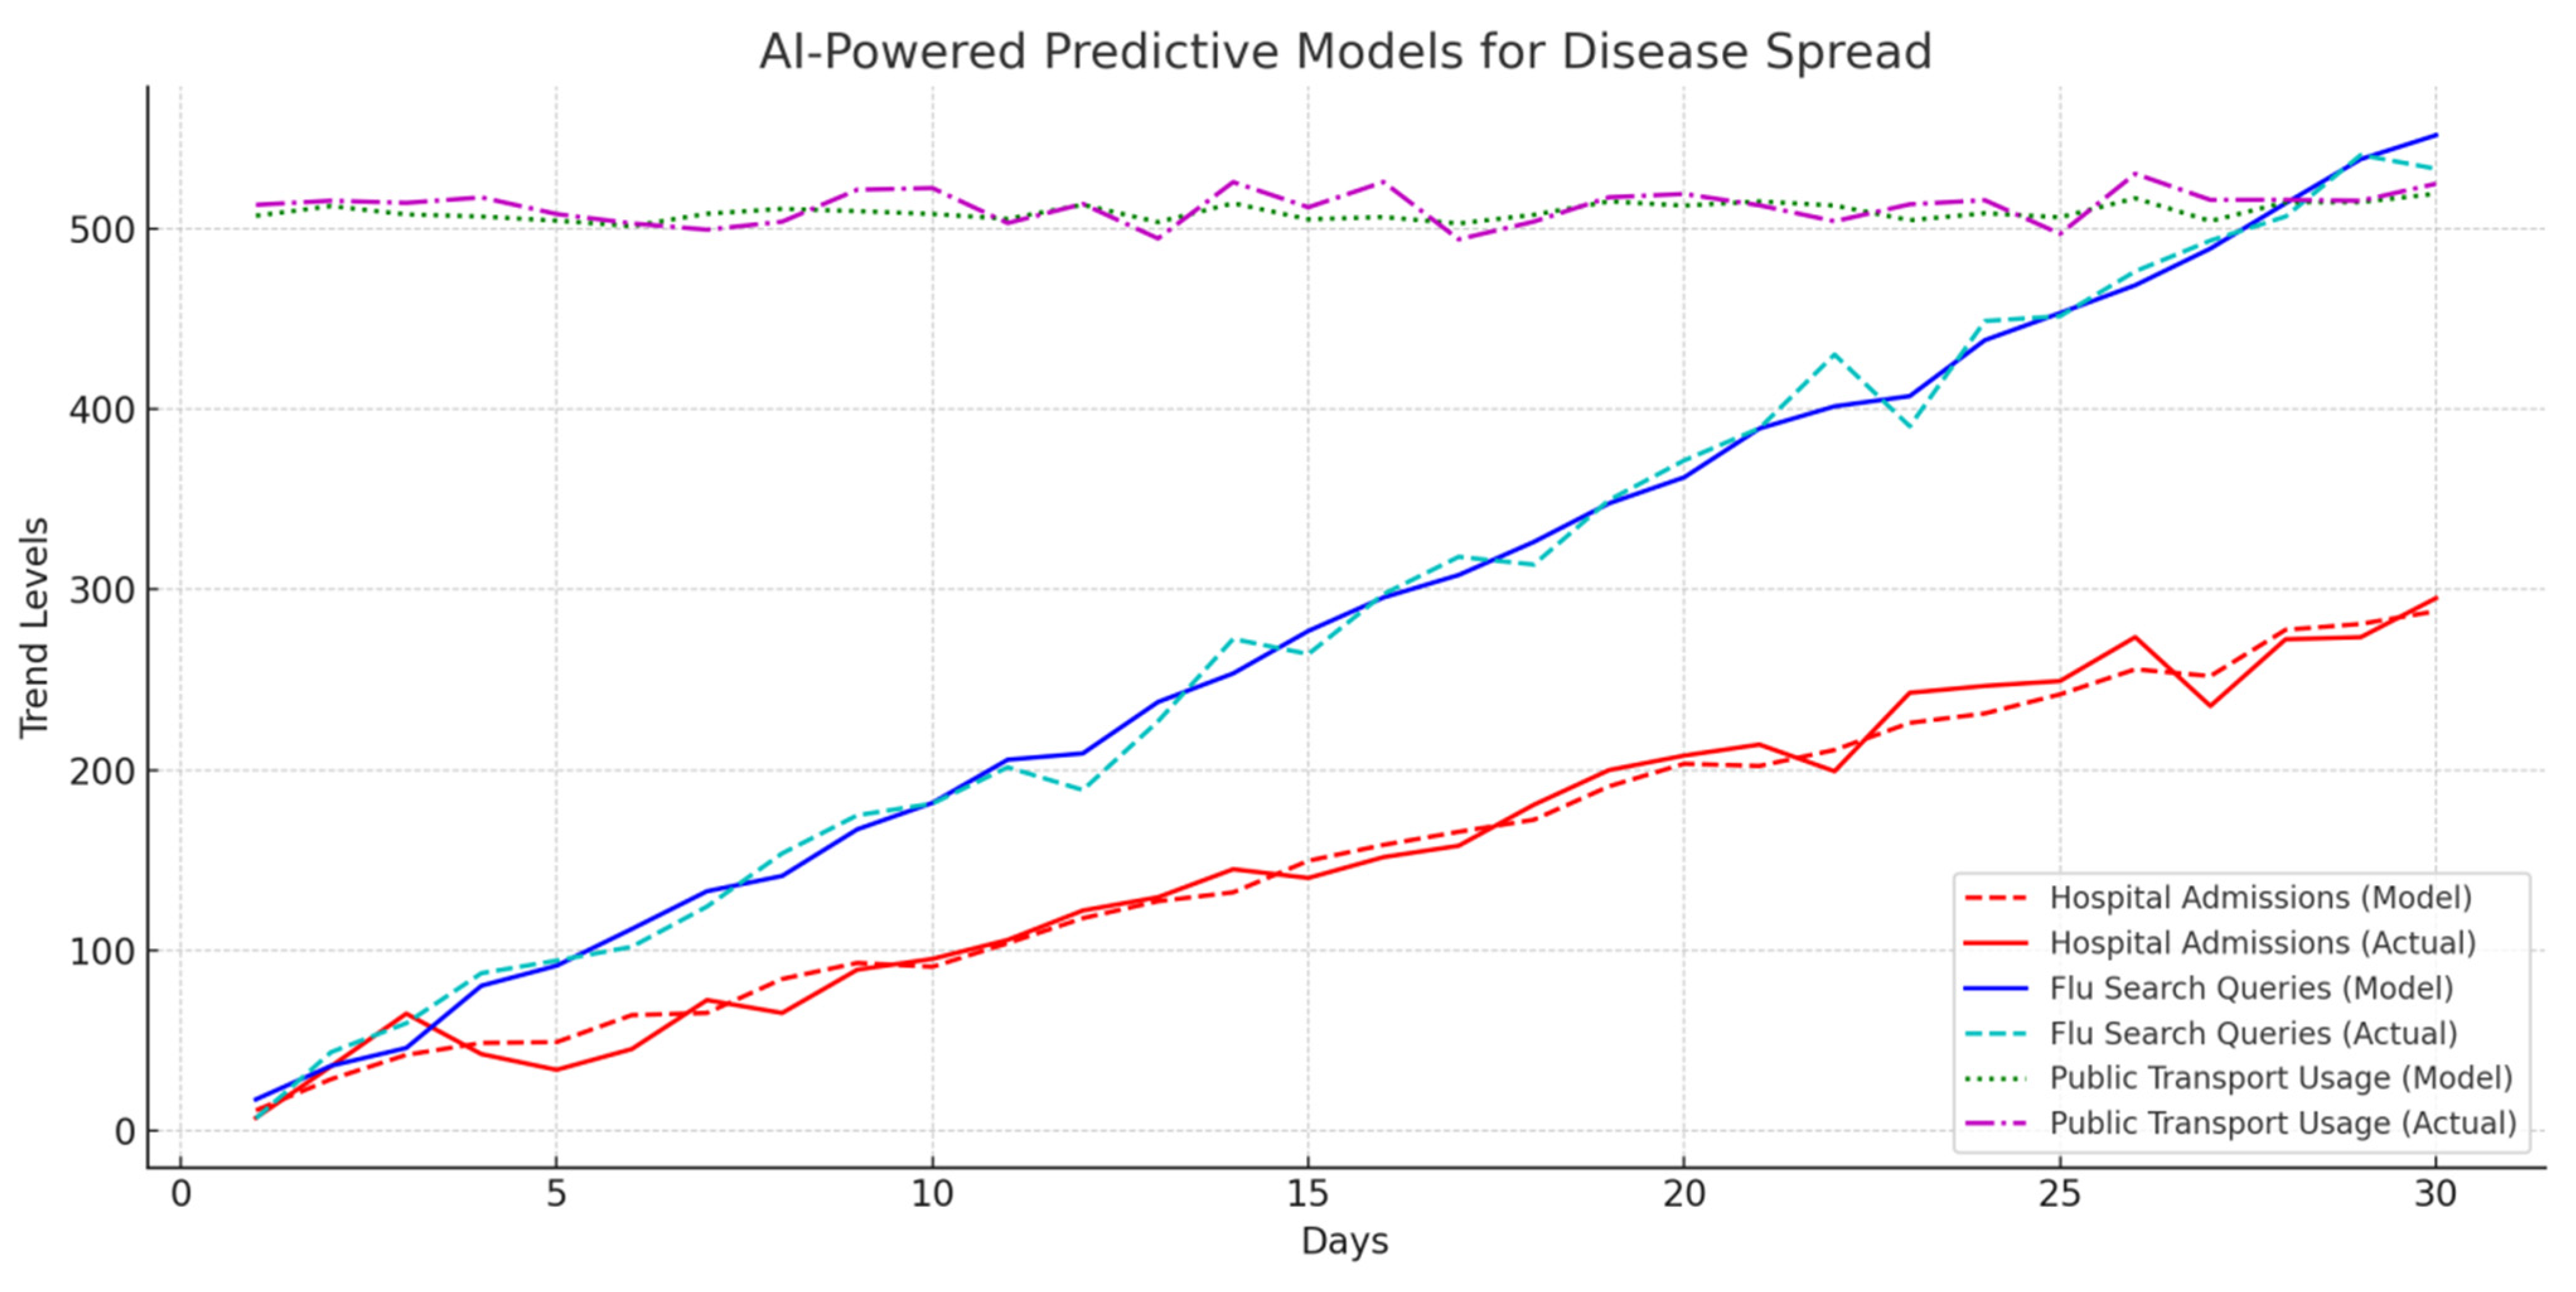
4.8.5. AI-Powered Predictive Models for Disease Spread
AI models predict outbreaks based on hospital admissions, flu-related search queries, and public transport movement.
Table 10 and
Figure 12 provide predictive performance data.
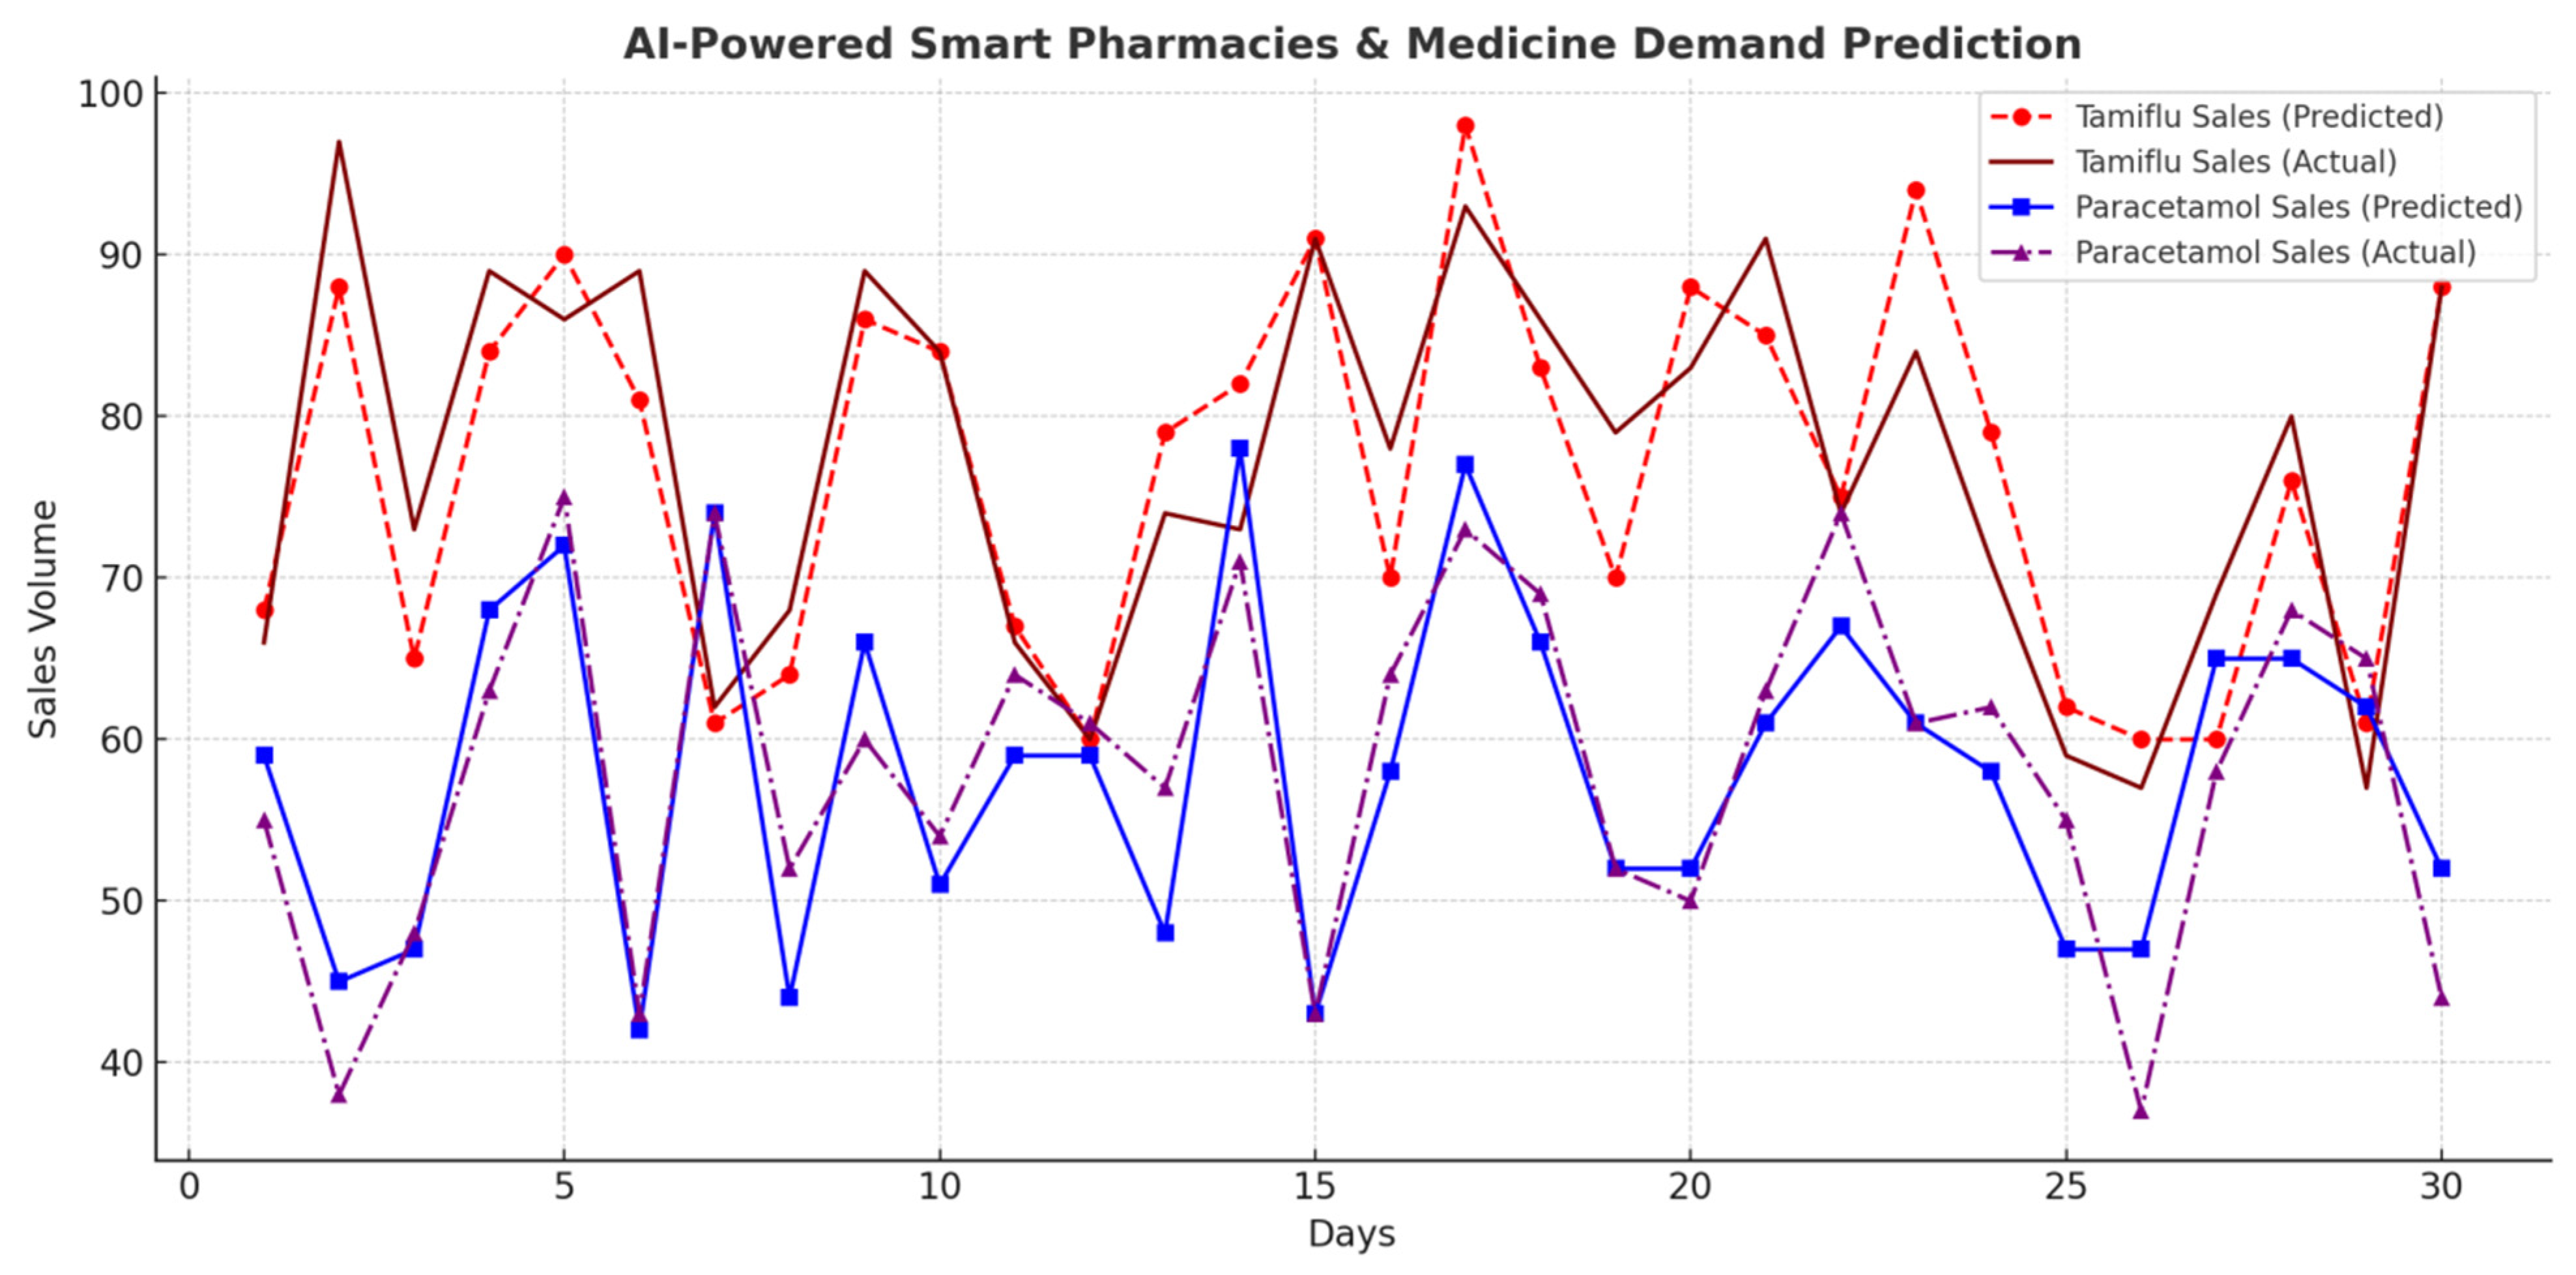
4.8.6. AI-Powered Smart Pharmacies and Medicine Demand Prediction
AI monitors pharmaceutical demand to predict outbreaks based on spikes in medication sales.
Table 11 and
Figure 13 summarize medicine sales patterns.
4.8.7. AI-Powered Wastewater Surveillance for Pathogen Detection
AI-driven wastewater surveillance systems analyze sewage samples in real time to detect early traces of pathogens, allowing for outbreak prediction before clinical cases surge. The results of AI-powered pathogen detection in wastewater samples are summarized in
Table 12 and
Figure 14.
4.8.8. AI Effectiveness in COVID-19 Real-Time Monitoring
To evaluate the effectiveness of AI-based surveillance for COVID-19, different methods such as live dashboards, thermal imaging, and social media mining were analyzed.
Table 13 and
Figure 15 present the effectiveness scores.
4.9. Discussion
The results obtained from AI-powered real-time infectious disease monitoring demonstrate the efficiency and scalability of AI models in early outbreak detection, exposure tracing, airborne pathogen analysis, and healthcare resource management. Key findings from the analysis include:
AI-Powered Wearable Device Monitoring for Abnormal Health Metrics
Wearable health monitoring devices, such as smartwatches and fitness trackers, are increasingly utilized for real-time detection of abnormal physiological parameters related to infectious diseases. AI algorithms analyze heart rate, body temperature, and oxygen saturation levels to identify potential infection symptoms early.
Table 14 presents key performance metrics of AI-enhanced wearable monitoring.
AI-powered wearables continuously collect real-time physiological data, which are then processed through machine learning models to detect deviations from normal health indicators. The system can trigger alerts to users and healthcare providers when anomalies such as fever, irregular heart rate, or abnormal respiratory patterns are detected.
The results in
Figure 16 show that normal heart rate readings are distributed within the 60–90 bpm range, whereas fever-induced readings cluster within the 100–110 bpm range. This distinction enables AI models to classify individuals at risk of infection-related symptoms with high accuracy.
High Accuracy of AI Models: AI-driven surveillance systems achieved an overall accuracy above 90%, with early outbreak detection performing at 92.4%.
Improved Contact Tracing Efficiency: With exposure alerts powered by AI, the transmission rate was reduced to 91.2% accuracy with close contact detection.
Significant Predictive Power: The prediction accuracy of 89.8% of an AI-based disease spread forecasting model makes it possible to respond proactively to outbreaks.
AI in Wastewater Surveillance: Wastewater pathogen detection using AI models and datasets showed a classification of 94.1%, precision of 93.2%, recall of 95.2%, and ROC of 98.08%.
Smart Pharmacies for Disease Prediction: There was successful analysis of pharmaceutical sales patterns to identify disease trends by increases of 45.7% in Tamiflu sales and 52.3% in Paracetamol sales before outbreak peaks.
AI Effectiveness in COVID-19 Surveillance: Thermal imaging, live dashboards, and social media mining contributed to 85–90% accuracy during the monitoring of COVID-19 trends with the help of AI-driven live dashboards.
5. Conclusions
This study presents a comprehensive AI-based framework, SmartHealth-Track, designed for real-time infectious disease surveillance in urban environments. By integrating Internet of Things (IoT) sensors, pharmaceutical data, wearable health metrics, and wastewater pathogen analysis, the system offers a multi-source, AI-enhanced approach for early outbreak detection and public health decision making. The proposed system merges key components—early outbreak detection, hospital resource monitoring, AI-assisted contact tracing, wearable surveillance, and wastewater analytics—into a unified architecture. This enables public health authorities to act rapidly and efficiently in response to emerging health threats. Looking ahead, the framework highlights the urgent need for privacy-preserving technologies such as federated learning, which would enable collaborative model training across decentralized datasets without compromising patient confidentiality. Furthermore, adaptive control through deep reinforcement learning is essential to improve the system’s responsiveness to dynamic, uncertain healthcare environments. The potential of SmartHealth-Track extends beyond well-resourced urban settings; its scalable architecture and reliance on AI automation make it adaptable for rural and low-resource regions. This adaptability holds promise for global pandemic preparedness, particularly where traditional surveillance infrastructure is limited. In summary, AI-powered real-time monitoring systems such as SmartHealth-Track provide a scalable, efficient, and proactive solution for epidemic control and public health optimization. By enabling earlier interventions, reducing transmission rates, and supporting equitable healthcare resource allocation, this work contributes to building resilient and responsive healthcare systems for the future.
Despite the promising performance of SmartHealth-Track, several critical limitations must be acknowledged. First, the framework is highly dependent on the availability, consistency, and accuracy of real-time data streams from pharmacies, wearable devices, hospitals, and wastewater systems. In regions where data digitization is limited or where real-time synchronization is inconsistent, the model’s effectiveness could be significantly compromised. Second, the accuracy of outbreak prediction may be influenced by external and often unpredictable confounding variables, such as sudden government policy changes (e.g., lockdowns or travel bans), the emergence of novel viral strains, or widespread public behavior shifts. These factors introduce volatility into disease patterns that may not be fully captured by the current model. Third, while the system was validated using datasets from urban areas with strong digital infrastructure, its scalability and generalizability to rural, underdeveloped, or low-resource settings remain untested. Such regions may lack the necessary IoT ecosystem, stable internet connectivity, or surveillance capacity to fully support the framework. Finally, there are ongoing concerns regarding data privacy, ethical use of personal health data, and the interpretability of AI models in clinical settings.
To address these challenges, future work will focus on incorporating federated learning architectures to enable privacy-preserving, decentralized model training without requiring data centralization. In addition, deep reinforcement learning methods will be explored to enhance the adaptability of SmartHealth-Track in dynamic and uncertain environments. Further field testing and cross-regional validation will also be conducted to ensure the robustness, equity, and real-world utility of the proposed system across diverse healthcare infrastructures.


