1. Introduction
With the progress of science and technology and the development of the economy, the demand for mineral resources continues to rise [
1]. However, at present, the development of mineral resources is carried out at a high intensity, and the comprehensive utilization rate of resources is relatively low. The difficulty of deep geological exploration has increased, and the sustainable supply capacity of minerals shows a downward trend. How to improve the efficiency of resource utilization and reduce the loss rate has become a core issue that urgently needs to be solved for the sustainable development of the mining industry.
At present, ore blending optimization has been widely applied in actual mine operations. In the 1970s, German scholars F.L. Wilke and T.H. Reimer [
2] jointly wrote a research paper. In this paper, the two scholars first proposed applying the linear programming method to the formulation of short-term production quality plans. This innovative application enabled linear programming to start playing a role in the ore blending process of mine production. Scholars such as Boucher [
3] constructed a mine production scheduling model based on stochastic integer programming. This model integrated multi-source geological uncertainty factors and was successfully applied to the production scheduling practice of the Central No. 1 deposit in Western Australia. Lamghar et al. [
4], aiming at the problem of metal grade uncertainty in open-pit mine production scheduling, developed a meta-heuristic algorithm based on tabu search. Shishvan et al. [
5] proposed a meta-heuristic algorithm framework based on ant colony optimization for the optimization of open-pit mine production plans to maximize economic benefits. Gholamnejad et al. [
6] established a multi-objective linear programming model. By integrating low-grade and high-phosphorus iron ore inventory resources, they achieved product quality optimization and systematically considered the grade stability constraints in the multi-stage blending process. Wu et al. [
7] proposed an ore blending optimization method based on the artificial bee colony (ABC) algorithm. Taking the minimum fluctuations of ore grade, mining transportation cost, and production capacity as the objective function, they established a multi-objective ore blending optimization model for polymetals. Moreno et al. [
8] regarded inventory as a part of the open-pit mine scheduling strategy and proposed multiple models to solve the OPMPS problem.
In the actual production process of mining areas, due to the complexity of the mining system, considering a single objective can no longer meet the needs of real production and life. At this time, researchers need to consider the optimization problem of multiple objectives simultaneously [
9]. Multi-objective algorithms are widely used in various fields to solve multi-objective optimization problems [
10,
11]. NSGA-II is a multi-objective evolutionary algorithm proposed by Kalyanmoy Deb [
12] and others in 2000. It is an improvement of NSGA, aiming to solve multi-objective optimization problems more effectively and find the Pareto optimal solution set [
13,
14]. NSGA-II is widely applied in multi-objective optimization problems such as engineering design, resource allocation, and multi-objective scheduling.
Matter-element extension is an evaluation method, mainly applied to address the incompatibility between functional objectives and environmental conditions [
15,
16,
17]. It is suitable for multi-factor evaluation. Compared with traditional decision-making methods, the matter-element extension method is more scientific and reasonable in handling incompatibility issues [
18]. Due to the existence of numerous contradictory issues in the field of ore blending itself, there is incompatibility among various objective functions [
19]. When selecting the optimal ore blending scheme, the objective functions are incompatible and independent of each other. Therefore, it is extremely appropriate to use the matter-element extension method for the selection of the optimal ore blending scheme.
However, the matter-element extension method also has certain limitations. If it is directly applied to ore blending decision-making, it will have a certain adverse impact on the optimal ore blending scheme, resulting in inaccurate results.
Therefore, it is necessary to make certain improvements to the classical matter-element extension model so that it can make more accurate decision-making for solutions. Wang, B, et al. [
20] constructed an improved matter-element extension model to evaluate the current situation of shoreline planning and utilization in typical regions. Zhao, DY, et al. [
21] proposed a method for predicting the evolution of weak signals in the new product development process based on the improved matter-element extension model. Li, SY, et al. [
22] improved the matter-element extension model to quantify energy sustainability. Liang, GQ, et al. [
23] proposed a hybrid model of matter-element extension based on TOPSIS and KPCA-NSGA-II-LSSVM, which is applied to evaluate the core competitiveness of clean energy incubators.
In the scenario of complex polymetallic mines, the traditional ore blending mode has defects such as the strong dynamics of the mining environment, great difficulty in multi-objective coordination, and sluggish decision-making response. These defects lead to practical dilemmas such as a high resource loss rate, insufficient recovery of low-grade ores, and a shortened service life of mines. Studying a dynamic ore blending optimization method suitable for polymetallic mines and formulating mine production plans more scientifically and effectively are of great significance for mines to increase ore reserves, fully recover low-grade ores, extend the service life of mines, and improve comprehensive economic benefits. Therefore, in view of the weak research environment regarding ore blending in polymetallic open-pit mines, this study established an ore blending model for polymetallic open-pit mines, using the NSGA-II algorithm to obtain the optimal solution set, and made decisions on the optimal ore blending scheme through the improved matter-element extension ore blending decision-making. The scheme was applied to Dabaoshan Mine for a case analysis, forming an ore blending solution suitable for the complex mining environment of polymetallic open-pit mines.
2. Materials and Methods
2.1. Construction of the Ore Blending Model
2.1.1. Identification of Ore Blending Factors
The production of polymetallic mines is affected by multiple factors, and the production has characteristics such as multi-stage, multi-variable, multi-objective, multi-constraint, and multi-level [
24]. As a complex mining system project, the factors that need to be considered are relatively complicated and are interconnected with each other.
Combining the actual situation of mine mining and previous studies, and comprehensively considering the benefits and production needs, this study summarizes [
25] the factors that need to be considered in the ore blending process. These mainly include mine transportation [
26], ore grade [
27], ore components, stockyard factors, and the requirements of the concentrator.
Based on the complex occurrence conditions of polymetallic mines and the special needs of the dynamic mining process, after considering the actual situation of open-pit mining of polymetallic mines and combining with the current research status, starting from the basic objectives of ore blending, this paper establishes a multi-objective function with the minimum deviation of the total amount of polymetallic ores and the minimum deviation of the grade of polymetallic ores.
Comprehensively considering the influencing factors of ore blending and focusing on the limitations of mine production capacity, six major constraints are constructed, including the constraint of maximum transportation work, the constraint of the concentrator’s grade fluctuation requirement, the constraint of the concentrator’s production capacity, and the constraint of the stockyard’s ore storage capacity.
2.1.2. Objective Function of Ore Blending
(1) Minimize the deviation of the total amount of ores in open-pit polymetallic mines
where
represents the ore mining amount of the
-th bench and
represents the sum of the mining quantities of all types of ores on the
-th bench.;
represents the maximum production capacity;
represents the mining quantity of the
-th type of ore on the
-th bench; and
represents the serial number of the ore type.
(2) Minimize the deviation of grades of polymetals
where
is the mining quantity of the
-th type of ore on the
-th bench;
is the grade value of the
-th type of ore on the
-th bench;
represents the target grade value required by the concentrator for the
-th type of ore;
is a non-negative weight, indicating the degree of stability requirement for the grade of this metal component during the mine production process;
represents the total amount of ores planned to be produced in the ore blending; and
represents the mining quantity of the
-th type of ore on the
-th bench.
2.1.3. Constraint Conditions
(1) Constraint of Maximum Transportation Work
where
is the mining quantity of the
-th type of rock on the
-th bench;
is the transportation distance from the
-th type of rock on the
-th bench to the designated point; and
is the maximum transportation work limit required by the mine production.
(2) Constraint of Grade Fluctuation Requirement of the Copper Concentrator
where
represents the mining quantity of ore containing Cu on the
-th bench;
represents the grade of Cu on the
-th bench;
represents the total mining quantity;
represents the minimum grade requirement of Cu by the concentrator; and
represents the maximum grade requirement of Cu by the concentrator.
(3) Constraint of Grade Fluctuation Requirement of the Sulfur Concentrator
where
represents the mining quantity of ore containing S on the
-th bench;
represents the grade of S on the
-th bench;
represents the total mining quantity;
represents the minimum grade requirement of S by the concentrator; and
represents the maximum grade requirement of S by the concentrator.
(4) Constraint of Grade Fluctuation Requirement of the Zinc Concentrator
where
represents the mining quantity of ore containing Zn on the
-th bench;
represents the grade of Zn on the
-th bench;
represents the total mining quantity of ore containing Zn;
represents the minimum grade requirement of Zn by the concentrator; and
represents the maximum grade requirement of Zn by the concentrator.
(5) Constraint of the Maximum Production Capacity of the Concentrator
where
represents the total amount of ores sent to the concentrator; and
represents the maximum production capacity of the concentrator.
(6) Constraint of the Maximum Ore Storage Capacity of the Stockyard
where
represents the total amount of ores sent to the stockyard; and
represents the maximum ore storage capacity of the stockyard.
2.2. Non-Dominated Sorting Genetic Algorithm II
NSGA-II is a multi-objective evolutionary algorithm proposed by Kalyanmoy Deb and others in 2000. It is an improvement of NSGA, aiming to solve multi-objective optimization problems more effectively and find the Pareto optimal solution set. NSGA-II is widely applied in multi-objective optimization problems such as engineering design, resource allocation, and multi-objective scheduling [
13,
28].
NSGA-II adopts the fast non-dominated sorting algorithm, reducing the computational complexity from to , where is the number of objectives and is the population size. This enables the algorithm to quickly perform non-dominated sorting on individuals when dealing with large-scale populations and multi-objective problems, greatly improving the computational efficiency.
Through the elitist strategy, the current optimal individuals are retained during the selection operation. This avoids the need to regenerate the already-found excellent solutions during the evolutionary process. As a result, the computational workload is reduced, the convergence speed is accelerated, and the operational speed and robustness of the algorithm are improved.
Its principle and process are as follows:
① Initialization of the population: Similar to the Genetic Algorithm (GA), a group of initial individuals is randomly generated to form the population.
② Non-dominated sorting: Conduct non-dominated sorting on the individuals in the population.
③ Calculate the crowding distance: For each individual within each rank, calculate its crowding distance. The calculation formula for the crowding distance is as follows:
where
and
represent the function values of adjacent individuals for the objective
, respectively, and
and
are the maximum and minimum values of the objective
, respectively. This crowding distance ensures the uniform distribution of solutions in each non-dominated layer.
④ Selection, Crossover, and Mutation: Adopt a tournament selection strategy, combining individual ranks and crowding distances to select individuals for genetic operations. Crossover and mutation operations are similar to those in GA, but in NSGA-II, these operations aim to maintain population diversity and convergence toward the Pareto front. The step-by-step flowchart for elitist strategy execution is shown in
Figure 1.
⑤ Generate offspring population: Generate the offspring population through selection, crossover, and mutation. Merge the parent and offspring populations to form a new population.
⑥ Repeat operations: Repeat steps such as non-dominated sorting, calculating crowding distances, selection, crossover, and mutation on the new population until the termination condition is met.
2.3. Improved Matter-Element Extension Ore Blending Model
2.3.1. Matter-Element Extension Method
The matter-element extension method is a method for solving contradictory problems developed based on the extension theory, which was founded by Chinese scholar Cai Wen [
29]. A triple composed of a thing, its characteristics, and the corresponding quantitative values is taken as the basic element to describe the thing, simply referred to as the matter-element, denoted as
, where
represents the thing,
represents the characteristic, and
is the quantitative value of
with respect to
. In practice, the thing
usually has more than one characteristic. Its multiple characteristics can be represented by
, and the corresponding quantitative values can be represented by
. In this case, the matter-element matrix
is as follows:
The extensible set is an extension of the classical set, which introduces the correlation function to describe the relationship between elements and the set. In classical sets, the relationship between an element and the set is binary (“belongs to” or “does not belong to”), whereas in extensible sets, the relationship is measured by the correlation degree : When , the element lies in the positive domain and belongs to the set. When , the element lies in the negative domain and does not belong to the set. When , the element exhibits extensibility and can potentially be transformed into a positive-domain element through transformations.
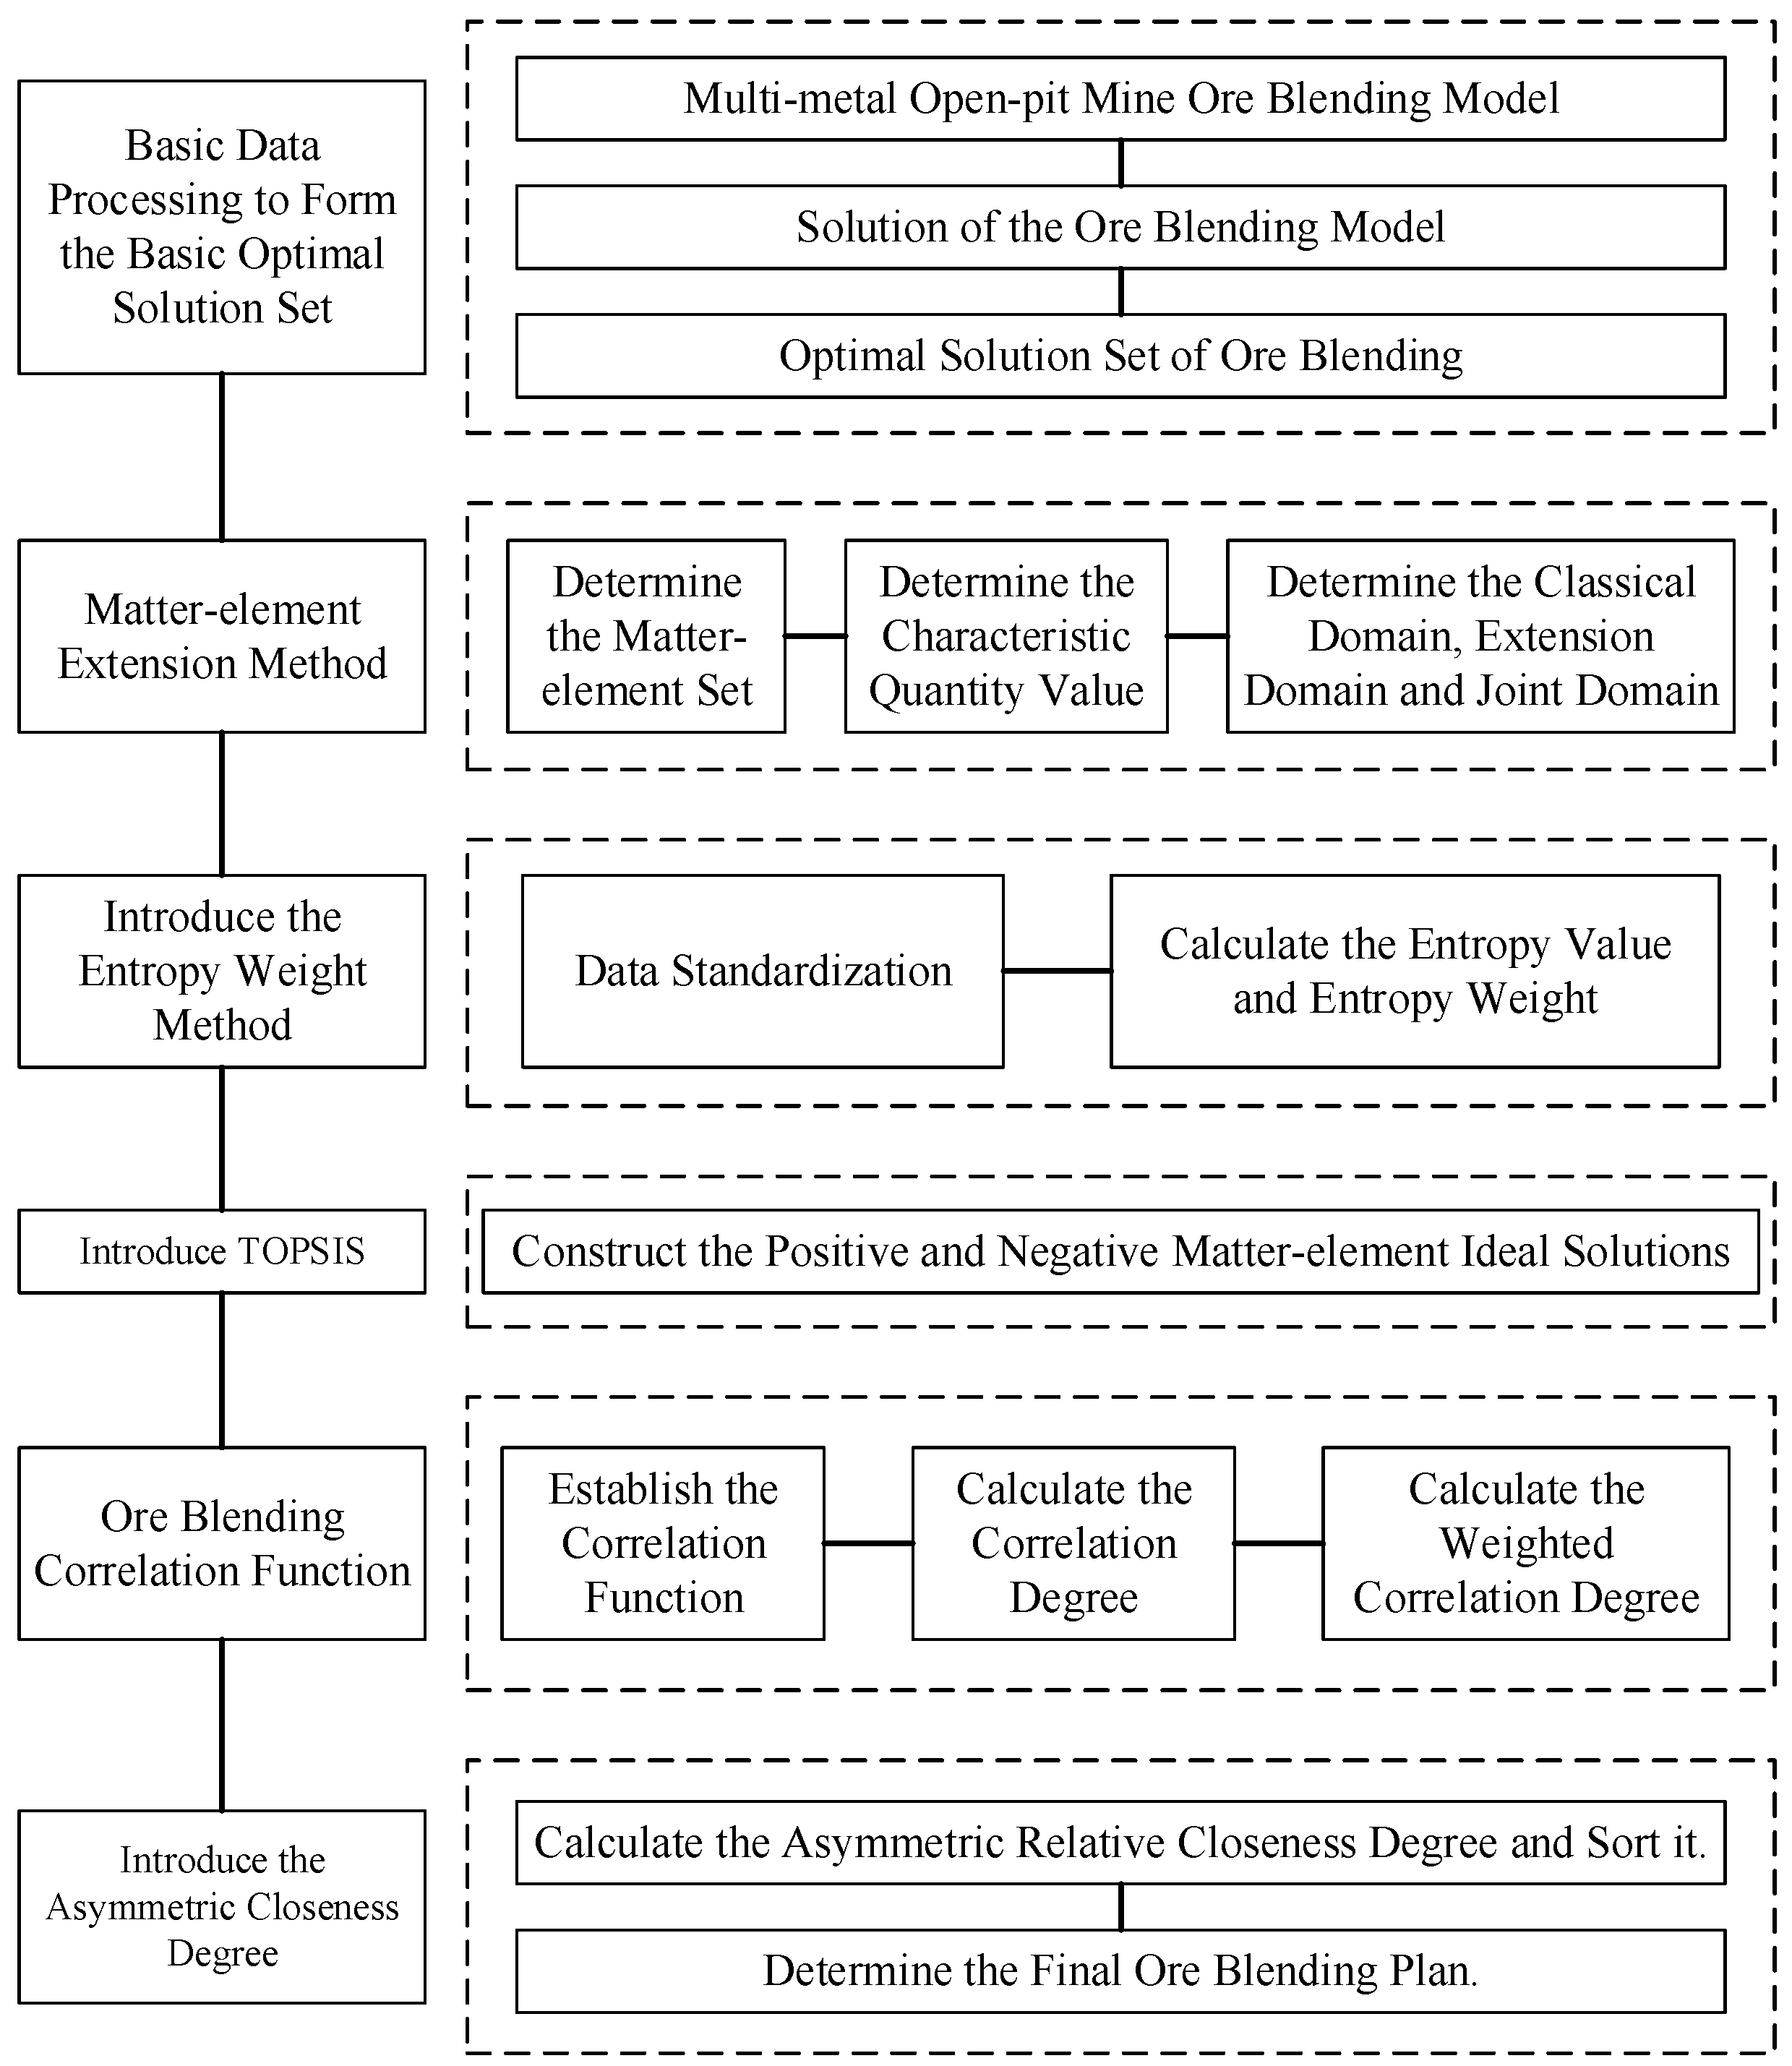
2.3.2. Improved Matter-Element Extension Model
To address the three inherent limitations of the traditional Matter-Element Extension Method—strong subjectivity in index weights, restricted section-domain scope, and suboptimal correlation degree calculation—a “three-dimensional optimization framework” is proposed. This framework introduces the entropy weight method [
30] for objective weight assignment, integrates the TOPSIS [
31] ideal solution to expand the section-domain space, and employs asymmetric closeness degree to optimize correlation degree calculation [
23]. Meanwhile, the ore blending correlation function is established to make it more in line with the reality of ore blending optimization. An improved matter-element extension decision-making model is thereby constructed.
The detailed construction steps of the Improved Matter-Element Extension Decision-Making Model are presented as follows:
(1) Determine the matter-element set and characteristic quantitative values:
Determine the name of the matter as
; determine the evaluation characteristics as
; determine the evaluation quantitative values corresponding to the evaluation characteristics as
; and thereby construct the matter-element set:
.
(2) Construct the positive and negative ideal matter-element solutions:
For positive indicators, the quantitative value of the positive ideal matter-element solution is taken as the maximum value among all schemes.
For negative indicators, the quantitative value of the positive ideal matter-element solution is taken as the minimum value among all schemes.
(3) Determine the classical domain, extensible domain, and joint domain:
Classical domain:
where
represents the lower bound of the classical domain; and
represents the upper bound of the classical domain.
Extensible domain:
where
represents the lower bound of the extensible domain; and
represents the upper bound of the extensible domain.
Joint domain:
where
represents the lower bound of the joint domain; and
represents the upper bound of the joint domain.
In this study, the constructed positive and negative ideal matter-element solutions represent the upper and lower bounds.
(4) Standardize the Data:
For positive indicators, the formula used is as follows:
For negative indicators, the formula used is as follows:
where
represents the original evaluation quantitative value of the
-th evaluation characteristic for the
-th scheme; and
represents the normalized evaluation quantitative value of the
-th evaluation characteristic for the
-th scheme.
(5) Calculate Entropy Values and Entropy Weights:
Entropy value calculation:
where
;
;
represents the proportion of the
-th scheme under the
-th indicator;
is the total number of schemes; and
represents the entropy value of the
-th indicator.
Entropy weight calculation:
where
represents the entropy weight of the
-th indicator.
(6) Establish the ore blending correlation function and calculate the correlation degree:
For a point
in the real domain
and an interval
(which can be an open interval, closed interval, or half-open/half-closed interval), the formula for the correlation function
constructed based on the ore blending decision-making is as follows:
where
is the length of interval ; and is the distance from the point to the interval .
(7) Calculate the weighted correlation degree:
where
represents the weighted correlation degree.
(8) Calculate the Asymmetric Relative Closeness and Rank the Schemes:
where
represents the asymmetric relative closeness.
Rank all calculated asymmetric relative closeness values in descending order. The scheme with the highest is identified as the optimal solution for decision-making.
Through the above theories and schemes, the schematic diagram of the process of the ore blending scheme for the polymetallic open-pit mine constructed in this study is specifically shown in
Figure 2.
3. Case Study on Ore Blending in a Polymetallic Open-Pit Mine
3.1. Project Background
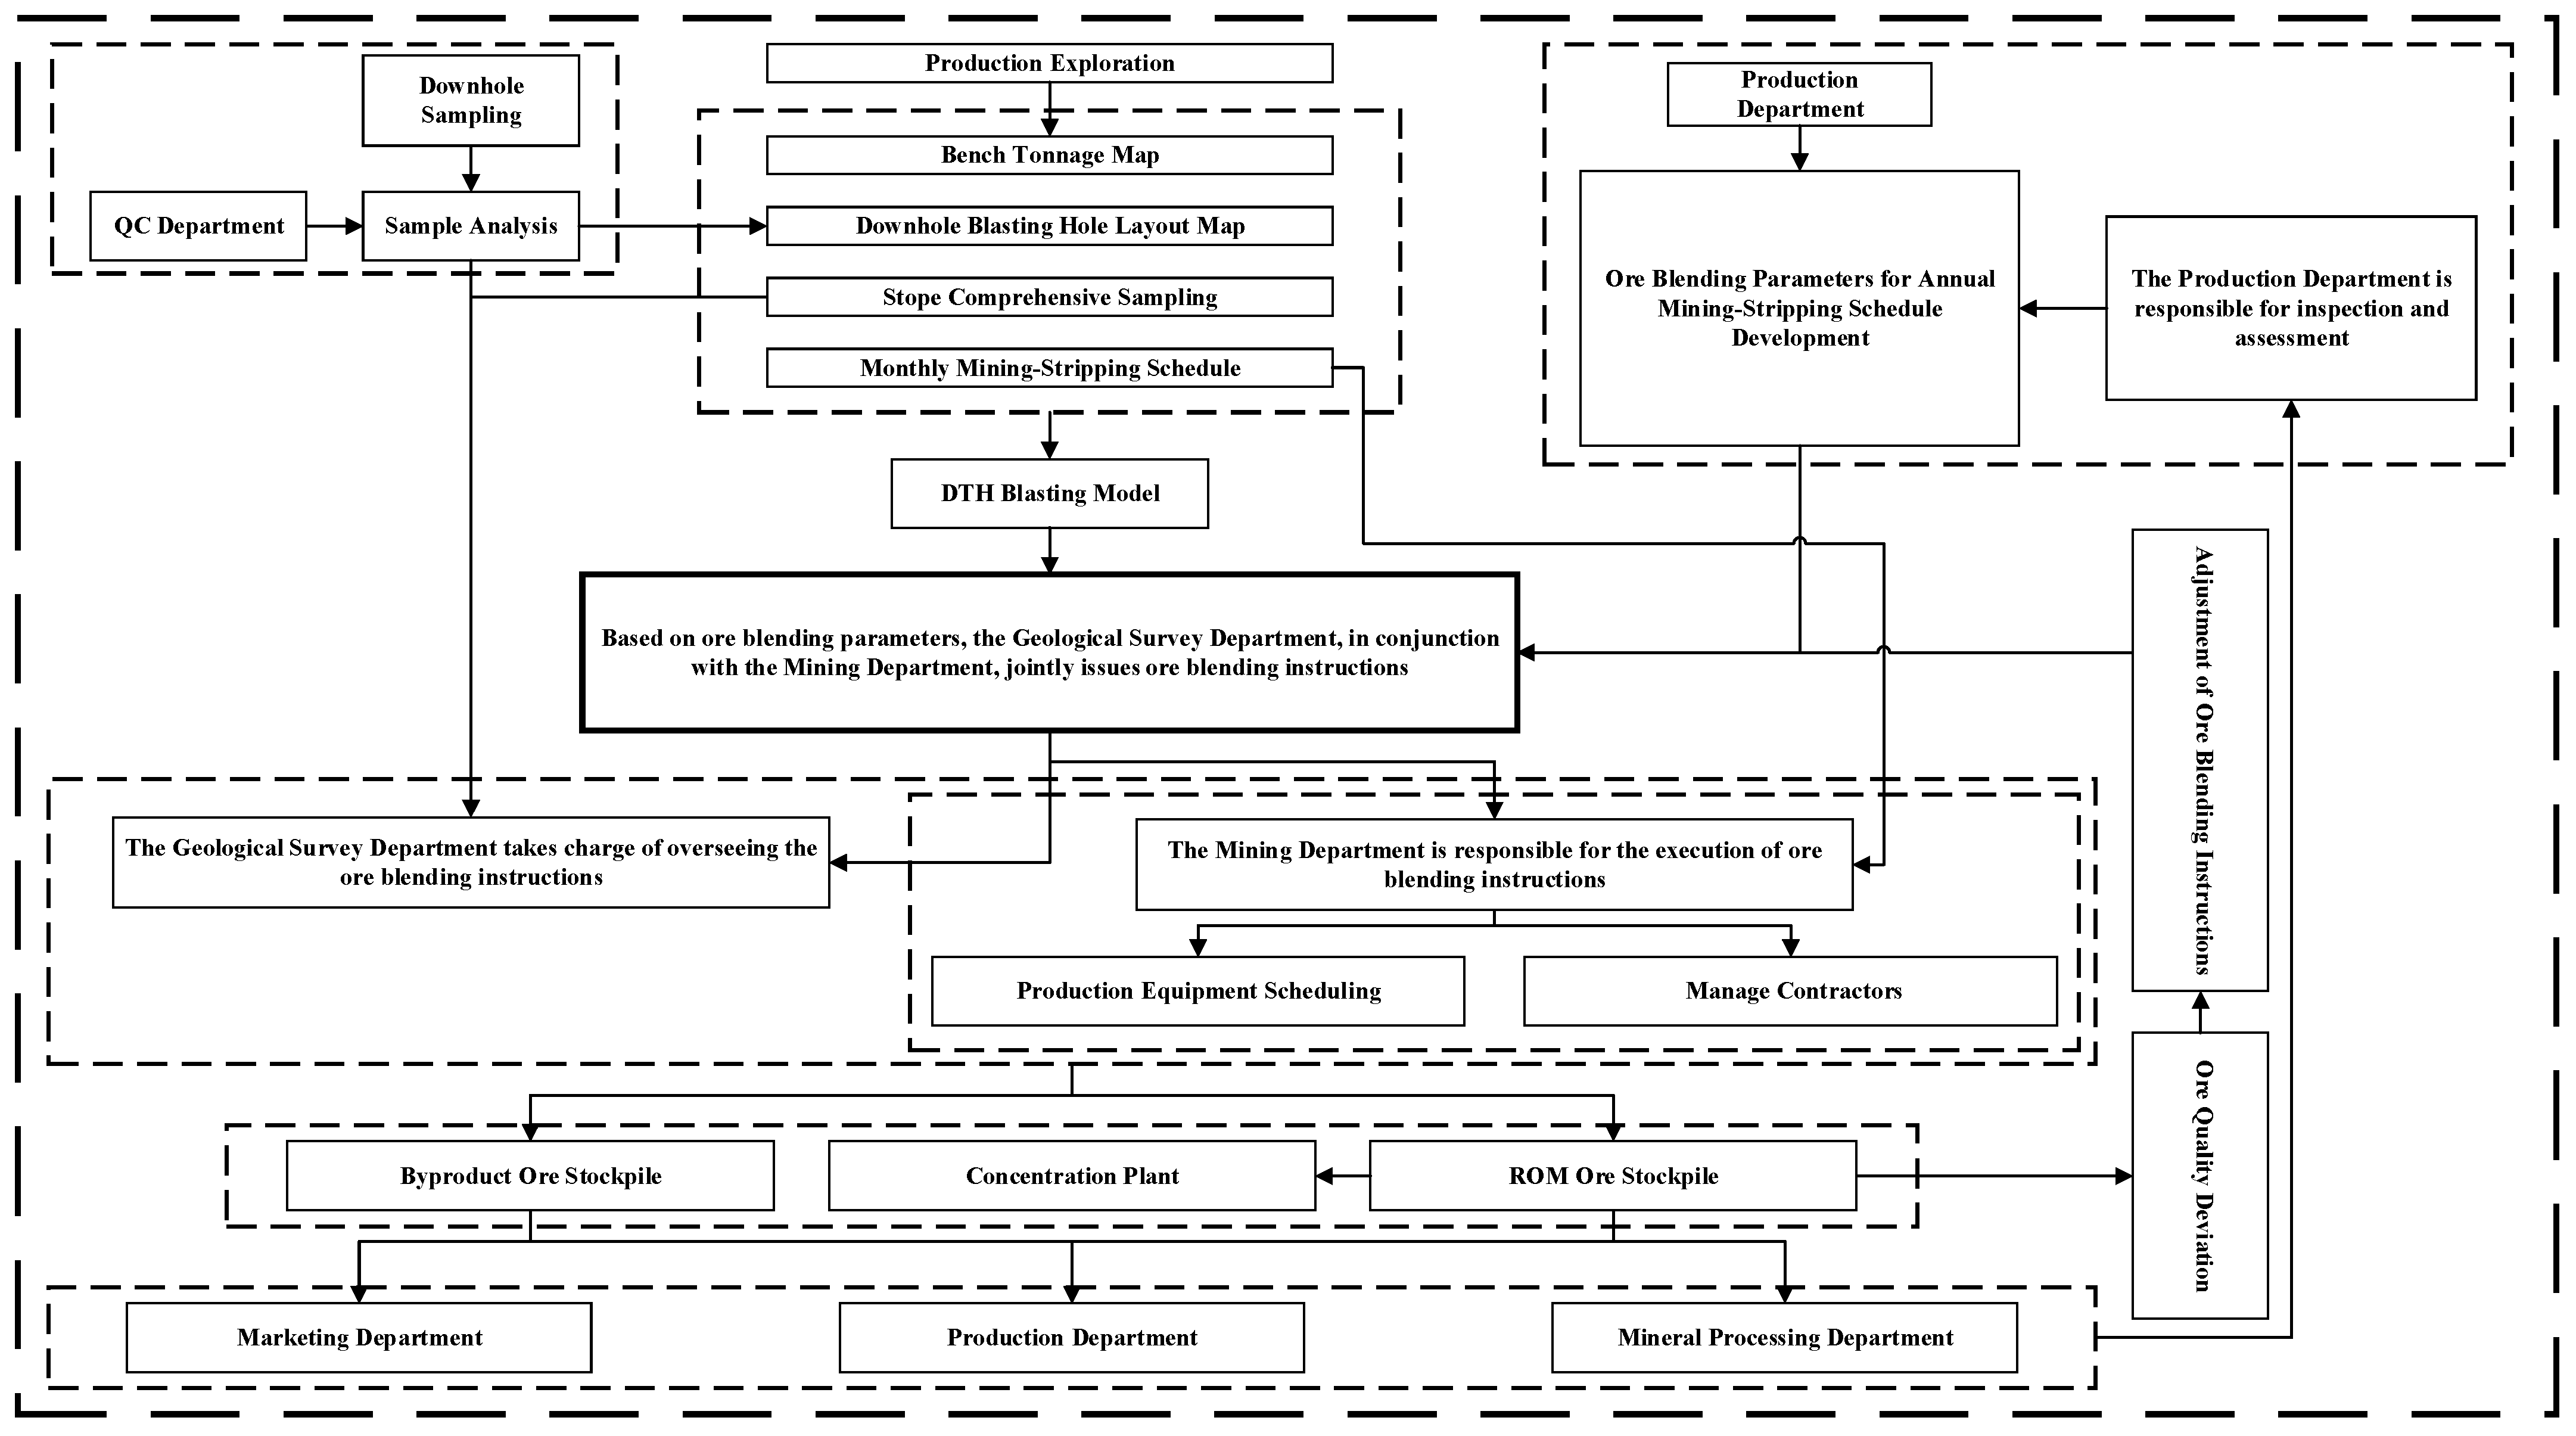
Dabaoshan Mine is a large-scale polymetallic deposit in Shaoguan City, Guangdong Province. The main ore body consists of 20 million tons of limonite in the upper layer and over 28 million tons of copper-sulfur ore in the lower layer, accompanied by rare metals such as tungsten, bismuth, and molybdenum. Using an open-pit mining method, its main products include iron ore, copper concentrate, sulfur concentrate, and sulfuric acid products. Given the complex ore body morphology, significant grade fluctuations, and polymetallic symbiosis, ore blending technology has become the core of ore quality management. By scientifically proportioning ores of different grades, it stabilizes the beneficiation grade, reduces quality fluctuations, enhances resource utilization, and extends the mine’s service life. With the commissioning of a 7000-ton/day beneficiation plant, the expansion of mining scale, and the surging ore output, higher requirements have been placed on ore blending precision and resource management. This study aims to utilize digital and information technologies to construct a full-cycle ore blending management system, addressing technical challenges such as complex spatial relationships of ore bodies, large grade fluctuations, and polymetallic symbiosis, to achieve efficient resource utilization and sustainable mine development.
The construction process of the existing ore blending scheme in Dabaoshan Mine is shown in
Figure 3 below.
3.2. Ore Blending Verification Data
- (1)
Haulage Distance
The actual haulage distances used in the case verification of ore blending in Dabaoshan Mine are shown in the following
Table 1.
- (2)
Constraint-Related Values
Based on the actual production conditions of the mine, the relevant constraint values are as follows,
Table 2.
- (3)
Ore Reserves and Ore Grades
The mined and blended raw copper-sulfur ore quantities used in the case verification of ore blending in Dabaoshan Mine are shown in the following
Table 3.
- (4)
Ideal Target Values for Ore Blending
The target values for the case verification of this ore blending example are shown in the following
Table 4.
Among these, the target grade for Cu is selected as 0.47%, and the target grade for S is set at 15.00%. Given that copper is currently the primary economic mineral in the mine, this study assigns a weight of 0.8 to Cu and 0.2 to S in the calculation.
3.3. Solution and Decision-Making for Ore Blending in Polymetallic Open-Pit Mines
- (1)
Solution of Ore Blending Model Based on NSGA-II
Ore blending in polymetallic open-pit mines requires balancing multi-objective constraints such as multiple metal grades, production volumes, and haulage distances. This study employs the NSGA-II algorithm for optimization, incorporating relevant data to derive the optimal dataset for the ore blending model. The model effectively solves for optimal solution sets under complex constraints of ore composition and mining haulage distances in dynamic blending scenarios, providing multi-objective balanced ore blending schemes for practical mine production and enhancing comprehensive resource utilization and economic benefits. After 1000 iterations, the Pareto front stabilized, indicating that the algorithm had thoroughly explored the solution space and reached a converged equilibrium state, ultimately producing a stable set of reference optimal ore blending schemes.
- (2)
Determination of Matter-Element Set and Characteristic Values
Determined as follows:
Name of Matter-Element: Optimal Solution for Ore Blending Optimization.
Evaluation Characteristics: Total Polymetallic Ore Quantity Deviation, Polymetallic Grade Deviation.
Evaluation Values Corresponding to Characteristics: Target values derived from the optimal solution set.
Thus, the matter-element set is constructed as follows:
Substituting the optimal solution data for ore blending optimization in polymetallic open-pit mines obtained by the NSGA-II algorithm into the matter-element set yields:
- (3)
Construct Positive and Negative Matter-Element Ideal Solutions
Both evaluation indicators in this study are negative indicators. For negative indicators, the value of the positive matter-element ideal solution is taken as the minimum value among all schemes, and the value of the negative matter-element ideal solution is taken as the maximum value among all schemes. The relevant data are substituted as follows:
- (4)
Determine the Joint Domain
In this study, the positive and negative matter-element ideal solutions constructed represent the upper and lower bounds.
- (5)
Final Optimal Ore Blending Scheme Derived from Decision-Making
Steps (4), (5), (6), (7), and (8) of the decision-making model are implemented via code. Through NSGA-II and improved matter-element extension decision-making, the final ore blending scheme is determined as follows,
Table 5, serving as the case verification of the optimal ore blending solution in this study.
The relevant constraint values for the final ore blending scheme of the polymetallic open-pit mine are presented in
Table 6. These values conform to the mine’s actual requirements, thus enabling normal production with this ore blending scheme.
4. Discussion
This study, through case verification, mine planning, and actual mine production, has obtained the data presented in
Table 7.
Based on the data table of case verification, planning, and actual production, the following Target Indicator Comparison Chart and Indicator Deviation Rate Comparison Chart are created (
Figure 4):
Based on actual mine data, the multi-objective optimization model for polymetallic open-pit mines was constructed, solved using the NSGA-II algorithm, and the final ore blending scheme was derived based on the improved matter-element extension model. As clearly shown in
Figure 4 and
Figure 5 and
Table 5,
Table 6 and
Table 7:
The model-verified scheme achieved the highest total production, with values closer to the ideal target compared to both the planned and actual production data. The Cu grade of the model-verified scheme fell between the planned and actual production values, demonstrating better alignment with the concentrator’s Cu grade requirements. The S grade of the model-verified scheme was lower than both the planned and actual production values, indicating better compliance with the concentrator’s S grade specifications.
Combined with the data and deviation rate comparison chart, the total production accuracy of the model-verified scheme is 1.035% higher than the planned value and 2.828% higher than the actual value. This result indicates that the model-verified scheme precisely matches the mine’s planned production capacity, avoiding the risk of overloading production that may be caused by the planned value while improving the problem of underutilized production capacity in actual operations. It achieves a balance between production capacity and efficiency, ensuring the stable operation of the mine at its designed capacity.
For Cu grade deviation accuracy, the model-verified scheme improves by 7.021% compared to the planned value and 1.064% compared to the actual value. For S grade deviation accuracy, it is 33.027% higher than the planned value and 3.127% higher than the actual value. The model-verified scheme effectively reduces Cu grade fluctuations, minimizing beneficiation efficiency losses due to unstable grades and ensuring process stability and metal recovery in copper separation. Additionally, by precisely controlling the S grade within the 15% range, it ensures compliance with the concentrator’s S grade requirements.
5. Conclusions
This study focuses on the ore blending optimization problem in complex polymetallic open-pit mines, constructing a multi-objective optimization system based on the improved matter-element extension model and NSGA-II. Through case verification, ideal results were achieved, and the main conclusions are as follows:
(1) Considering multiple factors such as mine transportation, ore grades, ore composition, stockpile factors, and concentrator requirements, a multi-objective function was established to minimize both total polymetallic ore quantity deviation and grade deviation. Six constraints were defined around mine production capacity limits. The NSGA-II algorithm was applied to solve the multi-objective optimization problem. Leveraging its fast non-dominated sorting algorithm and elitist strategy, the algorithm demonstrated high computational efficiency and rapid convergence. The Pareto front stabilized after 1000 iterations, successfully generating a set of optimal multi-objective balanced ore blending schemes to support actual mine production.
(2) The traditional matter-element extension model was enhanced by integrating entropy weight for weight calculation, TOPSIS ideal solution theory for joint domain range determination, and asymmetric relative closeness for correlation degree calculation. This improved model can more scientifically handle the incompatibility between objectives in ore blending. By applying it to the optimal solution set obtained from NSGA-II, the most suitable ore blending scheme for practical mine requirements was selected.
(3) Comparing the model-verified scheme with planned and actual production values revealed significant advantages in total production, Cu grade, and S grade:
Total Production: The highest output closer to the ideal target, achieving 1.035% higher accuracy than the plan and 2.828% higher than actual production, balancing production capacity and efficiency while ensuring stable operation.
Grade Control: Cu grade deviation accuracy improved 7.021% over the plan and 1.064% over actual production, reducing beneficiation efficiency losses. S grade deviation accuracy was 33.027% better than the plan and 3.127% better than actual, minimizing fluctuations and ensuring concentrator compliance.
This paper focuses on the ore blending optimization problem in complex polymetallic open-pit mines. It combines the improved matter-element extension model with the NSGA-II algorithm to overcome the limitations of the traditional matter-element extension method, providing new ideas for solving multi-objective ore blending optimization problems. In the construction of the ore blending model, multiple factors are comprehensively considered to establish multi-objective functions and constraint conditions, which can fully reflect the actual production situation. Moreover, the matter-element extension model is improved. By introducing the entropy weight method, TOPSIS ideal solution, asymmetric closeness degree, and combining with the ore blending correlation function, the scientificity of the ore blending decision-making model is enhanced. In terms of application effects, verified by the case of Dabaoshan Mine, the model-verified scheme has significant advantages in total production, Cu grade, and S grade. It improves production accuracy and resource utilization rate, provides an effective technical means for the sustainable development of polymetallic open-pit mines, and has important theoretical and practical values for ore blending optimization in the mining industry.


