
Fast Identification and Detection Algorithm for Maneuverable Unmanned Aircraft Based on Multimodal Data Fusion


Abstract
1. Introduction
2. Related Works
2.1. Main Technical Means of Drone Detection
2.2. Machine Vision Based Target Detection Method
2.3. Multi-Object Tracking Algorithm
3. Methods
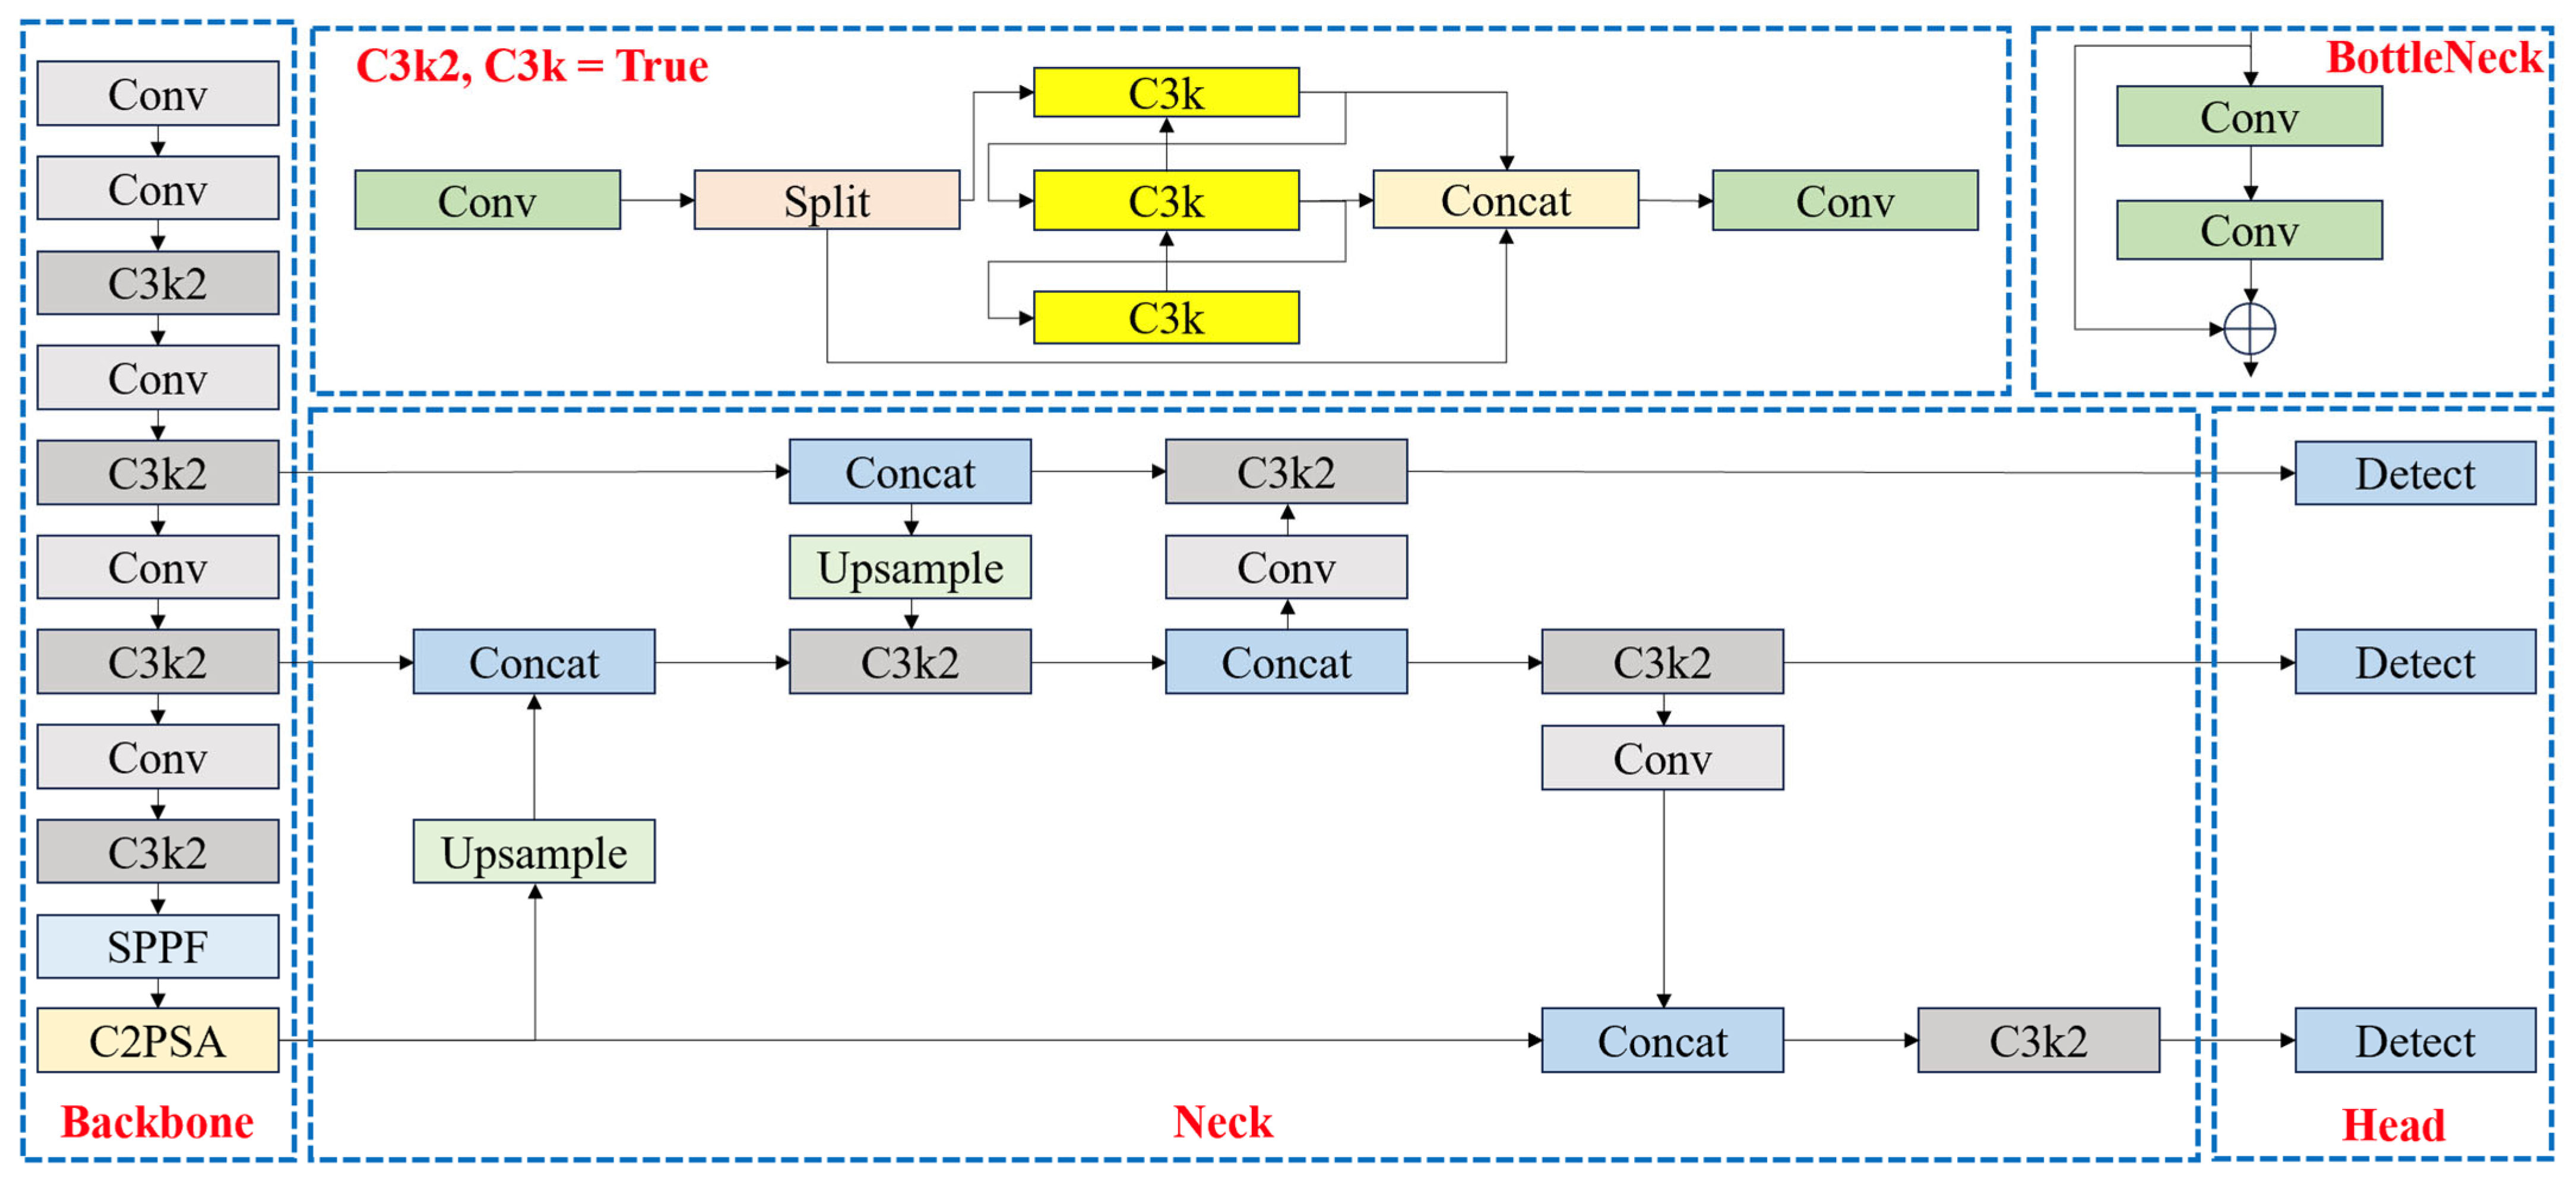
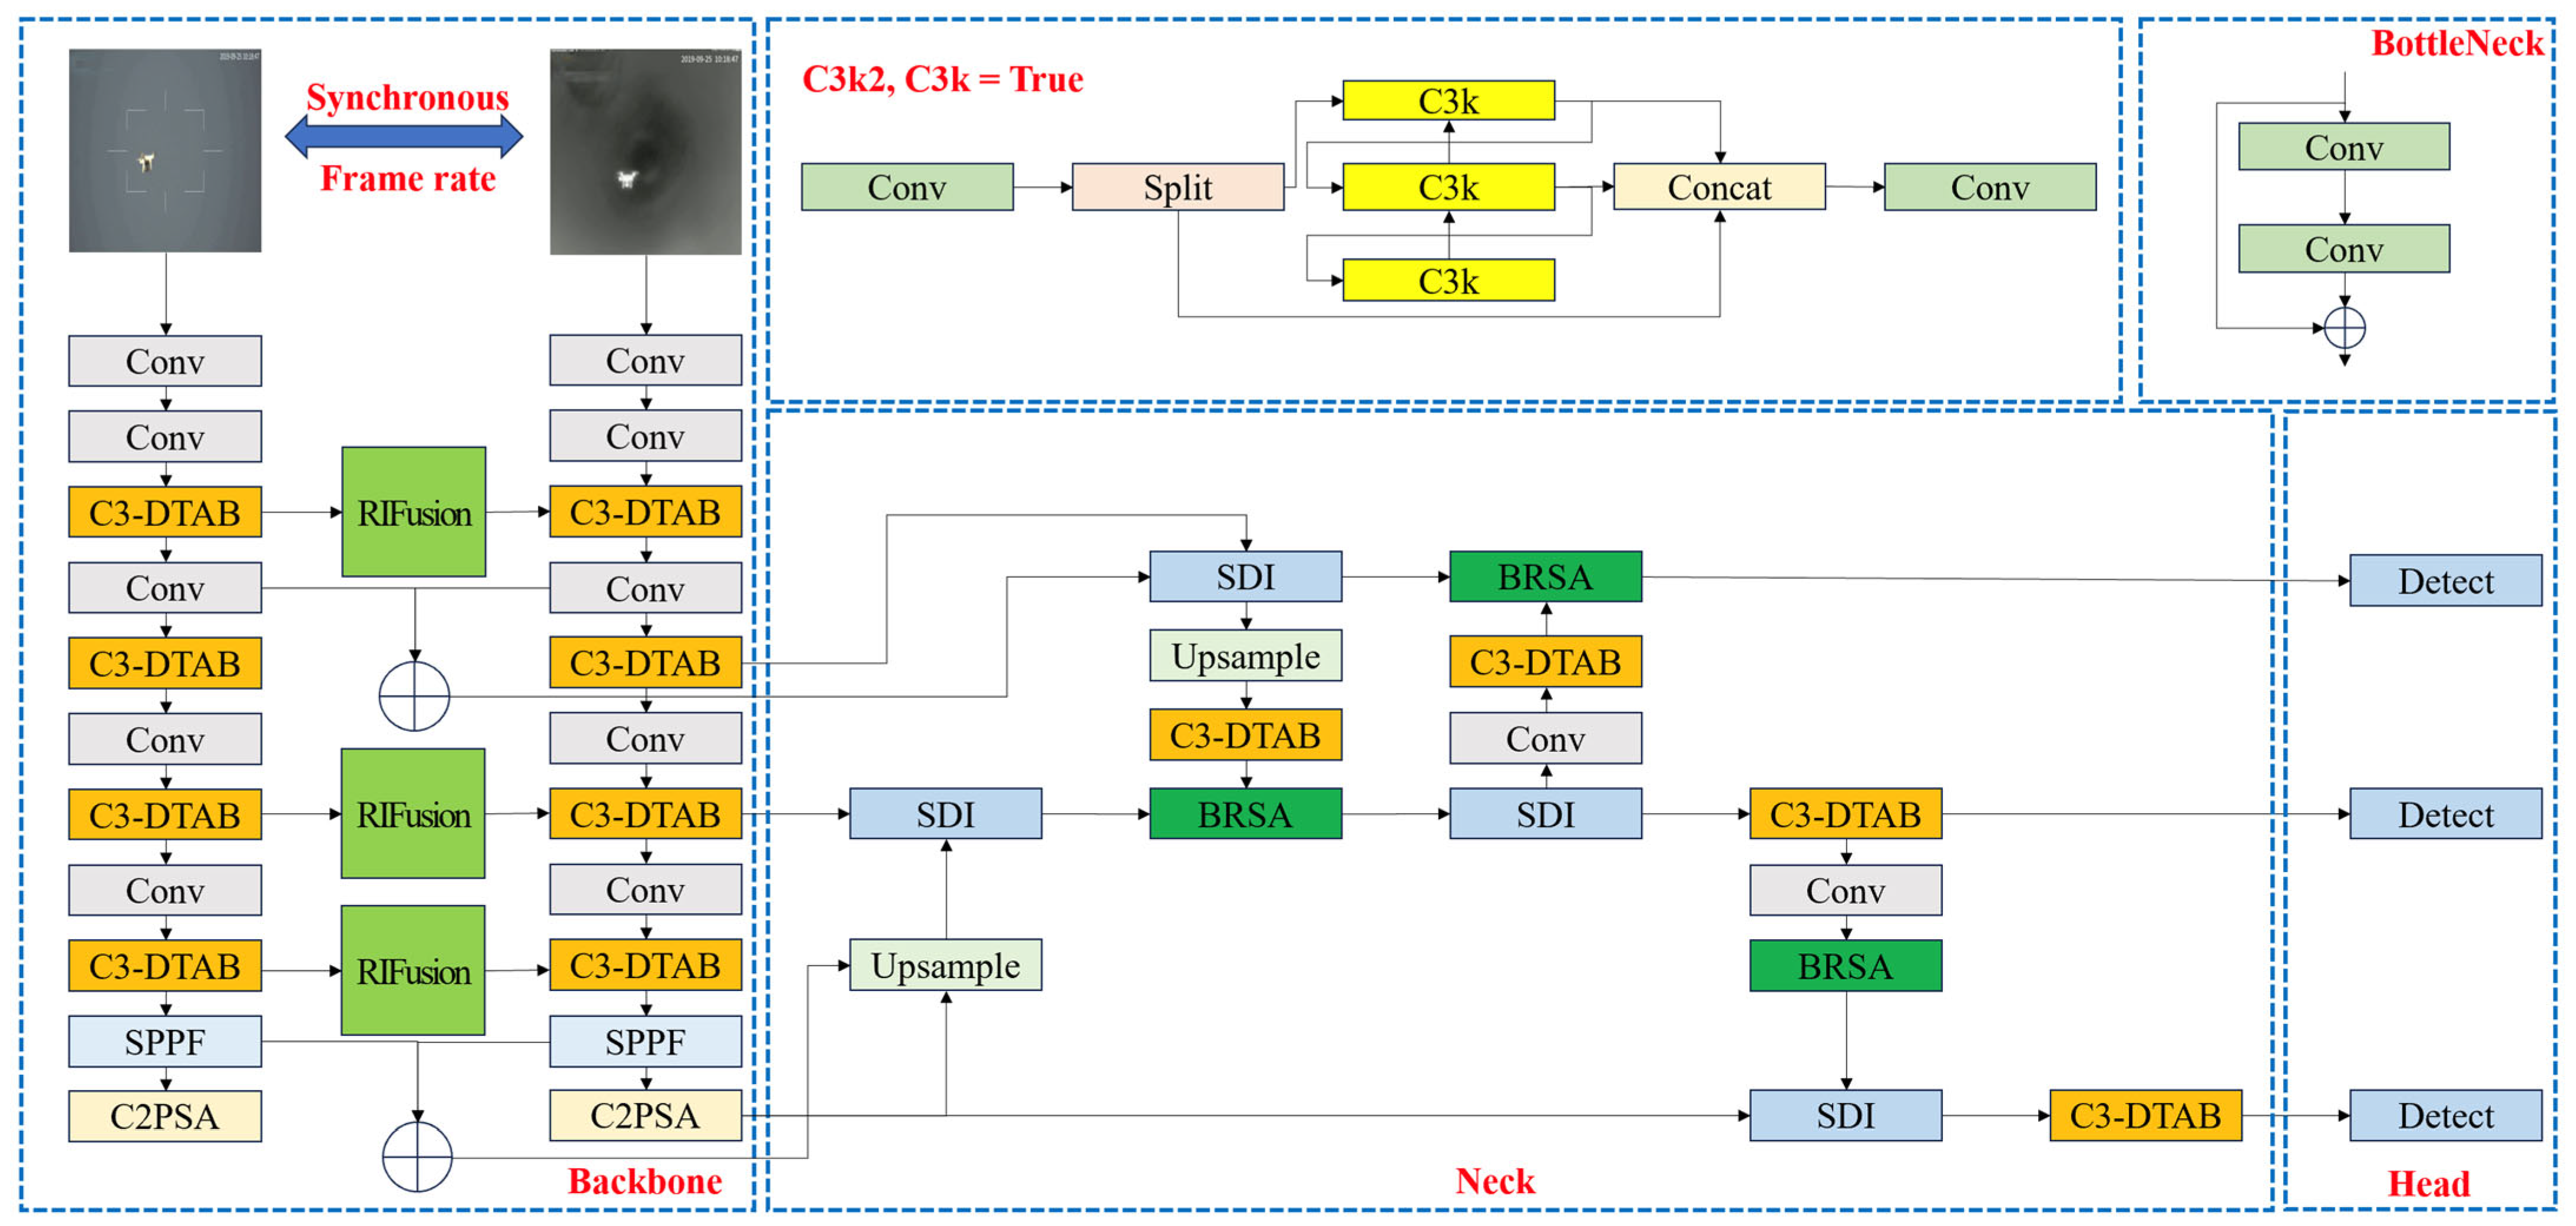
3.1. Target Detection Algorithms
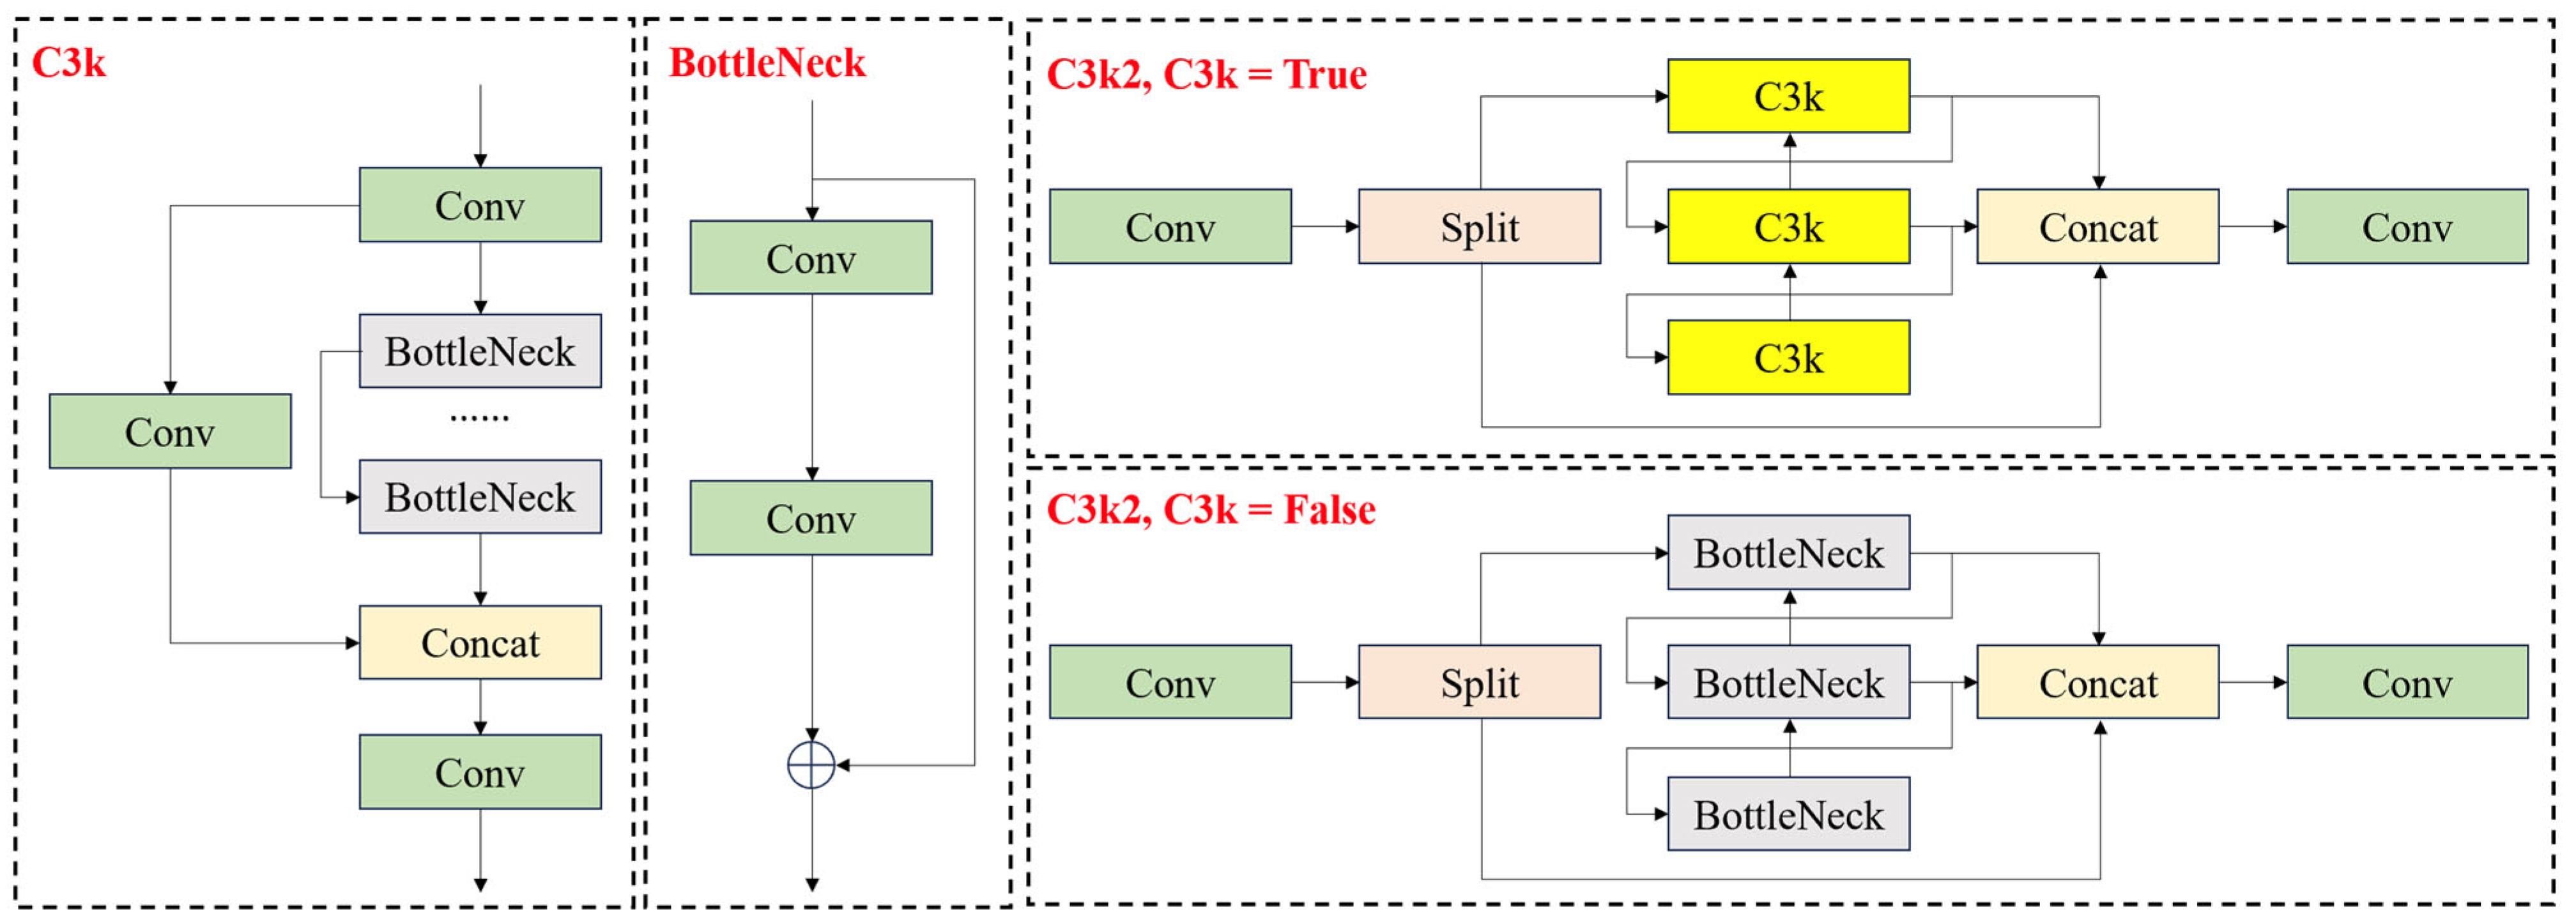
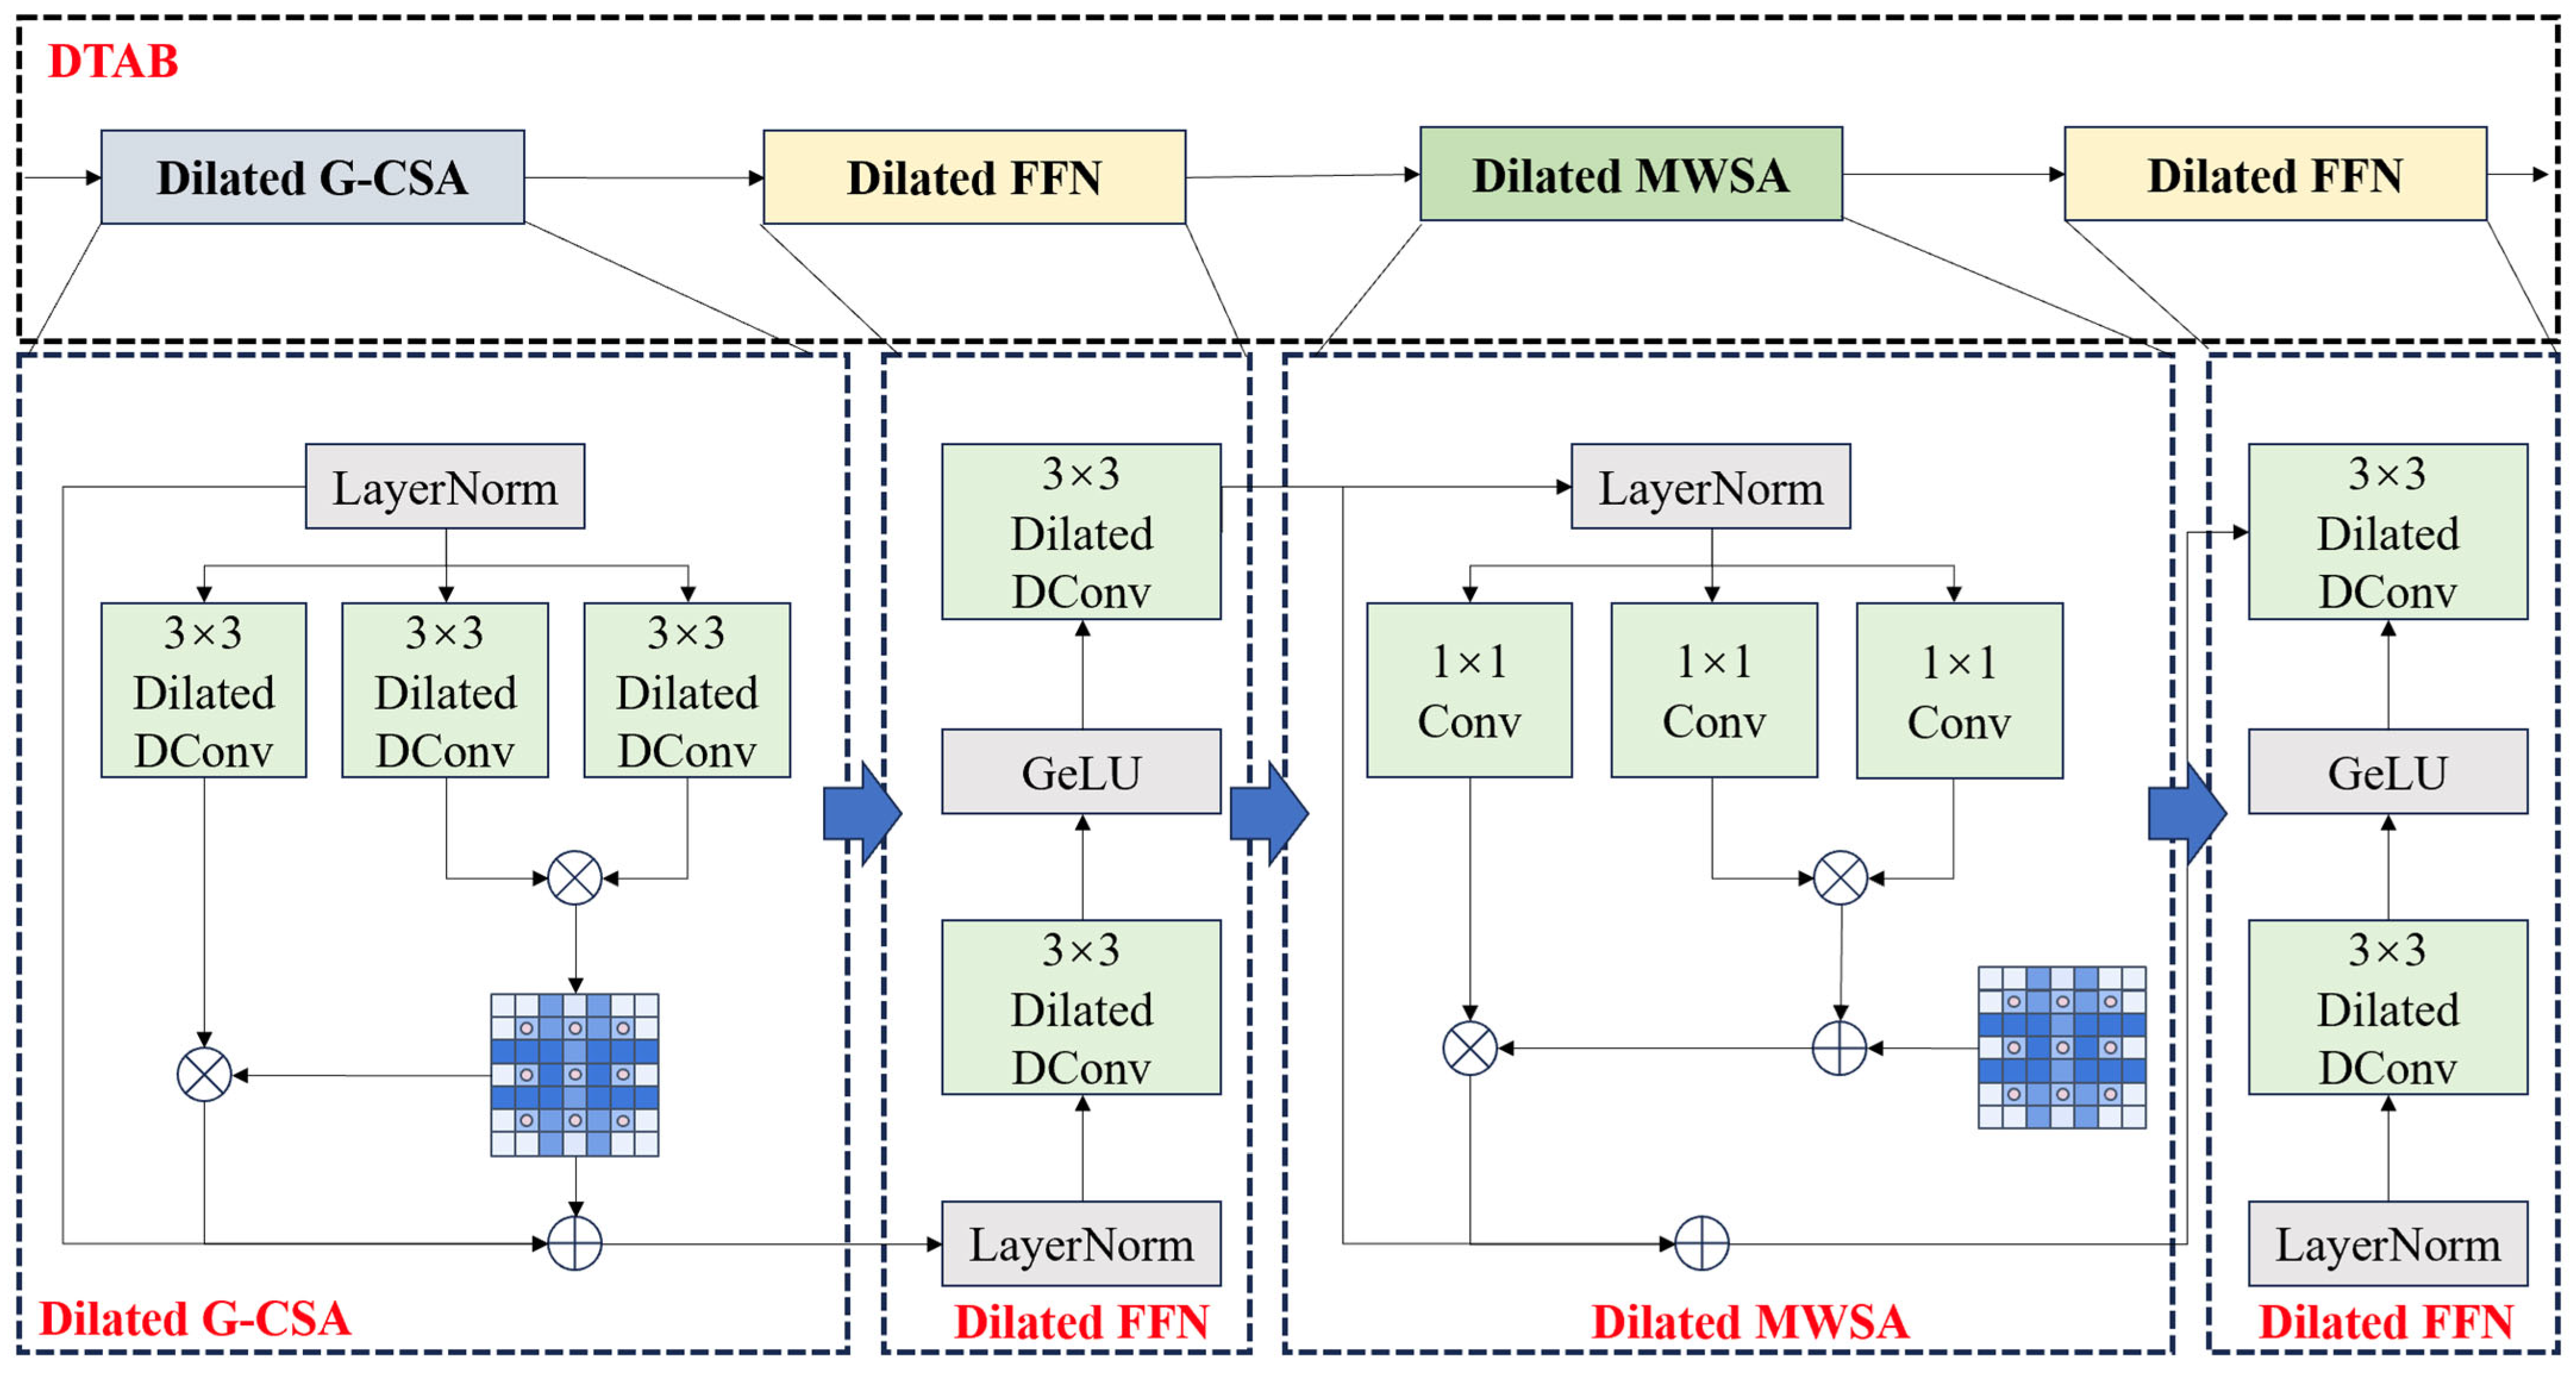
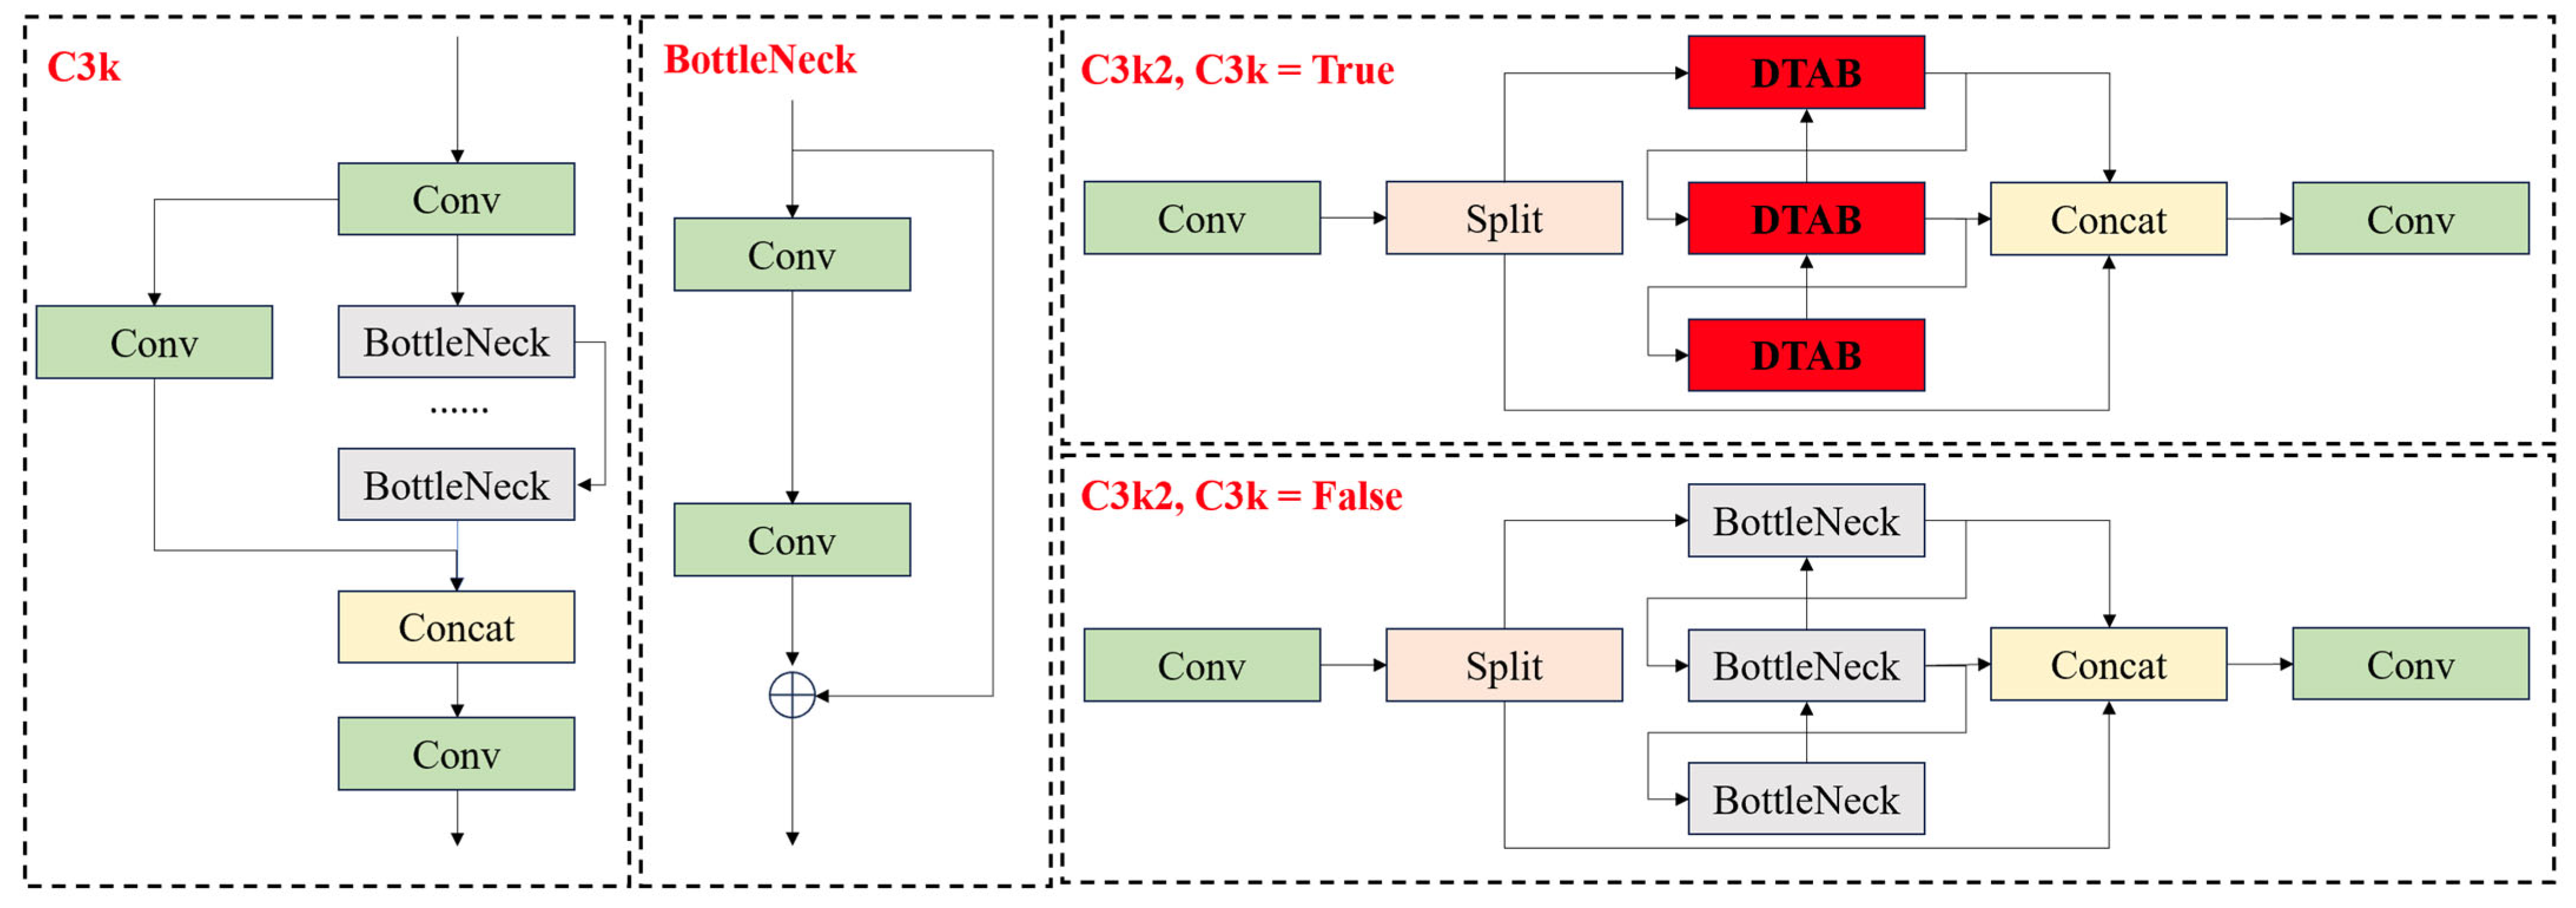
3.1.1. C3k2-DTAB Module
- The C3k2 module uses a gating mechanism to dynamically adjust the structure, and when the gating parameter is set to False, the module will be downgraded to the C2f structure. Although this adaptive mechanism can effectively balance computational resources and performance in simple scenes, when dealing with small target detection in complex backgrounds (e.g., UAV targets), the extracted low-frequency information is difficult to adequately characterize the local details of the target’s features, which leads to the model’s inability to efficiently construct the long-distance dependency relationship between the features, which directly affects the model’s performance in complex visual environments.
- In the design of the C3k2 module, there is the problem of insufficient interaction of channel information. The feature mappings of different channels are processed relatively independently, lacking an effective cross-channel information interaction mechanism. This design results in the module not being able to fully utilize the correlation information between channels, which limits the richness and accuracy of feature expression. Especially when dealing with targets with complex feature distributions, the mutual enhancement between the channel features cannot be fully activated, which reduces the discriminative ability of feature expression.
- The information transfer between the C3k2 module and the subsequent target detection components is only through simple feed-forward connections, lacking in-depth feature fusion and interaction mechanisms. This loose integration of modules leads to the fact that the feature information extracted from the upstream cannot be fully utilized by the downstream detection module, which forms a “bottleneck” of information transfer, resulting in insufficient information fusion of the model and limiting the overall performance of the model.
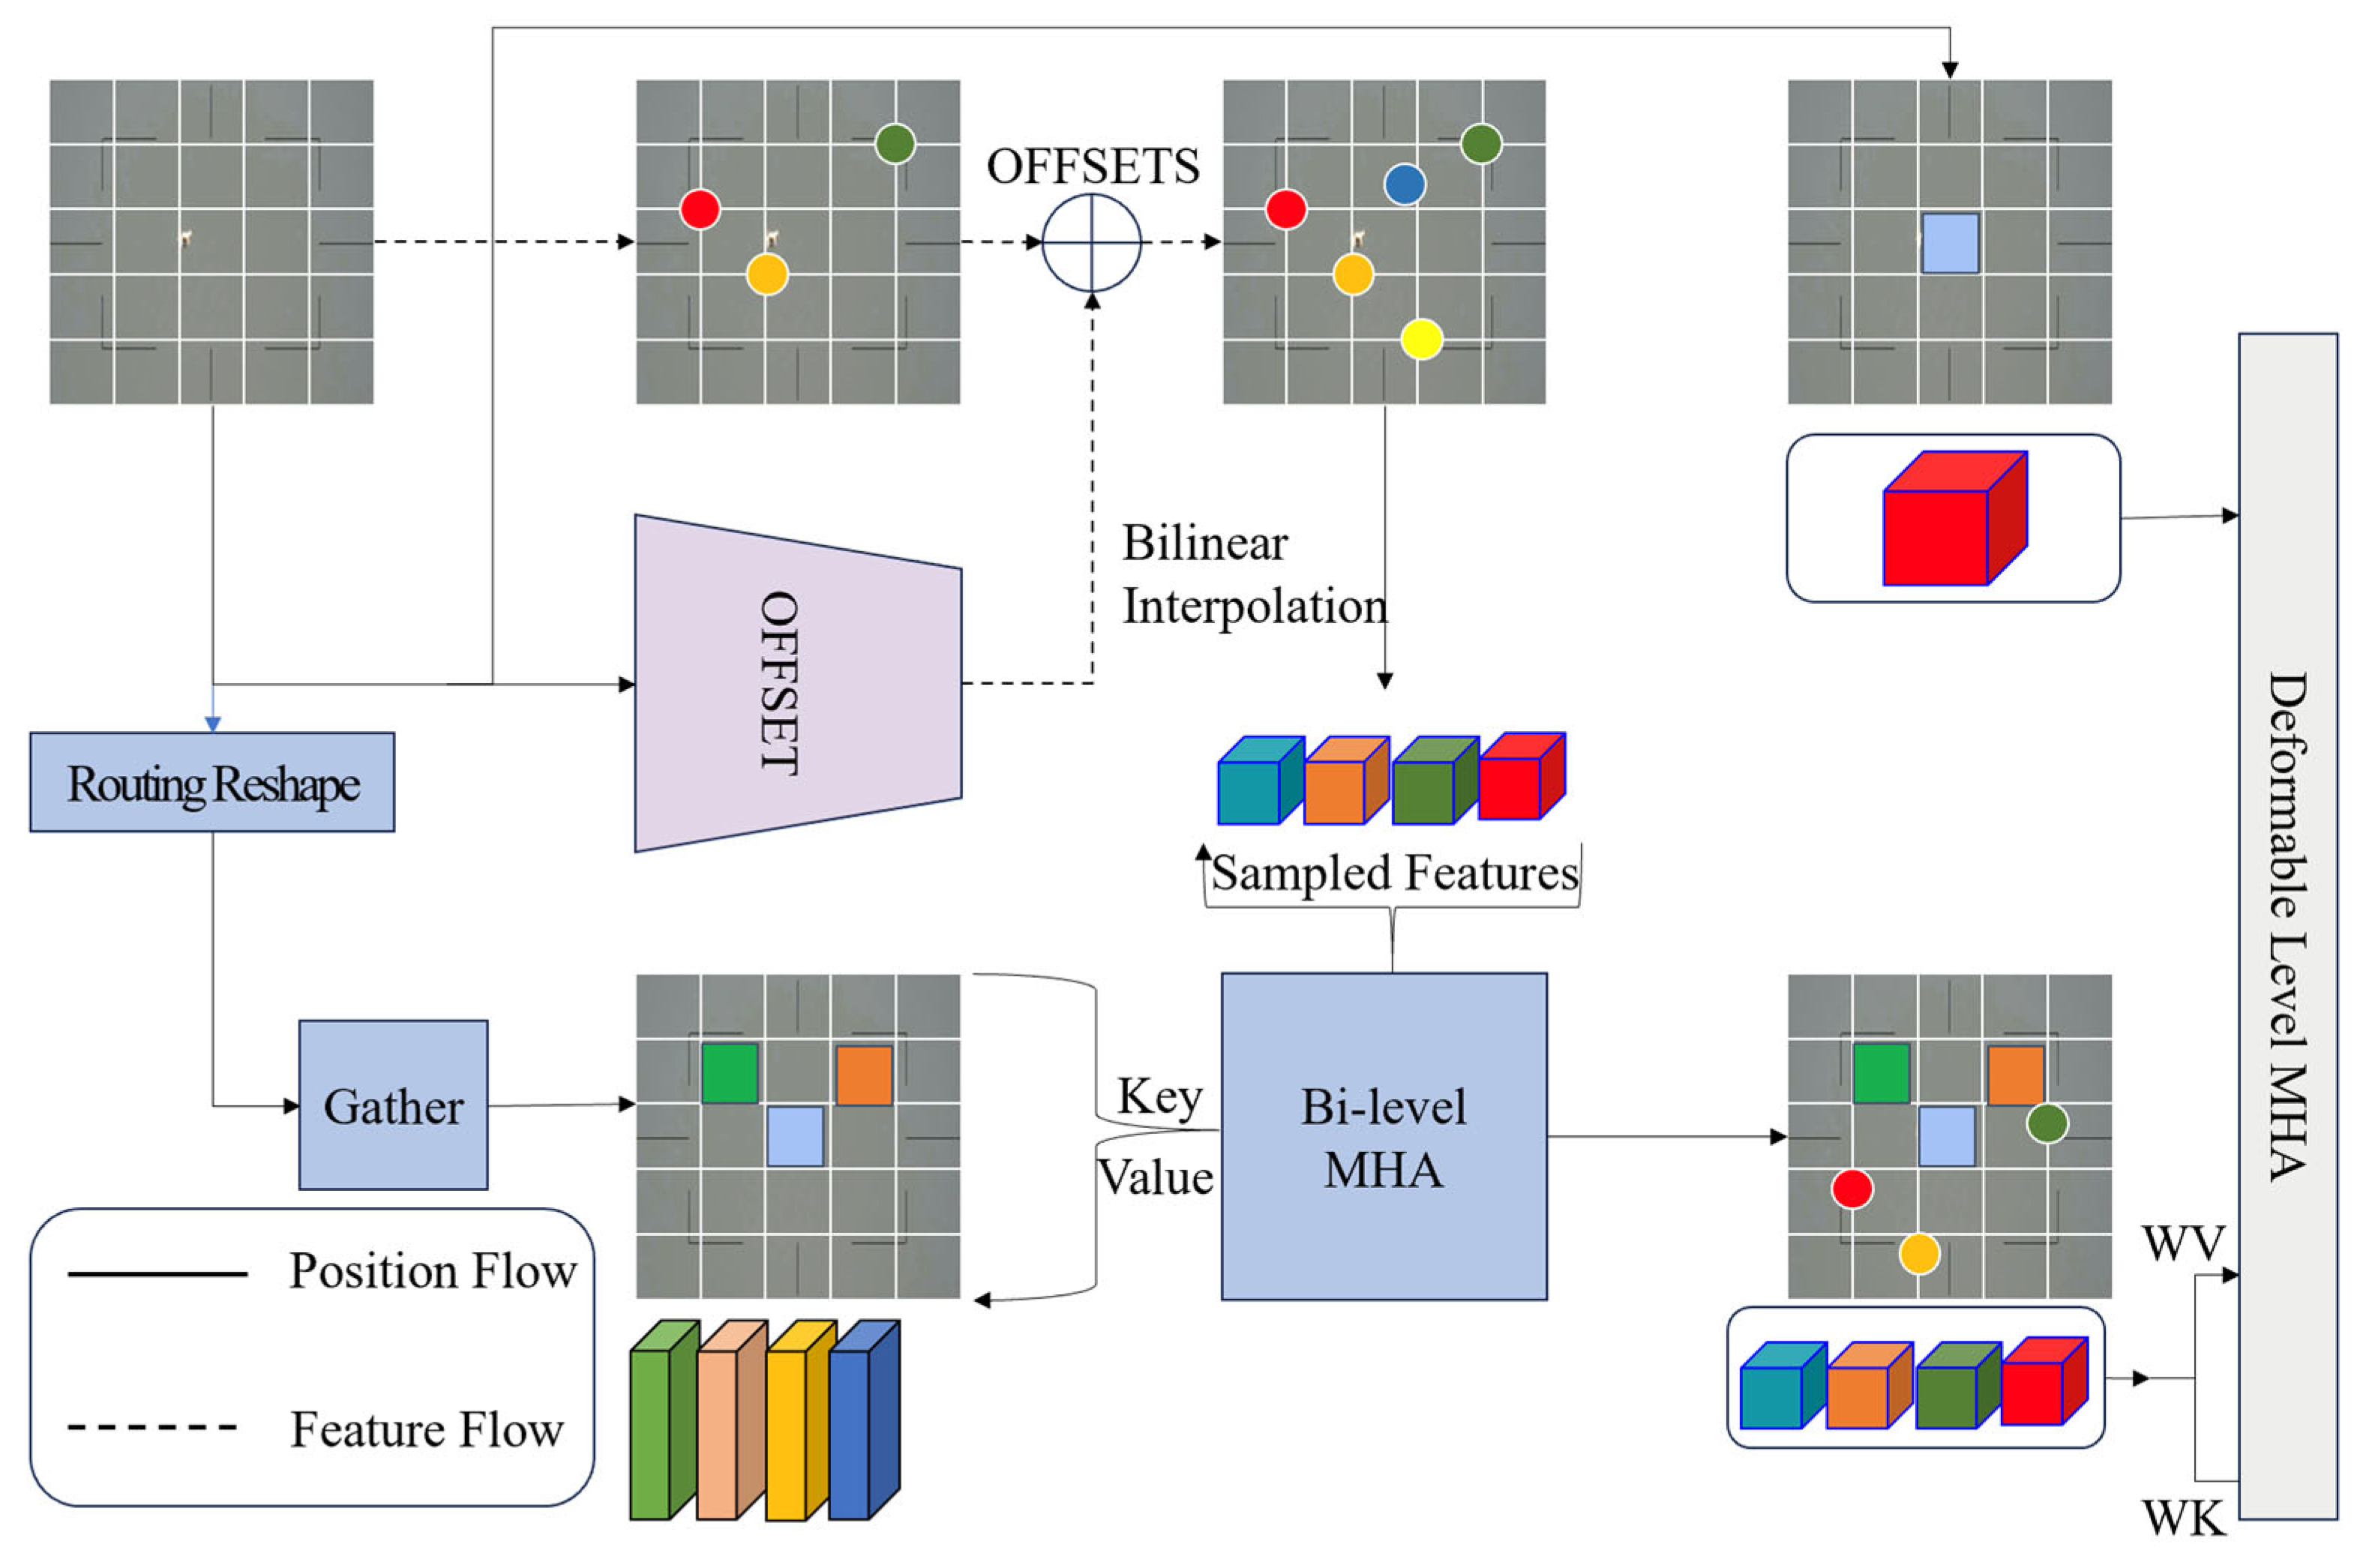
3.1.2. Bi-Level Routing & Spatial Attention (BRSA)
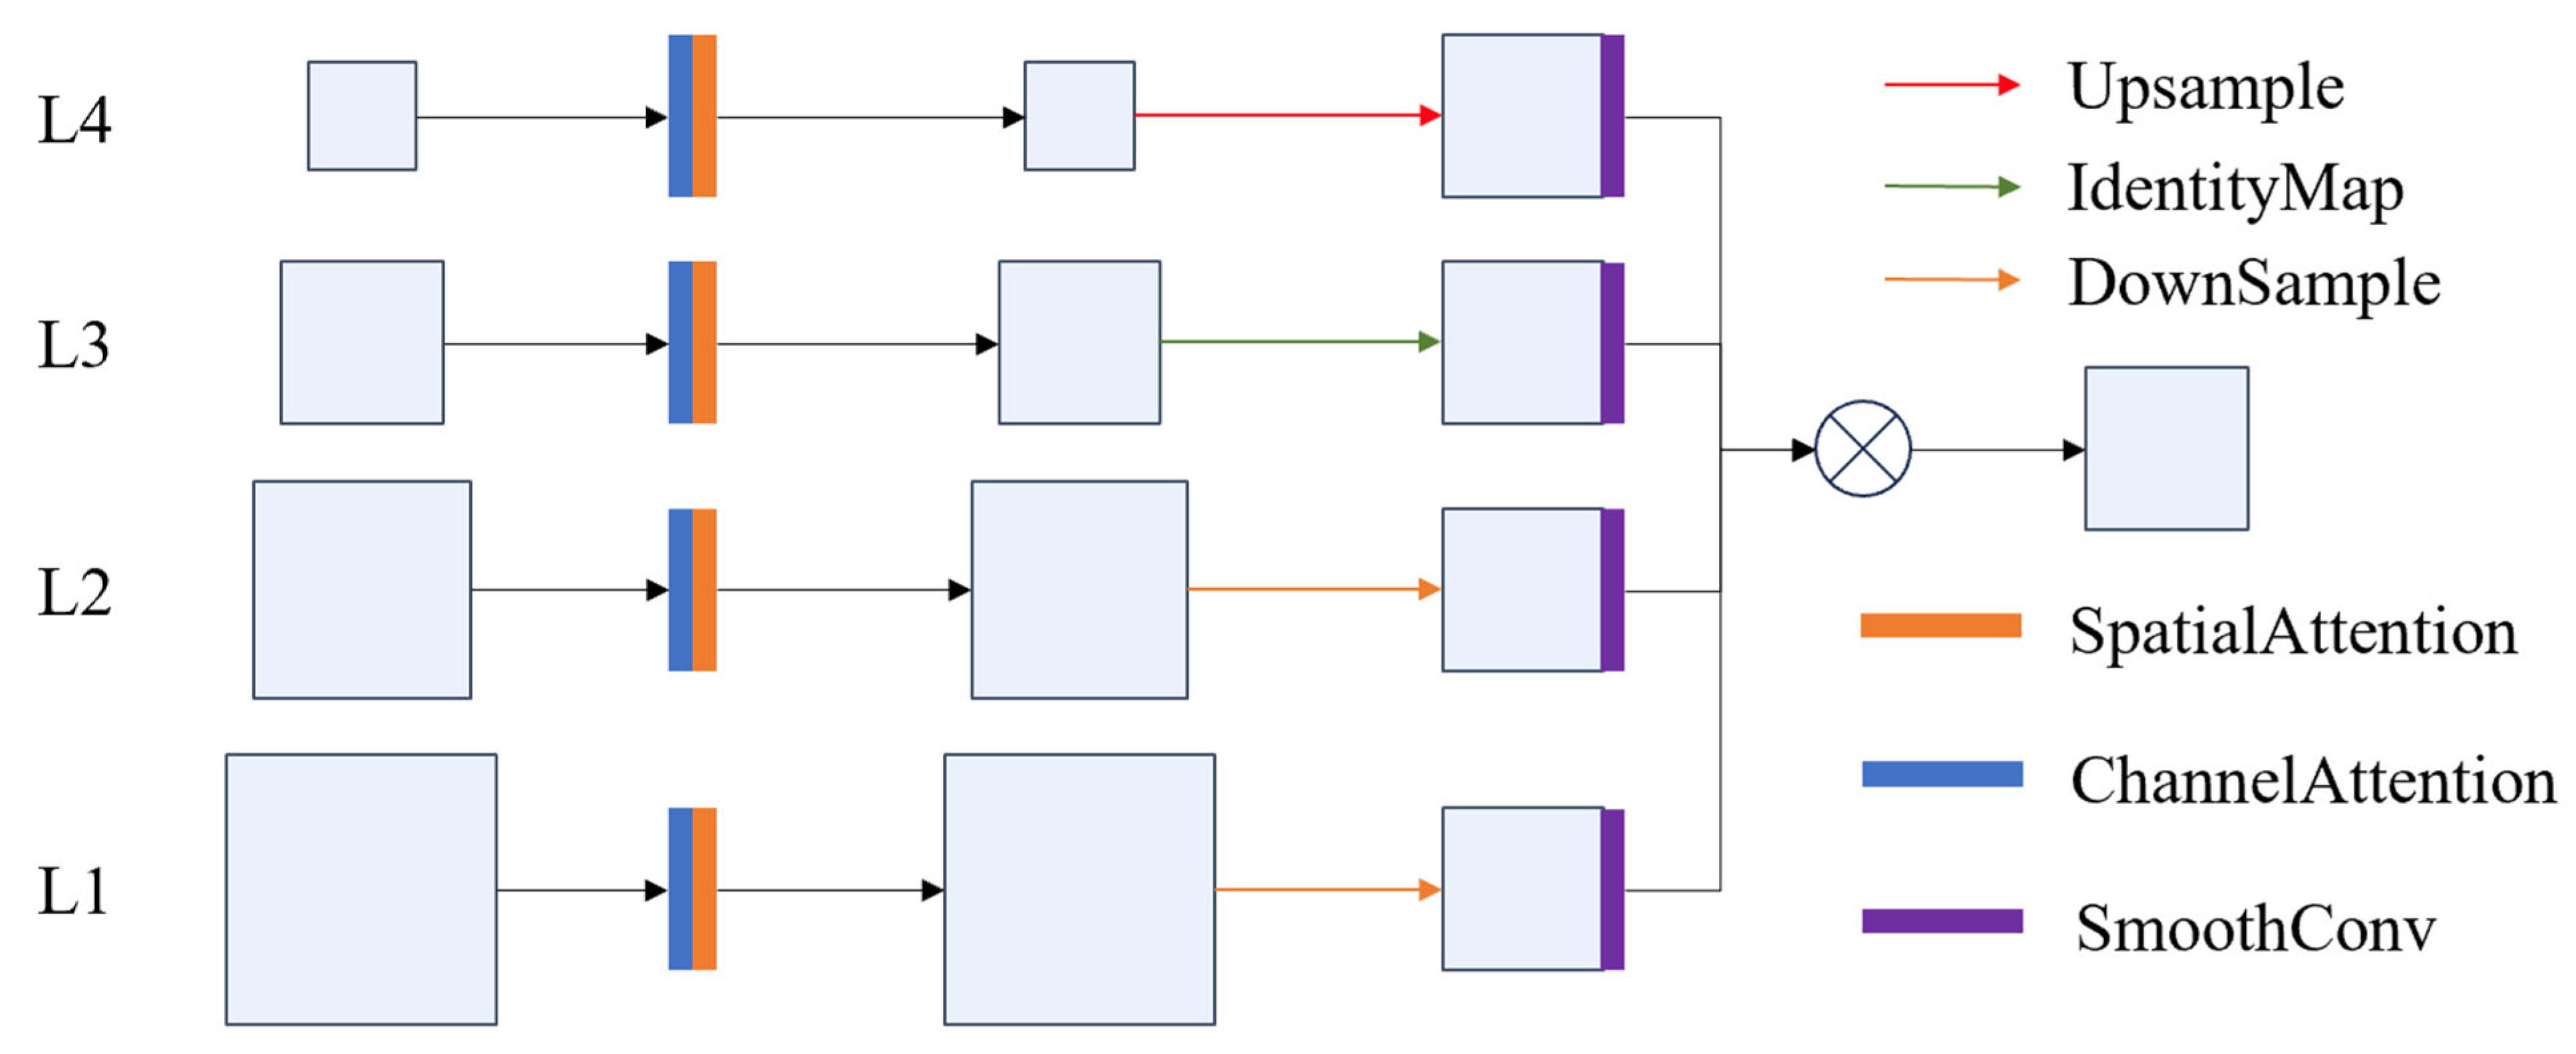
3.1.3. Semantics Detail Fusion (SDI)
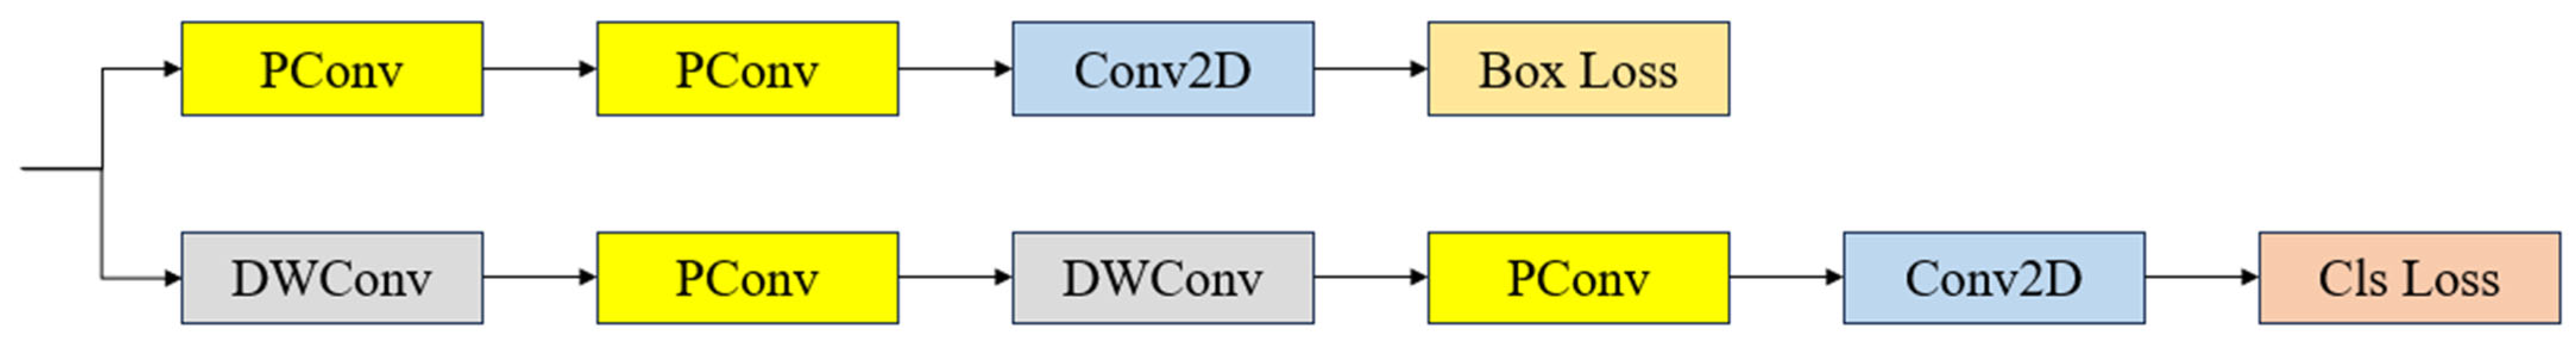
3.1.4. PCHead
3.1.5. Wasserstein Distance Loss
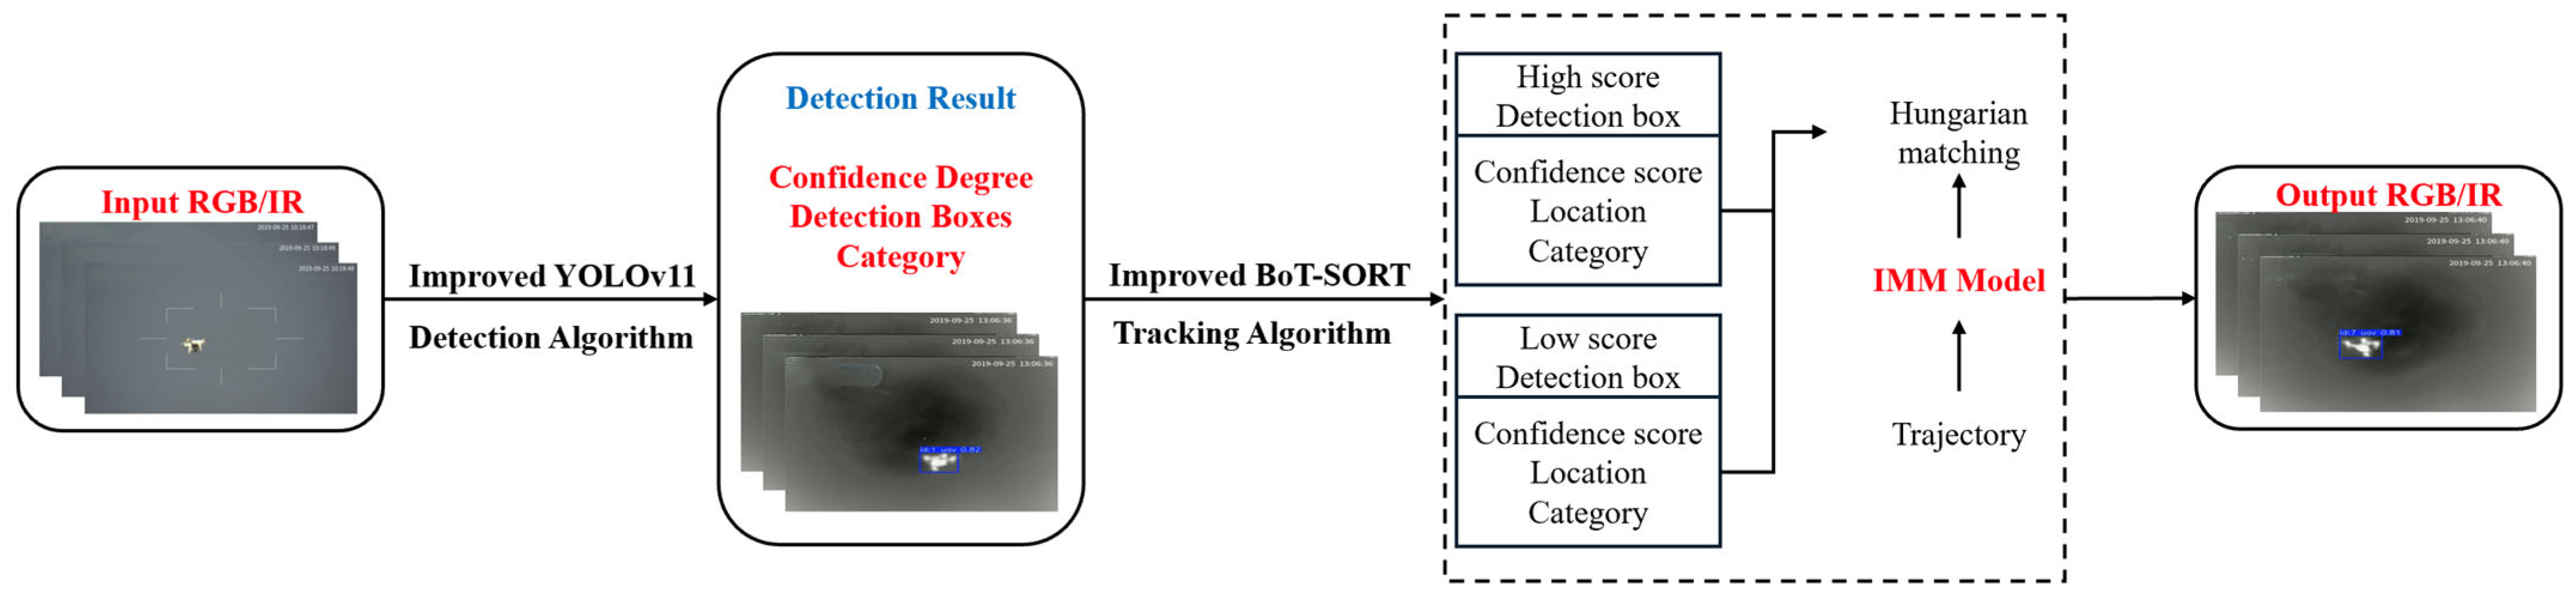
3.2. The Proposed Method of UAV Tracking
4. Experiment
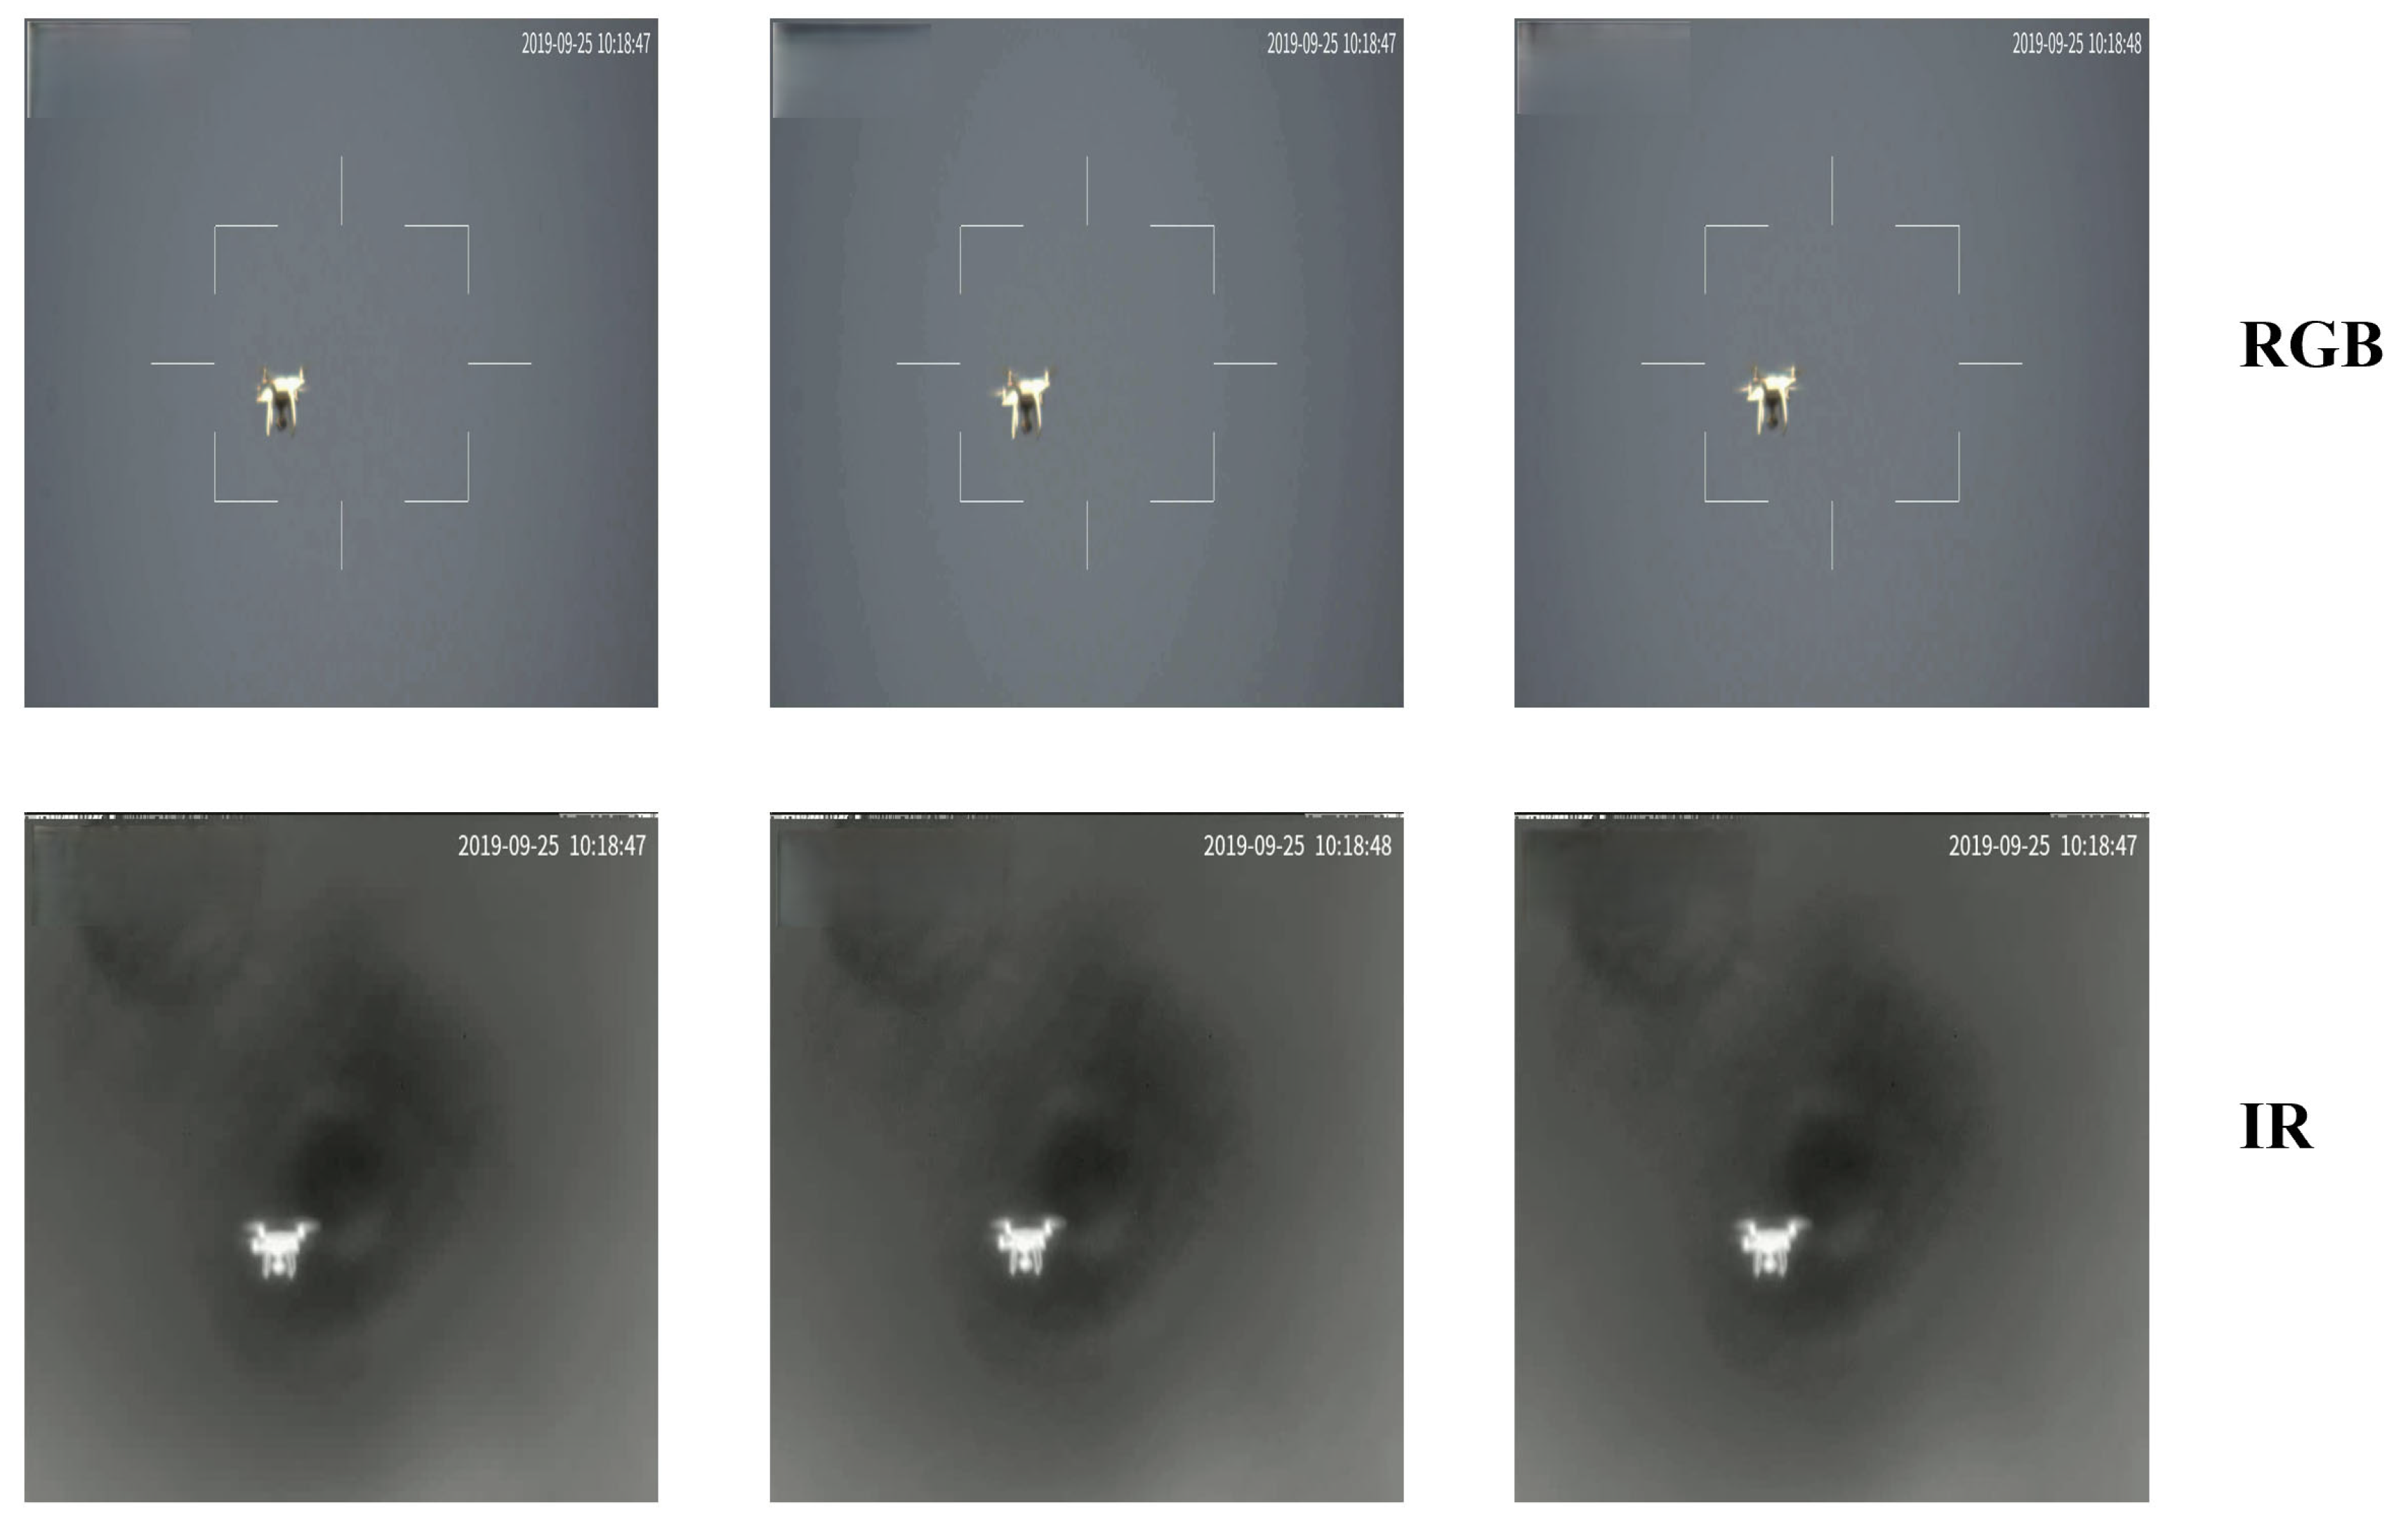
4.1. Datasets
4.2. Experiment Environment
4.3. Evaluate Metrics
4.3.1. Metrics of Object Detection
4.3.2. Metrics of MOT
4.4. Results Analysis of Object Detection
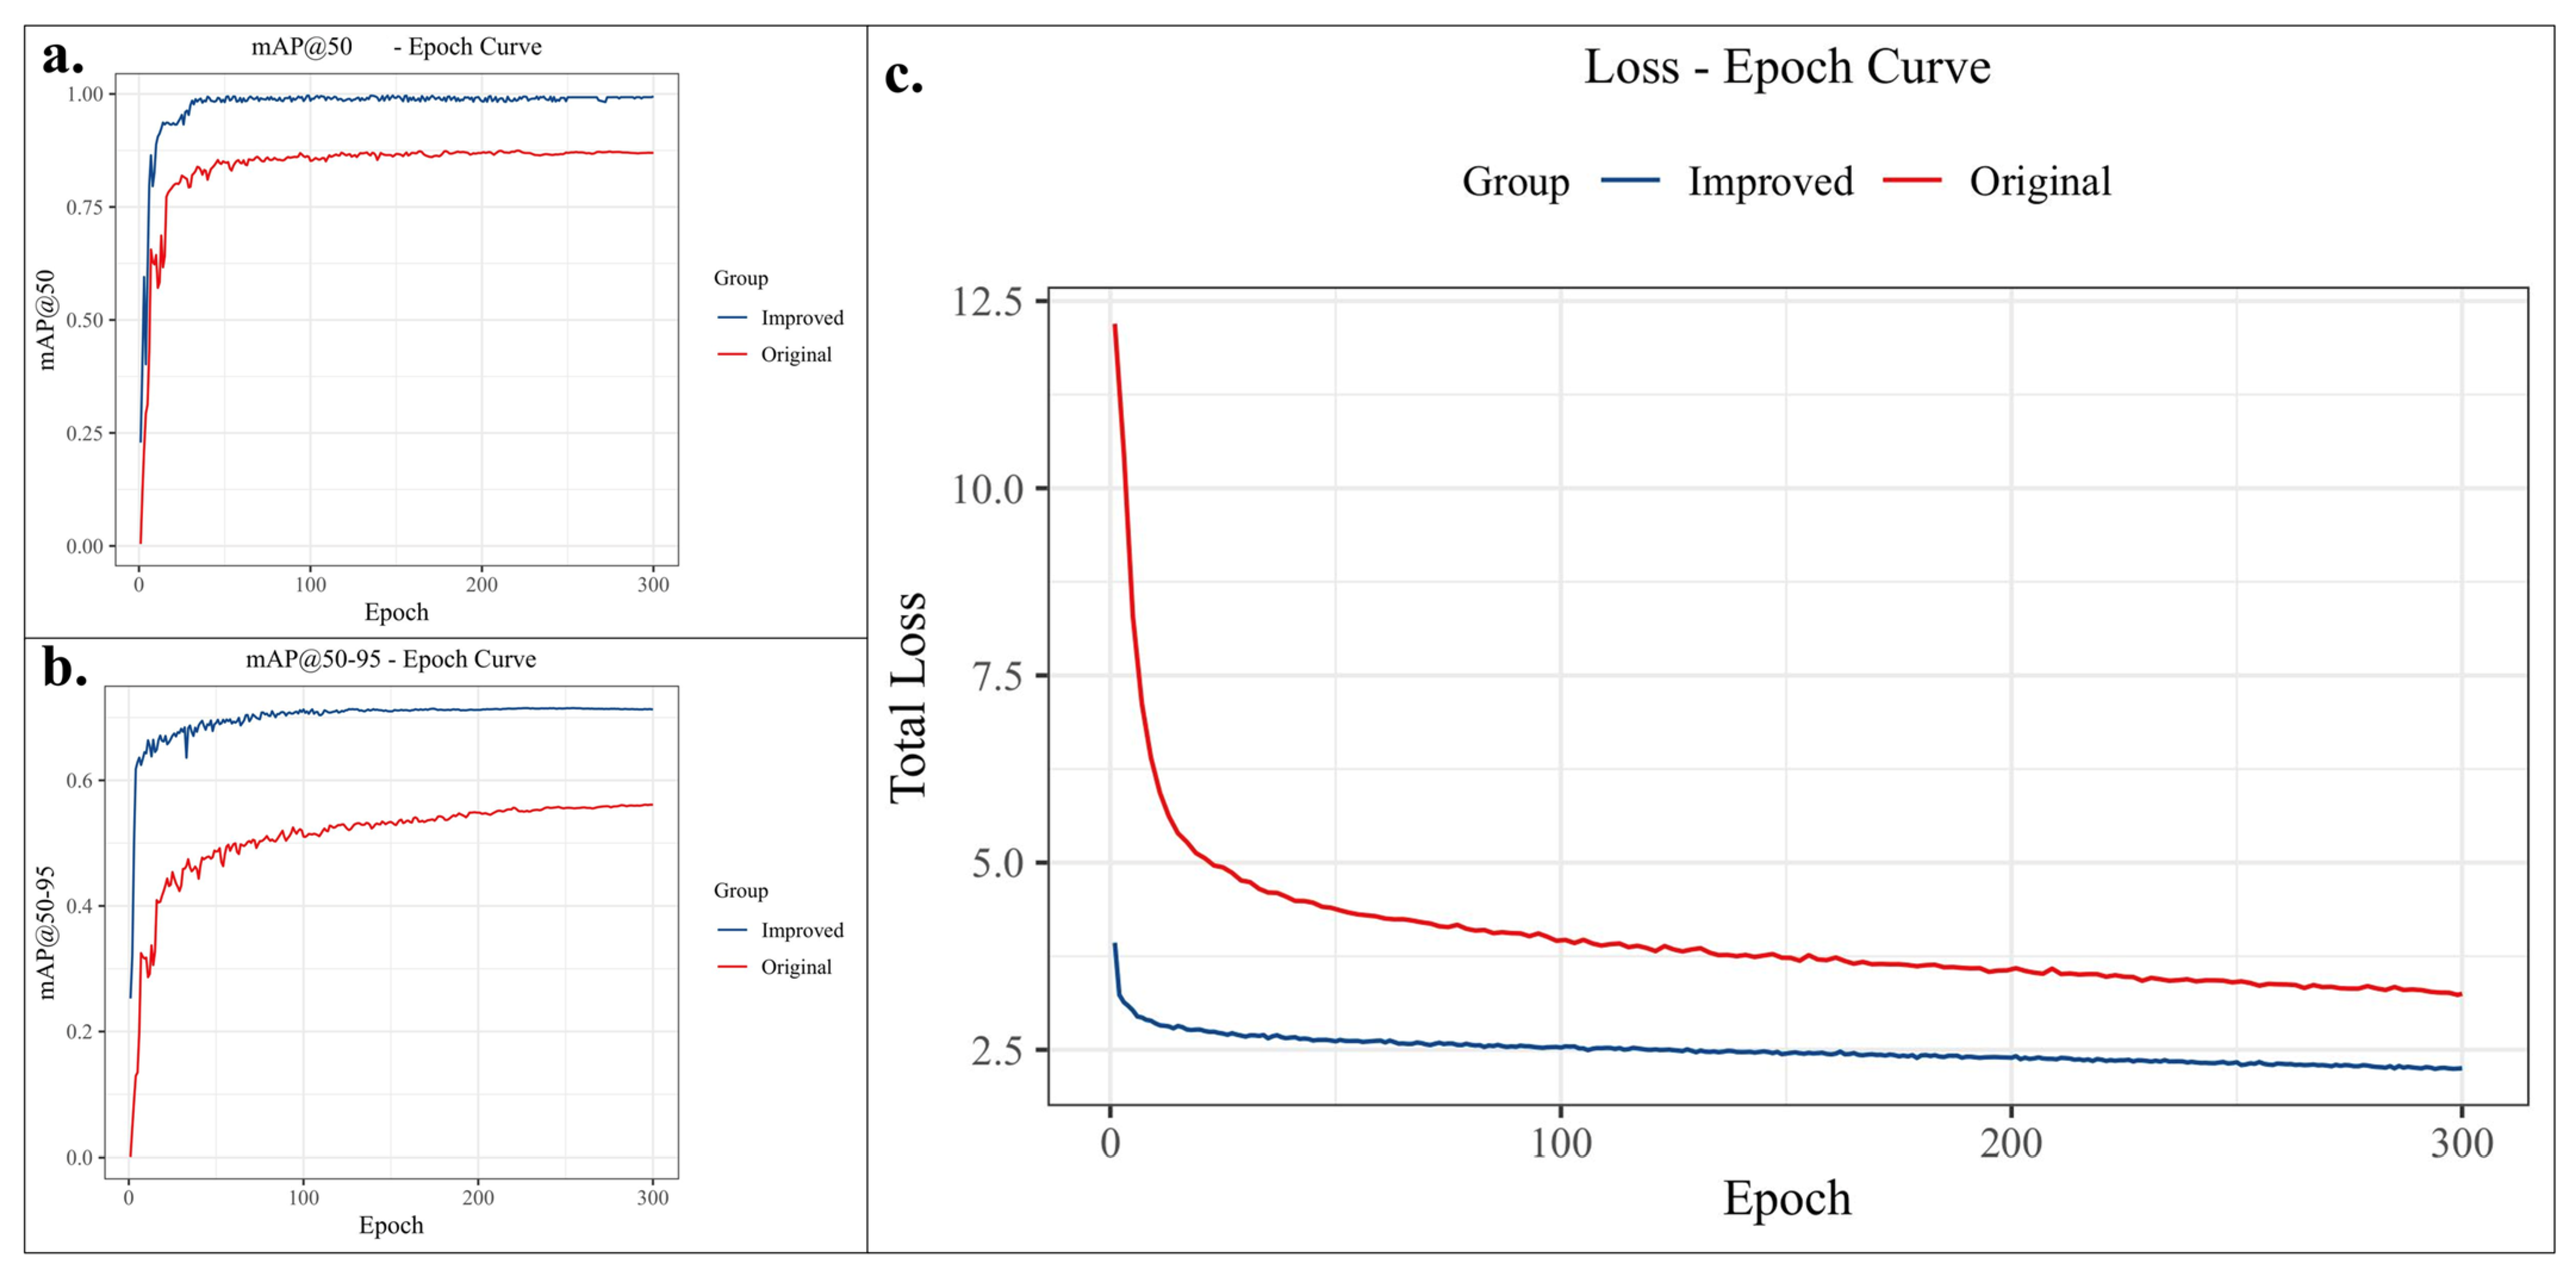
4.4.1. Overall Comparative Analysis of Models
4.4.2. Ablation Study
4.4.3. Multi Model Comparison
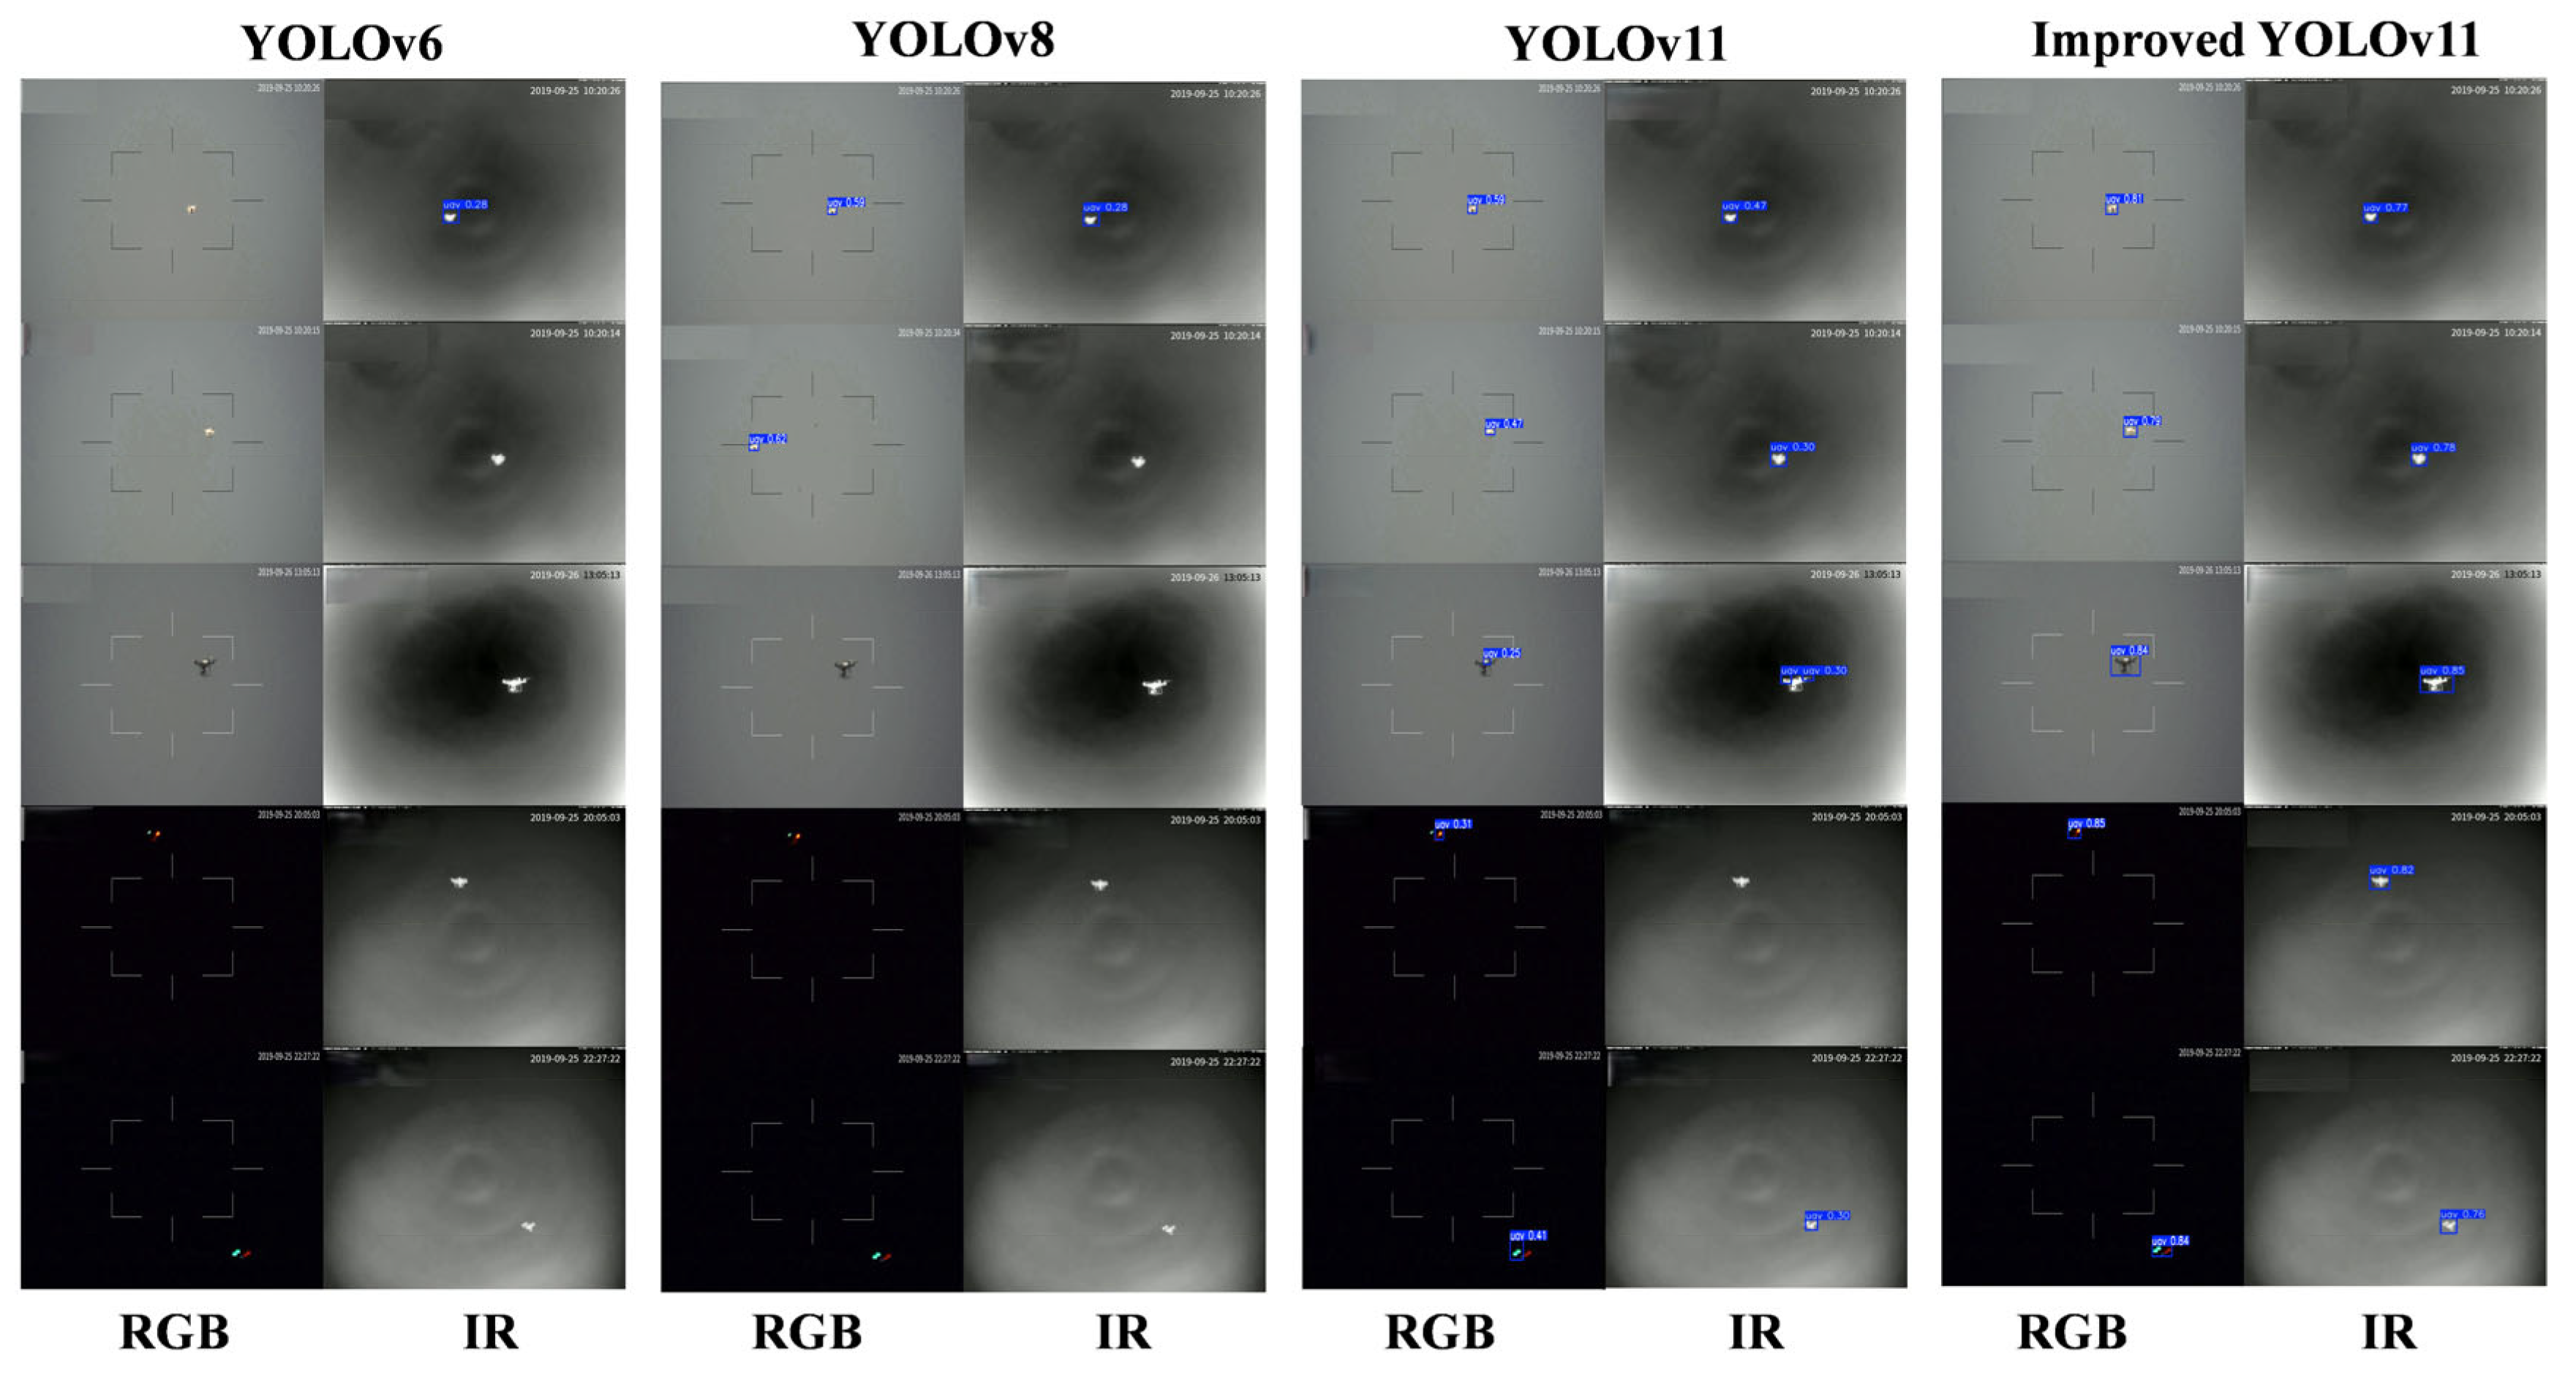
4.4.4. Multi-Model Scenario Application Comparison
4.5. Analysis of the Results of the Target Tracking Experiment
5. Discussion
- Construct a more comprehensive dataset of highly maneuverable drones across multi-environment and multi-scene scenarios, and introduce multi-modal cross-domain adaptive strategies to enhance the model’s adaptability and generalization ability in extreme environments (such as low visibility, rain, snow, etc.), thereby improving the robustness of the detection system in uncontrolled conditions;
- Leveraging the emerging advantages of large language models (LLM) in intelligent parsing, explore methods for fusing LLMs with target detection models to enable intelligent analysis and prediction of the behavioral intentions of highly maneuverable drones, thus promoting the detection system’s capability upgrade from the perception layer to the cognitive decision-making layer;
- Conduct in-depth comparative evaluations of detection efficiency between edge and cloud deployments, optimize model quantization and pruning strategies to enhance edge computing capabilities, while designing distributed detection network architectures to achieve collaborative monitoring across multiple nodes, thereby expanding surveillance coverage and improving the overall monitoring effectiveness of the system;
- Further investigate the effectiveness of target tracking detection algorithms and incorporate temporal information into the detection process. Integrate temporal dynamic information into the detection process, combined with trajectory prediction techniques, to achieve accurate prediction of the motion trajecto-ries and future position estimation of highly maneuverable drones, and construct an intelligent early-warning system that integrates detection, tracking, and prediction. This will provide a more sufficient response time window for the rapid identification and dispelling of drones in airport airspace.
6. Conclusions
Author Contributions
Funding
Data Availability Statement
Conflicts of Interest
References
- CBS News. Gatwick Airport Drones: 2 Arrested for Suspected “Criminal Use of Drones”. 22 December 2018. Available online: https://www.cbsnews.com/news/gatwick-airport-drones-2-arrested-for-suspected-criminal-use-of-drones-today-2018-12-22/ (accessed on 22 December 2018).
- CCTV. Tianjin Airport: Flight Operations Affected due to Public Safety Reasons Caused by Drones. CCTV News. 12 September 2024. Available online: https://news.cctv.com/2024/09/12/ARTIuf566famown5rIcmvsaP240912.shtml (accessed on 12 September 2024).
- Federal Aviation Administration (FAA). UAS Sightings Report. 2022. Available online: https://www.faa.gov/uas/resources/public_records/uas_sightings_report (accessed on 1 April 2025).
- Chiper, F.; Marţian, A.; Vlădeanu, C.; Marghescu, I.; Craciunescu, R.; Fratu, O. Drone Detection and Defense Systems: Survey and a Software-Defined Radio-Based Solution. Sensors 2022, 22, 1453. [Google Scholar] [CrossRef] [PubMed]
- Al-Sa’D, M.; Al-Ali, A.; Mohamed, A.; Khattab, T.; Erbad, A. RF-based drone detection and identification using deep learning approaches: An initiative towards a large open source drone database. Future Gener. Comput. Syst. 2019, 100, 86–97. [Google Scholar] [CrossRef]
- Singha, S.; Aydin, B. Automated Drone Detection Using YOLOv4. Drones 2021, 5, 95. [Google Scholar] [CrossRef]
- Peng, G.; Yang, Z.; Wang, S.; Zhou, Y. AMFLW-YOLO: A Lightweight Network for Remote Sensing Image Detection Based on Attention Mechanism and Multiscale Feature Fusion. IEEE Trans. Geosci. Remote Sens. 2023, 61, 4600916. [Google Scholar] [CrossRef]
- Ye, Y.; Ren, X.; Zhu, B.; Tang, T.; Tan, X.; Gui, Y.; Yao, Q. An Adaptive Attention Fusion Mechanism Convolutional Network for Object Detection in Remote Sensing Images. Remote Sens. 2022, 14, 516. [Google Scholar] [CrossRef]
- Chen, X.; Li, Y.; Nakatoh, Y. Pyramid attention object detection network with multi-scale feature fusion. Comput. Electr. Eng. 2020, 104, 108436. [Google Scholar] [CrossRef]
- Grác, Š.; Beňo, P.; Duchoň, F.; Dekan, M.; Tölgyessy, M. Automated detection of multi-rotor UAVs using a machine-learning approach. Appl. Syst. Innov. 2020, 3, 29. [Google Scholar] [CrossRef]
- Hoffmann, F.; Ritchie, M.; Fioranelli, F.; Charlish, A.; Griffiths, H. Micro-Doppler based detection and tracking of UAVs with multistatic radar. In Proceedings of the 2016 IEEE Radar Conference (RadarConf), Philadelphia, PA, USA, 2–6 May 2016; pp. 1–6. [Google Scholar] [CrossRef]
- Hengy, S.; Laurenzis, M.; Schertzer, S.; Hommes, A.; Kloeppel, F.; Shoykhetbrod, A.; Geibig, T.; Johannes, W.; Rassy, O.; Christnacher, F. Multimodal UAV detection: Study of various intrusion scenarios. In Proceedings of the Electro-Optical Remote Sensing XI, Warsaw, Poland, 11–14 September 2017; Volume 10434. [Google Scholar] [CrossRef]
- Qin, F.; Bu, X.; Zeng, Z.; Dang, X.; Liang, X. Small Target Detection for FOD Millimeter-Wave Radar Based on Compressed Imaging. IEEE Geosci. Remote Sens. Lett. 2022, 19, 4020705. [Google Scholar] [CrossRef]
- Nguyen, P.; Ravindranathan, M.; Nguyen, A.; Han, R.; Vu, T. Investigating Cost-effective RF-based Detection of Drones. In Proceedings of the 2nd Workshop on Micro Aerial Vehicle Networks, Systems, and Applications for Civilian Use, Singapore, 26 June 2016. [Google Scholar] [CrossRef]
- Medaiyese, O.; Syed, A.; Lauf, A. Machine Learning Framework for RF-Based Drone Detection and Identification System. In Proceedings of the 2021 2nd International Conference On Smart Cities, Automation & Intelligent Computing Systems (ICON-SONICS), Tangerang, Indonesia, 12–13 October 2021; pp. 58–64. [Google Scholar] [CrossRef]
- Sciancalepore, S.; Ibrahim, O.; Oligeri, G.; Pietro, R. Detecting Drones Status via Encrypted Traffic Analysis. In Proceedings of the ACM Workshop on Wireless Security and Machine Learning, Miami, FL, USA, 15–17 May 2019. [Google Scholar] [CrossRef]
- Svanström, F.; Alonso-Fernandez, F.; Englund, C. Drone Detection and Tracking in Real-Time by Fusion of Different Sensing Modalities. arXiv 2022, arXiv:2207.01927. [Google Scholar] [CrossRef]
- Hammer, M.; Borgmann, B.; Hebel, M.; Arens, M. A multi-sensorial approach for the protection of operational vehicles by detection and classification of small flying objects. In Proceedings of the Electro-Optical Remote Sensing XIV, Online, 21–25 September 2020; Volume 11538, pp. 1153807–1153812. [Google Scholar] [CrossRef]
- Wang, D.; Yang, Z.; Chen, F. Dual-modality Object Detection Approach Utilizing Enhanced and Fused Features. In Proceedings of the 2024 IEEE 6th International Conference on Civil Aviation Safety and Information Technology (ICCASIT), Hangzhou, China, 23–25 October 2024; pp. 709–715. [Google Scholar] [CrossRef]
- Hiba, A.; Gáti, A.; Manecy, A. Optical navigation sensor for runway relative positioning of aircraft during final approach. Sensors 2021, 21, 2203. [Google Scholar] [CrossRef]
- Krizhevsky, A.; Sutskever, I.; Hinton, G.E. Imagenet classification with deep convolutional neural networks. Adv. Neural Inf. Process. Syst. 2012, 60, 84–90. [Google Scholar] [CrossRef]
- Liu, L.; Ouyang, W.; Wang, X.; Fieguth, P.; Chen, J.; Liu, X.; Pietikäinen, M. Deep learning for generic object detection: A survey. Int. J. Comput. Vis. 2020, 128, 261–318. [Google Scholar] [CrossRef]
- Zhao, J.; Zhang, J.; Li, D.; Wang, D. Vision-Based Anti-UAV Detection and Tracking. IEEE Trans. Intell. Transp. Syst. 2022, 23, 25323–25334. [Google Scholar] [CrossRef]
- Munir, A.; Siddiqui, A.J. Vision-based UAV Detection in Complex Backgrounds and Rainy Conditions. In Proceedings of the 2024 2nd International Conference on Disruptive Technologies (ICDT), Greater Noida, India, 15–16 March 2024; pp. 1097–1102. [Google Scholar] [CrossRef]
- Shovon MH, I.; Gopalan, R.; Campbell, B. A comparative analysis of deep learning algorithms for optical drone detection. In Proceedings of the Fifteenth International Conference on Machine Vision (ICMV 2022), Rome, Italy, 18–20 November 2022; Volume 12701, pp. 1270104–1270108. [Google Scholar] [CrossRef]
- Xun DT, W.; Lim, Y.L.; Srigrarom, S. Drone detection using YOLOv3 with transfer learning on NVIDIA Jetson TX2. In Proceedings of the 2021 Second International Symposium on Instrumentation, Control, Artificial Intelligence, and Robotics (ICA-SYMP), Bangkok, Thailand, 20–22 January 2021; pp. 1–6. [Google Scholar] [CrossRef]
- Isaac-Medina BK, S.; Poyser, M.; Organisciak, D.; Willcocks, C.G.; Breckon, T.; Shum, H.P.H. Unmanned Aerial Vehicle Visual Detection and Tracking using Deep Neural Networks: A Performance Benchmark. In Proceedings of the 2021 IEEE/CVF International Conference on Computer Vision Workshops (ICCVW), Montreal, BC, Canada, 11–17 October 2021; pp. 1223–1232. [Google Scholar] [CrossRef]
- Hakani, R.; Rawat, A. Edge Computing-Driven Real-Time Drone Detection Using YOLOv9 and NVIDIA Jetson Nano. Drones 2024, 8, 680. [Google Scholar] [CrossRef]
- Liu, J.; Zhang, F.; Zhao, H.; Lu, Q.D.; Feng, B.; Feng, L. Recognition and Detection of UAV Based on Transfer Learning. In Proceedings of the 2023 8th International Conference on Multimedia and Image Processing, Tianjin, China, 21–23 April 2023. [Google Scholar] [CrossRef]
- Khan, M.U.; Dil, M.; Misbah, M.; Orakazi, F.A.; Alam, M.Z.; Kaleem, Z. TransLearn-YOLOx: Improved-YOLO with Transfer Learning for Fast and Accurate Multiclass UAV Detection. In Proceedings of the 2023 International Conference on Communication, Computing and Digital Systems (C-CODE), Islamabad, Pakistan, 17–18 May 2023; pp. 1–7. [Google Scholar] [CrossRef]
- Liu, H.; Fan, K.; Ouyang, Q.; Li, N. Real-Time Small Drones Detection Based on Pruned YOLOv4. Sensors 2021, 21, 3374. [Google Scholar] [CrossRef]
- Zamri, F.; Gunawan, T.; Yusoff, S.; Alzahrani, A.; Bramantoro, A.; Kartiwi, M. Enhanced Small Drone Detection Using Optimized YOLOv8 With Attention Mechanisms. IEEE Access 2024, 12, 90629–90643. [Google Scholar] [CrossRef]
- Gökçe, F.; Üçoluk, G.; Şahin, E.; Kalkan, S. Vision-based detection and distance estimation of micro unmanned aerial vehicles. Sensors 2015, 15, 23805–23846. [Google Scholar] [CrossRef]
- Wang, C.; Meng, L.; Gao, Q.; Wang, J.; Wang, T.; Liu, X.; Du, F.; Wang, L.; Wang, E. A Lightweight Uav Swarm Detection Method Integrated Attention Mechanism. Drones 2023, 7, 13. [Google Scholar] [CrossRef]
- Tian, X.; Jia, Y.; Luo, X.; Yin, J. Small Target Recognition and Tracking Based on UAV Platform. Sensors 2022, 22, 6579. [Google Scholar] [CrossRef]
- Wu, H.; Nie, J.; He, Z.; Zhu, Z.; Gao, M. One-Shot Multiple Object Tracking in UAV Videos Using Task-Specific Fine-Grained Features. Remote Sens. 2022, 14, 3853. [Google Scholar] [CrossRef]
- Keawboontan, T.; Thammawichai, M. Toward Real-Time UAV Multi-Target Tracking Using Joint Detection and Tracking. IEEE Access 2023, 11, 65238–65254. [Google Scholar] [CrossRef]
- Ma, J.; Liu, D.; Qin, S.; Jia, G.; Zhang, J.; Xu, Z. An Asymmetric Feature Enhancement Network for Multiple Object Tracking of Unmanned Aerial Vehicle. Remote Sens. 2023, 16, 70. [Google Scholar] [CrossRef]
- Wang, P.; Wang, Y.; Li, D. DroneMOT: Drone-based Multi-Object Tracking Considering Detection Difficulties and Simultaneous Moving of Drones and Objects. In Proceedings of the 2024 IEEE International Conference on Robotics and Automation (ICRA), Yokohama, Japan, 13–17 May 2024; pp. 7397–7404. [Google Scholar] [CrossRef]
- Ma, J.; Tang, C.; Wu, F.; Zhao, C.; Zhang, J.; Xu, Z. STCMOT: Spatio-Temporal Cohesion Learning for UAV-Based Multiple Object Tracking. In Proceedings of the 2024 IEEE International Conference on Multimedia and Expo (ICME), Niagara Falls, ON, Canada, 15–19 July 2024; pp. 1–6. [Google Scholar] [CrossRef]
- Wen, J.; Wang, D.; Fang, J.; Li, Y.; Xu, Z. Multi-Object Tracking for Unmanned Aerial Vehicles Based on Multi-Frame Feature Fusion. In Proceedings of the ICASSP 2024—2024 IEEE International Conference on Acoustics, Speech and Signal Processing (ICASSP), Seoul, Republic of Korea, 14–19 April 2024; pp. 4180–4184. [Google Scholar] [CrossRef]
- Zhang, B.; Su, W.; Lu, G.; Zang, D.; Li, X. Research on Drone Multi-Target Tracking Algorithm Based on Pseudo Depth. In Proceedings of the 2024 3rd International Conference on Robotics, Artificial Intelligence and Intelligent Control (RAIIC), Mianyang, China, 5–7 July 2024; pp. 485–489. [Google Scholar] [CrossRef]
- Yao, M.; Peng, J.; He, Q.; Peng, B.; Chen, H.; Chi, M.; Liu, C.; Benediktsson, J. MM-Tracker: Motion Mamba for UAV-platform Multiple Object Tracking. In Proceedings of the AAAI Conference on Artificial Intelligence, Philadelphia, PA, USA, 25 February–4 March 2025; pp. 9409–9417. [Google Scholar] [CrossRef]
- Yavariabdi, A.; Kusetogullari, H.; Çelik, T.; Cicek, H. FastUAV-NET: A Multi-UAV Detection Algorithm for Embedded Platforms. Electronics 2021, 10, 724. [Google Scholar] [CrossRef]
- Ntousis, O.; Makris, E.; Tsanakas, P.; Pavlatos, C. A Dual-Stage Processing Architecture for Unmanned Aerial Vehicle Object Detection and Tracking Using Lightweight Onboard and Ground Server Computations. Technologies 2025, 13, 35. [Google Scholar] [CrossRef]
- Liu, S.; Li, X.; Lu, H.; He, Y. Multi-Object Tracking Meets Moving UAV. In Proceedings of the 2022 IEEE/CVF Conference on Computer Vision and Pattern Recognition (CVPR), New Orleans, LA, USA, 18–24 June 2022; pp. 8866–8875. [Google Scholar] [CrossRef]
- Song, I.; Lee, J. SFTrack: A Robust Scale and Motion Adaptive Algorithm for Tracking Small and Fast Moving Objects. In Proceedings of the 2024 IEEE/RSJ International Conference on Intelligent Robots and Systems (IROS), Abu Dhabi, United Arab Emirates, 14–18 October 2024; pp. 10870–10877. [Google Scholar] [CrossRef]
- Ji, D.; Gao, S.; Zhu, L.; Zhao, Y.; Xu, P.; Lu, H.; Zhao, F. View-Centric Multi-Object Tracking with Homographic Matching in Moving UAV. arXiv 2024, arXiv:2403.10830. [Google Scholar] [CrossRef]
- Wu, X.; Li, W.; Hong, D.; Tao, R.; Du, Q. Deep Learning for Unmanned Aerial Vehicle-Based Object Detection and Tracking: A survey. IEEE Geosci. Remote Sens. Mag. 2021, 10, 91–124. [Google Scholar] [CrossRef]
- Jegham, N.; Koh, C.Y.; Abdelatti, M.; Hendawi, A. Evaluating the Evolution of Yolo (You Only Look Once) Models: A Comprehensive Benchmark Study of Yolo11 and Its Predecessors. arXiv 2024, arXiv:2411.00201. preprint. [Google Scholar] [CrossRef]
- Li, J.; Zhang, Z.; Zuo, W. Rethinking Transformer-Based Blind-Spot Network for Self-Supervised Image Denoising. arXiv 2024. [Google Scholar] [CrossRef]
- Nguyen, L.; Zhang, C.; Shi, Y.; Hirakawa, T.; Yamashita, T.; Matsui, T.; Fujiyoshi, H. DeBiFormer: Vision Transformer with Deformable Agent Bi-level Routing Attention. arXiv 2024. [Google Scholar] [CrossRef]
- Liu, H.; Peng, B.; Ding, P.; Wang, D. Rethinking Target Label Conditioning in Adversarial Attacks: A 2D Tensor-Guided Generative Approach. arXiv 2025. [Google Scholar] [CrossRef]
- Yang, J.; Liu, S.; Wu, J.; Su, X.; Hai, N.; Huang, X. Pinwheel-shaped Convolution and Scale-based Dynamic Loss for Infrared Small Target Detection. arXiv 2024. [Google Scholar] [CrossRef]


| Module | Original Method | Improved Method |
|---|---|---|
| Fusion Architecture | Single-modal input with simple feature concatenation | Dual-path hierarchical fusion (RIFusion + ADD modules) |
| Feature Extraction | C3 fixed convolution kernels | Multi-scale deformable convolution (3 × 3/5 × 5 combinations) |
| Attention Mechanism | None | Agent queries with deformable point-based two-level routing |
| Feature Fusion | Direct concatenation | Spatial-adaptive gated bidirectional complementation |
| Detection Head | Conventional symmetric convolution | Pinwheel-shaped asymmetric convolution |
| Loss Function | Standard IoU Loss | Wasserstein Distance Loss with gradient guidance |
| C3k2-DATB | BRSA | SDI | PCHead | WD-Loss | Params/M | GFLOPS | mAP@50 | mAP@50_95 | |
|---|---|---|---|---|---|---|---|---|---|
| 1 | 2.91 | 7.7 | 81.9 | 56.1 | |||||
| 2 | * | 2.92 | 7.9 | 82.5 | 57.9 | ||||
| 3 | * | * | 2.13 | 6.2 | 87.6 | 65.4 | |||
| 4 | * | * | * | 2.31 | 6.5 | 91.4 | 69.3 | ||
| 5 | * | * | * | * | 2.72 | 7.3 | 95.7 | 70.8 | |
| 6 | * | * | * | * | * | 2.54 | 7.8 | 99.3 | 71.3 |
| Model | Precision/% | Recall/% | Params/M | GFLOPS | mAP@50 | mAP@50_95 |
|---|---|---|---|---|---|---|
| RT-DETR | 65.3 | 83.4 | 427.6 | 130.5 | 71.2 | 43.1 |
| YOLOv5 | 67.2 | 81.5 | 2.5 | 7.2 | 73.5 | 45.6 |
| YOLOv6 | 66.5 | 81.9 | 4.2 | 11.9 | 77.1 | 44.3 |
| YOLOv8 | 70.1 | 80.3 | 3.1 | 8.2 | 81.5 | 53.7 |
| YOLOv9 | 70.8 | 79.4 | 2 | 7.8 | 76.7 | 51.2 |
| YOLOv10 | 73.7 | 82.6 | 2.71 | 8.4 | 80.2 | 49.8 |
| YOLOv11 | 74.1 | 77.2 | 2.91 | 7.7 | 81.9 | 56.1 |
| Improved-YOLOv11 | 98.9 | 98.5 | 2.54 | 7.8 | 99.3 | 71.3 |
| Video | MOTA/% | MOTP/% | FN | FP | IDS | IDF1/% |
|---|---|---|---|---|---|---|
| MOT01(IR) | 93.2 | 87.5 | 5 | 0 | 15 | 93.5 |
| MOT01(RGB) | 89.4 | 82.7 | 7 | 0 | 17 | 91.4 |
| Overall | 91.3 | 85.1 | 12 | 0 | 5.0 | 93.0 |
Disclaimer/Publisher’s Note: The statements, opinions and data contained in all publications are solely those of the individual author(s) and contributor(s) and not of MDPI and/or the editor(s). MDPI and/or the editor(s) disclaim responsibility for any injury to people or property resulting from any ideas, methods, instructions or products referred to in the content. |
© 2025 by the authors. Licensee MDPI, Basel, Switzerland. This article is an open access article distributed under the terms and conditions of the Creative Commons Attribution (CC BY) license (https://creativecommons.org/licenses/by/4.0/).
Share and Cite
Luan, T.; Zhou, S.; Zhang, Y.; Pan, W. Fast Identification and Detection Algorithm for Maneuverable Unmanned Aircraft Based on Multimodal Data Fusion. Mathematics 2025, 13, 1825. https://doi.org/10.3390/math13111825
Luan T, Zhou S, Zhang Y, Pan W. Fast Identification and Detection Algorithm for Maneuverable Unmanned Aircraft Based on Multimodal Data Fusion. Mathematics. 2025; 13(11):1825. https://doi.org/10.3390/math13111825
Chicago/Turabian StyleLuan, Tian, Shixiong Zhou, Yicheng Zhang, and Weijun Pan. 2025. "Fast Identification and Detection Algorithm for Maneuverable Unmanned Aircraft Based on Multimodal Data Fusion" Mathematics 13, no. 11: 1825. https://doi.org/10.3390/math13111825
APA StyleLuan, T., Zhou, S., Zhang, Y., & Pan, W. (2025). Fast Identification and Detection Algorithm for Maneuverable Unmanned Aircraft Based on Multimodal Data Fusion. Mathematics, 13(11), 1825. https://doi.org/10.3390/math13111825