
Graph-Theoretic Detection of Anomalies in Supply Chains: A PoR-Based Approach Using Laplacian Flow and Sheaf Theory


Abstract
1. Introduction
2. Related Work
2.1. Graph Theory as the Theoretical Foundation for Distributed Algorithms
2.2. Applications of Laplacian Flow and Graph Balancing in Anomaly Detection
2.3. Sheaf Theory and Topological Consistency Models
2.4. Supply Chains as Complex Directed Graph Models
2.5. PoR and Proof Algorithms in Graph Structures
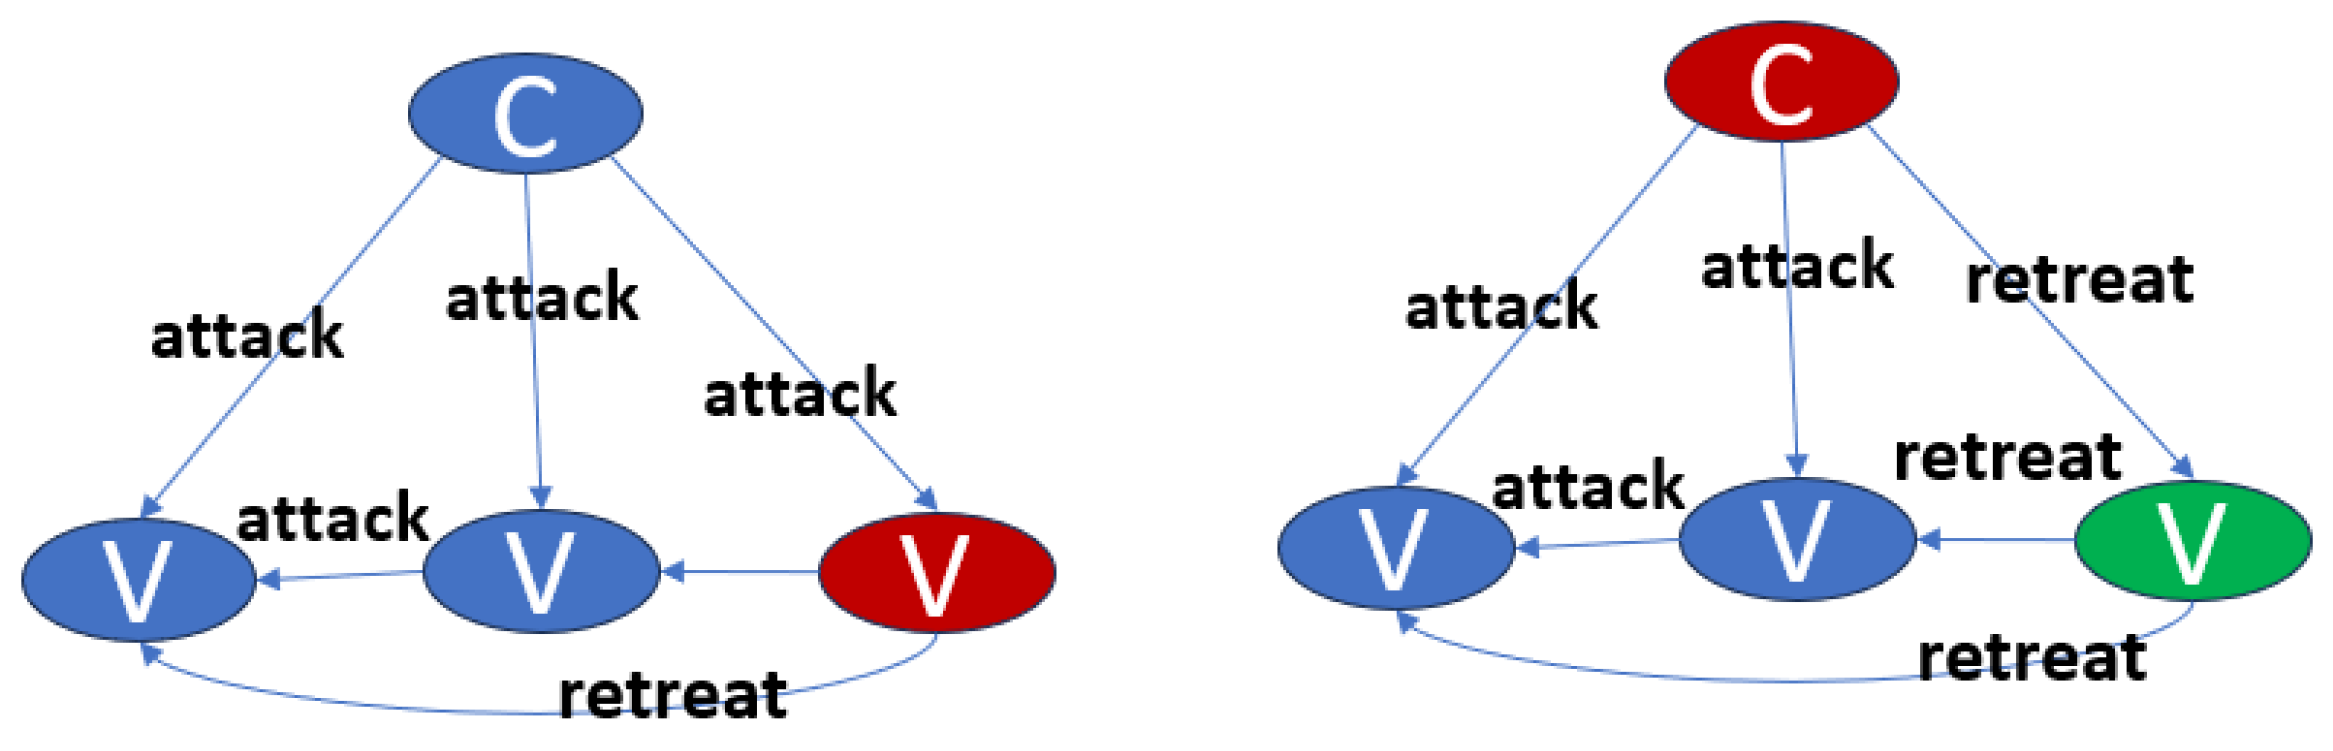
- Extract stable decision-making patterns from the historical records of nodes;
- Perform deviation analysis on current observed behaviors to determine whether they significantly violate past patterns;
- Use only non-deviating nodes to conduct subsequent consensus voting and state synchronization operations.
2.6. Issues of Supply Chain Transparency and Trust
3. Methodology: Graph-Based Modeling and PoR
3.1. Detection-Oriented Topological Modeling
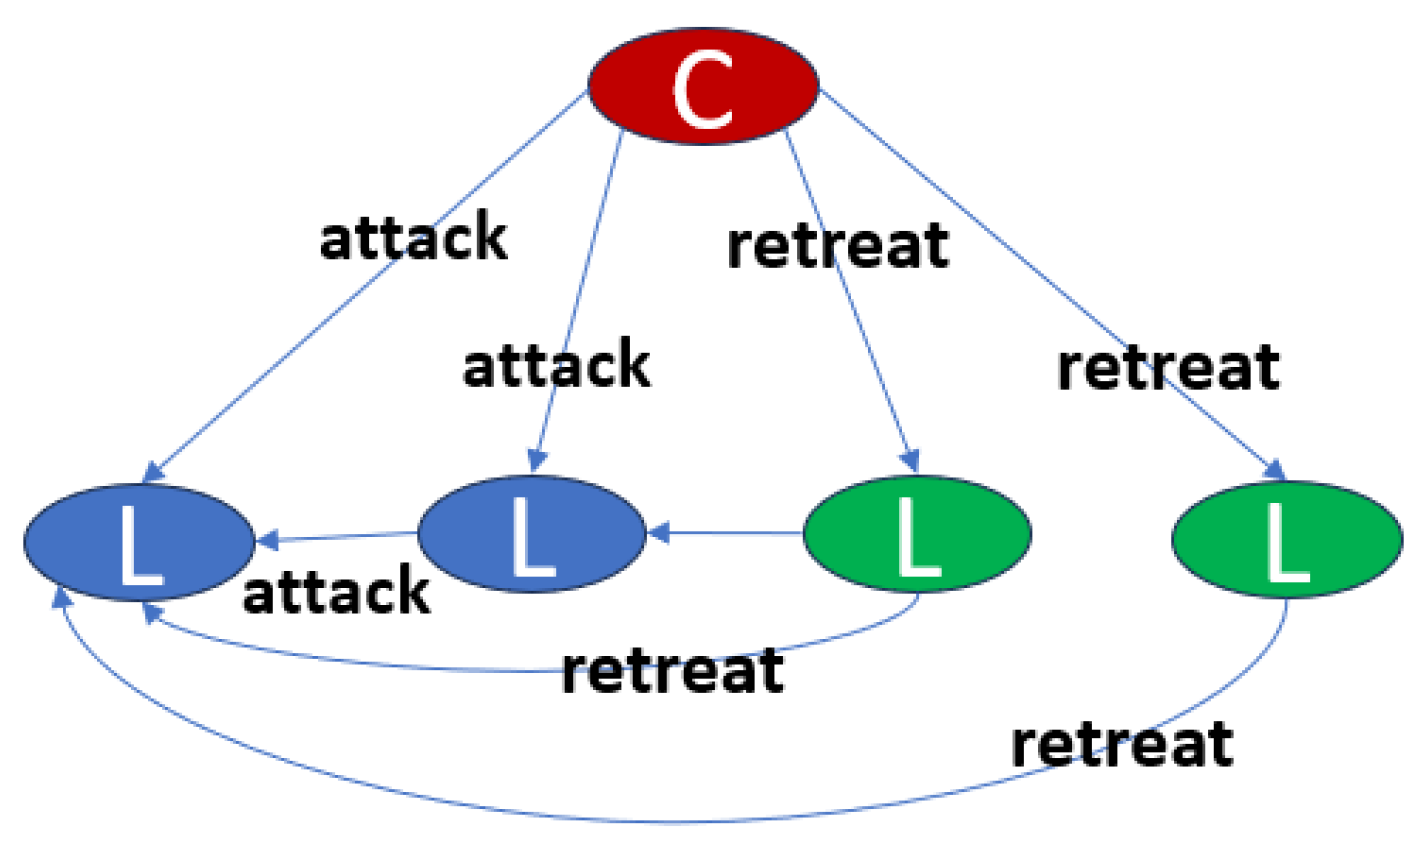
- Extract stable decision-making patterns from the historical records of nodes;
- Perform deviation analysis on current observed behaviors to determine whether they significantly violate past patterns;
- Use only non-deviating nodes to conduct subsequent consensus voting and state synchronization operations.
- Construct the graph-theoretic structure of the overall supply chain procurement relationships along with the corresponding global feature functions;
- Estimate the degree to which individual enterprises deviate from the global features based on Graph Balancing and Laplacian Flow principles;
- Transform the degree of deviation into an “anomaly metric”, which is then used to determine whether a node exhibits potential data manipulation behavior.
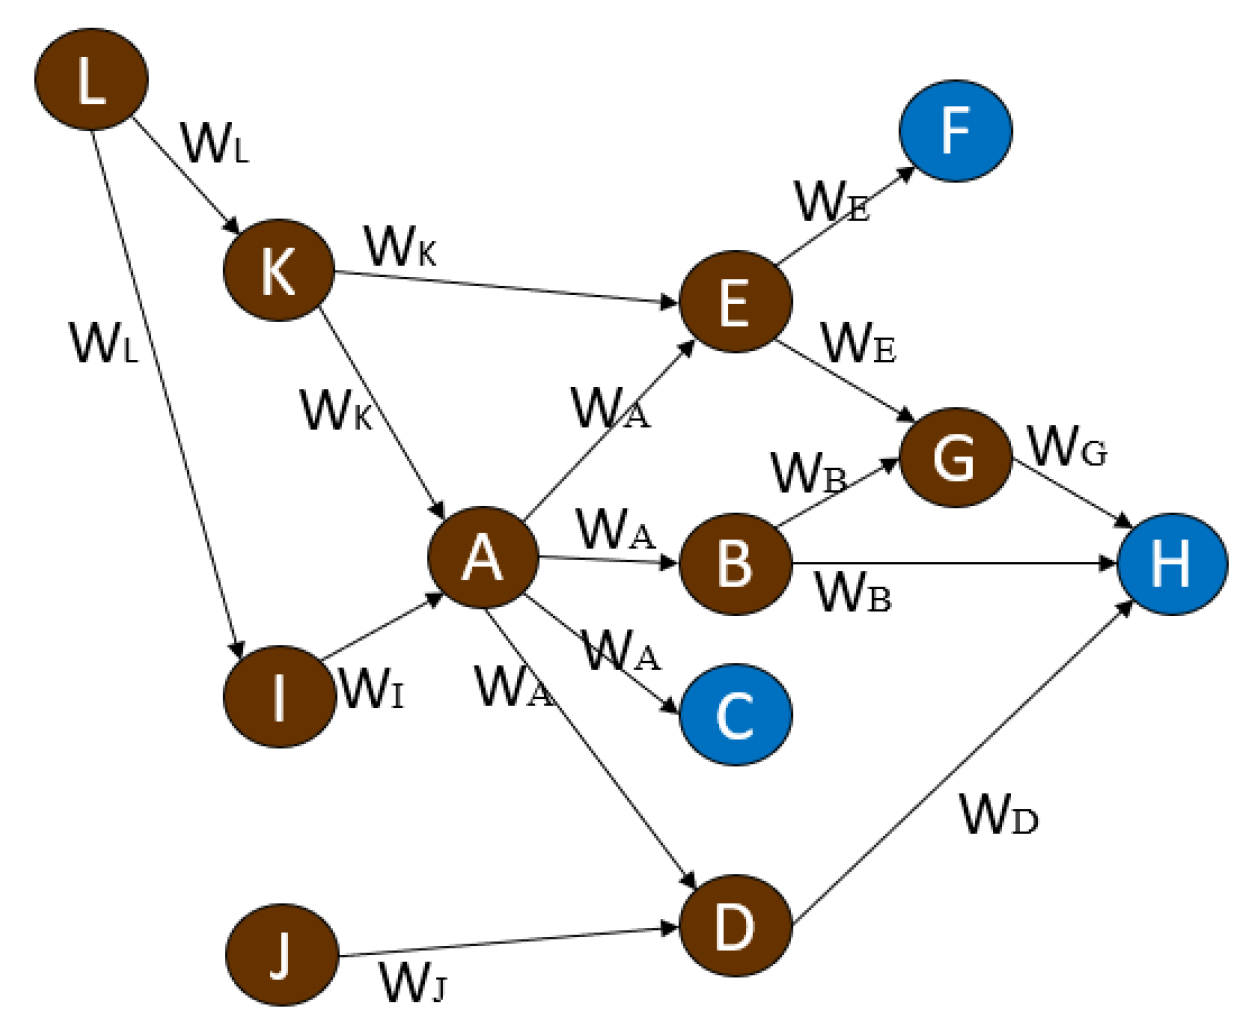
- V = {A, B, …, L} denotes the set of enterprise nodes;E⊆ V × V represents the set of directed edges, indicating the direction of procurements;
- The weight function W: E→R+ assigns to each edge the corresponding profit margin applicable to the transaction amount;
- Specific nodes C, F, H ∈ V represent terminal retailers, which are highlighted as blue nodes in the graph.
- Local Closedness: Each node vN ∈ V can only receive information from its upstream adjacent nodes (in-degree), and its outgoing edges (out-degree) represent its supply to downstream nodes. This complies with the Sheaf-theoretic principle that local data functions cannot be arbitrarily modified across nodes;
- Global Consistency and Traceability: Through the combination of directed edges, any retail node vN ∈ {C, F, H} has at least one directed path that can be traced back to its upstream suppliers, ensuring the weak connectivity of the overall graph. This property guarantees that the global profit function WSC can be coherently assembled from local functions WN;
- Topological Conservation Mapping: In this study, the local feature WN at each node and the edge weight w(eNj) are constrained by a form of conservation condition (e.g., margin rate conservation), which can be mathematically characterized as a weighted Laplacian structure over the flow network. Violations of this balance form the basis for anomaly detection.
3.2. Mathematical Formulation Based on Laplacian Flow and Conservation Laws
- Each node has a local function PN representing its recorded procurement margin rates;
- The global supply chain margin profile can be represented as a Laplacian structure integrated from the collection of PN functions;
- When certain PN significantly deviate from the structure, they can be identified as potential anomaly sources through PoR;
- This structure satisfies topological consistency and allows for the derivation of formal anomaly deviation indices and mathematical proofs (to be elaborated in the next subsection).
- The performance of enterprise E is PE = 1000;
- The performance of enterprise A is PA = 500;
- Therefore, the profit transmission ratio between A and E is w5 = 500 / 1000 = 0.5.
3.3. Mathematical Proof of Anomaly Detection via PoR
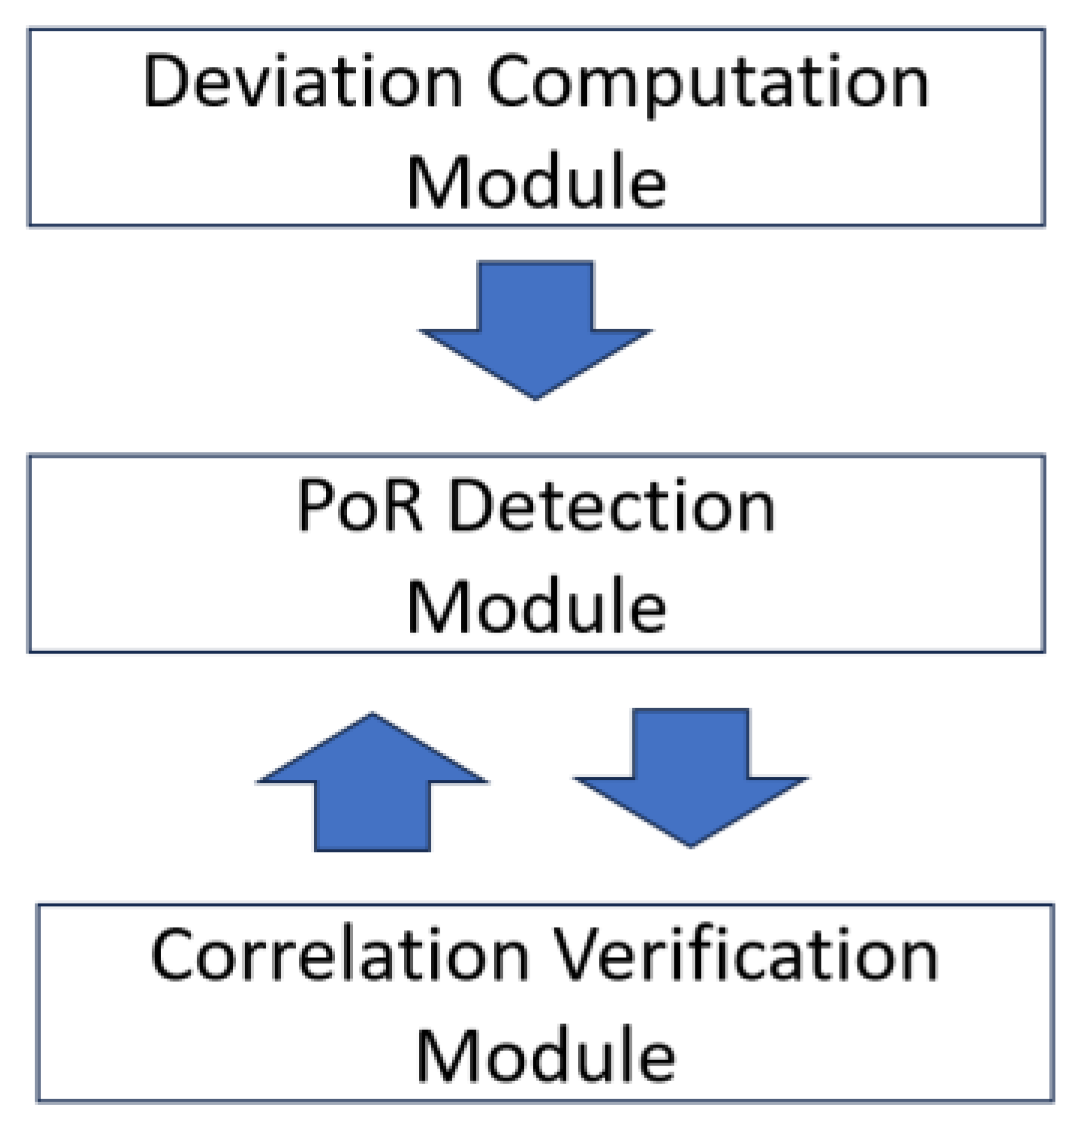
3.4. System Architecture
- Deviation Computation Module;
- PoR Detection Module;
- Correlation Verification Module.
3.4.1. Deviation Computation Module
- Normalization: Each node vN’s procurement data (uiN) is normalized by its total assets, i.e., uiN = uiN / Total AssetsN, to eliminate the influence of firm size differences;
- Percentile Mapping: For each procurement variable (ui), the data across companies and years are ranked and transformed into percentile values;
- Cross-Year Variability Estimation: For each enterprise, the variability (standard deviation) of each procurement variable across years is calculated, and the average deviation across all variables is computed to derive a preliminary anomaly indicator ΔN;
- Output of the Deviation Feature Set I = {ΔN}: Finally, a multidimensional feature space is generated as the input for the subsequent PoR Detection Module.
3.4.2. PoR Detection Module
- The deviation indicators I = {ΔN} produced by the previous module are derived based on the following concepts:
- Graph-Level Aggregate Benchmark: All enterprises’ deviation indicators are statistically aggregated to construct a “global supply chain performance feature vector” WSC, serving as the theoretical benchmark;
- Deviation Magnitude Evaluation: The distance between each enterprise’s feature vector wN and WSC is computed, resulting in a new deviation measure δN=∥wN − WSC∥, which serves as the anomaly intensity indicator used for PoR detection.
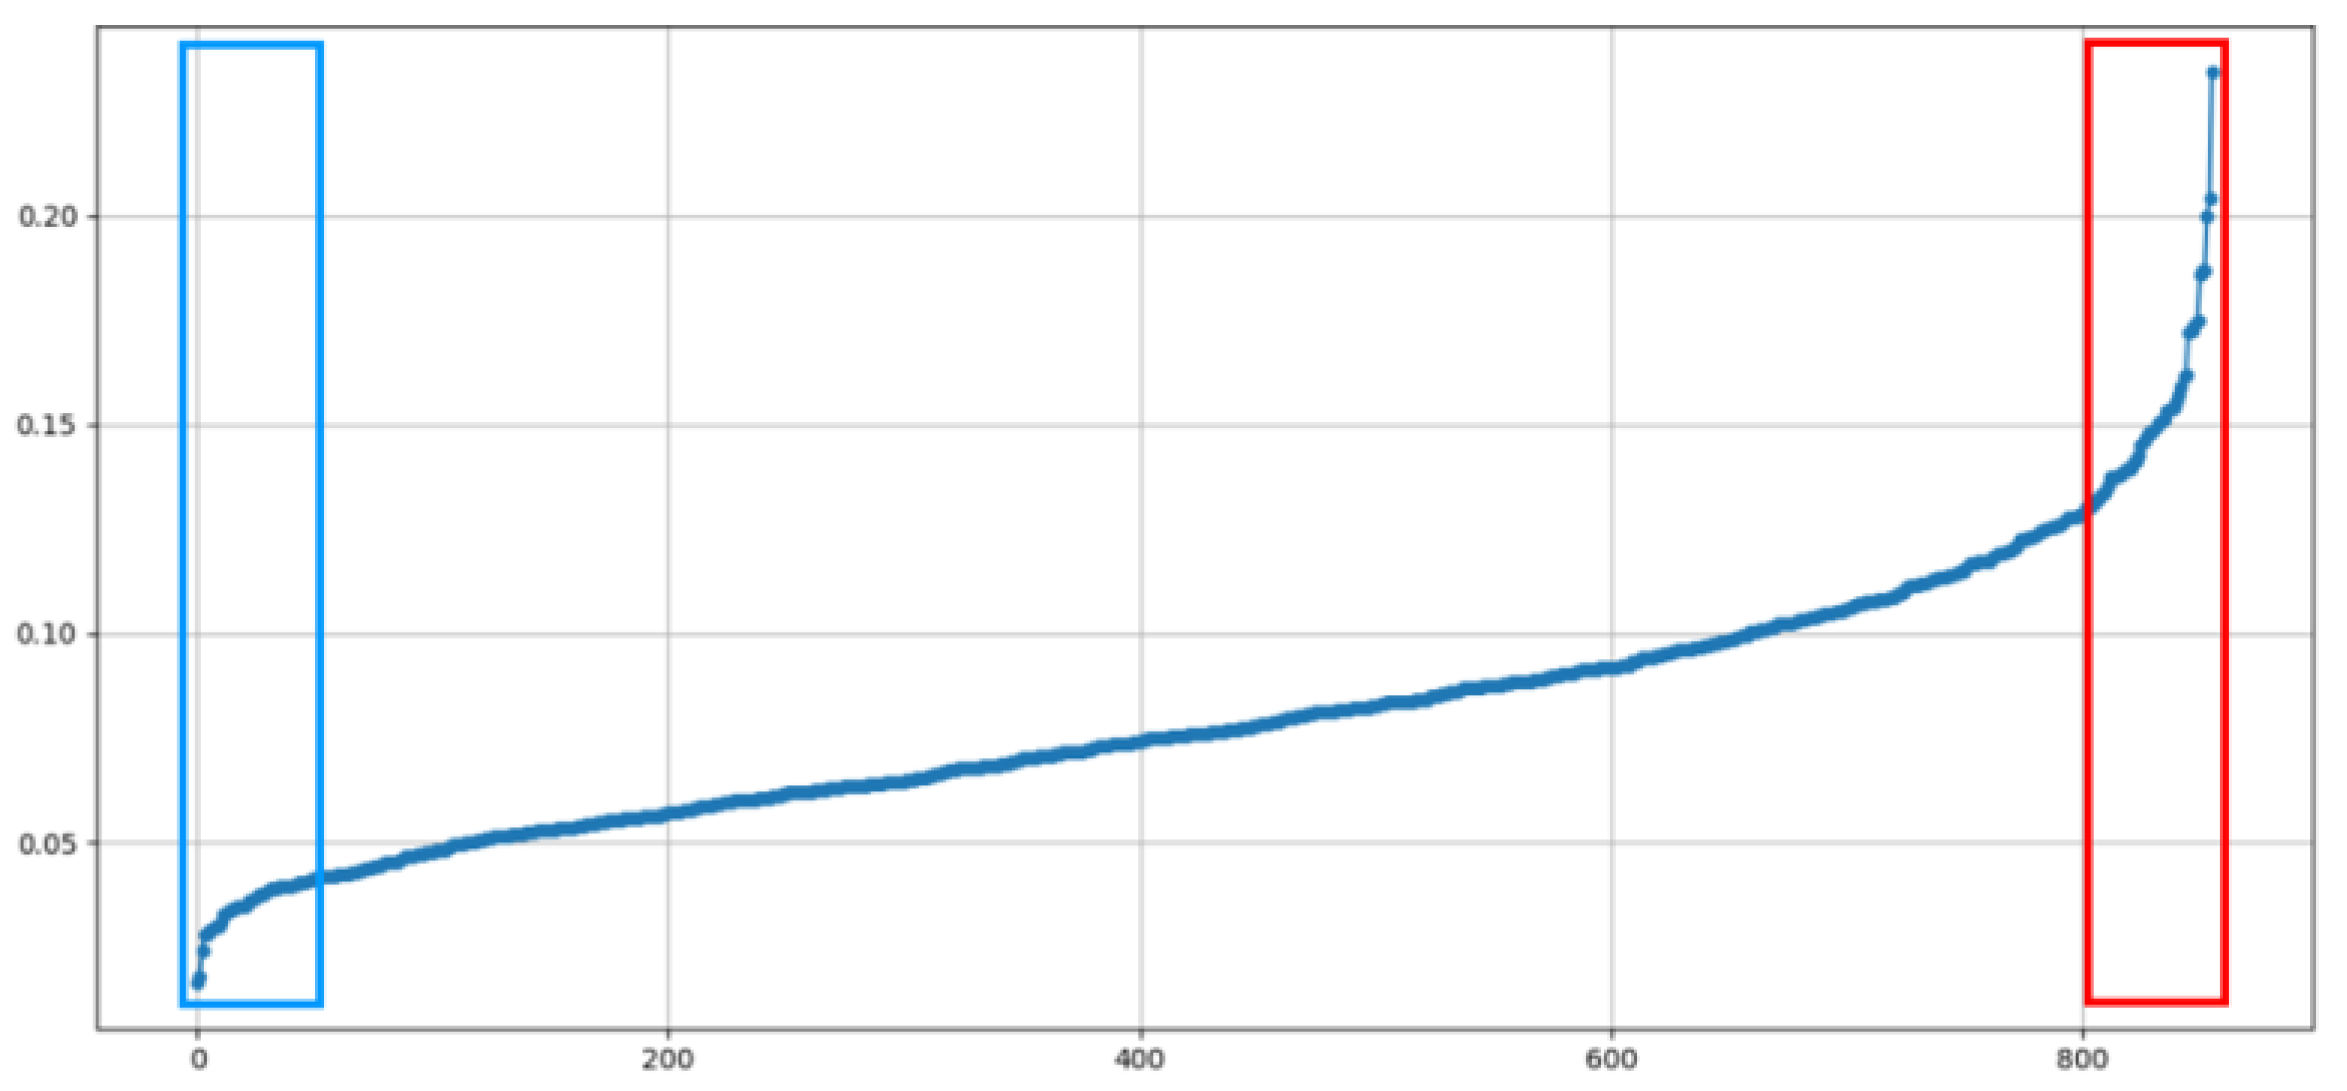
- Anomaly Ranking and Visualization: This module utilizes the deviation indicators I (δN) to rank the nodes based on graph-theoretic logic and presents the results through trend charts, assisting in the identification of enterprise nodes exhibiting significant deviation characteristics.
3.4.3. Correlation Verification Module
| Algorithm 1: The algorithm of deviation |
| 1. Import S: A multidimensional array containing all procurement data from all sample companies across all years. 2. For each procurement metric u in S: 3. Normalize u by total assets: u ← u/total_assets 4. For each year y in S: 5. For each procurement metric u in year y: 6. Sort all values of u across sample companies in ascending order; 7. For each value m in u: 8. Compute the percentile rank of m within the sorted array; m ← percentile_rank(m) 9. For each sample company c in S: 10. For each procurement metric u: 11. Append a new column std_u ← standard deviation of u across all years; 12. Define I as the multidimensional array composed of all procurement metrics and their standard deviations for all sample companies; 13. For each sample company c in I: 14. Append a new column indicator ← mean of all std_u values for company c; 15. Export I. |
- Enterprise Size Normalization (Steps 2–3): In this stage, all procurement figures for each sample company and each year are normalized by dividing by the company’s total assets, thereby converting the data into dimensionless relative proportions. This step eliminates statistical biases caused by differences in enterprise size and constitutes normalization for the original feature matrix;
- Global Performance Feature Shaping (Steps 4–8): After normalization, the ratio values of the same variable across companies for each year are ranked, and the original values are converted into percentile scores. The purpose of this operation is to establish a “global supply chain performance feature space” with consistent scales across companies, enabling each firm’s transaction features to correspond to a unified reference framework;
- Deviation Magnitude Calculation and Indexing (Steps 9–14): First, for each procurement variable of each sample company, the standard deviation σNj of the variable’s percentile values across different years is computed, representing the deviation intensity of variable j for company N. Then, the average deviation intensity across all variables for each company is calculated to generate a single indicator value ΔN, quantifying the company’s degree of deviation relative to the overall performance features.
4. Experimental Evaluation and Results
- Using the Deviation Computation Module to normalize the procurement information of sample enterprises and compute the cross-year variability (standard deviation) as a measure of deviation, further calculating the average deviation for each enterprise to obtain the initial anomaly indicator ΔN;
- Employing the PoR Detection Module to rank enterprise nodes based on their degree of deviation and utilizing trend visualization to identify anomalous enterprises;
- Finally, applying the Correlation Verification Module to cross-validate the anomalous enterprise group by analyzing the statistical differences between internal and external performance evaluation indicators.
4.1. Simulation and Implementation Setup
- Processor: Intel Core i7 (12th Gen, 2.3GHz);
- Memory: 32GB DDR5;
- Graphics Card: NVIDIA GeForce RTX 3060 (6GB VRAM);
- Operating System: Windows 11.
4.2. Data Collection and Preprocessing
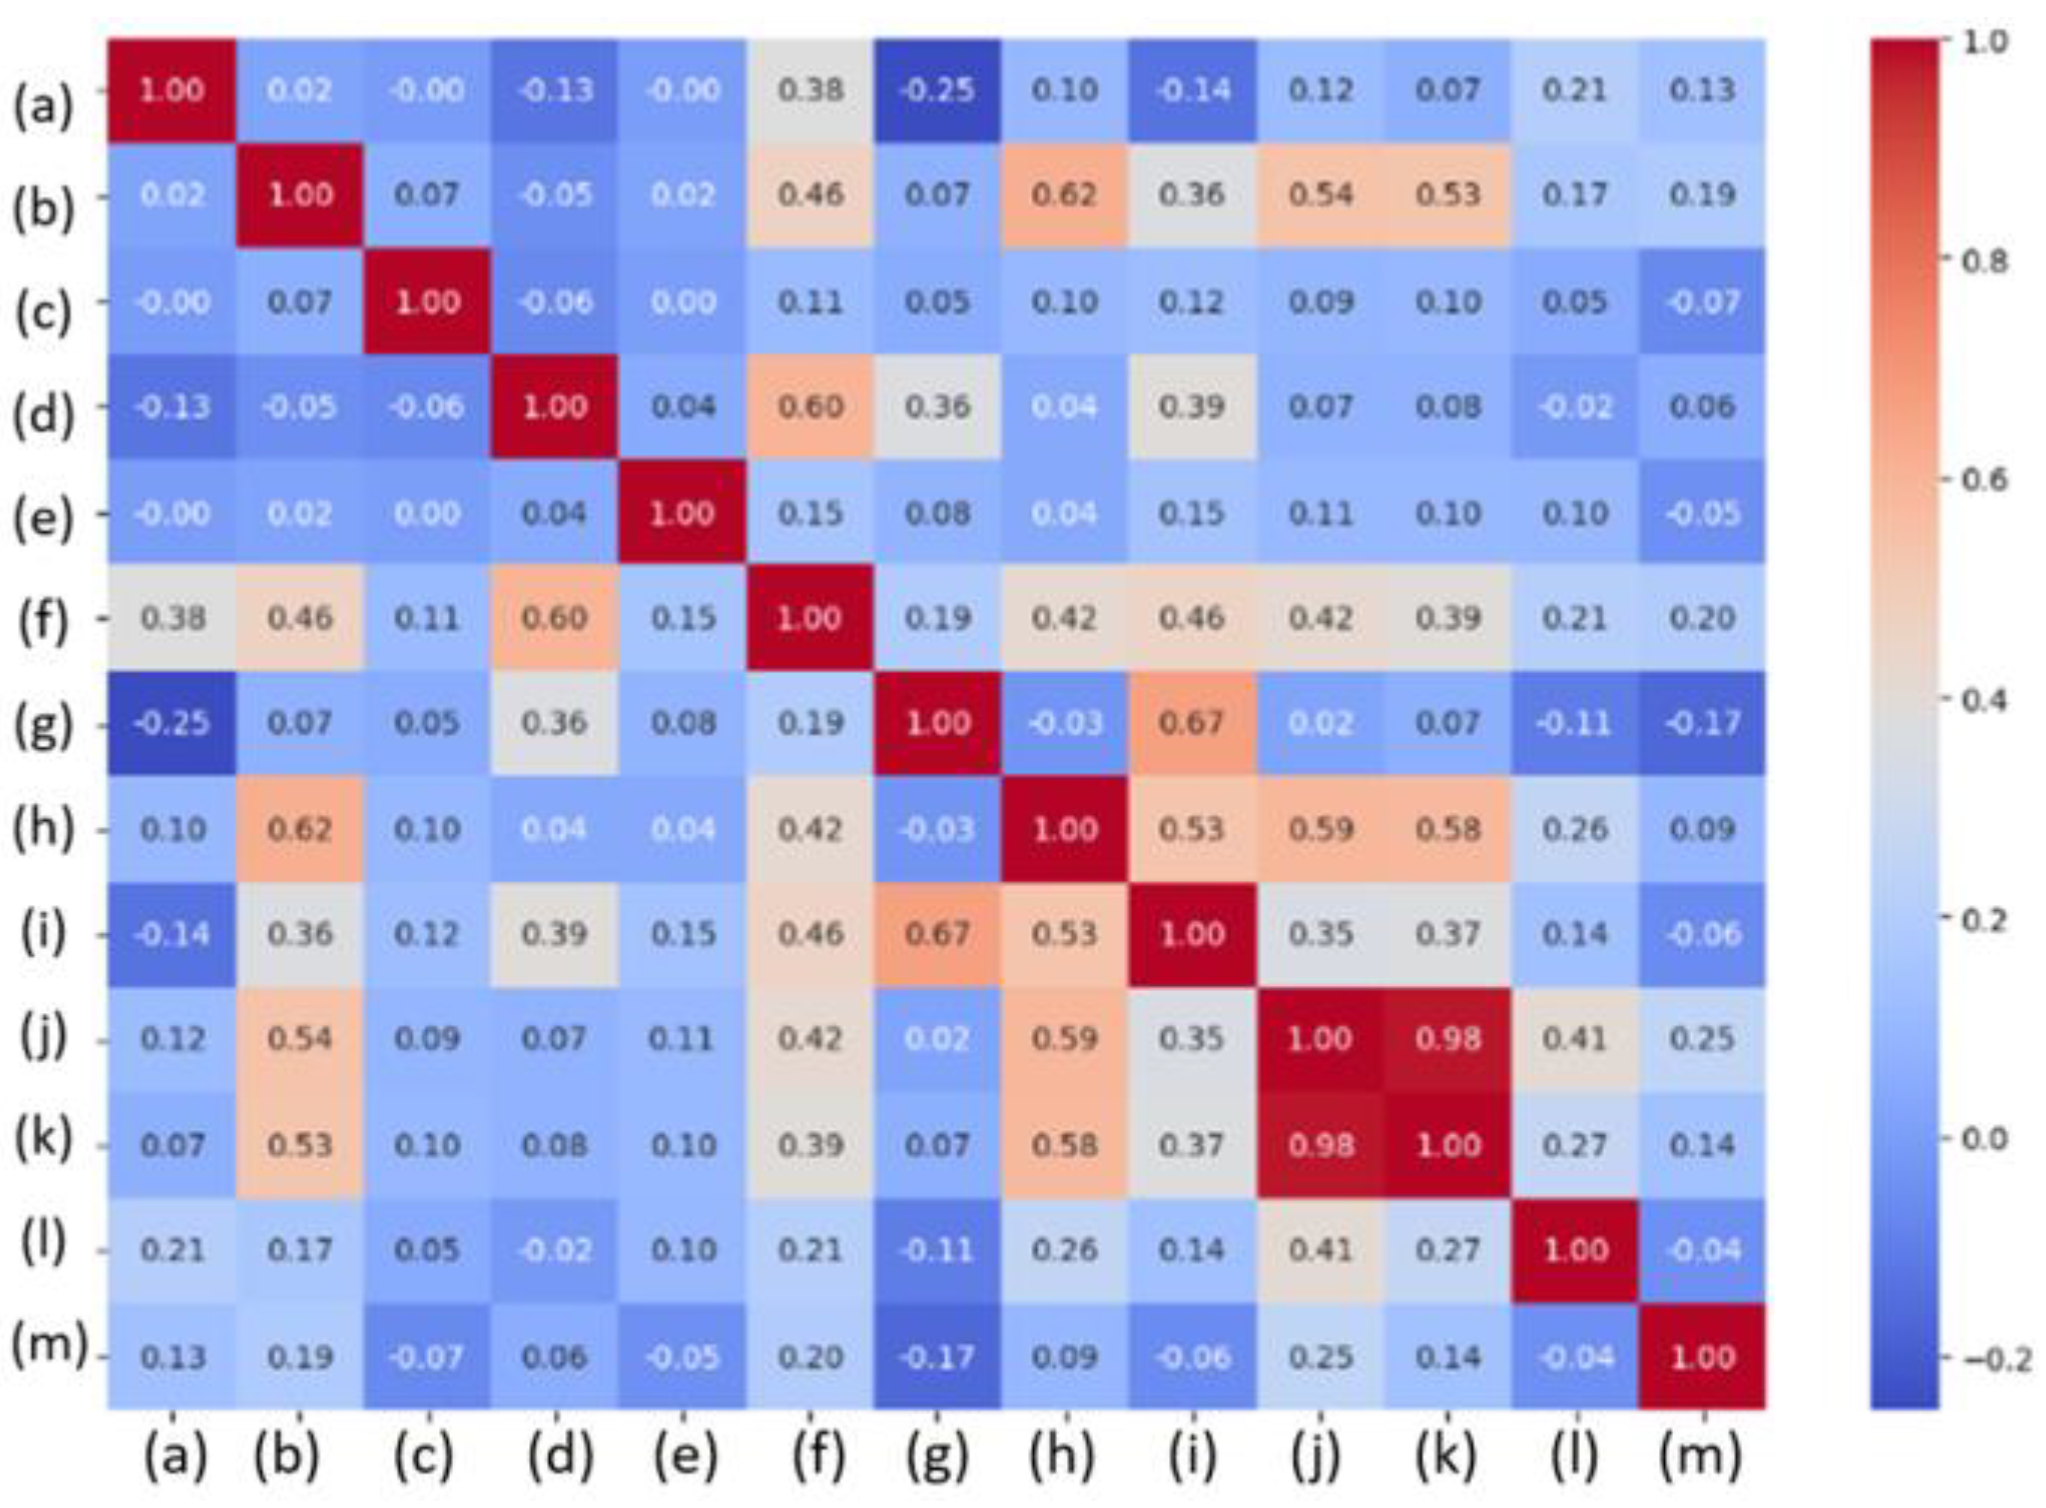
- (a)
- Cash and Cash Equivalents
- (b)
- Accounts and Notes Receivable
- (c)
- Other Receivables
- (d)
- Inventories
- (e)
- Prepaid Expenses and Advances
- (f)
- Total Current Assets
- (g)
- Short-term Borrowings
- (h)
- Accounts and Notes Payable
- (i)
- Total Current Liabilities
- (j)
- Net Operating Revenue
- (k)
- Cost of Goods Sold
- (l)
- Operating Expenses
- (m)
- Operating Profit
- Net Operating Revenue and Cost of Goods Sold (correlation coefficient: 0.9787);
- Short-term Borrowings and Total Current Liabilities (correlation coefficient: 0.6653);
- Accounts and Notes Receivable and Accounts and Notes Payable (correlation coefficient: 0.6165).
4.3. Results of Anomalous Enterprise Detection
4.4. Validation of Algorithmic Effectiveness
- Internal performance indicator: Earnings Per Share (EPS);
- External performance indicator: Stock Price.
4.5. Summary of Results
5. Conclusions
5.1. Conclusions and Contributions
5.2. Special Theoretical Contribution
5.3. Limitations
- The global characteristic is constructed based on the empirical distribution of the sample data. Consequently, if the underlying data quality is poor or biased, the deviation index may be adversely affected or distorted;
- The deviation index ΔN is constructed based on the statistical dispersion of node-level features. In scenarios where procurement data is sparse or unevenly distributed across nodes, additional calibration may be required to ensure the stability and sensitivity of the model.
5.4. Future Research Directions
- Extension of PoR to Dynamic Graph Modeling: Future work may incorporate temporal variability into the PoR framework, enabling the construction of a dynamic PoR model capable of tracking structural changes over time;
- Application of Sheaf Cohomology: Building upon the current use of Sheaf-theoretic coherence, future research may further introduce Sheaf cohomology invariants as a mathematical foundation for analyzing structural consistency in graph-based systems;
- Integration with AI Models: PoR can be integrated with artificial intelligence algorithms to enhance anomaly detection accuracy. Moreover, by applying model compression techniques and parameter reduction strategies, it may be possible to lower data requirements and computational overhead, thereby improving AI model’s efficiency and sustainability in large-scale, real-time network environments.
Author Contributions
Funding
Data Availability Statement
Conflicts of Interest
Abbreviations
| PoR | Proof of Relationship |
| PBFT | Practical Byzantine Fault Tolerance |
| PoW | Proof of Work |
| DAG | directed acyclic graph |
| GNNs | Graph Neural Networks |
| AI | Artificial Intelligence |
References
- Lamport, L.; Shostak, R.; Pease, M. The Byzantine Generals Problem. ACM Trans. Program. Lang. Syst. 1982, 4, 382–401. [Google Scholar] [CrossRef]
- Wasi, A.T.; Islam, M.S.; Akib, A.R.; Bappy, M.M. Graph Neural Networks in Supply Chain Analytics and Optimization: Concepts, Perspectives, Dataset and Benchmarks. arXiv 2024, arXiv:2411.08550. [Google Scholar]
- Tan, Z.; Anagnostopoulos, C.; Singer, J. Distributed Temporal Graph Learning with Provenance for APT Detection in Supply Chains. arXiv 2025, arXiv:2504.02313. [Google Scholar]
- Zheng, G.; Brintrup, A. An Analytics-Driven Approach to Enhancing Supply Chain Visibility with Graph Neural Networks and Federated Learning. arXiv 2025, arXiv:2503.07231. [Google Scholar]
- Kleinberg, J.; Tardos, É. Algorithm Design; Pearson Education: London, UK, 2006. [Google Scholar]
- Newman, M.E.J. Networks: An Introduction; Oxford University Press: Oxford, UK, 2010. [Google Scholar]
- Barabási, A.-L. Network Science; Cambridge University Press: Cambridge, UK, 2016. [Google Scholar]
- Bollobás, B. Modern Graph Theory; Springer: Berlin/Heidelberg, Germany, 1998. [Google Scholar]
- Gross, J.L.; Yellen, J. Graph Theory and Its Applications; CRC Press: Boca Raton, FL, USA, 2005. [Google Scholar]
- Diestel, R. Graph Theory, 5th ed.; Springer: Berlin/Heidelberg, Germany, 2017. [Google Scholar]
- Godsil, C.; Royle, G. Algebraic Graph Theory; Springer: Berlin/Heidelberg, Germany, 2001. [Google Scholar]
- Chung, F.R.K. Spectral Graph Theory; American Mathematical Society: Providence, RI, USA, 1997. [Google Scholar]
- Fortunato, S. Community Detection in Graphs. Phys. Rep. 2010, 486, 75–174. [Google Scholar] [CrossRef]
- Easley, D.; Kleinberg, J. Networks, Crowds, and Markets: Reasoning About a Highly Connected World; Cambridge University Press: Cambridge, UK, 2010. [Google Scholar]
- Jackson, M.O. Social and Economic Networks; Princeton University Press: Princeton, NJ, USA, 2008. [Google Scholar]
- Borgatti, S.P.; Everett, M.G.; Johnson, J.C. Analyzing Social Networks; SAGE Publications: New York, NY, USA, 2018. [Google Scholar]
- Brandes, U.; Erlebach, T. (Eds.) Network Analysis: Methodological Foundations; Springer: Berlin/Heidelberg, Germany, 2005. [Google Scholar]
- Tennison, B.R. Sheaf Theory; Cambridge University Press: Cambridge, UK, 1975. [Google Scholar]
- Mac Lane, S.; Moerdijk, I. Sheaves in Geometry and Logic: A First Introduction to Topos Theory; Springer: Berlin/Heidelberg, Germany, 1994. [Google Scholar]
- Bredon, G.E. Sheaf Theory, 2nd ed.; Springer: Berlin/Heidelberg, Germany, 1997. [Google Scholar]
- Robinson, M. Topological Signal Processing; Springer: Berlin/Heidelberg, Germany, 2014. [Google Scholar]
- Hansen, J.C.; Ghrist, R. Toward a Spectral Theory of Cellular Sheaves. J. Appl. Comput. Topol. 2019, 3, 315–358. [Google Scholar] [CrossRef]
- Han, H. Proof of Work Blockchain Technology and Byzantine Fault Tolerance Consensus Algorithm in Cryptocurrency, Along with Proof of Relation (SOC Laboratory). Research Report. National Chung Hsing University, Taiwan. Available online: https://soc.cs.nchu.edu.tw/SOCLAB/PDF/Consensus_Algorithm.pdf (accessed on 30 August 2023). (In Chinese).
- Sandryhaila, A.; Moura, J.M.F. Discrete Signal Processing on Graphs. IEEE Trans. Signal Process. 2013, 61, 1644–1656. [Google Scholar] [CrossRef]
- Pasqualetti, F.; Dorfler, F.; Bullo, F. Attack Detection and Identification in Cyber-Physical Systems. IEEE Trans. Autom. Control 2013, 58, 2715–2729. [Google Scholar] [CrossRef]
- Ghrist, R. Elementary Applied Topology; Createspace Independent Publishing Platform: Colombia, SC, USA, 2014. [Google Scholar]
- Biggs, N. Algebraic Graph Theory, 2nd ed.; Cambridge University Press: Cambridge, UK, 1993. [Google Scholar]
- Christiano, P.; Kelner, J.A.; Madry, A.; Spielman, D.A.; Teng, S.H. Electrical Flows, Laplacian Systems, and Faster Approximation of Maximum Flow in Undirected Graphs. In Proceedings of the 43rd Annual ACM Symposium on Theory of Computing, San Jose, CA, USA, 6–8 June 2011; pp. 273–282. [Google Scholar]
- Leskovec, J.; Rajaraman, A.; Ullman, J.D. Mining of Massive Datasets; Cambridge University Press: Cambridge, UK, 2014. [Google Scholar]
- Wu, B.; Yao, X.; Zhang, B.; Chao, K.-M.; Li, Y. SplitGNN: Spectral Graph Neural Network for Fraud Detection against Heterophily. In Proceedings of the 32nd ACM International Conference on Information and Knowledge Management (CIKM ‘23), Birmingham, UK, 21–25 October 2023; pp. 1534–1543. [Google Scholar]
- Cormen, T.H.; Leiserson, C.E.; Rivest, R.L.; Stein, C. Introduction to Algorithms, 3rd ed.; MIT Press: Cambridge, MA, USA, 2009. [Google Scholar]
- Rotman, J.J. An Introduction to Homological Algebra, 2nd ed.; Springer: Berlin/Heidelberg, Germany, 2009. [Google Scholar]
- Vishal, G.; Gaiha, A. Building a Transparent Supply Chain: Blockchain Can Enhance Trust, Efficiency, and Speed. Harv. Bus. Rev. 2020, 98, 94–103. [Google Scholar]
- Fama, E.F. Efficient capital markets: A review of theory and empirical work. J. Financ. 1970, 25, 383–417. [Google Scholar] [CrossRef]
- Shiller, R.J. Do stock prices move too much to be justified by subsequent changes in dividends? Am. Econ. Rev. 1981, 71, 421–436. [Google Scholar]
- Ball, R.; Brown, P. An empirical evaluation of accounting income numbers. J. Acc. Res. 1968, 6, 159–178. [Google Scholar] [CrossRef]
- Foster, G. Financial Statement Analysis, 2nd ed.; Prentice-Hall: Saddle River, NJ, USA, 1986. [Google Scholar]

| Groups | Correlation Coefficient |
|---|---|
| normal group (56 nodes) | 0.1476 |
| anomalous group (56 nodes) | −0.0001 |
Disclaimer/Publisher’s Note: The statements, opinions and data contained in all publications are solely those of the individual author(s) and contributor(s) and not of MDPI and/or the editor(s). MDPI and/or the editor(s) disclaim responsibility for any injury to people or property resulting from any ideas, methods, instructions or products referred to in the content. |
© 2025 by the authors. Licensee MDPI, Basel, Switzerland. This article is an open access article distributed under the terms and conditions of the Creative Commons Attribution (CC BY) license (https://creativecommons.org/licenses/by/4.0/).
Share and Cite
Han, H.-C.; Huang, D.-C. Graph-Theoretic Detection of Anomalies in Supply Chains: A PoR-Based Approach Using Laplacian Flow and Sheaf Theory. Mathematics 2025, 13, 1795. https://doi.org/10.3390/math13111795
Han H-C, Huang D-C. Graph-Theoretic Detection of Anomalies in Supply Chains: A PoR-Based Approach Using Laplacian Flow and Sheaf Theory. Mathematics. 2025; 13(11):1795. https://doi.org/10.3390/math13111795
Chicago/Turabian StyleHan, Hsiao-Chun, and Der-Chen Huang. 2025. "Graph-Theoretic Detection of Anomalies in Supply Chains: A PoR-Based Approach Using Laplacian Flow and Sheaf Theory" Mathematics 13, no. 11: 1795. https://doi.org/10.3390/math13111795
APA StyleHan, H.-C., & Huang, D.-C. (2025). Graph-Theoretic Detection of Anomalies in Supply Chains: A PoR-Based Approach Using Laplacian Flow and Sheaf Theory. Mathematics, 13(11), 1795. https://doi.org/10.3390/math13111795