Article

An Exploratory Assessment of LLMs’ Potential for Flight Trajectory Reconstruction Analysis

by
Qilei Zhang
1,*,† and
John H. Mott
2,†
1
School of Engineering and Technology, Central Queensland University, Norman Gardens, QLD 4701, Australia
2
School of Aviation and Transportation Technology, Purdue University, West Lafayette, IN 47907, USA
*
Author to whom correspondence should be addressed.
Current address: College of Engineering and Aviation, 42-52 Abbott Street & Shields Street, Cairns City, QLD 4870, Australia.
Mathematics 2025, 13(11), 1775; https://doi.org/10.3390/math13111775
Submission received: 15 April 2025 / Revised: 14 May 2025 / Accepted: 24 May 2025 / Published: 26 May 2025
(This article belongs to the Section E1: Mathematics and Computer Science)

Abstract

:
Large Language Models (LLMs) hold transformative potential for analyzing sequential data, offering an opportunity to enhance the aviation field’s data management and decision support systems. This study explores the capability of the LLaMA 3.1-8B model, an advanced open source LLM, for the tasks of reconstructing flight trajectories using synthetic Automatic Dependent Surveillance Broadcast (ADS-B) data characterized by noise, missing points, and data irregularities typical of real-world aviation scenarios. Comparative analyses against traditional approaches, such as the Kalman filter and the sequence to sequence (Seq2Seq) model with a Gated Recurrent Unit (GRU) architecture, revealed that the fine-tuned LLaMA model significantly outperforms these conventional methods in accurately estimating various trajectory patterns. A novel evaluation metric, containment accuracy, is proposed to simplify performance assessment and enhance interpretability by avoiding complex conversions between coordinate systems. Despite these promising outcomes, the study identifies notable limitations, particularly related to model hallucination outputs and token length constraints that restrict the model’s scalability to extended data sequences. Ultimately, this research underscores the substantial potential of LLMs to revolutionize flight trajectory reconstruction and their promising role in time series data processing, opening broader avenues for advanced applications throughout the aviation and transportation sectors.

1. Introduction

Large Language Models (LLMs) are increasingly regarded as a promising approach toward achieving Artificial General Intelligence (AGI), since these models demonstrate an aptitude for handling a diverse range of capabilities akin to those of humans [1]. In particular, LLMs have demonstrated great potential in the domain of processing sequential data, notably in natural language processing and interpreting complex data structures, including images and videos. This remarkable success has prompted researchers to explore their capabilities in specialized domains such as aviation. The aviation field generates vast and complex data, ranging from unstructured text (e.g., safety reports, air traffic control transcripts) to time series sensor data (flight trajectories). This opens up opportunities to leverage LLMs to analyze and interpret data that traditionally require human expertise, custom algorithms, and domain-specific models. Specifically, for this study, such capabilities were harnessed to explore the potential of LLMs in effectively learning and discerning patterns and reconstructing flight trajectories that were originally recorded from the Automatic Dependent Surveillance Broadcast (ADS-B) system from discontinuous, inaccurate, or missing situations [2].
The ADS-B system is a pivotal surveillance system that broadcasts the aircraft’s position, velocity, and other information to the ground station and surrounding aircraft [3]. Despite its widespread implementation, the data recorded from ADS-B systems are susceptible to various irregularities due to multiple reasons, including but not limited to antennas’ blind zones, signal jamming, and multipath interference [4]. Such deficiencies in ADS-B data present considerable challenges in accurately reconstructing flight trajectories, an endeavor of critical importance in aviation safety [5]. Specifically, effective trajectory reconstruction aids in identifying potential conflict points between aircraft, detecting abnormal flight behaviors, and enhancing air traffic management systems.
The introduction of one-shot, few-shot, and fine-tuning learning techniques in the realm of LLMs has enabled a new paradigm of learning that requires significantly less training data than conventional machine learning methodologies [6]. Moreover, the proficiency of LLMs in encoding sequential data into numerical sequences and their capability in next-token prediction for text generation underscore their potential in processing sequential data [7]. Therefore, this new paradigm of learning is considerably promising for flight trajectory reconstruction.
In this study, advances in LLMs were brought to bear on the challenge of flight trajectory reconstruction. The main contributions of this study are summarized as follows:
  • A pre-trained LLM (LLaMA 3.1-8B) was fine-tuned on flight trajectory data, and it demonstrated its ability to reconstruct flight trajectories from noisy, missing, and irregular ADS-B inputs. It demonstrated competitive performance compared to the traditional Kalman filter approach and the conventional deep learning approach (sequence to sequence (Seq2Seq) with Recurrent Neural Network (RNN) architecture).
  • A novel evaluation metric named containment accuracy to assess trajectory reconstruction quality. This metric reports the smallest allowable error envelope that contains a specified proportion of predictions, providing a more interpretable performance criterion without requiring coordinate transformations.
  • Higher accuracy achieved by the LLM model within scenarios with sparse data or abrupt maneuvers underscored the potential of LLMs to augment or surpass traditional methods in this domain. The study also highlighted and discussed the essential limitations observed, such as the LLM’s occasional hallucination of outputs and the constraints imposed by token length (which currently limit the duration of trajectories it can process in one pass).

2. Literature Review

The primary challenge addressed in this study was to assess the potential of LLMs in flight trajectory reconstruction using flight data recorded from ADS-B systems with irregularities.

2.1. Flight Trajectory Reconstruction

Accurately modeling aircraft flight trajectories is essential to numerous aviation applications, from monitoring and surveillance to traffic flow management and collision avoidance. Trajectory reconstruction, in this context, refers to the process of estimating an aircraft’s position, velocity, and altitude at discrete time intervals based on the available data, whereas trajectory prediction, in a similar vein, though with subtle distinctions, focuses on forecasting an aircraft’s future path given its current state and possible intended route. The conventional methodologies to address these problems can be categorized into three groups: (1) physical motion functions based on aerodynamics or aircraft performance, (2) linear quadratic estimation (Kalman filtering), and (3) data-driven machine learning models [8].
In the first category, methods utilizing physical motion function derived from the aircraft’s aerodynamics, performance characteristics, aircraft intent, flight plans, and performance models have been explored [9,10,11]. However, these approaches often require extensive parameters and simplifying assumptions, which can compromise accuracy and applicability. The second category, Kalman filtering, offers efficient real-time processing and accurate trajectory reconstruction [12]. Its limitation becomes apparent when the aircraft’s motion is nonlinear, with unpredictable maneuvers and disturbances in dynamic environments [13]. In the third category, data-driven machine learning models, with studies employing boosted regression trees, random forests, and neural networks, have demonstrated promising results in flight trajectory reconstruction [2,14,15]. However, these models require extensive training data with ground truth values, which are often unavailable in real-world scenarios.

2.2. LLM on Time Series and Aviation Data

The application of LLMs to time series data has gained attention in recent years, as highlighted by several innovative studies. Chang et al. [16] proposed a novel LLM (LLM4TS), a two-stage fine-tuning process for time series forecasting tasks. Their study combined time series patching with temporal encoding using pre-trained LLMs, offering enhanced forecasting in limited data scenarios. Gruver et al. [7] demonstrated that LLMs, like GPTs and LLaMA, can perform zero-shot time series forecasting by encoding data as numerical strings. Zhou et al. [17] explored the use of a Frozen Pretrained Transformer (FPT) for time series forecasting, emphasizing cross-modality applicability. Additionally, the framework proposed by Jin et al. [18] reprogrammed existing LLMs for time series analysis without altering the original models, outperforming specialized models in various learning scenarios. These studies underline the potential of LLMs in managing and analyzing sequential, multidimensional time series data effectively.
Furthermore, aviation domain-adapted LLMs have been explored in recent studies. For example, the model built on LLaMA-2 and Mistral architectures and trained on curated aviation text corpora demonstrated over a 40% performance gain compared to the rule-based method in addressing aviation domain questions [19]. Nielsen fine-tuned a RoBERTa transformer model on two different sizes of dataset, including FAA et al. [20] Letters of Agreement and related airspace procedure documents, to create an aviation-specific language model. Abdulhak et al. [21] trained and tested an LLM, named ChatATC, by investigating the capabilities of LLMs in strategic air traffic flow management by a large historical dataset of Ground Delay Programs (GDPs). Other proposals include incorporating air traffic control instructions (commands) directly into trajectory prediction models by employing a language model (BERT-based) to extract the “intent” of the instruction (such as a turn or altitude change) and embedding that information into the trajectory forecasting model [22].
Therefore, though robust models in this subfield are just emerging, the potential of LLMs in aviation data processing is promising, i.e., when properly fine-tuned or prompted, LLMs can serve as powerful information processors for aviation data. These developments may mark the first wave of LLMs’ integration into the aviation field by enhancing data management and decision support tools [23].

3. Methodology

3.1. Flight Data Collection and Generation

This study utilized BlueSky (Version 1.13), an open source Python (Version 3.10) package for aircraft operation simulation [24], to generate a synthetic flight dataset. The dataset, designed to mirror the statistical characteristics of ideal, integrity-rich ground truth flight data, will facilitate both training and evaluation of the proposed model.
The simulation created diverse flight operations between airports, such as from KLAF to KVPZ, incorporating a range of maneuvers. This diversity in flight operations was achieved by defining a set of waypoints in a rectangular area based on the airports’ locations. Within this area, space was partitioned into smaller sub-rectangle areas, some of which corner coordinates were randomly selected as intermediate waypoints for the simulated flight. Each waypoint was assigned a target altitude and airspeed, ensuring the flight trajectories included climbs, cruises, descents, and other maneuvers. Two waypoint navigation modes were simulated—flyover, where the aircraft passes directly over the waypoint before turning, and flyby, where the aircraft begins turning prior to reaching the waypoint, to introduce additional variability in flight trajectory shapes.
During the simulation, BlueSky recorded flight data, including the aircraft position, velocity, and other information, at a frequency of 1 Hz. The recorded data were treated as having the same integrity as ground truth data. To realistically reflect the irregularities in ADS-B data, the study introduced controlled noise into the synthetic flight data. Specifically, during each simulated flight, individual 1 Hz position reports were randomly dropped with a uniform distributed probability from 0.1 to 0.5, thereby creating occasional gaps in the flight trajectory data, and the time intervals between the reports were jittered to imitate an inconsistent sampling rate. Additionally, the study introduced random perturbations to the recorded latitude, longitude, altitude, true airspeed, vertical speed, and track angle values to simulate equipment inaccuracies, such as GPS errors, sensor noise, and other environmental factors. In the implementation, the study added Gaussian noise to the latitude, longitude, and altitude values, with a mean of 0 and a standard deviation of 0.001 degrees for latitude and longitude and 25.5 m for altitude (i.e., 95% of the altitude values were within 50 m of the deviation from true values). These modifications produced noisy synthetic ADS-B data characterized by missing points and timing irregularities, closely emulating real-world ADS-B defects. Figure 1 provides a visualization of a generated flight trajectory with simulated ADS-B data, distinguishing the trajectory in cyan-blue and ADS-B data points in red.

3.2. LLM Model Configuration

The study adopted the LLaMA 3.1 model [25,26], a pre-trained LLM model that has demonstrated promising results in time series forecasting [7]. The LLaMA 3.1 model offers numerous model sizes and versions based on the number of parameters and pretreatment, namely 8B, 405B, 405B-MP16, and 405B-FP8. The study selected the 8B model, due to its relatively small size and computational efficiency. The model’s fine-tuning utilized the synthetic flight data, processed by one A100 GPU equipped with 80GB of memory and one A10 GPU equipped with 24 GB of memory.
Considering the LLaMA model’s default strategy with the tokenization of numbers into individual digits [25], the experiment in the study forewent decimals for floating-point numbers across all attributes, maintaining fixed precision for each. Specifically, inputs included the common attributes in ADS-B data—namely, time, latitude, longitude, altitude, true airspeed, vertical speed, and track angle. Longitude and latitude had a precision of 0.00001 degrees. Altitude had a precision of 1 m. True airspeed had a precision of 1 knot. Vertical speed had a precision of 0.1 m per minute. Track angle had a precision of 1 degree. Following the recommendation of Gruver et al. [7], all numbers were stripped of decimals before feeding into the model’s tokenizer. For instance, “40.12340” was converted to “4012340” before tokenization. After the trained model’s inference, the digits were restored to the original precision for visualization and analysis.
In particular, the experiment setup also incorporated special prompts to guide and inform the LLM in processing flight trajectory data. Each input sequence commenced with an introductory prompt, “Determine the curved flight trajectory using these estimated parameters (time, latitude, longitude, altitude, true airspeed, vertical speed, and track angle). Please summarize the precise trajectory considering these inputs:”. This prompt served to orient the LLM towards the specific task of flight trajectory reconstruction. Concluding each input sequence, the prompt “Summary:” was appended to the end of the input sequence, signaling the end of the input sequence.
To optimize computational resource utilization and facilitate the fine-tuning process, the study employed the open source LLaMA-Factory [27] framework, which provides a comprehensive suite of tools and scripts tailored for efficient LLM training and evaluation. This toolchain, alongside the guidance from the official LLaMA Cookbook [25], streamlined the model training configuration and implementation. In practice, the fine-tuning process incorporated Parameter-Efficient Fine-Tuning (PEFT) techniques to maximize computational efficiency. Specifically, the study integrated the Low-Rank Adaptation (LoRA) method [28] with 4-bit quantization (QLoRA) [29], as well as the Brain Floating Point 16 (BF16) format to significantly reduce memory consumption. The optimization process allowed for performance impact comparisons between different levels of quantization, and it fine-tuned the model on limited hardware resources. The key hyperparameters (training epochs, batch size, learning rate, sequence length cutoff) were set to 6 (and 3 for a comparative experiment), 2, 1 × 10⁻⁵, and 2048 tokens, respectively, following best practices from the LLaMA-related literature [25,27]. This unified setup ensured a consistent and reproducible training process throughout the experiments.

3.3. Data Preprocessing

In the research experiment, the dataset were divided into training, validation, and testing subsets in a ratio of 0.8, 0.1, and 0.1, respectively. To align the LLaMA 3.1-8B model’s optimal processing capabilities, each input time duration was constrained to 60 s, to ensure input tokens under the model’s maximum sequence length of 4096 tokens [25,26]. The output was designed to reconstruct the flight trajectory at a five-second interval on integer timestamps, balancing conserving token space and maintaining a clear, observable trajectory representation. The objective was to fine-tune the model to accurately reconstruct the trajectory, including information on the aircraft’s altitude, latitude, and longitude. Flight trajectories exhibiting altitude variations of more than 300 feet or cumulative track angle changes of more than 30 degrees were included in the training, validation, and testing datasets. Consequently, the current training, validation, and testing datasets consisted of 123,982, 15,497, and 15,499 flight trajectories, respectively, each spanning a duration of 60 s.

3.4. Evaluation Metrics Setup

In the field of trajectory reconstruction, conventional metrics such as Root Mean Square Error (RMSE) and Mean Absolute Error (MAE) are informative but require careful interpretation. These metrics assume consistent units in Cartesian space, and using them directly on latitude–longitude–altitude data can require intricate transformations, including haversine distance calculations and unit conversions. Moreover, traditional error metrics are highly susceptible to distortion from outliers or anomalous values, especially when large deviations occur. Therefore, a new metric, here referred to as containment accuracy [23], was introduced to gauge reconstruction effectiveness in a geodetically convenient way, complementing traditional error metrics by mitigating these issues. By design, this approach provides a robust measure of typical performance, largely insensitive to a small fraction of extreme errors.
The additional metric pertained to the predominant values in the error distribution. Although the ideal approach would involve conceptualizing a cylindrical volume around the target trajectory, the complexity of converting latitude and longitude to distances rendered the cylindrical model computationally expensive. Consequently, a more tractable cuboid approximation was adopted instead. A predicted trajectory point was considered a correct reconstruction if it lay within the threshold bounds of the ground truth (i.e., inside the axis-aligned latitude–longitude–altitude cuboid centered on the true point). Operationally, the thresholds were determined by first selecting a target success rate (coverage percentage) and then tuning Δ lat , Δ lon , Δ alt until that fraction of points was contained. In this research, the chosen benchmark was 80%. The threshold values were increased or decreased until the target percentage of predicted points was contained within the cuboid. The required threshold magnitudes at this level defined the model’s containment accuracy.
Additionally, a standard Kalman filter served as a benchmark methodology to highlight performance discrepancies between LLM models and a more conventional approach [23]. The Kalman filter implementation was intentionally simplistic, foregoing any advanced parameter optimization or custom adjustments. It was evaluated on the same dataset as the LLM models to ensure an unbiased comparison. Its main function was to provide a baseline measure of performance, thus facilitating a clear understanding of the proposed evaluated metric’s range and the assessment of the advanced capabilities demonstrated by the newly developed methods. The implementation of the standard Kalman filter necessitated certain predefined assumptions regarding the covariance matrices, as well as the measurement H and state transition matrices F [13]. The parameters for the covariance matrices, specifically those pertaining to initial state covariance, measurement covariance, and transition covariance, were predominantly set at 0.1, indicating a high confidence level and minimal anticipated measurement noise [30]. The measurement matrix was configured as follows:  
1 0 0 0 0 0 0 1 0 0 0 0 0 0 1 0 0 0 ,
where each row corresponded to the measurements of latitude, longitude, and altitude, while the remaining state variables, such as changes in latitude, longitude, and altitude, were not directly observed. The state transition matrix F was specified as
1 0 0 1 0 0 0 1 0 0 1 0 0 0 1 0 0 1 0 0 0 1 0 0 0 0 0 0 1 0 0 0 0 0 0 1 ,
where the top three rows represented the updates of position states (latitude, longitude, altitude), while the bottom three rows reflected the corresponding velocity updates. This arrangement inherently presumed that the future position estimates for each dimension were calculated directly as the sum of current positions and their respective velocities [30].
Subsequently, a vanilla sequence to sequence (Seq2Seq) recurrent neural network was implemented as a classical deep learning baseline for comparison [31]. The Seq2Seq model adopted an encoder–decoder architecture employing a four-layer GRU (Gated Recurrent Unit) network with 256 hidden units per layer [32]. Dropout regularization was applied to each layer to mitigate overfitting, and the model was trained to predict the missing portions of a trajectory by minimizing the Mean Squared Error (MSE) loss between its outputs and the ground truth sequence. During training, teacher forcing was utilized with a scheduled ratio, gradually transitioning the decoder from using ground truth inputs to using its own predictions [33]. This strategy helped the RNN decoder maintain stability and learn effectively. Early stopping on a validation set was used to determine when to halt training to prevent overfitting [34]. The GRU architecture was chosen following preliminary experiments that indicated its performance was comparable and marginally superior to that of LSTM (Long Short-Term Memory) cells. Furthermore, the GRU’s lower parameter count, which contributes to greater computational efficiency, is well documented in the existing literature [35,36].

4. Results

4.1. Base Model Evaluation

After preparing and loading the preprocessed dataset, the study first conducted an initial examination of the base LLaMA model prior to any fine-tuning. The input was formatted as suggested in the previous section. Table 1 provides an example of the input prompt. The expected output format for the model comprised a sequence of 13 tuples. These tuples represented the model’s prediction of the aircraft’s position at five-second intervals across a minute-long flight timeframe. Notably, the model’s outputs retained the adjusted scale applied during the input data preprocessing, where the decimals were stripped.
However, the preliminary evaluation revealed the limitation of the base model in its unmodified state. Rather than generating meaningful outputs, the model tended to repetitively echo the data part of the input prompt, so that the output in the Table 1 illustration was like (967,),, (, 271). A similar outcome was observed when the input data were not stripped of decimals, underscoring the model’s inability to comprehend and execute the task of flight trajectory reconstruction in its base state. This observation led to the necessity of fine-tuning the model to enable it to interpret the task objective and generate meaningful outputs for flight trajectory reconstruction analysis.

4.2. Fine-Tuning Model Evaluation

The study then proceeded to fine-tune the LLaMA 3.1-8B model with the prepared training dataset. The process was set for 3 and 6 epochs, with a batch size of two and an initial learning rate of 1 × 10⁻⁵, as previously mentioned. The training process observed a notable reduction in the loss function, such as progressively declining from 0.7211 to 0.2426 in 3 epochs, as shown in Figure 2. The fine-tuned model was then implemented to infer the flight trajectory reconstruction outputs for the 15,499 trajectories in the testing dataset, using input prompts formatted identically to those in the base model evaluation.
The following subsections provide the visualization outcomes of the fine-tuned model by randomly selecting trajectory samples from the testing dataset, categorized by different flight trajectory characteristics. These analyses offered insights into the model’s capacity to reconstruct various types of flight trajectories under differing conditions.

4.2.1. Linear Flight Trajectories

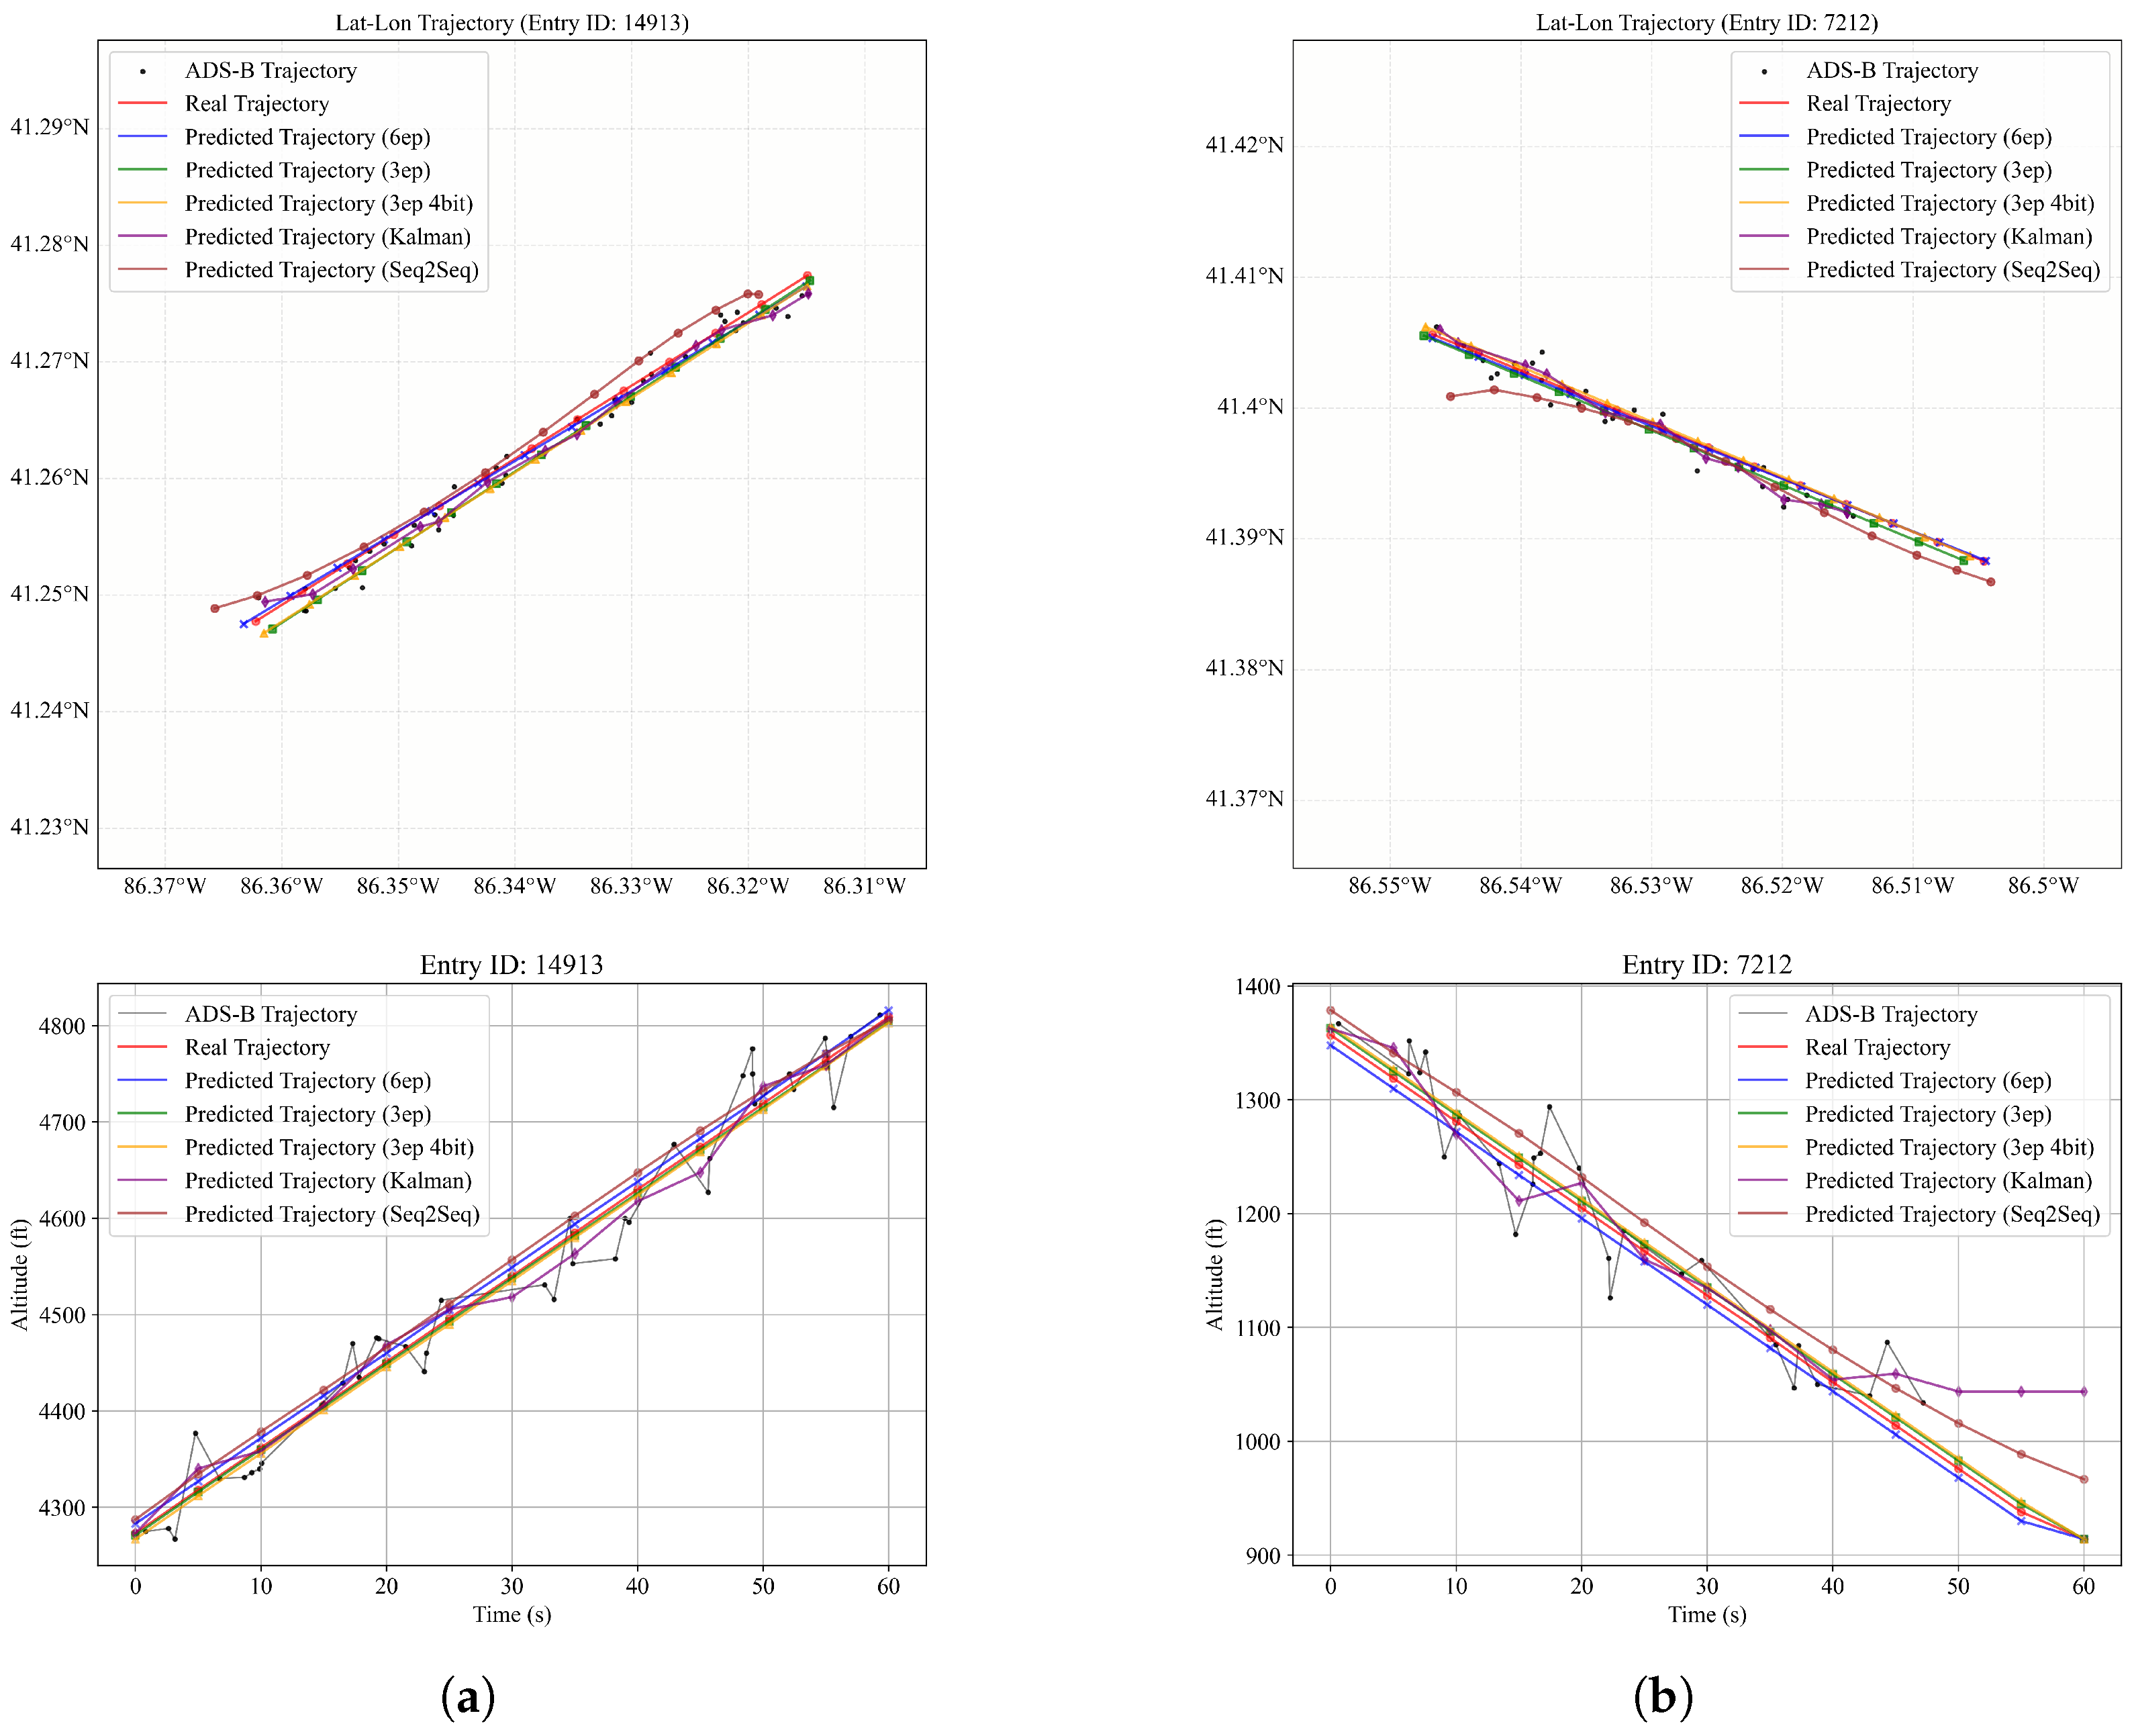
The initial evaluation concentrated on linear flight trajectories, which are among the most commonly observed and comparatively straightforward in nature. Figure 3a,b present two scenarios: one depicting a climbing trajectory and the other illustrating a descending trajectory, both exhibiting a linear pattern on a 2D plane. In Figure 3, the blue, green, and yellow traces, corresponding to the three LLM configurations, almost coincide with the red ground truth markers, confirming that the fine-tuned LLM reconstructed linear paths with high fidelity. The purple lines with diamond markers and brown lines with round markers denote the Kalman filter and Seq2Seq model outputs, respectively. The black dots scattered in the figure represent the ADS-B data points, which were subjected to noise manipulation and data omission.
It is noteworthy that the Kalman filter’s results, based on a standard and simplistic selection of process and measurement noise covariance matrices, exhibited fluctuating predictions when confronted with noisy ADS-B data, although carefully tuning these matrices along with the measurement H and state transition F matrices could mitigate noise effects and enhance the Kalman filter’s stability. The Seq2Seq attenuated noise more effectively than the Kalman filter, yet occasionally diverged from the authentic track in both plan-view and altitude profiles. In contrast, the LLM models’ predictions effectively reduced the impact of noise and produced accurate estimates of the aircraft’s position at each integer timestamp. The altitude predictions similarly revealed considerable accuracy, especially during periods with missing ADS-B data, underscoring the LLM model’s robustness in handling data gaps. Such an encouraging result suggests that the fine-tuned LLaMA model effectively internalizes the underlying motion pattern, such that it can infer an aircraft’s trajectory through short outages or limited data points. This gap-bridging capability was further evidenced in the subsequent curved trajectory analysis. Such robustness is particularly valuable in real-world deployments where sensor dropouts or communication lapses are common.

4.2.2. Curved Flight Trajectories

The subsequent analysis evaluated the model’s performance with curved flight trajectories, which presented increased kinematic complexity compared to linear ones. Figure 4 shows that the LLM models also satisfactorily fulfilled the task expectations in these scenarios. Notably, even in cases where the ADS-B data were missing along curved segments, the models still accurately approximated the ground truth trajectory. This suggests that the model effectively leverages contextual information from surrounding data points to bridge moderate gaps in observations. Conversely, the Kalman filter’s predictions were accurate when relatively dense ADS-B data were available, but it struggled to maintain accuracy in the absence of data. Consequently, it often produced linear interpolated connections without considering the trajectory’s curvature, leading to substantial deviations from the ground truth, as prominently shown in Figure 4b. Although the Seq2Seq baseline followed the general bend of the curvature more smoothly than the Kalman filter, its response lagged at rapid heading changes, introducing systematic bias that may have been attributable to the capacity limits of a plain sequence-to-sequence architecture lacking attention mechanisms or other enhancements [37].
Moreover, the altitude predictions in Figure 4 further emphasize the LLM’s proficiency in filtering altitude data noise, accurately depicting the correct altitude during level flight following a climb or during cruising phases. The Kalman filter, however, remained susceptible to fluctuations in ADS-B data, failing to accurately portray climbing rates and stable altitude levels. Similarly, for altitude profiles, the Seq2Seq maintained continuity yet demonstrated the previously observed lag from the horizontal plane. This behavior is likely attributable to the inherent autoregressive nature of the Seq2Seq architecture, wherein each prediction is conditioned upon the output from the preceding timestep. Collectively, the curved-trajectory results reinforce the conclusion that the LLM generalizes beyond simple linear motion, providing accurate and robust reconstructions across a broader spectrum of flight dynamics.

4.2.3. Performance Comparison

Following the visualized trajectory reconstruction analyses, Table 2 presents the performance metrics for the LLM models under different training configurations, including comparisons with the Kalman filter and Seq2Seq models. The success rate assessed whether the LLM generated a properly formatted numeric prediction, e.g., avoiding textual hallucinations and providing predictions at each integer timestamp. The hallucination here refers to the model’s tendency to produce extraneous or implausible content not warranted by the input data. The Kalman filter and the Seq2Seq model each achieved a success rate of 100%, as they inherently output a numeric estimate at every required time step. In contrast, the fine-tuned LLaMA 3.1-8B model trained for 3 epochs achieved a success rate of 81.67%, which further decreased slightly to 80.60% when quantized to 4-bit optimization. This indicates that the quantization process adversely affected the model’s output stability. However, performance notably improved with additional training. After 6 epochs, the fine-tuned LLaMA model also achieved a success rate of 100%.
Accuracy in the specified range refers to the proportion of predicted latitude, longitude, and altitude values lying within a predefined threshold of the ground truth data. In this case, the latitude/longitude threshold was set to 0.01 degrees and the altitude threshold was set to 100 m. The 6-epoch fine-tuned model attained the highest accuracy of 98.78% (with a 95% confidence interval computed via the Clopper–Pearson method [38]) in the specified range, surpassing both the 3-epoch (98.31%) and quantized counterparts (97.60%), as well as the Kalman filter’s and Seq2Seq model’s baseline performance (87.22% and 94.21%, respectively).
Concerning containment accuracy, the 6-epoch model again demonstrated the best performance, with a containment accuracy of 0.00098 degrees for latitude and longitude and 10.21 m for altitude (meaning 80% of its predictions were within these tight error bounds of the truth), which was markedly superior to other models, in terms of precise trajectory estimation. By contrast, the Kalman filter baseline required a larger tolerance (about 0.00589°, 48.45 m) to reach the same 80% containment level. The Seq2Seq model revealed an overall comparable performance to the Kalman filter. Specifically, it exhibited less precise containment accuracy for latitude and longitude (0.00616°) while achieving more precise altitude containment accuracy ( 30.17 m). However, both baseline models remained much less precise than the fine-tuned LLM.
Figure 5 visualizes the derivation of the containment accuracy. The curves show that the accuracy in the specified range improved as one threshold (e.g., latitude/longitude) was relaxed while the other (e.g., altitude) was held constant, and vice versa. The blue, yellow, and green curves correspond to the 3-epoch, 6-epoch, and quantized LLaMA models, whereas the red curve and purple curves represent the Kalman filter and Seq2Seq model, respectively. The legend box highlights the threshold values on the y-axis where the accuracy in the specified range reached 80%, i.e., the finalized value of the containment accuracy. The Kalman filter exhibited a modest advantage over the Seq2Seq model prior to their intersection point in Figure 5a, indicating robust performance under nominal conditions but diminished effectiveness when confronted with extreme outliers. The relatively gradual increase in the Seq2Seq model’s latitude/longitude containment accuracy curve reveals a systematic latitude–longitude bias that corroborates the patterns observed in the raw trajectories as shown in Figure 3 and Figure 4. Nevertheless, it surpassed the Kalman filter in altitude containment across all thresholds. Across the entire range of thresholds, each LLM configuration consistently outperformed both baselines. Specifically, the margin in favor of the LLM remained stable, underscoring the model’s capacity to maintain superior containment accuracy under varying operational requirements.
Additionally, Table 2 also includes the traditional RMSE and MAE metrics for each model. The RMSE values reflect the presence of outliers in the error distribution, consistent with expectations. For instance, the 3-epoch quantized model had an exceptionally high latitude RMSE (0.650°), indicating a small number of large errors, even though 97.60% of its predictions lay within 0.01° of the truth. The 3-epoch model also exhibited susceptibility to extreme outliers in its latitude predictions, particularly when compared to the Kalman filter and the Seq2Seq model, while the other metrics indicated second-best performance overall. In contrast, the Seq2Seq model did not generate such extreme outliers, indicating its error distribution was more controlled (i.e., latitude RMSE 0.00490° and longitude RMSE 0.00494°), comparable to the Kalman filter in the latitude dimension (0.00419°). The 6-epoch model, on the other hand, achieved the lowest RMSE and MAE values across all dimensions, indicating its superior performance in terms of both typical (by containment accuracy) and worst-case (by RMSE/MAE) errors, and demonstrating the model’s ability to improve with extended training.

4.2.4. Empirical ADS-B Data Evaluation

An evaluation was performed using empirical ADS-B data to further validate the proposed method under real operational conditions. In particular, ADS-B data collected from flights operating at Purdue University Airport (KLAF) over a 24 h period were utilized (16 August 2023). The fine-tuned LLaMA 3.1-8B model (6 epochs) was employed for 100 empirical flight trajectories, each segmented into 60 s intervals. Two representative segments from the results are presented in Figure 6. The first segment (Figure 6a) corresponds to a curved, descending flight trajectory that omitted the second half of the trajectory, while the second segment (Figure 6b) depicts a nearly linear flight profile during climb. The figures illustrate the model’s ability to smoothly interpolate through missing data in the descending turn scenario, and it accurately followed a steady ascent in the climbing scenario. The visualization of the empirical data emphasizes that the LLM model generalizes to practical ADS-B inputs and can handle typical issues such as irregular sampling and data dropouts.

5. Discussion

5.1. Limitations

The experiments conducted in this study successfully demonstrated the potential of LLMs to process sequential data and discern complex patterns for reconstructing flight trajectories, provided considerable training data. However, several notable limitations emerged from the current analysis.
Firstly, it should be noted that the evaluation on empirical ADS-B data was inherently limited by the absence of an independent ground truth trajectory for the flights. Specifically, the ADS-B position reports themselves served as the only reference in the empirical evaluation, which precluded a quantitative error analysis of the reconstructed trajectories. A comprehensive validation of reconstruction accuracy would require high-fidelity truth data: for instance, obtaining detailed flight logs from an onboard avionics system such as the Garmin G1000 or similar systems. However, this was beyond the scope of this study. Future work may consider a hybrid approach that combines synthetic flight data with real ADS-B observations for model training and testing, thereby enabling more robust validation of the model’s performance in real-world conditions.
Additionally, since LLM models interpret numerical inputs as tokens, a notable limitation lies in the LLM’s restricted token length, which significantly curtails its practical applicability for larger-scale datasets. Attempted tests using input duration beyond 60 s, such as 90 s and 120 s, may result in a higher probability of the token length exceeding the model’s maximum single input token allowance (e.g., 4096 tokens for LLaMA 3 series [26]). Consequently, the model cannot directly handle these extended sequences or increased digit precision within a single inference. This limitation could potentially be mitigated by implementing multiple rounds of inference and leveraging conversational capabilities with longer context windows available in state-of-the-art LLMs (e.g., up to 128 k tokens for LLaMA 3 [26]). Nevertheless, this poses trade-offs by slowing both training and inference speeds and potentially placing substantially higher demands on computational resources.
Furthermore, the study revealed that in certain cases, especially in underfitted or quantized models, the predictions may occasionally include one or more outliers or unforeseen textual outputs, presumably stemming from LLM hallucinations. Such “LLM hallucinations” describe the generation of instances that do not correspond to the actual trajectory data, such as a random coordinate far outside the flight path or the model momentarily outputting a snippet of irrelevant text. In the study, these anomalous outputs were rare, and none appeared in the fully trained 6-epoch model’s results. However, they indicated that LLMs are not entirely free from the known tendency of generative models to occasionally produce unsanctioned content. Therefore, despite their impressive overall performance, they cannot yet replace established methodologies, such as Kalman filtering, in terms of efficiency and reliability. Nevertheless, given the rapid advances in LLM capabilities, particularly in reducing hallucination through Reinforcement Learning from Human Feedback (RLHF) or similar techniques [39], their potential for the accurate processing of sequential time series data remains highly promising.
Lastly, the study’s scope was limited exclusively to evaluating the LLaMA 3.1-8B model without extending to other widely used LLM families such as the GPT series or exploring models with larger parameter sizes. Future studies should include comparative analyses across diverse LLM architectures and parameter sizes, evaluating how factors such as temperature, Top-p, and alternative PEFT methods influence prediction accuracy.

5.2. Future Research

Building upon the findings and limitations identified in this study, several avenues for future research emerge. Firstly, additional sensitivity analyses could be conducted on the model parameters to examine the impact of configuration adjustments on the model’s performance. Moreover, instruction prompts can significantly influence the model’s responses; future research should explore systematic optimization of prompt design to improve prediction reliability and consistency.
Addressing the token length constraints of current LLMs represents another essential research direction. Overcoming this limitation might enable LLMs to process longer sequences and accommodate more complex data scenarios, thereby broadening their scope and applicability across various fields. Potential applications in aviation include classification tasks such as flight phase identification, where data require manual labeling for a supervised learning approach and where the model may rely on trajectory patterns to determine the flight phase [2]. LLM capability could have far-reaching implications for such aviation management analyses and beyond.
Briefly, the potential of LLMs to move towards AGI is an exciting prospect. The ability of these models to learn from diverse data sources and continuously improve their performance suggests that LLMs offer substantial enhancements in various fields. Particularly in the aviation and transportation industry, the application of LLMs could revolutionize data integration and analysis, predictive modeling, and operational optimization.

6. Conclusions

This study highlighted the potential of LLMs in processing time series data, with a specific emphasis on flight trajectory reconstruction. Compared with earlier iterations, this manuscript presents several new developments and insights. A key methodological contribution was the introduction of containment accuracy, a simpler, threshold-based evaluation that maintains the original coordinate system, reduces errors associated with complex distance conversions, and mitigates the influence of outliers. Overall, this approach effectively facilitated a more intuitive measurement framework for trajectory reconstruction tasks and, similarly, trajectory prediction tasks. The study also conducted a more extensive trial, including experiments with longer training (6 epochs vs. 3) and with quantized models, to thoroughly compare the LLM’s performance against the baseline Kalman filter and Seq2Seq models. The results showed that the LLaMA 3.1-8B model, when fine-tuned, can effectively reconstruct flight trajectories, even under conditions with noise or missing sequential data. Although conventional methods remain a reliable baseline, the results indicate that LLM-based approaches can offer comparable or superior performance when properly trained and configured.
However, despite its promising results, the study identified significant limitations, notably the token length constraint, occasional prediction outliers due to hallucinations, and the computational demands of LLMs, which currently hinder the broader practical adoption of LLMs. Future advancements, including improved inference methods and expanded token length capabilities, will be critical for enhancing the reliability and scalability of LLM applications in aviation.
In conclusion, despite these constraints, this study highlights the substantial potential of LLMs in aviation data analysis, laying a solid foundation for future advancements. By resolving existing limitations and broadening the scope of experimentation, LLMs can become an increasingly vital tool for aviation and transportation analytics, paving the way for improved data-driven decision making and more robust time series predictions.

Author Contributions

Conceptualization, Q.Z. and J.H.M.; methodology, Q.Z. and J.H.M.; software, Q.Z.; validation, Q.Z.; formal analysis, Q.Z.; investigation, Q.Z.; resources, Q.Z.; data curation, Q.Z.; writing—original draft preparation, Q.Z.; writing—review and editing, Q.Z. and J.H.M.; visualization, Q.Z.; supervision, J.H.M.; project administration, J.H.M. All authors have read and agreed to the published version of the manuscript.

Funding

This research received no external funding.

Data Availability Statement

The data and code used for the experiments will be available once the paper is accepted.

Acknowledgments

The authors wish to express their gratitude to John A. Springer for providing essential computing resources and support, which significantly contributed to the research presented in this paper.

Conflicts of Interest

The authors declare no conflicts of interest.

References

  1. Xi, Z.; Chen, W.; Guo, X.; He, W.; Ding, Y.; Hong, B.; Zhang, M.; Wang, J.; Jin, S.; Zhou, E.; et al. The rise and potential of large language model based agents: A survey. arXiv 2023, arXiv:2309.07864. [Google Scholar] [CrossRef]
  2. Zhang, Q.; Mott, J.H.; Johnson, M.E.; Springer, J.A. Development of a Reliable Method for General Aviation Flight Phase Identification. IEEE Trans. Intell. Transp. Syst. 2021, 23, 11729–11738. [Google Scholar] [CrossRef]
  3. Federal Aviation Administration. ADS-B–Frequently Asked Questions; Federal Aviation Administration: Washington, DC, USA, 2020. [Google Scholar]
  4. Mott, J.H.; Bullock, D.M. Estimation of aircraft operations at airports using mode-C signal strength information. IEEE Trans. Intell. Transp. Syst. 2017, 19, 677–686. [Google Scholar] [CrossRef]
  5. Shi, Z.; Xu, M.; Pan, Q.; Yan, B.; Zhang, H. LSTM-based flight trajectory prediction. In Proceedings of the 2018 International Joint Conference on Neural Networks (IJCNN), Rio de Janeiro, Brazil, 8–13 July 2018; pp. 1–8. [Google Scholar]
  6. Hegselmann, S.; Buendia, A.; Lang, H.; Agrawal, M.; Jiang, X.; Sontag, D. Tabllm: Few-shot classification of tabular data with large language models. In Proceedings of the International Conference on Artificial Intelligence and Statistics, Valencia, Spain, 25–27 April 2023; pp. 5549–5581. [Google Scholar]
  7. Gruver, N.; Finzi, M.; Qiu, S.; Wilson, A.G. Large Language Models Are Zero-Shot Time Series Forecasters. In Proceedings of the Advances in Neural Information Processing Systems; Oh, A., Neumann, T., Globerson, A., Saenko, K., Hardt, M., Levine, S., Eds.; Curran Associates, Inc.: Red Hook, NY, USA, 2023; Volume 36, pp. 19622–19635. [Google Scholar]
  8. Ma, L.; Tian, S. A hybrid CNN-LSTM model for aircraft 4D trajectory prediction. IEEE Access 2020, 8, 134668–134680. [Google Scholar] [CrossRef]
  9. Yepes, J.L.; Hwang, I.; Rotea, M. New algorithms for aircraft intent inference and trajectory prediction. J. Guid. Control Dyn. 2007, 30, 370–382. [Google Scholar] [CrossRef]
  10. Porretta, M.; Dupuy, M.D.; Schuster, W.; Majumdar, A.; Ochieng, W. Performance evaluation of a novel 4D trajectory prediction model for civil aircraft. J. Navig. 2008, 61, 393–420. [Google Scholar] [CrossRef]
  11. Thipphavong, D.P.; Schultz, C.A.; Lee, A.G.; Chan, S.H. Adaptive algorithm to improve trajectory prediction accuracy of climbing aircraft. J. Guid. Control Dyn. 2013, 36, 15–24. [Google Scholar] [CrossRef]
  12. Simon, D. Optimal State Estimation: Kalman, H Infinity, and Nonlinear Approaches; John Wiley & Sons: Hoboken, NJ, USA, 2006. [Google Scholar]
  13. Dy, L.R.I.; Borgen, K.B.; Mott, J.H.; Sharma, C.; Marshall, Z.A.; Kusz, M.S. Validation of ADS-B Aircraft Flight Path Data Using Onboard Digital Avionics Information. In Proceedings of the 2021 Systems and Information Engineering Design Symposium (SIEDS), Virtual, 29–30 April 2021; pp. 1–6. [Google Scholar]
  14. Zeng, W.; Quan, Z.; Zhao, Z.; Xie, C.; Lu, X. A deep learning approach for aircraft trajectory prediction in terminal airspace. IEEE Access 2020, 8, 151250–151266. [Google Scholar] [CrossRef]
  15. Zhang, Q.; Mott, J.H. Improved Framework for Classification of Flight Phases of General Aviation Aircraft. Transp. Res. Rec. 2023, 2677, 1665–1675. [Google Scholar] [CrossRef]
  16. Chang, C.; Peng, W.C.; Chen, T.F. Llm4ts: Two-stage fine-tuning for time-series forecasting with pre-trained llms. arXiv 2023, arXiv:2308.08469. [Google Scholar]
  17. Zhou, T.; Niu, P.; Wang, X.; Sun, L.; Jin, R. One Fits All: Power General Time Series Analysis by Pretrained LM. In Proceedings of the Advances in Neural Information Processing Systems; Oh, A., Neumann, T., Globerson, A., Saenko, K., Hardt, M., Levine, S., Eds.; Curran Associates, Inc.: Red Hook, NY, USA, 2023; Volume 36, pp. 43322–43355. [Google Scholar]
  18. Jin, M.; Wang, S.; Ma, L.; Chu, Z.; Zhang, J.Y.; Shi, X.; Chen, P.Y.; Liang, Y.; Li, Y.F.; Pan, S.; et al. Time-LLM: Time Series Forecasting by Reprogramming Large Language Models. In Proceedings of the Twelfth International Conference on Learning Representations, Vienna, Austria, 7–11 May 2024. [Google Scholar]
  19. Wang, L.; Chou, J.; Tien, A.; Zhou, X.; Baumgartner, D. AviationGPT: A Large Language Model for the Aviation Domain. In Proceedings of the AIAA Aviation Forum and Ascend, Las Vegas, NV, USA, 29 July–2 August 2024; p. 4250. [Google Scholar] [CrossRef]
  20. Nielsen, D.; Clarke, S.S.; Kalyanam, K.M. Towards an aviation large language model by fine-tuning and evaluating transformers. In Proceedings of the 2024 AIAA DATC/IEEE 43rd Digital Avionics Systems Conference (DASC), San Diego, CA, USA, 29 September–3 October 2024; pp. 1–5. [Google Scholar]
  21. Abdulhak, S.; Hubbard, W.; Gopalakrishnan, K.; Li, M.Z. Chatatc: Large language model-driven conversational agents for supporting strategic air traffic flow management. arXiv 2024, arXiv:2402.14850. [Google Scholar]
  22. Guo, D.; Zhang, Z.; Yang, B.; Zhang, J.; Yang, H.; Lin, Y. Integrating spoken instructions into flight trajectory prediction to optimize automation in air traffic control. Nat. Commun. 2024, 15, 9662. [Google Scholar] [CrossRef] [PubMed]
  23. Zhang, Q. General Aviation Aircraft Flight Status Identification Framework. Ph.D. Thesis, Purdue University, West Lafayette, IN, USA, 2024. [Google Scholar] [CrossRef]
  24. Hoekstra, J.M.; Ellerbroek, J. Bluesky ATC simulator project: An open data and open source approach. In Proceedings of the 7th International Conference on Research in Air Transportation, Philadelphia, PA, USA, 20–24 June 2016; FAA/Eurocontrol USA/Europe: Brussels, Belgium, 2016; Volume 131, p. 132. [Google Scholar]
  25. Touvron, H.; Lavril, T.; Izacard, G.; Martinet, X.; Lachaux, M.A.; Lacroix, T.; Rozière, B.; Goyal, N.; Hambro, E.; Azhar, F.; et al. Llama: Open and efficient foundation language models. arXiv 2023, arXiv:2302.13971. [Google Scholar]
  26. Grattafiori, A.; Dubey, A.; Jauhri, A.; Pandey, A.; Kadian, A.; Al-Dahle, A.; Letman, A.; Mathur, A.; Schelten, A.; Vaughan, A.; et al. The llama 3 herd of models. arXiv 2024, arXiv:2407.21783. [Google Scholar]
  27. Zheng, Y.; Zhang, R.; Zhang, J.; Ye, Y.; Luo, Z.; Feng, Z.; Ma, Y. Llamafactory: Unified efficient fine-tuning of 100+ language models. arXiv 2024, arXiv:2403.13372. [Google Scholar]
  28. Hu, E.J.; Shen, Y.; Wallis, P.; Allen-Zhu, Z.; Li, Y.; Wang, S.; Wang, L.; Chen, W. LoRA: Low-Rank Adaptation of Large Language Models. In Proceedings of the International Conference on Learning Representations, Virtual, 25–29 April 2022. [Google Scholar]
  29. Dettmers, T.; Pagnoni, A.; Holtzman, A.; Zettlemoyer, L. Qlora: Efficient finetuning of quantized llms. Adv. Neural Inf. Process. Syst. 2023, 36, 10088–10115. [Google Scholar]
  30. Babb, T. How a Kalman Filter Works, in Pictures. 2015. Available online: https://www.bzarg.com/p/how-a-kalman-filter-works-in-pictures/ (accessed on 4 November 2022).
  31. Sutskever, I.; Vinyals, O.; Le, Q.V. Sequence to sequence learning with neural networks. Adv. Neural Inf. Process. Syst. 2014, 27, 3104–3112. [Google Scholar]
  32. Cho, K.; Van Merriënboer, B.; Gulcehre, C.; Bahdanau, D.; Bougares, F.; Schwenk, H.; Bengio, Y. Learning phrase representations using RNN encoder-decoder for statistical machine translation. arXiv 2014, arXiv:1406.1078. [Google Scholar]
  33. Lamb, A.M.; Alias Parth Goyal, A.G.; Zhang, Y.; Zhang, S.; Courville, A.C.; Bengio, Y. Professor forcing: A new algorithm for training recurrent networks. Adv. Neural Inf. Process. Syst. 2016, 29, 4601–4609. [Google Scholar]
  34. Yao, Y.; Rosasco, L.; Caponnetto, A. On early stopping in gradient descent learning. Constr. Approx. 2007, 26, 289–315. [Google Scholar] [CrossRef]
  35. Chung, J.; Gulcehre, C.; Cho, K.; Bengio, Y. Empirical evaluation of gated recurrent neural networks on sequence modeling. arXiv 2014, arXiv:1412.3555. [Google Scholar]
  36. Dey, R.; Salem, F.M. Gate-variants of gated recurrent unit (GRU) neural networks. In Proceedings of the 2017 IEEE 60th International Midwest Symposium on Circuits and Systems (MWSCAS), Boston, MA, USA, 6–9 August 2017; pp. 1597–1600. [Google Scholar]
  37. Bahdanau, D.; Cho, K.; Bengio, Y. Neural machine translation by jointly learning to align and translate. arXiv 2014, arXiv:1409.0473. [Google Scholar]
  38. Newcombe, R.G. Two-sided confidence intervals for the single proportion: Comparison of seven methods. Stat. Med. 1998, 17, 857–872. [Google Scholar] [CrossRef]
  39. Ouyang, L.; Wu, J.; Jiang, X.; Almeida, D.; Wainwright, C.; Mishkin, P.; Zhang, C.; Agarwal, S.; Slama, K.; Ray, A.; et al. Training language models to follow instructions with human feedback. Adv. Neural Inf. Process. Syst. 2022, 35, 27730–27744. [Google Scholar]
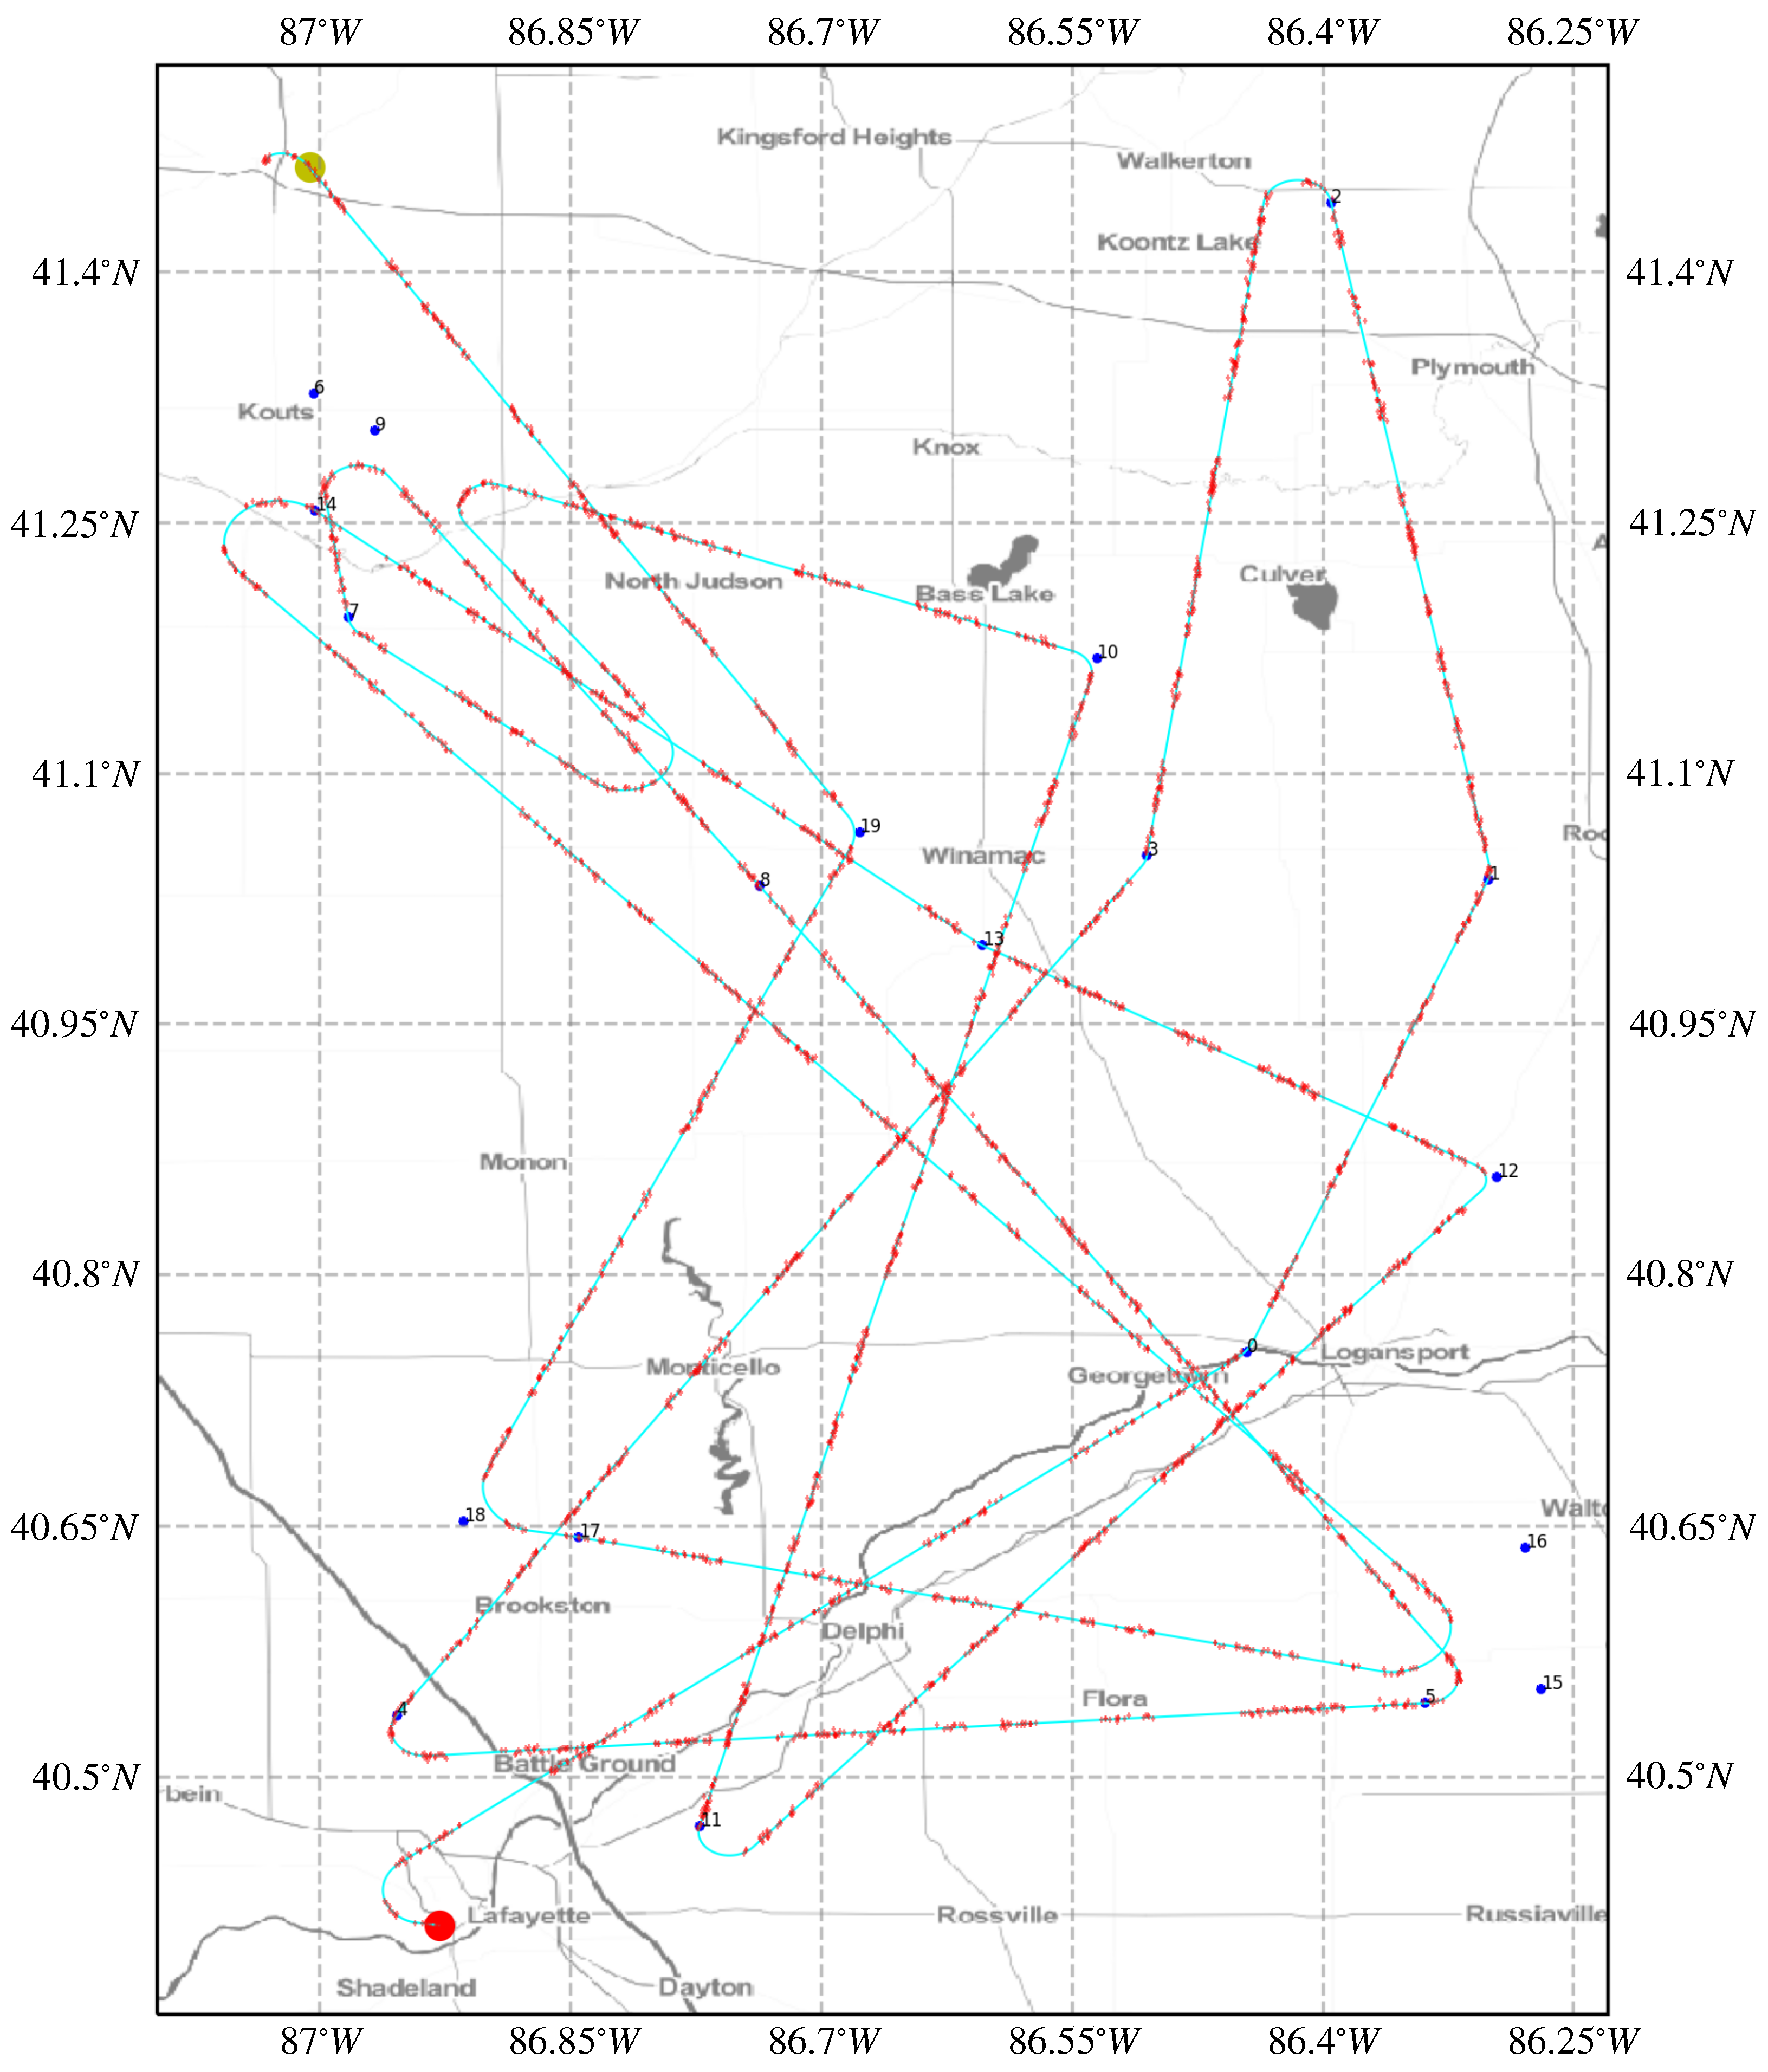
Figure 1. An illustration of a simulated flight trajectory with synthetic ADS-B data departing from KLAF and arriving at KVPZ.
Mathematics 13 01775 g001
Figure 2. The training loss curve of the LLaMA 3.1-8B model.
Mathematics 13 01775 g002
Figure 3. Results of flight trajectory reconstruction for linear trajectories: (a) Climbing trajectory with a constant rate. (b) Descending trajectory with a constant rate.
Mathematics 13 01775 g003
Figure 4. Results of flight trajectory reconstruction for curved trajectories: (a) Curved flight trajectory exhibiting an ascending motion. (b) Curved flight trajectory maintaining level altitude.
Mathematics 13 01775 g004
Figure 5. The containment accuracy curve comparison for the LLaMA 3.1-8B model under different training configurations, as well as the Kalman filter and Seq2Seq model: (a) The containment accuracy curve for latitude and longitude. (b) The containment accuracy curve for altitude.
Mathematics 13 01775 g005
Figure 6. Results of empirical ADS-B data flight trajectory reconstruction: (a) Curved flight trajectory exhibiting a descending motion. (b) Linear flight trajectory demonstrating a steady climb.
Mathematics 13 01775 g006
Table 1. An example of an input prompt for the model.
Determine the curved flight trajectory using
these estimated parameters (time, latitude,
longitude, altitude, true airspeed, vertical
speed, and track angle). Please summarize the
precise trajectory considering these inputs:
(967, 4140614, 8692362, 4863, 81, 0, 308),
(1158, 4140473, 8692565, 4895, 81, 0, 308),
(1266, 4140443, 8692432, 4886, 81, 0, 308),
continue with other rows
(5747, 4142412, 8696346, 4871, 81, 0, 271)
- - - - - - -
Summary:
Table 2. Performance comparison of LLaMA 3.1-8B variants, Kalman filter, and Seq2Seq models.
MetricKalman FilterSeq2Seq3 Epochs + 4-Bit3 Epochs6 Epochs
Success rate (%) 100.00100.0080.6081.67100.00
RMSE-lat (°)0.004190.004900.650020.373610.00304
RMSE-lon (°)0.007210.004941.374750.005140.00425
RMSE-alt (m)52.8832.5024.7423.7718.60
MAE-lat (°)0.002040.002910.011250.004250.00061
MAE-lon (°)0.003670.003370.023280.001300.00081
MAE-alt (m)29.4918.678.037.346.06
Acc. in spec. range (%) 87.2294.2197.6098.3198.78
95% CI (87.08–87.37)(94.10–94.31)(97.53–97.68)(98.25–98.38)(98.73–98.83)
Lon + lat cont. acc. (°) §0.005890.006160.001860.001670.00098
Alt cont. acc. (m) §48.4530.1713.5612.5410.21
Notes. The success rate measured whether the LLM output a properly formatted numeric prediction (e.g., it did not hallucinate text). Accuracy in the specified range was evaluated using a latitude/longitude threshold of 0.01 degrees and an altitude threshold of 100 m. Its 95% Clopper–Pearson confidence interval is shown in parentheses. § Containment accuracy refined the lat/lon or altitude threshold until the accuracy in the specified range reached 80%. For lon and lat cont. acc., altitude was fixed at 100 m; for alt cont. acc., lat/lon was fixed at 0.01 degrees.
Disclaimer/Publisher’s Note: The statements, opinions and data contained in all publications are solely those of the individual author(s) and contributor(s) and not of MDPI and/or the editor(s). MDPI and/or the editor(s) disclaim responsibility for any injury to people or property resulting from any ideas, methods, instructions or products referred to in the content.