


Abstract
Choosing the optimal path in planning is a complex task due to the numerous options and constraints; this is known as the trip design problem (TTDP). This study aims to achieve path optimization through the weighted sum method and multi-criteria decision analysis. Firstly, this paper proposes a weighted sum optimization method using a comprehensive evaluation model to address TTDP, a complex multi-objective optimization problem. The goal of the research is to balance experience, cost, and efficiency by using the Analytic Hierarchy Process (AHP) and Entropy Weight Method (EWM) to assign subjective and objective weights to indicators such as ratings, duration, and costs. These weights are optimized using the Lagrange multiplier method and integrated into the Technique for Order Preference by Similarity to Ideal Solution (TOPSIS) model. Additionally, a weighted sum optimization method within the Traveling Salesman Problem (TSP) framework is used to maximize ratings while minimizing costs and distances. Secondly, this study compares seven heuristic algorithms—the genetic algorithm (GA), particle swarm optimization (PSO), the tabu search (TS), genetic-particle swarm optimization (GA-PSO), the gray wolf optimizer (GWO), and ant colony optimization (ACO)—to solve the TOPSIS model, with GA-PSO performing the best. The study then introduces the Lagrange multiplier method to the algorithms, improving the solution quality of all seven heuristic algorithms, with an average solution quality improvement of 112.5% (from 0.16 to 0.34). The PSO algorithm achieves the best solution quality. Based on this, the study introduces a new variant of PSO, namely PSO with Laplace disturbance (PSO-LD), which incorporates a dynamic adaptive Laplace perturbation term to enhance global search capabilities, improving stability and convergence speed. The experimental results show that PSO-LD outperforms the baseline PSO and other algorithms, achieving higher solution quality and faster convergence speed. The Wilcoxon signed-rank test confirms significant statistical differences among the algorithms. This study provides an effective method for experience-oriented path optimization and offers insights into algorithm selection for complex TTDP problems.
Keywords:
multi-criteria decision-making; weighted sum optimization; tourist trip design problem; algorithm performance evaluation; particle swarm optimization with Laplace disturbance MSC:
90-10
1. Introduction
Decision-making constitutes an essential facet of human endeavors, particularly in contexts characterized by a multitude of options and constraints. Within the realm of tourism, travelers confront an extensive array of choices and limitations, rendering route planning a complex endeavor that necessitates the delicate balancing of factors such as cost, time, and personal preferences. Although various assistive tools are available, the task of planning optimal tourism routes remains formidable due to the need to reconcile multiple conflicting objectives and constraints, including budgetary limitations, temporal restrictions, and visa requirements, all while striving to ensure a seamless and enjoyable experience. Addressing these multifaceted challenges demands the application of advanced optimization techniques capable of effectively managing such intricacies.
Tourism route planning often parallels the Traveling Salesman Problem (TSP), a quintessential combinatorial optimization problem. The TSP entails identifying the shortest route to traverse a set of destinations while minimizing distance or time and has garnered extensive attention due to its NP-hard nature [1,2]. However, traditional optimization methods frequently falter in providing suitable solutions for such problems, particularly under complex scheduling constraints. With the advent of artificial intelligence, intelligent problem-solving methods have emerged, offering near-optimal solutions to intricate real-world optimization problems. Techniques such as heuristics, branch-and-bound methods, and metaheuristic algorithms (e.g., genetic algorithms, simulated annealing) have been employed to tackle the TSP, thereby advancing its practical applications in logistics and tourism [3,4,5]. The significance of metaheuristic algorithms is underscored by their capacity to swiftly identify near-optimal solutions, rendering them highly suitable for large-scale, time-sensitive problems [6].
The tourist trip design problem (TTDP) is a route-planning problem for tourists that aligns with their preferences and requirements while maximizing their entertainment, all within the confines of numerous constraints. Given the pivotal role of TTDP-related research in enhancing the experiences of tourists and bolstering the competitive advantages of tourism destinations, this research domain has garnered considerable attention [7,8].
Visa policies, such as China’s 72 h visa-free transit policy, introduce time-sensitive constraints, thereby inherently aligning the problem with the team orienteering problem with time windows (TOPTW). In TOPTW, time windows are treated as constraints, and similar visa policies influence travel behaviors by encouraging longer stays while requiring travelers to plan within limited time frames. These insights underscore the growing importance of addressing TTDP with advanced methods that incorporate time-sensitive constraints, as visa policies increasingly shape modern tourism dynamics [5,9].
Existing works have attempted to address some of these challenges. For instance, the TS algorithm can avoid the local optimal solution, but the running time is long [10]. The particle swarm optimization (PSO) algorithm has been used to solve the Traveling Salesman Problem [11]. Later, the ant colony optimization (ACO) method was proposed for estimating tourism revenue, and an expenditure approach was developed [12]. Then, a “multi-day tourism” optimization model employed a Monte Carlo-improved simulated annealing algorithm to design local tourist routes, with objectives such as the shortest path and lowest cost [13]. Additionally, a hybrid metaheuristic algorithm combining the genetic algorithm (GA) [14] and Variable Neighborhood Descent (VND) has been proposed [15]. In addition, in the hybrid GA-PSO algorithm, new individuals are created through GA operators—crossover and mutation as well as a mechanism of PSO to find the optimal and computational time [16]. The standard gray wolf optimization (GWO) method developed for numerical optimization is a new approach to solving TSP, inspired by the hunting and social behavior of gray wolf packs [17]. Moreover, the RL-SA leverages the whale optimization algorithm (WOA) to generate initial solutions for better sampling efficiency [18]. Another study, which integrates cluster hierarchy with heuristic algorithms, offers a structured approach to optimizing route planning under complex constraints [19]. While these methods provide valuable insights, they often rely on single-algorithm strategies and focus on narrow objectives, such as cost or path minimization. A summary of the above literature is shown in Table 1.
Table 1.
Summary of the literature.
These limitations impede adaptability to diverse conditions, such as evolving travel preferences, strict time constraints, or multi-objective requirements that necessitate a careful balance between cost, experience, and efficiency. Most existing approaches for determining criteria weights face challenges when used independently. For example, the Analytic Hierarchy Process (AHP), as a subjective weighting method, relies heavily on expert judgment for constructing its matrix [20]. Excessive subjectivity in expert evaluations can significantly influence the final results [21]. Conversely, the Entropy Weight Method (EWM), as an objective weighting method, provides strong mathematical rigor but often fails to incorporate the subjective priorities of decision-makers [22]. This highlights the need for a hybrid weighting approach that combines the strengths of both methods to effectively address their individual shortcomings. Furthermore, these approaches often lack benchmarking against alternative algorithms, which limits their ability to assess comparative effectiveness and scalability in diverse scenarios.
The structure of this paper is as follows. Section 1 introduces the complexity of tourism route planning, focusing on decision-making challenges under multiple objectives and constraints, reviewing the Traveling Salesman Problem (TSP) and its applications in tourism route optimization, and emphasizing the advantages of metaheuristic algorithms in large-scale combinatorial optimization. Section 2 discusses the data sources, data cleaning process, and the research framework. Section 3 constructs a TOPSIS comprehensive evaluation model based on weighted scores, achieving cost minimization and score maximization under the 144-h visa policy. Section 4 builds a weighted optimization model, considering both tourist experience and cost, and performs route planning based on scores, costs, and travel distances. Section 5 compares the performance of eight heuristic algorithms (GA, PSO, TS, GA-PSO, GWO, ACO, WOA, and PSO-LD) in path optimization. Section 6 conducts a parameter sensitivity analysis of the PSO-LD algorithm to verify its stability and adaptability. Section 7 discusses the advantages of the proposed method, combining multi-criteria decision-making and heuristic algorithms to optimize tourist experience, cost, and efficiency, with a focus on the weighting method and the role of the Lagrange multiplier method in optimizing weights. The PSO-LD algorithm performs excellently in multi-area planning, demonstrating high efficiency and scalability. Finally, Section 8 summarizes the main contributions of the study, presenting a framework that integrates weighted optimization methods, decision criteria, and heuristic algorithms, significantly improving solution quality and computational efficiency, especially with the PSO-LD algorithm, which improves solution quality by about 11% compared to traditional PSO.
Building on these developments, this research offers solutions for more effective tourism evaluation and route optimization. It introduces methods for evaluating tourist sites with advanced metrics, balancing cost and experience in route planning, and analyzing the strengths of different algorithms for complex TSP cases. Collectively, these contributions provide practical tools and insights to address challenges in tourism optimization. The primary contributions of this research are as follows:
- (1)
- This study introduces a TOPSIS comprehensive evaluation model [23] incorporating the Lagrange multiplier method to enhance the objectivity and rationality of decision-making. The model systematically evaluates complex tourism indicators, optimizing costs and travel experiences within the framework of the TSP, thereby supporting effective tourist route planning.
- (2)
- Based on TOPSIS as a benchmark, multiple heuristic algorithms are evaluated to address the limitations of single algorithms in complex real-world applications further. By analyzing their performance in varying contexts, the most effective approach for optimizing tourist routes is identified. This multi-algorithm evaluation enhances adaptability and user experience, providing a robust framework for improving the efficiency and effectiveness of route optimization.
2. Dataset and Methods
The dataset for this study was sourced from https://www.qunar.com/ (accessed on 17 August 2023), a leading Chinese travel service platform offering comprehensive tourism-related data, including hotel bookings, flight reservations, and attraction information. A sample dataset is shown in Table 2. To ensure the scientific accuracy and reliability of the data, records with incomplete star ratings and scores were removed during the research process, resulting in a final selection of 617 tourist attractions across 10 provinces and autonomous regions. Based on the star rating, recommended visiting times for each attraction were determined, and the corresponding latitude and longitude information was obtained using the Gaode Map API. In addition, it is worth clarifying that the distances between these attractions are calculated using Euclidean distance, with a two-dimensional space used to reflect the actual geographical distance. The complete datasets can be accessed via the following link: https://github.com/GZHUone/excel (accessed on 23 August 2023).
Table 2.
Examples of partial datasets.
(1) For the quantitative comprehensive rating of tourist attractions, this research proposes an approach that uses the AHP, EWM, and Lagrange multiplier method to calculate weights and combines these with the TOPSIS model to construct a comprehensive evaluation model, resulting in an overall score for each attraction. More details can be seen in Section 3.
(2) For the purpose of balancing cost minimization and maximizing the comprehensive rating of tourist attractions under constraints, this study proposes a weighted sum programming model. With the basic parameters held constant, this study uses eight heuristic algorithms to find the optimal route-planning solution through iterative optimization. More details can be seen in Section 4 and Section 5.
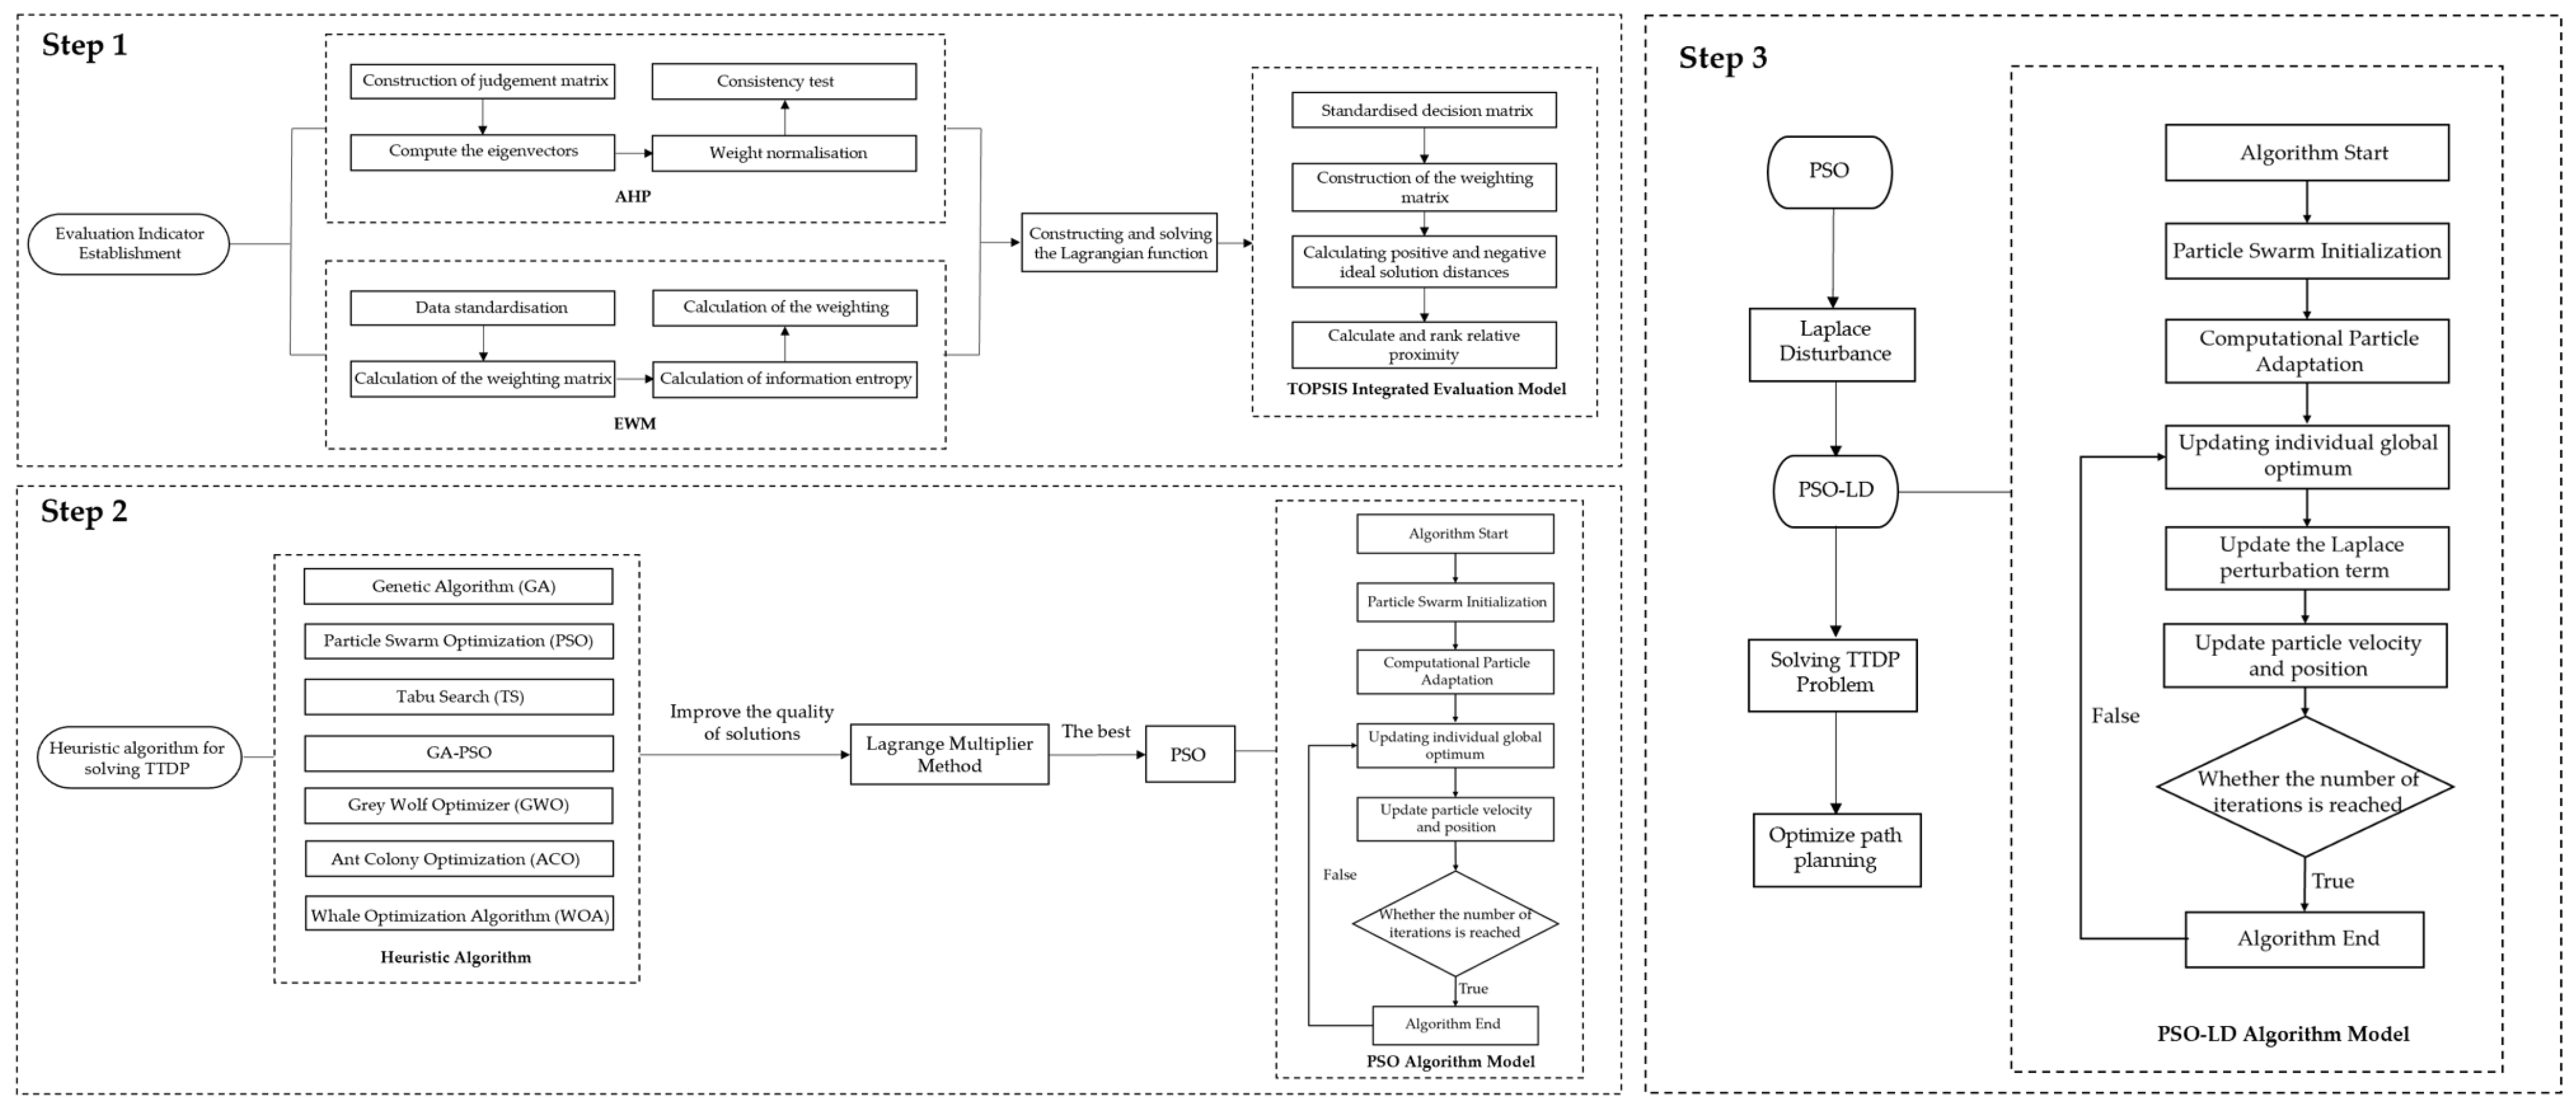
To present the work of this study more intuitively, a detailed research framework is shown in Figure 1.
Figure 1.
Research framework of this study.
3. TOPSIS Comprehensive Evaluation Model
This section provides a comprehensive overview of the structure of the TOPSIS comprehensive evaluation model (Section 3.1). Additionally, it introduces the AHP (Section 3.2), EWM (Section 3.3), and the Lagrange multiplier method (Section 3.4). Section 3.5 then elaborates on the integration of these methods into the proposed TOPSIS comprehensive evaluation model.
3.1. Structure of the TOPSIS Comprehensive Evaluation Model
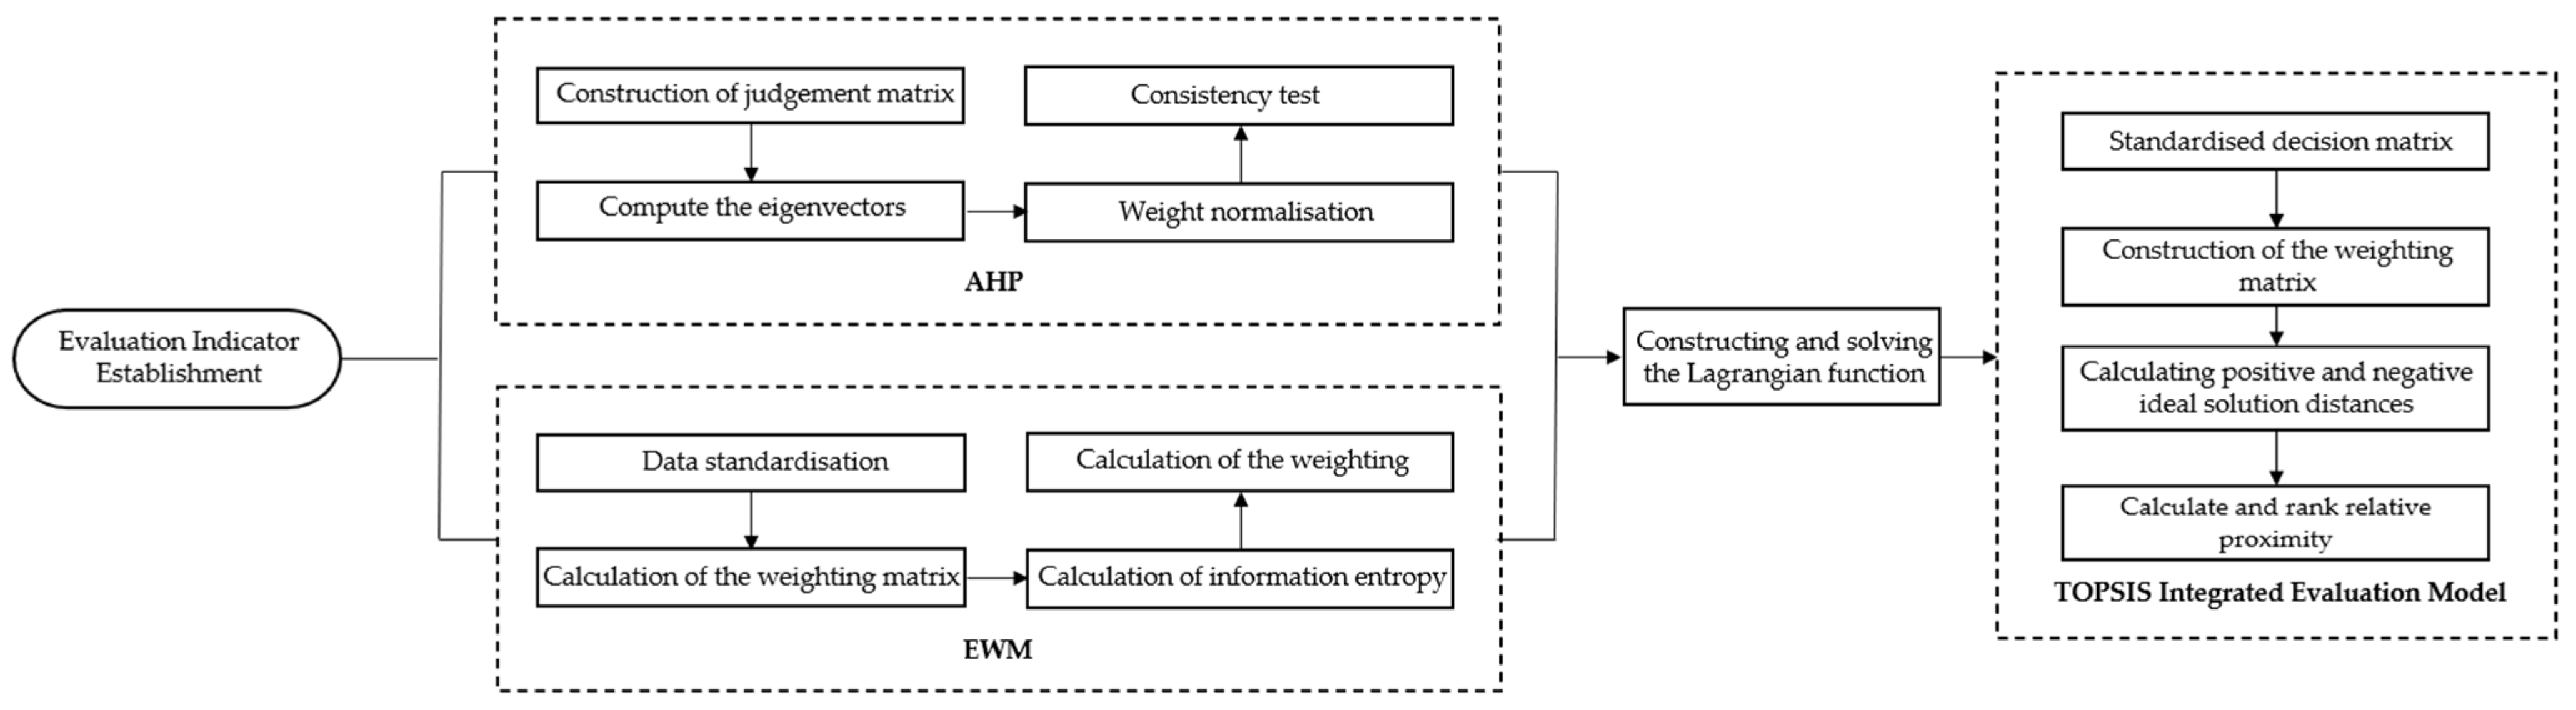
This study constructs a comprehensive evaluation model to rank tourist attractions scientifically. The AHP is utilized to determine subjective weights for four key indicators: visit time, ratings, price, and sales volume. The EWM is employed to calculate objective weights based on data variability. To balance the influence of subjective and objective weights, the Lagrange multiplier method is introduced to optimize the combination of these weights. Finally, the optimized weights are applied to the TOPSIS comprehensive evaluation model to obtain the overall scores and rankings of the attractions. Figure 2 shows the steps in a comprehensive evaluation model flowchart.
Figure 2.
Flowchart illustrating the TOPSIS comprehensive evaluation model.
3.2. The Analytic Hierarchy Process
To effectively evaluate and prioritize multiple criteria in decision-making, this study employs AHP, a widely used method in multi-criteria decision analysis, to determine the importance of each factor through pairwise comparisons [20,22]. The detailed steps are as follows:
First, a judgment matrix was constructed, which expresses the relative importance among the four indicators: visit time, visitor rating, attraction price, and attraction sales. To fully reflect the decision-maker’s experience and preferences, this research utilized Saaty’s 1–9 scale [22] to customize the judgment matrix, thereby aligning it more closely with real-world decision-making contexts. Additionally, the matrix can be dynamically adjusted to meet the personalized needs of users, allowing for real-time modifications based on factors such as changing preferences, seasonal trends, and external conditions. Below is an example of the constructed judgment matrix employed in the analysis:
Next, a consistency test to verify the logical coherence and consistency of the judgment matrix can be performed. This test is essential for ensuring the reliability of the matrix’s outcomes. The process involves calculating the Consistency Ratio (CR) [22], as detailed below:
where the consistency index (CI) is calculated as follows:
is the maximum eigenvalue of the judgment matrix, n is the dimension of the judgment matrix, and the random consistency index RI is the empirical value based on the dimension of the matrix. Through this calculation, the maximum eigenvalue and a further CI and CR are obtained.
The consistency test standard is defined as CR < 0.1 [22]. With CR = 0.09856, this meets the consistency test standard, indicating that the judgment matrix has passed the consistency check. This demonstrates that the matrix exhibits good logical consistency in the subjective judgment process and can be used for subsequent weight calculations.
3.3. The Entropy Weight Method
To objectively allocate weights in a comprehensive evaluation and reasonably reflect the importance of each indicator, this research adopts the Entropy Weight Method (EWM) [24]. The method assesses the amount of information by analyzing the variation in indicator data: the smaller the variation, the less information it contains, and thus the lower the corresponding weight. This approach allows for an objective evaluation of each indicator’s importance. The specific calculation steps of the EWM are as follows:
First, the input weight matrix is normalized. Since the multiple indicator variables used to evaluate the comprehensive scores of cities have different attributes and units, direct comparisons between indicators are challenging. If TOPSIS is applied directly, the results may be biased. Therefore, to eliminate the dimensional differences among indicators, the original data should be normalized. Using the extreme value normalization method, the data for both positive and negative indicators are standardized, yielding the normalized data [25,26]:
where are the maximum and minimum values for each sample of attractions under the first indicator; reflects the level of satisfaction in achieving the goal.
The proportion of the sample under the indicator is calculated as follows:
Then, calculate the information entropy for each indicator and then compute the information utility value. Finally, normalize the results to obtain the entropy weight for each indicator. For the indicator, the formula for calculating information entropy is as follows:
The information utility value is
where is the information utility value of each indicator of the city’s comprehensive score; the larger the information utility value, the more information it corresponds to. Then, the information utility value is normalized. This research can obtain the weight of each indicator:
where is the weight of each indicator for evaluating the city’s composite score.
3.4. Lagrange Multiplier Method for Determining Weights
The subjective weight reflects expert experience and knowledge but may introduce biases, while the objective weight, based on data analysis, offers quantitative advantages yet may overlook complex contextual factors. Therefore, combining subjective and objective weights is essential. This research employs the Lagrange multiplier method to obtain the optimal combined weight by minimizing the information entropy difference between the subjective and objective weights under constraint conditions.
To begin with, the objective function is defined based on information entropy. The aim is to align the comprehensive weight as closely as possible with the subjective weight and the objective weight , thereby finding the optimal weight distribution [25]:
The Lagrange function is constructed as follows:
where the constraint ensures the normalization of the final weights, and is the Lagrange multiplier. To find the optimal solution, take the partial derivatives of the Lagrange function with respect to and , and set them to zero [27,28].
Following these steps, the weights of each indicator in the comprehensive evaluation of city attractions can be determined. The calculation results are shown in Table 3.
Table 3.
Results of the calculation of indicator weights.
3.5. The TOPSIS Model Combined AHP-EWM
To facilitate comprehensive evaluation and optimization under complex conditions, the TOPSIS method constructs both optimal and worst-case solutions for the evaluation problem [29,30]. This method calculates the proximity of each feasible solution to the ideal, providing a comprehensive score for each attraction. The modeling steps of the TOPSIS method are as follows:
First, starting with the standardized matrix , define the optimal solution and the worst solution as follows:
Next, compute the Euclidean distance between each selected tourism city’s comprehensive evaluation indicators and the above-mentioned optimal and worst solutions, as follows:
where is the Euclidean distance between the city and the optimal solution, is the Euclidean distance between the city and the worst solution, and is the weight of each index for evaluating tourism cities [30].
The degree of each city’s closeness to the optimal solution is computed as follows:
Finally, the degree of closeness is normalized, with larger values indicating a higher overall score for the tourist city.
By solving the TOPSIS comprehensive evaluation model, the overall score for each attraction is determined. Table 4 presents the specific scores and ranking results for some attractions, providing an intuitive view of each attraction’s overall performance across different indicators.
Table 4.
Top five attractions based on the overall TOPSIS evaluation.
4. Weighted Sum Planning Models
Since foreign tourists are typically constrained by a 144 h visa policy, their goal is to maximize their overall travel experience within this restricted time frame while minimizing costs. This scenario can be modeled as a weighted sum optimization problem. The model-building process is outlined below.
Numbering all attractions within the region is based on only arriving at the attraction versus not arriving at the attraction. Define as the number of the attraction, with representing whether the attraction is chosen to be visited by the traveler or not and representing whether the attraction is chosen to be visited.
In this study, to calculate the latitude and longitude of any two points on the Earth’s surface, the Haversine formula was used, for example, to compute the geographical distance between two cities [31]:
where and are the latitudes of the two points, and are the longitudes of the two points, and is the radius of the Earth.
To calculate the total travel route, first identify all attractions where , representing the attractions selected for this tour. Next, arrange the attractions in the order of from 1 to , and calculate the path between adjacent points using the Haversine formula to obtain the total distance [32]:
For the selected attractions, the total comprehensive score is calculated as follows:
where represents the score of the attraction, and is a binary variable, with 1 indicating the attraction is selected and 0 indicating it is not selected.
The total attraction cost is used to quantify the travel expenses. For the selected attractions, the total cost is calculated using the following formula:
where represents the cost of the attraction, and is a binary variable, with 1 indicating the attraction is selected and 0 indicating it is not selected.
The objective function should consider visitor preferences, cost-effectiveness, and travel efficiency. Therefore, this research constructs the objective function based on the total comprehensive score, total attraction cost, and total travel distance calculated above, providing a rational decision basis for the path planning problem in practical applications. When constructing the objective function, given that , and have different dimensions, this research applies max–min normalization to incorporate all three into a single-objective function [33,34].
As are obtained, the final objective function can be defined as follows:
where = 1, = 0.5, and = 0.5 represent the weights of the sum of composite scores, the sum of attraction spending, and the sum of paths, respectively.
The constraints are established as follows: For foreign tourists, the total travel time is limited to 144 h. When planning the travel route, both the visiting time for attractions and the travel time between attractions need to be considered. The travel time is calculated based on the assumption that the car travels at a constant speed of 80 km/h. This speed is chosen by referencing typical speed limits for urban and suburban roads, ensuring that the planning results align with real-world traffic conditions. Therefore, the following expression can be obtained:
where is the total time to visit the selected attraction, and is the traveling time.
5. Heuristic Algorithms
Using our TOPSIS evaluation model as a benchmark, this study compares the performance of eight heuristic algorithms. This section provides a comprehensive overview of these algorithms (Section 5.1): the genetic algorithm (GA) leverages crossover and mutation to explore diverse solutions; particle swarm optimization (PSO) achieves a balance between exploration and exploitation for global optimization; the tabu search (TS) focuses on a local search while avoiding revisiting previous solutions; and the hybrid GA-PSO combines GA’s solution diversity with PSO’s optimization efficiency for enhanced performance. The gray wolf optimizer (GWO) mimics wolf pack hierarchy and cooperative hunting mechanisms to balance global exploration with precise local exploitation; ant colony optimization (ACO) utilizes pheromone-guided pathfinding and positive feedback mechanisms for efficient combinatorial optimization in discrete search spaces; and the whale optimization algorithm (WOA) emulates bubble-net feeding behavior and spiral updating strategies to dynamically transition between exploration phases and exploitation refinement. Furthermore, this study introduces a novel variant of PSO, namely PSO with Laplace disturbance (PSO-LD), which incorporates dynamic adaptive Laplace perturbation to enhance global search capabilities and improve stability and convergence speed. Additionally, this section outlines the parameter settings, ensuring consistent basic parameters, such as population size and iterations, across algorithms (Section 5.2), and presents both the quantitative and qualitative results of the solutions (Section 5.3).
5.1. Introduction of Heuristic Algorithms
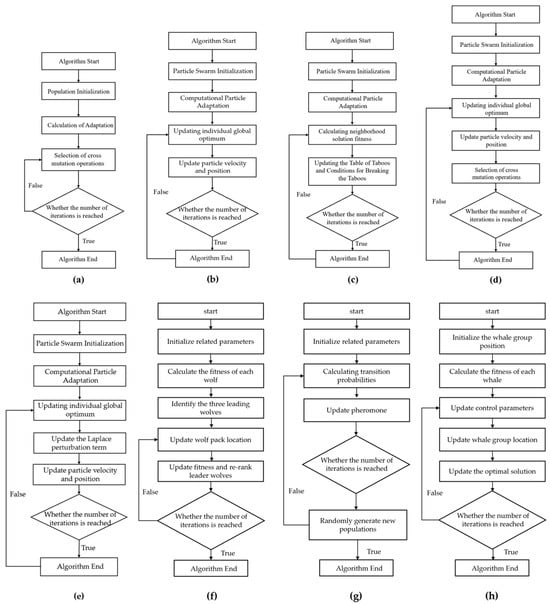
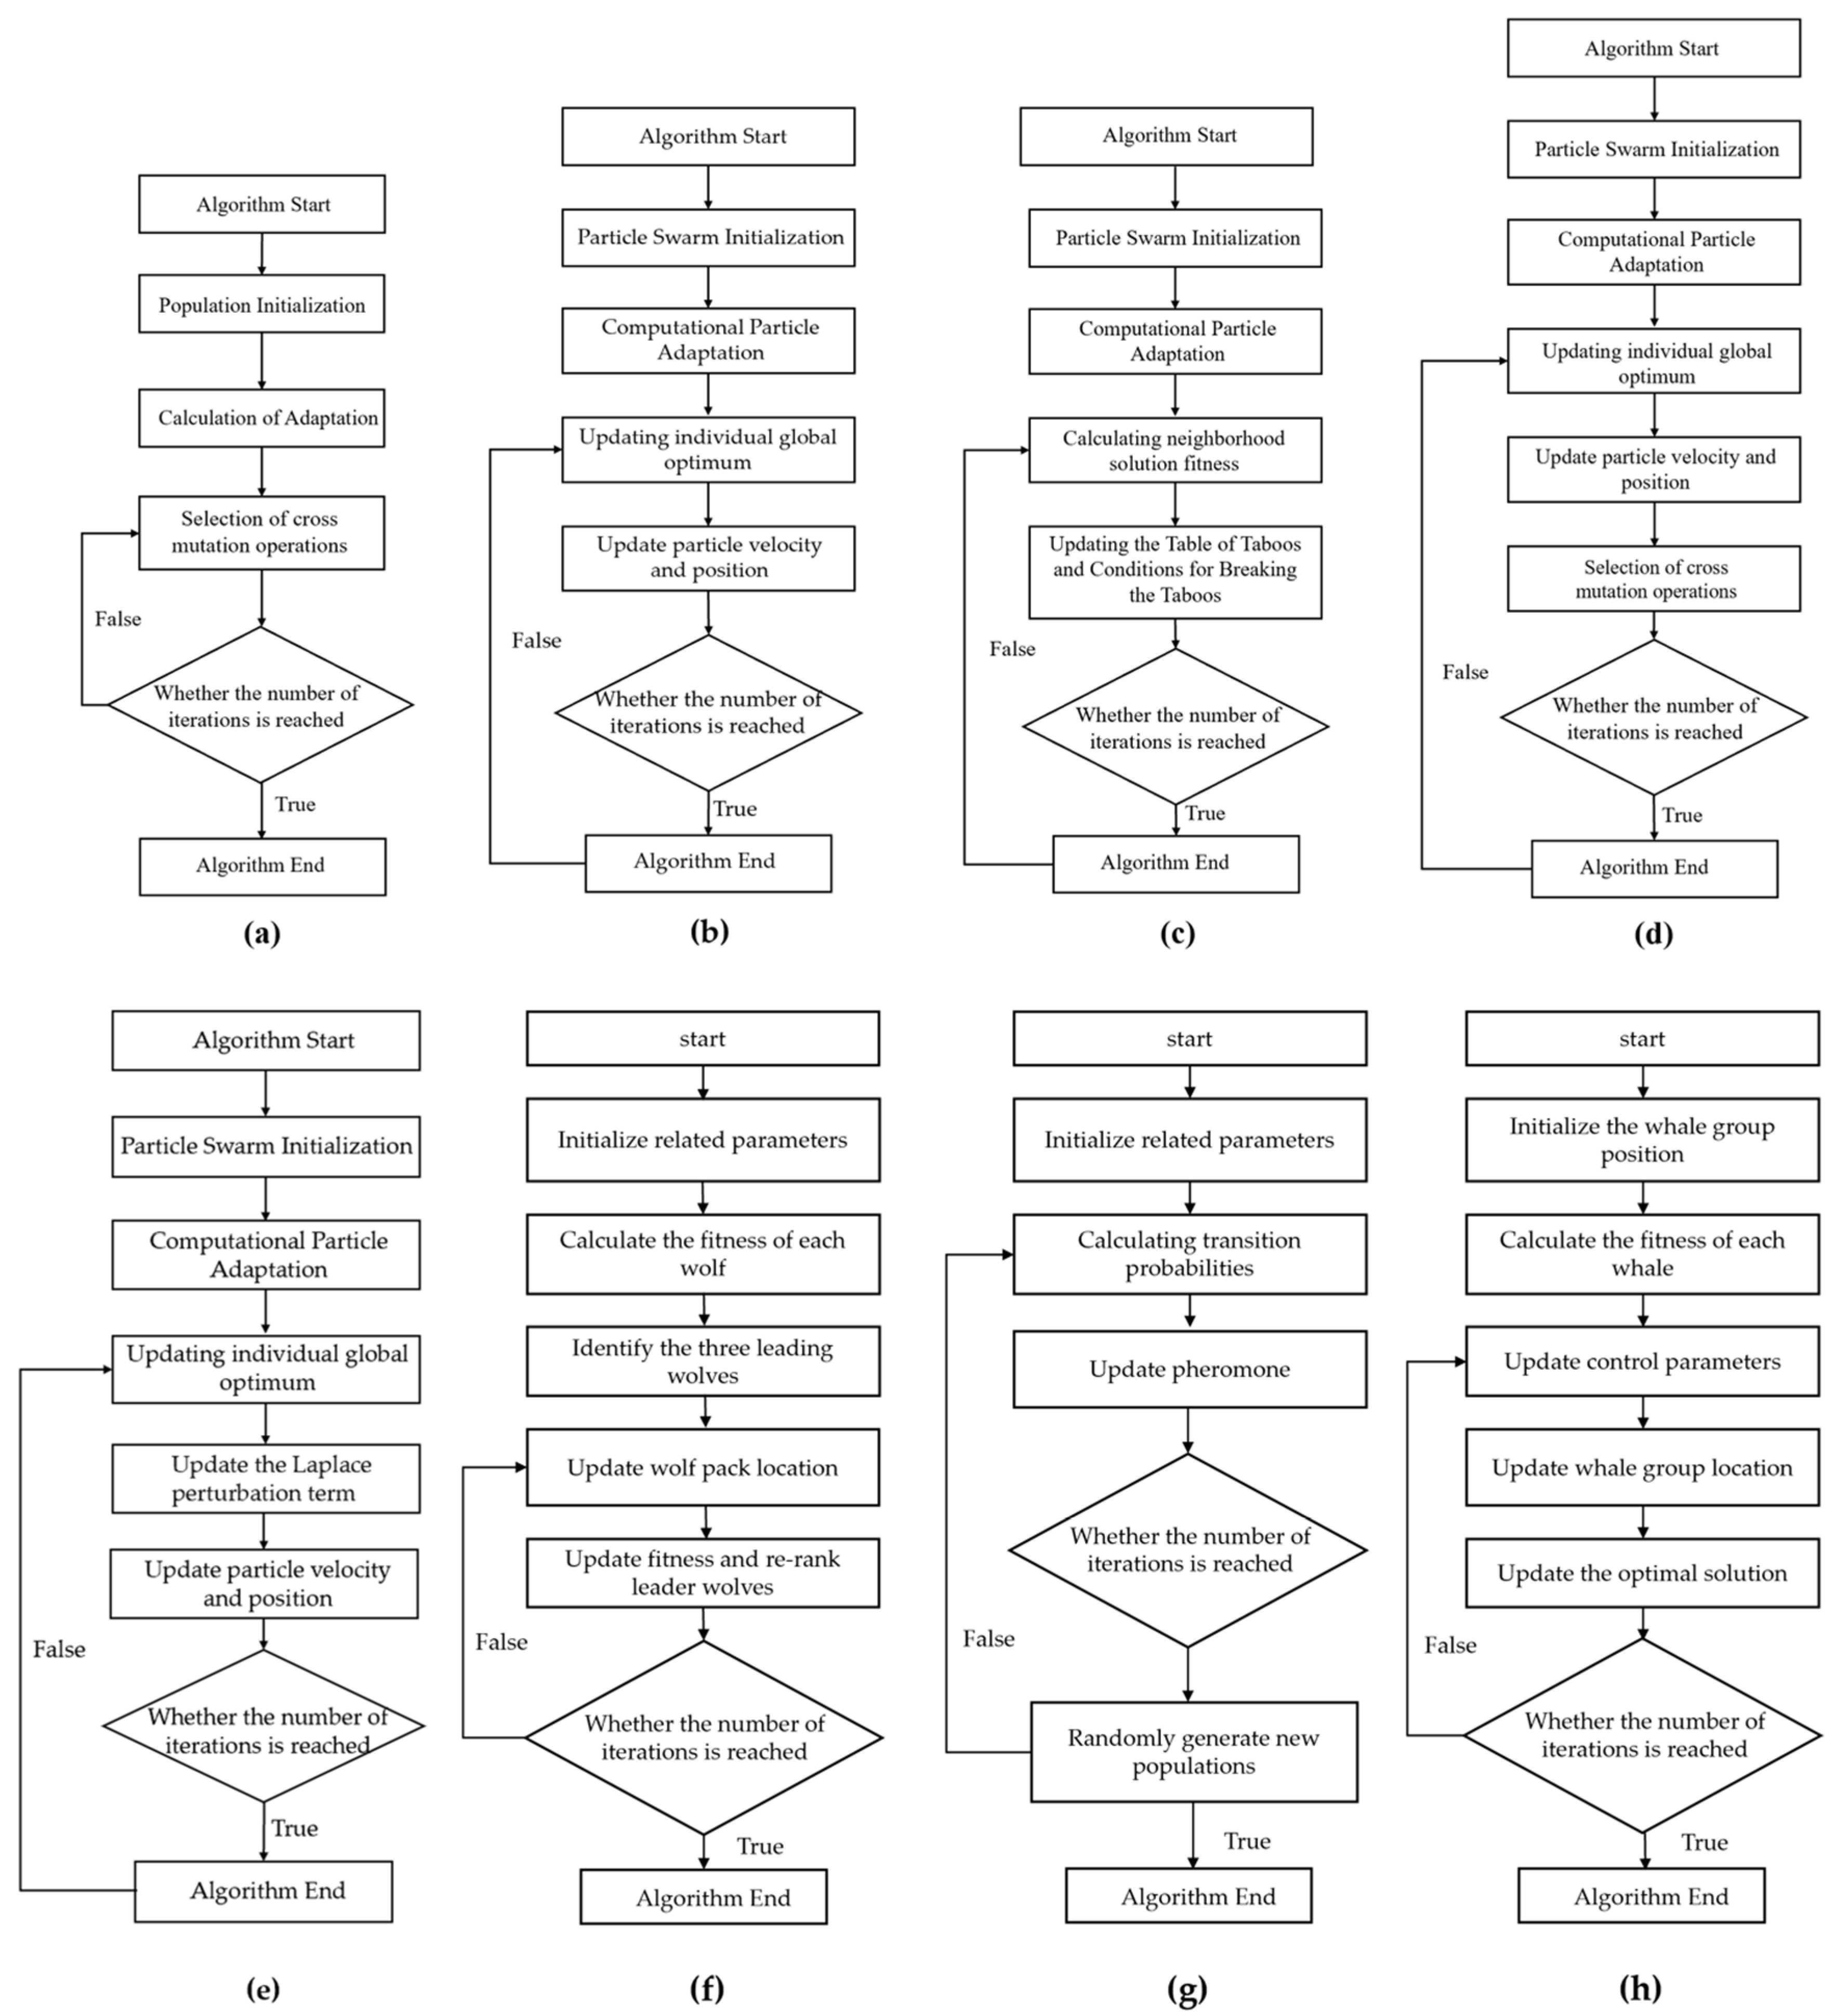
The traditional traversal method exhibits high computational complexity when addressing the constrained TSP, often necessitating substantial time and computational resources [35]. Therefore, in weighted sum optimization tasks, it is crucial to approach the problem from diverse perspectives and employ various strategies. This study utilizes eight heuristic algorithms—GA, PSO, TS, GA-PSO, PSO-LD, GWO, ACO, and WOA—each employing iterative optimization to identify the optimal combination of travel routes, thereby enhancing both the quality and stability of the solution. This study describes eight algorithms and discusses their convergence. Figure 3 illustrates the specific processes of the eight algorithms.
Figure 3.
Flowcharts of the five heuristic algorithms: (a) genetic algorithm; (b) particle swarm optimization algorithm; (c) tabu search algorithm; (d) genetic-particle swarm algorithm; (e) particle swarm Laplace disturbance algorithm; (f) gray wolf optimizer; (g) ant colony optimization; (h) whale optimization algorithm.
(a) GA [36]: This algorithm simulates natural selection by representing route combinations as individuals in a population. It uses crossover and mutation operations to create new routes, with a fitness function evaluating each combination. In the initial stage, the high diversity of the population allows it to explore a wide range of solutions. Through iterative evolution, the population converges toward the optimal solution. Figure 3a shows GA.
(b) PSO [37]: This algorithm models particle movements influenced by personal best and global best positions. Each particle adjusts its position iteratively, enabling the swarm to converge on the optimal route. Figure 3b shows PSO.
(c) TS [38]: This algorithm converges by continuously exploring neighboring solutions while avoiding revisiting previous solutions through a tabu list, thereby avoiding local optima. Through iterations, the solution is refined to approach optimality. Figure 3c shows TS.
(d) GA-PSO [39]: This algorithm combines GA’s genetic diversity with PSO’s global search ability. It converges more efficiently under complex constraints. PSO guides the search direction, while GA’s crossover and mutation maintain diversity, leading to robust optimization. Figure 3d shows GA-PSO.
(e) PSO-LD: This algorithm extends particle swarm optimization (PSO) by integrating a dynamic Laplace perturbation term. PSO-LD enhances global search capabilities and escapes local optima more effectively, which also affects its convergence. The Laplace perturbation, characterized by its sharp peak and heavy tails, introduces variability that aids in both local refinement and global exploration. The scale parameter adjusts dynamically, balancing exploration and exploitation across iterations. Figure 3e depicts PSO-LD.
(f) GWO [40]: This algorithm mirrors the hierarchy and hunting strategies of wolf packs. Wolves are characterized by their decision-making and hunting behaviors. By simulating the hunting behavior of gray wolves, including tracking, encircling, and attacking prey, GWO balances exploration and exploitation. The algorithm updates the positions of the wolves iteratively to converge toward the optimal solution. Figure 3f shows GWO.
(g) ACO [2]: This algorithm imitates the foraging behavior of ants, particularly their use of pheromone trails. Through iterative updates of pheromone trails and path selection, the algorithm efficiently explores the search space and converges on optimal or near-optimal solutions. Figure 3g shows ACO.
(h) WOA [41]: This algorithm is a simple, robust, and swarm-based stochastic optimization algorithm. The population-based WOA has the ability to avoid local optima and achieve a global optimal solution. These advantages make WOA an appropriate algorithm for solving different constrained or unconstrained optimization problems for practical applications without structural reformation in the algorithm. Figure 3h shows the WOA.
5.2. Parameter Settings
In this study, to ensure a fair comparison, the performances of GA, PSO, TS, GA-PSO, PSO-LD, GWO, ACO, and WOA were evaluated using identical parameter settings, including population size and the number of iterations. These settings are listed in Table 5.
Table 5.
Parameter settings for the heuristic algorithms.
5.3. Results of the Heuristic Algorithm Solutions
5.3.1. Quantitative Results
Performance Enhancement of Heuristic Algorithms with the Lagrange Multiplier
Through comparative analysis of the experimental results, the total score [41] metric was employed to measure the solution quality of different heuristic algorithms, where a higher total score indicates superior solution quality in a given region. Additionally, the attraction score reflects the number and quality of selected attractions based on their star ratings. Table 6 shows, under the same baseline parameter settings, the solution quality of PSO, GA, TS, GA-PSO, GWO, WOA, and ACO across all 14 regions.
Table 6.
Table of heuristic algorithm solution results without the Lagrange multiplier.
To validate the impact of the Lagrange multiplier method on the solution quality in the comprehensive evaluation model, this study independently ran 30 experiments for each of the 14 regions, both with and without the Lagrange multiplier method. The results allow us to assess the effectiveness of introducing the Lagrange multiplier method in improving solution quality. According to Table 6, the average solution quality of the seven algorithms—GA, PSO, TS, GA-PSO, GWO, WOA, and ACO—is 0.11, 0.22, 0.10, 0.22, 0.24, 0.17, and 0.12, respectively, with an overall average solution quality of 0.16. The GWO algorithm demonstrates the best performance. In Table 7, the average solution quality for GA, PSO, TS, GA-PSO, GWO, WOA, and ACO is 0.32, 0.52, 0.28, 0.51, 0.31, 0.26, and 0.18, respectively, with an overall average solution quality of 0.34. The PSO algorithm achieves the best solution quality. The experimental results indicate that the introduction of the Lagrange multiplier method improves the solution quality of all seven heuristic algorithms, thereby confirming the effectiveness of the Lagrange multiplier method.
Table 7.
Heuristic algorithm solution results with the Lagrange multiplier.
Introduction and Superiority of the PSO-LD Algorithm
As evidenced in Table 6, PSO achieves the highest average total score (0.52) with Lagrange multipliers, demonstrating its superior ability to balance solution quality under complex constraints. Yet struggles persist in adapting to dynamic constraints and regional variations (e.g., attraction density disparities). To overcome these limitations, this paper proposes an enhanced variant: particle swarm optimization with Lagrange dynamics (PSO-LD), incorporating dynamic parameter adaptation and constraint enhancement mechanisms. The following section details its design and empirically validates its performance advantages.
The Laplace distribution is a continuous probability distribution with a sharp peak and heavy-tailed characteristics. It is suitable for modeling noise with sudden changes or high uncertainty. Compared to traditional disturbances, its peakedness ensures a higher concentration around the center, increasing the probability of small-range perturbations and aiding local optimization. In addition, the slowly decaying tail allows larger perturbations, helping escape local optima and enhancing the global search capability. Its probability density function is defined as follows:
where μ is the mean of the distribution, and b is the scale parameter. The larger the scale parameter is, the greater the perturbation generated by the Laplacian perturbation term.
Based on the standard particle swarm optimization (PSO) velocity update formula, an additional Laplacian perturbation term is incorporated:
where the perturbation term follows a Laplace distribution with a mean of 0 and a scale parameter of b:
The scale parameter is initialized with an exponential decay strategy and dynamically adjusted according to the number of iterations:
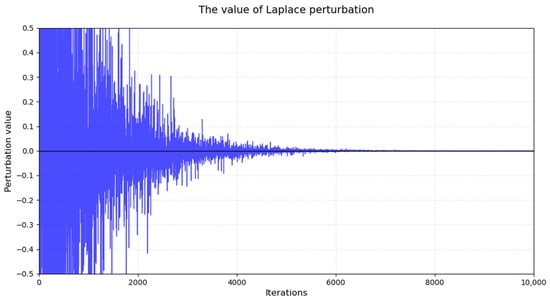
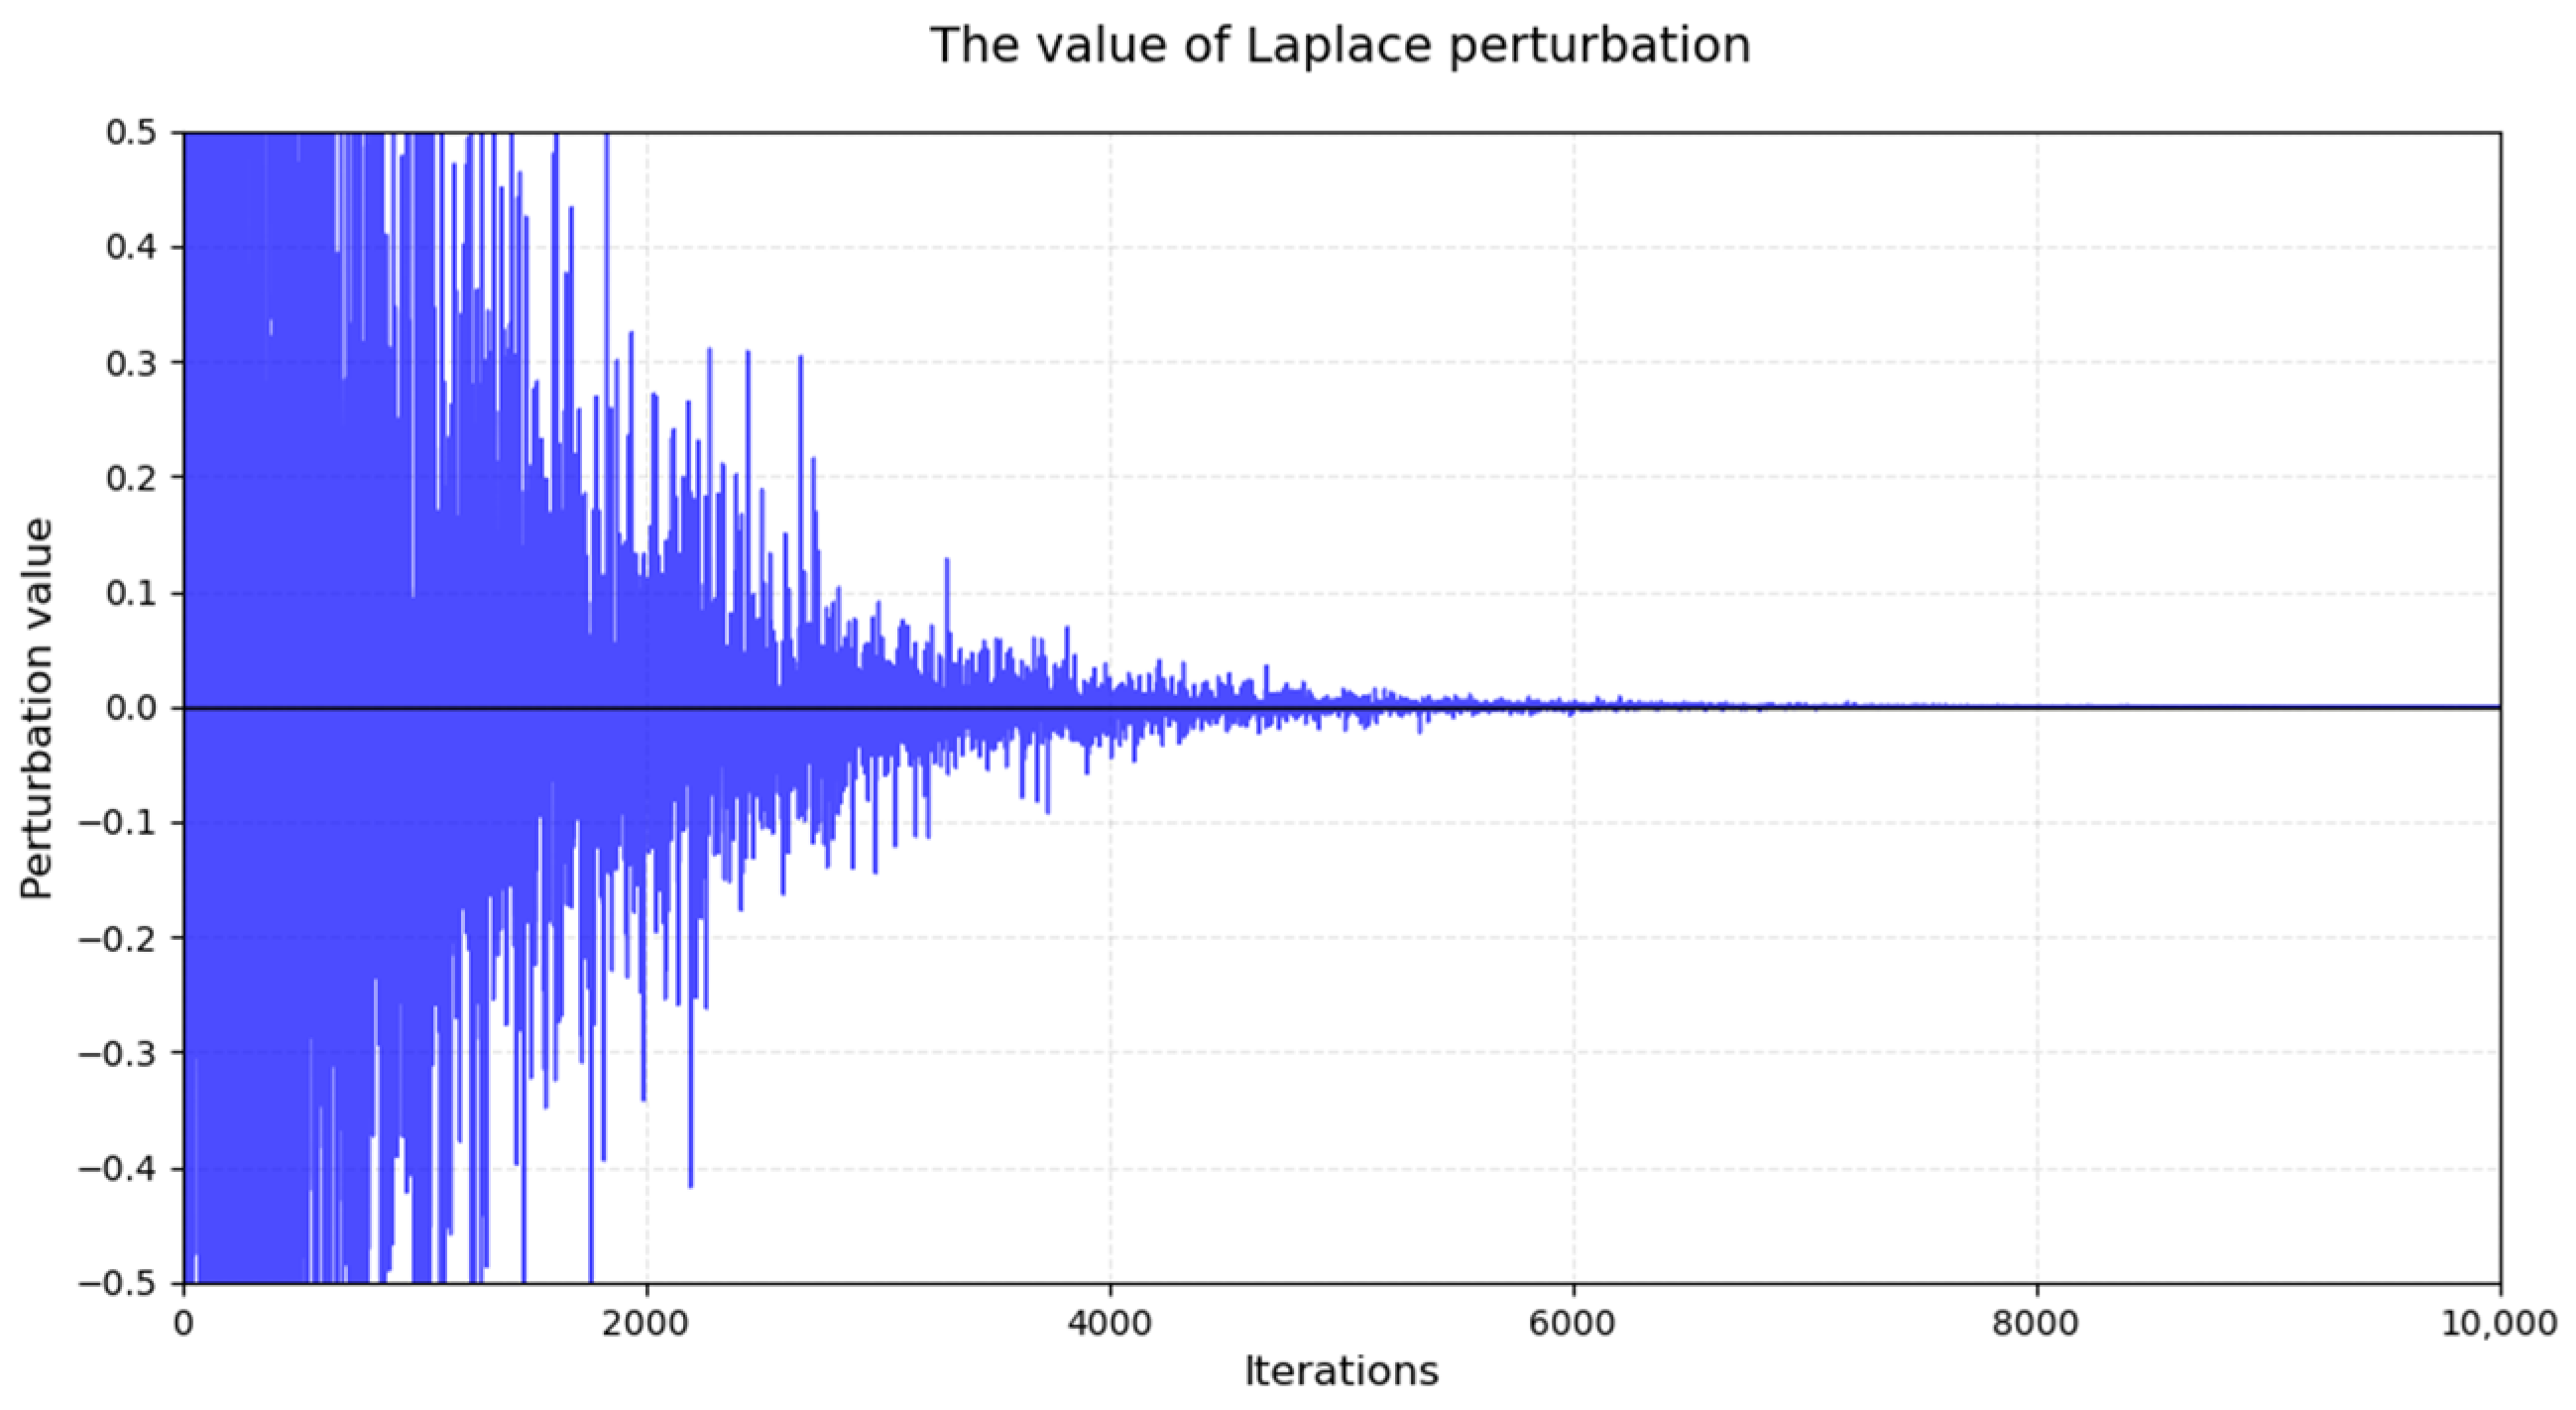
where denotes the initial scale parameter, which is set to 5 to ensure sufficiently large initial perturbations. The decay parameter α is configured as 5 to maintain a reasonable descent rate for the scale parameter. Here, t and represent the current iteration number and maximum iteration count, respectively. The Laplace perturbation adaptive adjustment mechanism functions as follows: During the initial phase, it maintains substantial perturbations to enhance particle randomness, thereby facilitating global exploration while progressively reducing perturbation magnitudes in the middle and later stages to stabilize particle movements and strengthen local search capabilities.
This study recorded the Laplace perturbation terms generated in each iteration and plotted corresponding line, which is shown in Figure 4. The visual representation clearly demonstrates that the perturbation terms maintain relatively large magnitudes during the early search phase while remaining confined within a small fluctuation range during the latter search stages.
Figure 4.
The value of Laplace perturbation.
Further comparative experiments can be conducted to comprehensively and quantitatively validate the superiority of the PSO-LD algorithm in terms of solution quality, convergence rate, and stability.
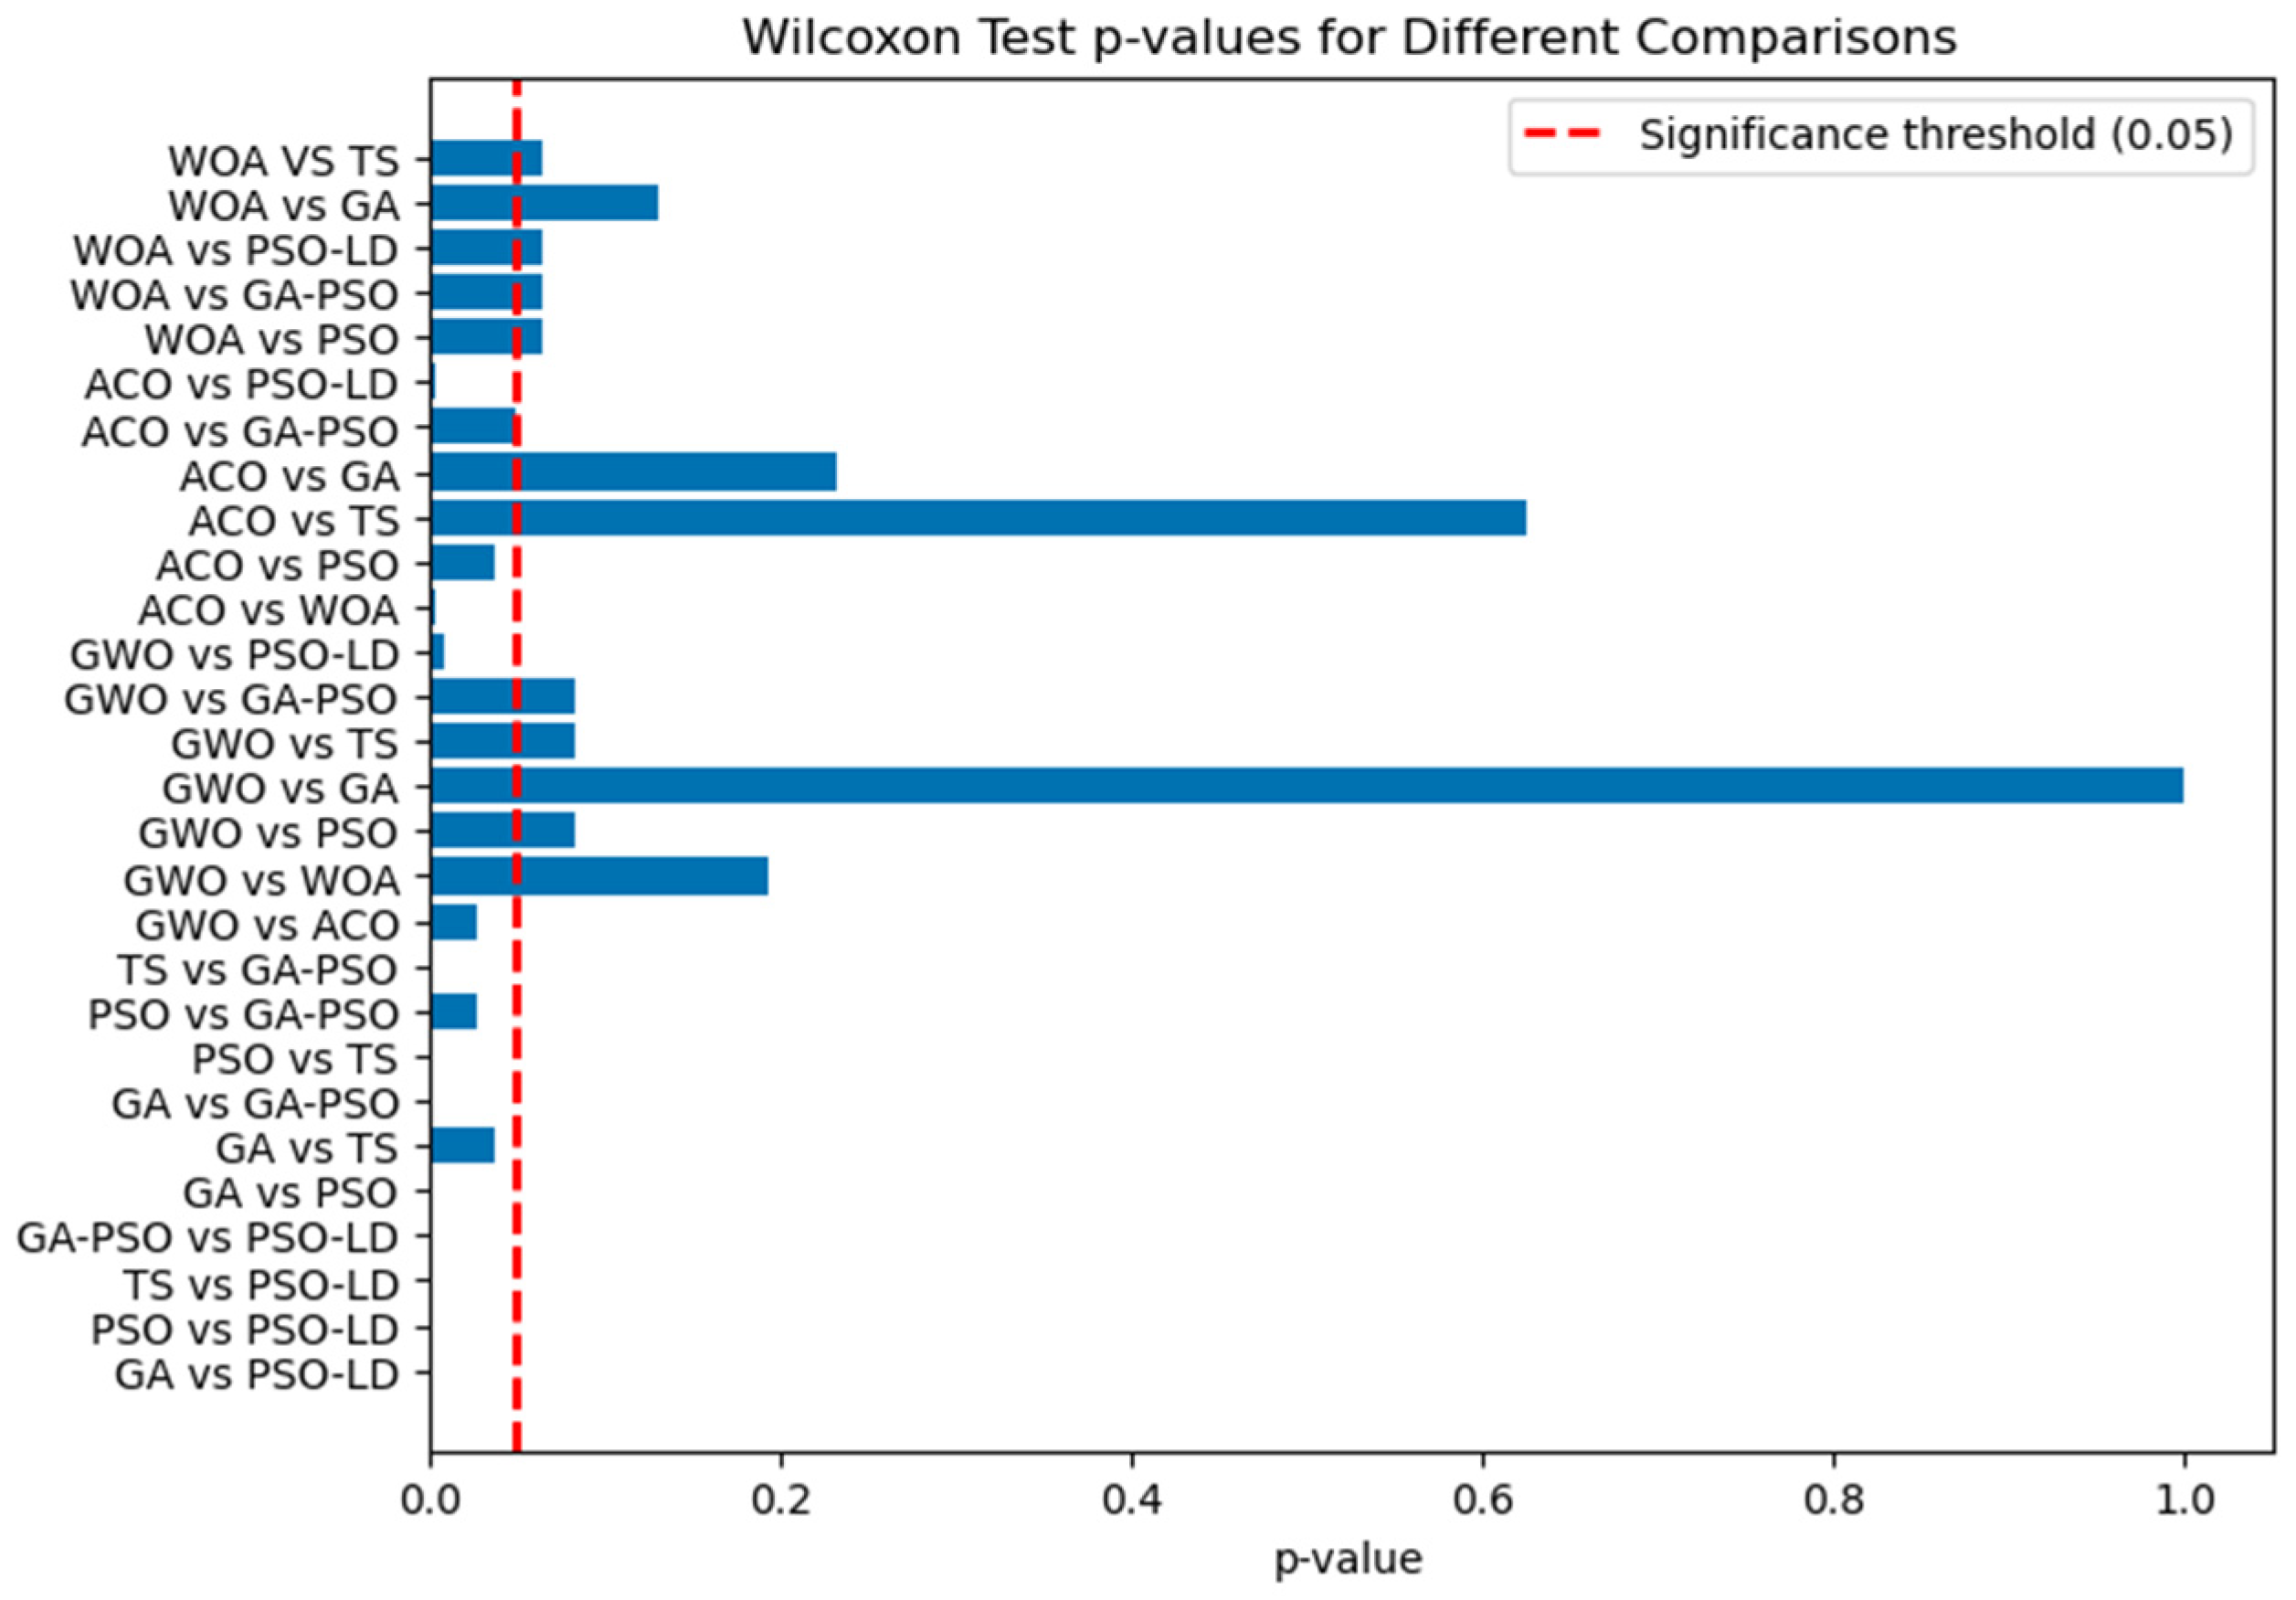
To systematically assess the differences in performance metrics among the algorithms, this study independently ran 30 experiments for each of the 10 regions and calculated the mean results for each group, as shown in Table 8. This paper applied the Wilcoxon signed-rank test to perform statistical significance analysis for each pair of the seven algorithms. A p-value less than 0.05 indicates a significant difference between the two algorithms; otherwise, no significant difference is observed. The p-values are presented in Table 8, with the results visualized in Figure 5. The findings show that all p-values are less than 0.05, indicating significant differences between each pair of the eight algorithms.
Table 8.
Wilcoxon test comparisons.
Figure 5.
Wilcoxon test p-value heatmap of GA, PSO, TS, GA-PSO, PSO-LD, GWO, ACO, and WOA.
The total scores of GWO, ACO, and WOA are consistently lower than those of GA, PSO, GA-PSO, and PSO-LD. This performance gap may stem from the severe convergence of individuals in the later stages of the GWO, ACO, and WOA algorithms, which reduces population diversity and diminishes their optimization capability. Although GWO, ACO, and WOA achieve higher total scores than TS, the Wilcoxon test reveals no statistically significant difference between their results and those of GA, PSO, GA-PSO, TS, and PSO-LD. This suggests that GWO, ACO, and WOA exhibit similar characteristics to these algorithms in certain aspects, indicating that further parameter tuning or structural modifications may be necessary to enhance their effectiveness in solving the TTDP problem. Given the limited existing research on this issue, this study focuses on conducting a more in-depth analysis of four widely used algorithms, GA, PSO, TS, and GA-PSO, along with our proposed innovative algorithm PSO-LD.
PSO-LD outperformed all the baseline algorithms, achieving the highest total score (0.573 vs. PSO’s 0.516 and GA-PSO’s 0.509) and attraction score (1.518 vs. PSO’s 1.489) across regions (Table 6), with statistical significance (p < 0.002 for all comparisons). Its superiority stems from the integration of dynamic parameter adaptation and Lagrange multiplier-driven constraints, enabling robust global exploration while maintaining precise local refinement. Unlike PSO, which balances resource efficiency (total price: CNY 4256) and runtime (142.0 s), PSO-LD prioritizes the solution quality despite higher resource costs (price: CNY 4694; distance: 4605). GA-PSO, while consistent due to its hybrid GA-PSO structure, lagged behind PSO-LD in both the total score and computational efficiency (runtime: 256.5 s vs. 143.2 s), reflecting the limitations of static hybrid mechanisms in dynamic environments. GA excelled in speed (139.6 s) and low resource use (price: CNY 3588) but delivered subpar optimization quality (total score: 0.322; p < 0.05). TS remained the weakest performer (total score: 0.276; runtime: 1084.5 s), highlighting its incompatibility with modern multi-objective tasks.
PSO-LD is optimal for quality-critical scenarios requiring adaptability to dynamic constraints (e.g., tourism planning with spatial heterogeneity). PSO is ideal for balanced quality-speed needs, offering an efficient global search with moderate resource use. GA is suitable for time-sensitive tasks with relaxed quality thresholds. TS should be avoided due to its prohibitive slowness and ineffectiveness compared to modern alternatives. This analysis underscores PSO-LD’s unmatched optimization capability, positioning it as the premier choice for high-stakes applications demanding precision and adaptability.
The statistical significance analysis using the Wilcoxon signed-rank test further confirms the performance differences among the algorithms. All pairwise comparisons involving PSO-LD showed p-values of less than 0.002, indicating highly significant differences. Similarly, significant differences were observed between other algorithm pairs, with p-values consistently below 0.05. This statistical evidence reinforces the reliability of the performance rankings and the validity of the trade-off analysis presented.
5.3.2. Qualitative Results
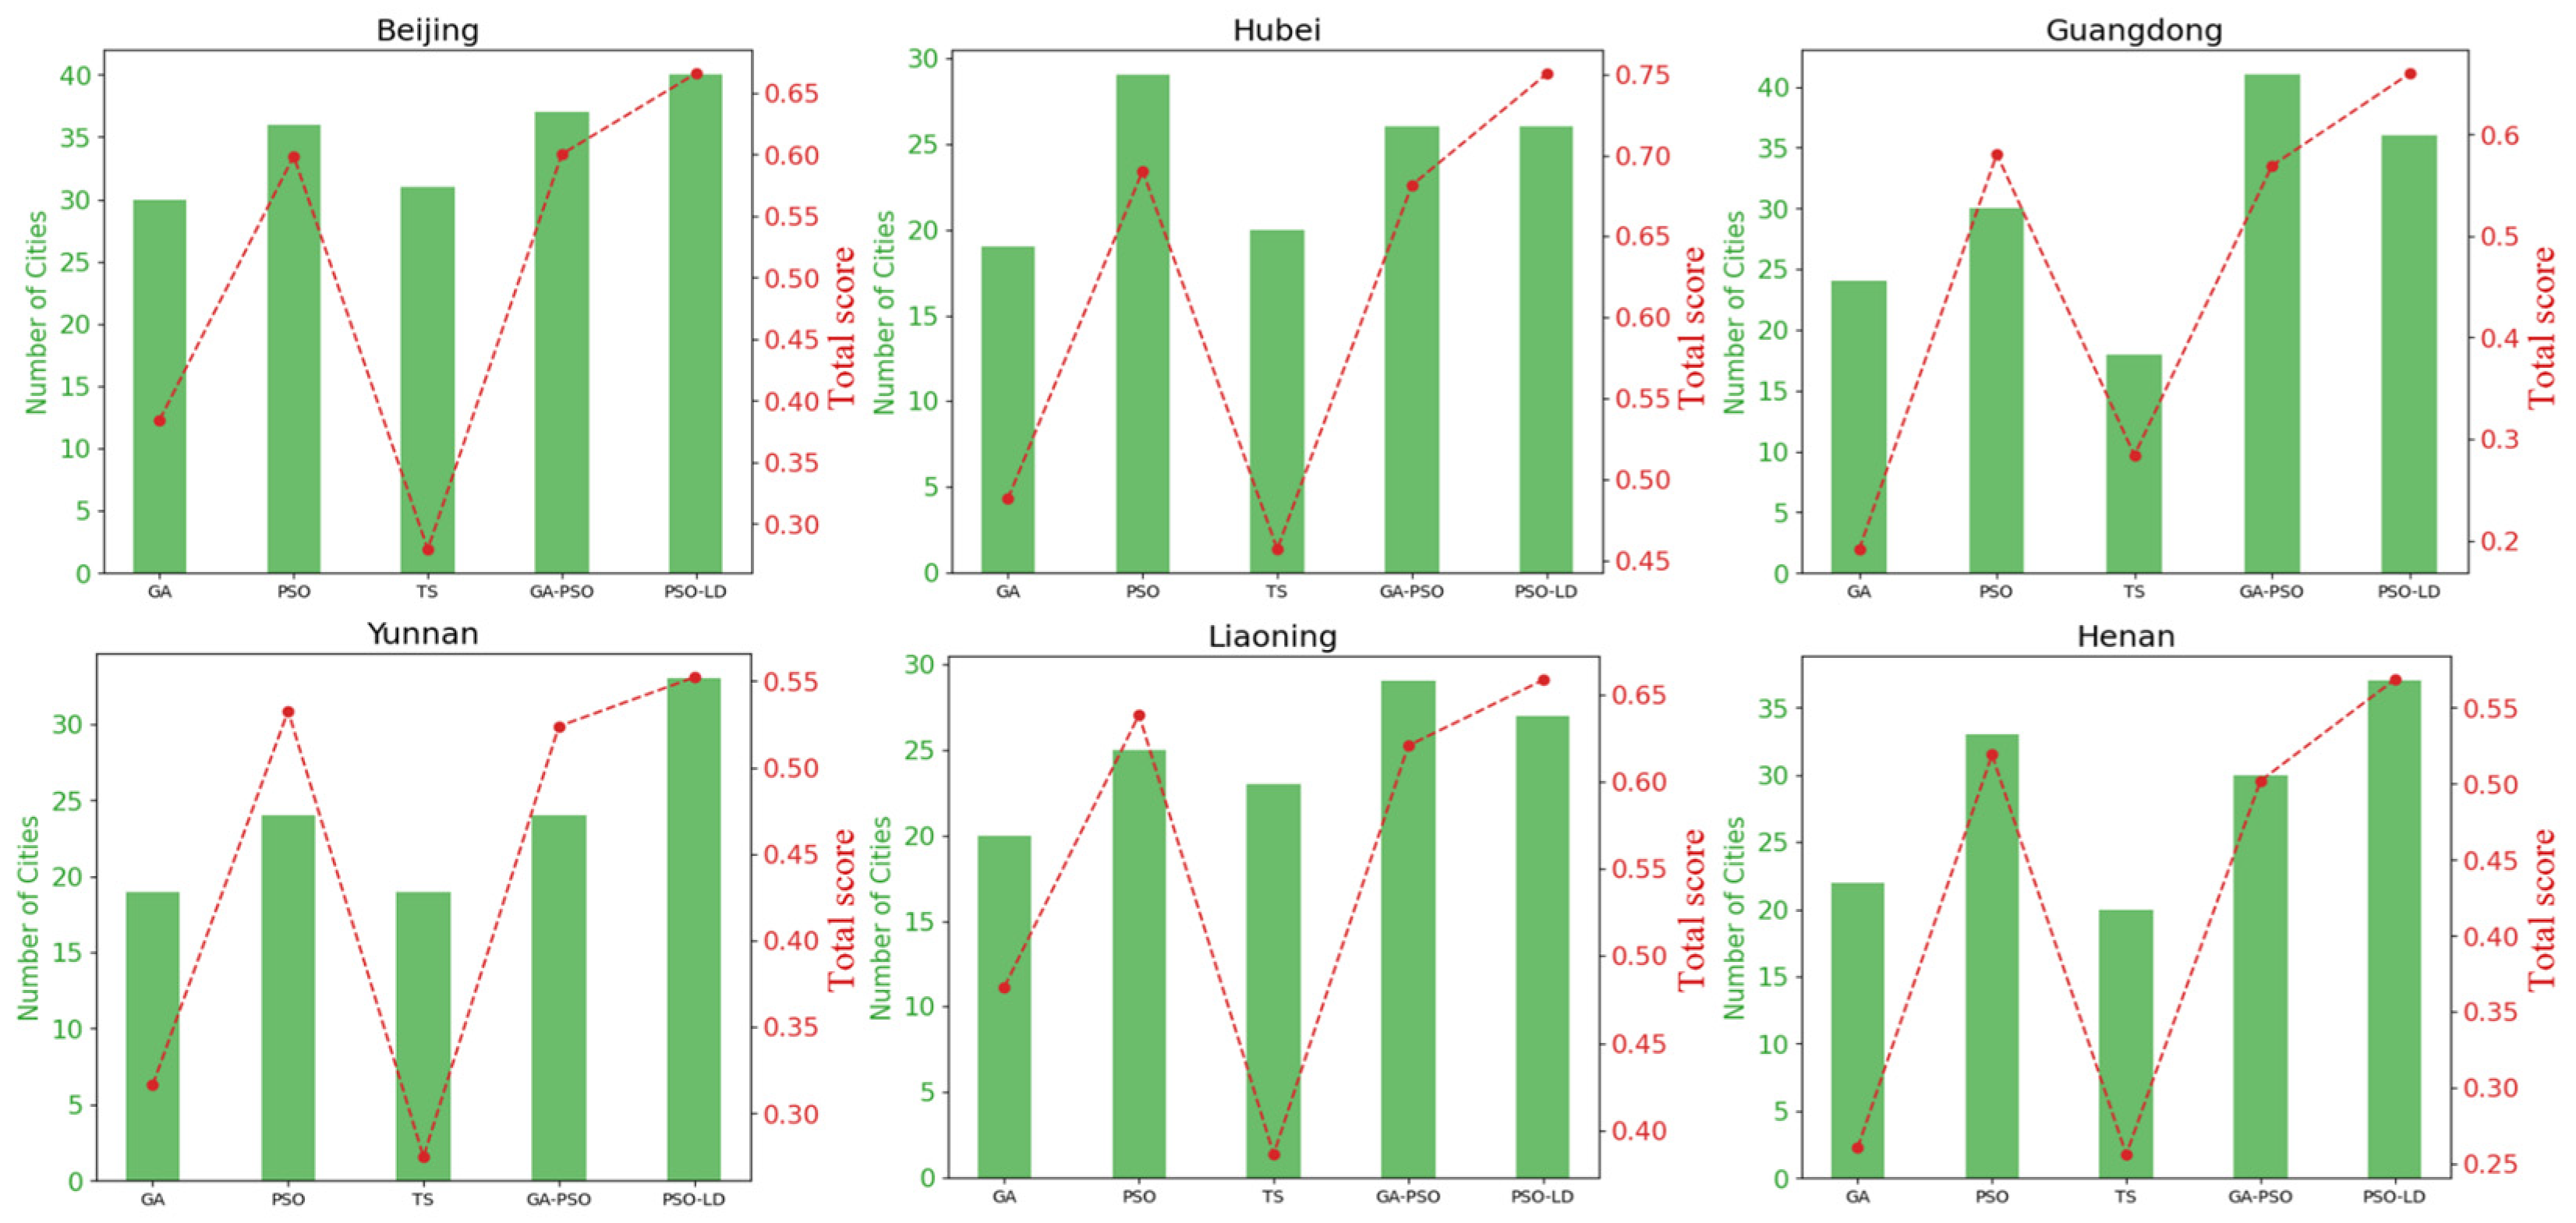
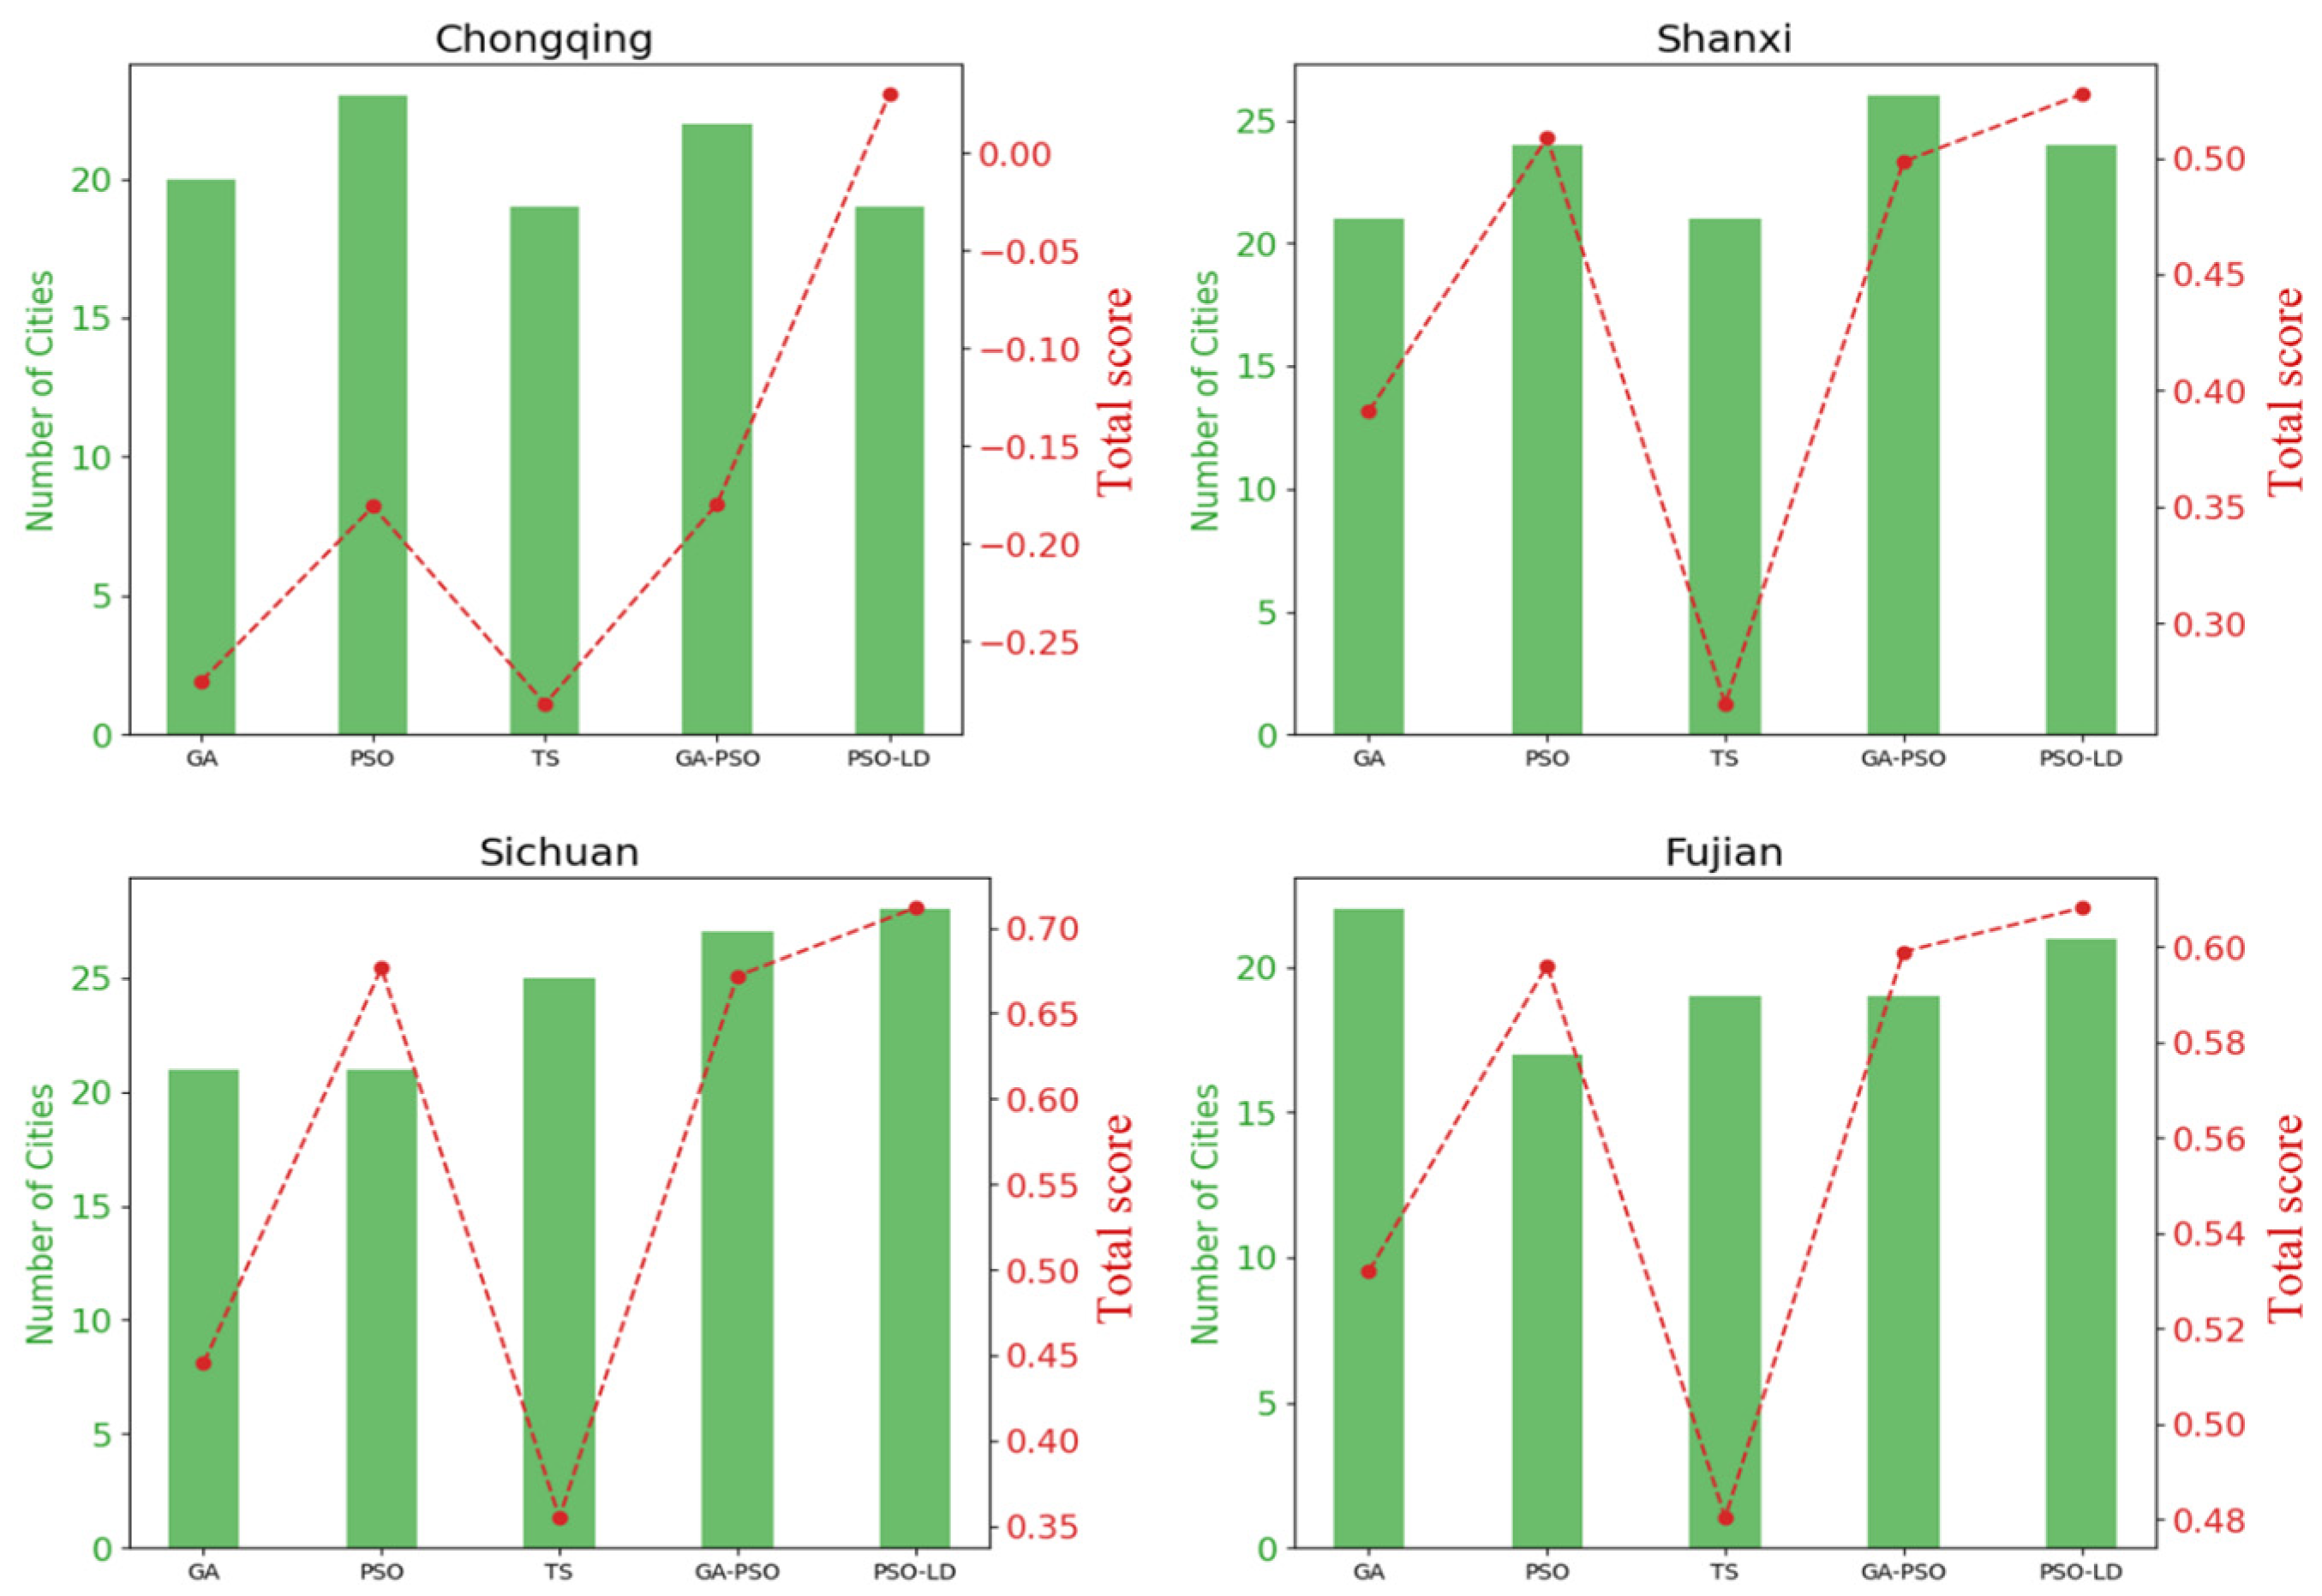
The research analyzed the planned routes generated by GA, PSO, TS, GA-PSO, and PSO-LD across four regions. The results showed that GA-PSO and PSO-LD generally selected more tourist spots and achieved higher total scores in most regions. In Chongqing and Sichuan, GA-PSO performed the best in terms of the number of spots selected. In Shanxi, GA-PSO and PSO-LD had similar high scores. In Fujian, PSO-LD outperformed others in both the number of spots and total score. TS and GA usually selected fewer spots and had lower scores. These results highlight the performance differences among the algorithms in specific problem instances.
In Figure 6, histograms for only four regions—Chongqing, Shaanxi, Sichuan, and Fujian—are displayed, with visualizations for the remaining six regions included in Appendix A.
Figure 6.
Histogram of selected attraction counts using different heuristic algorithms.
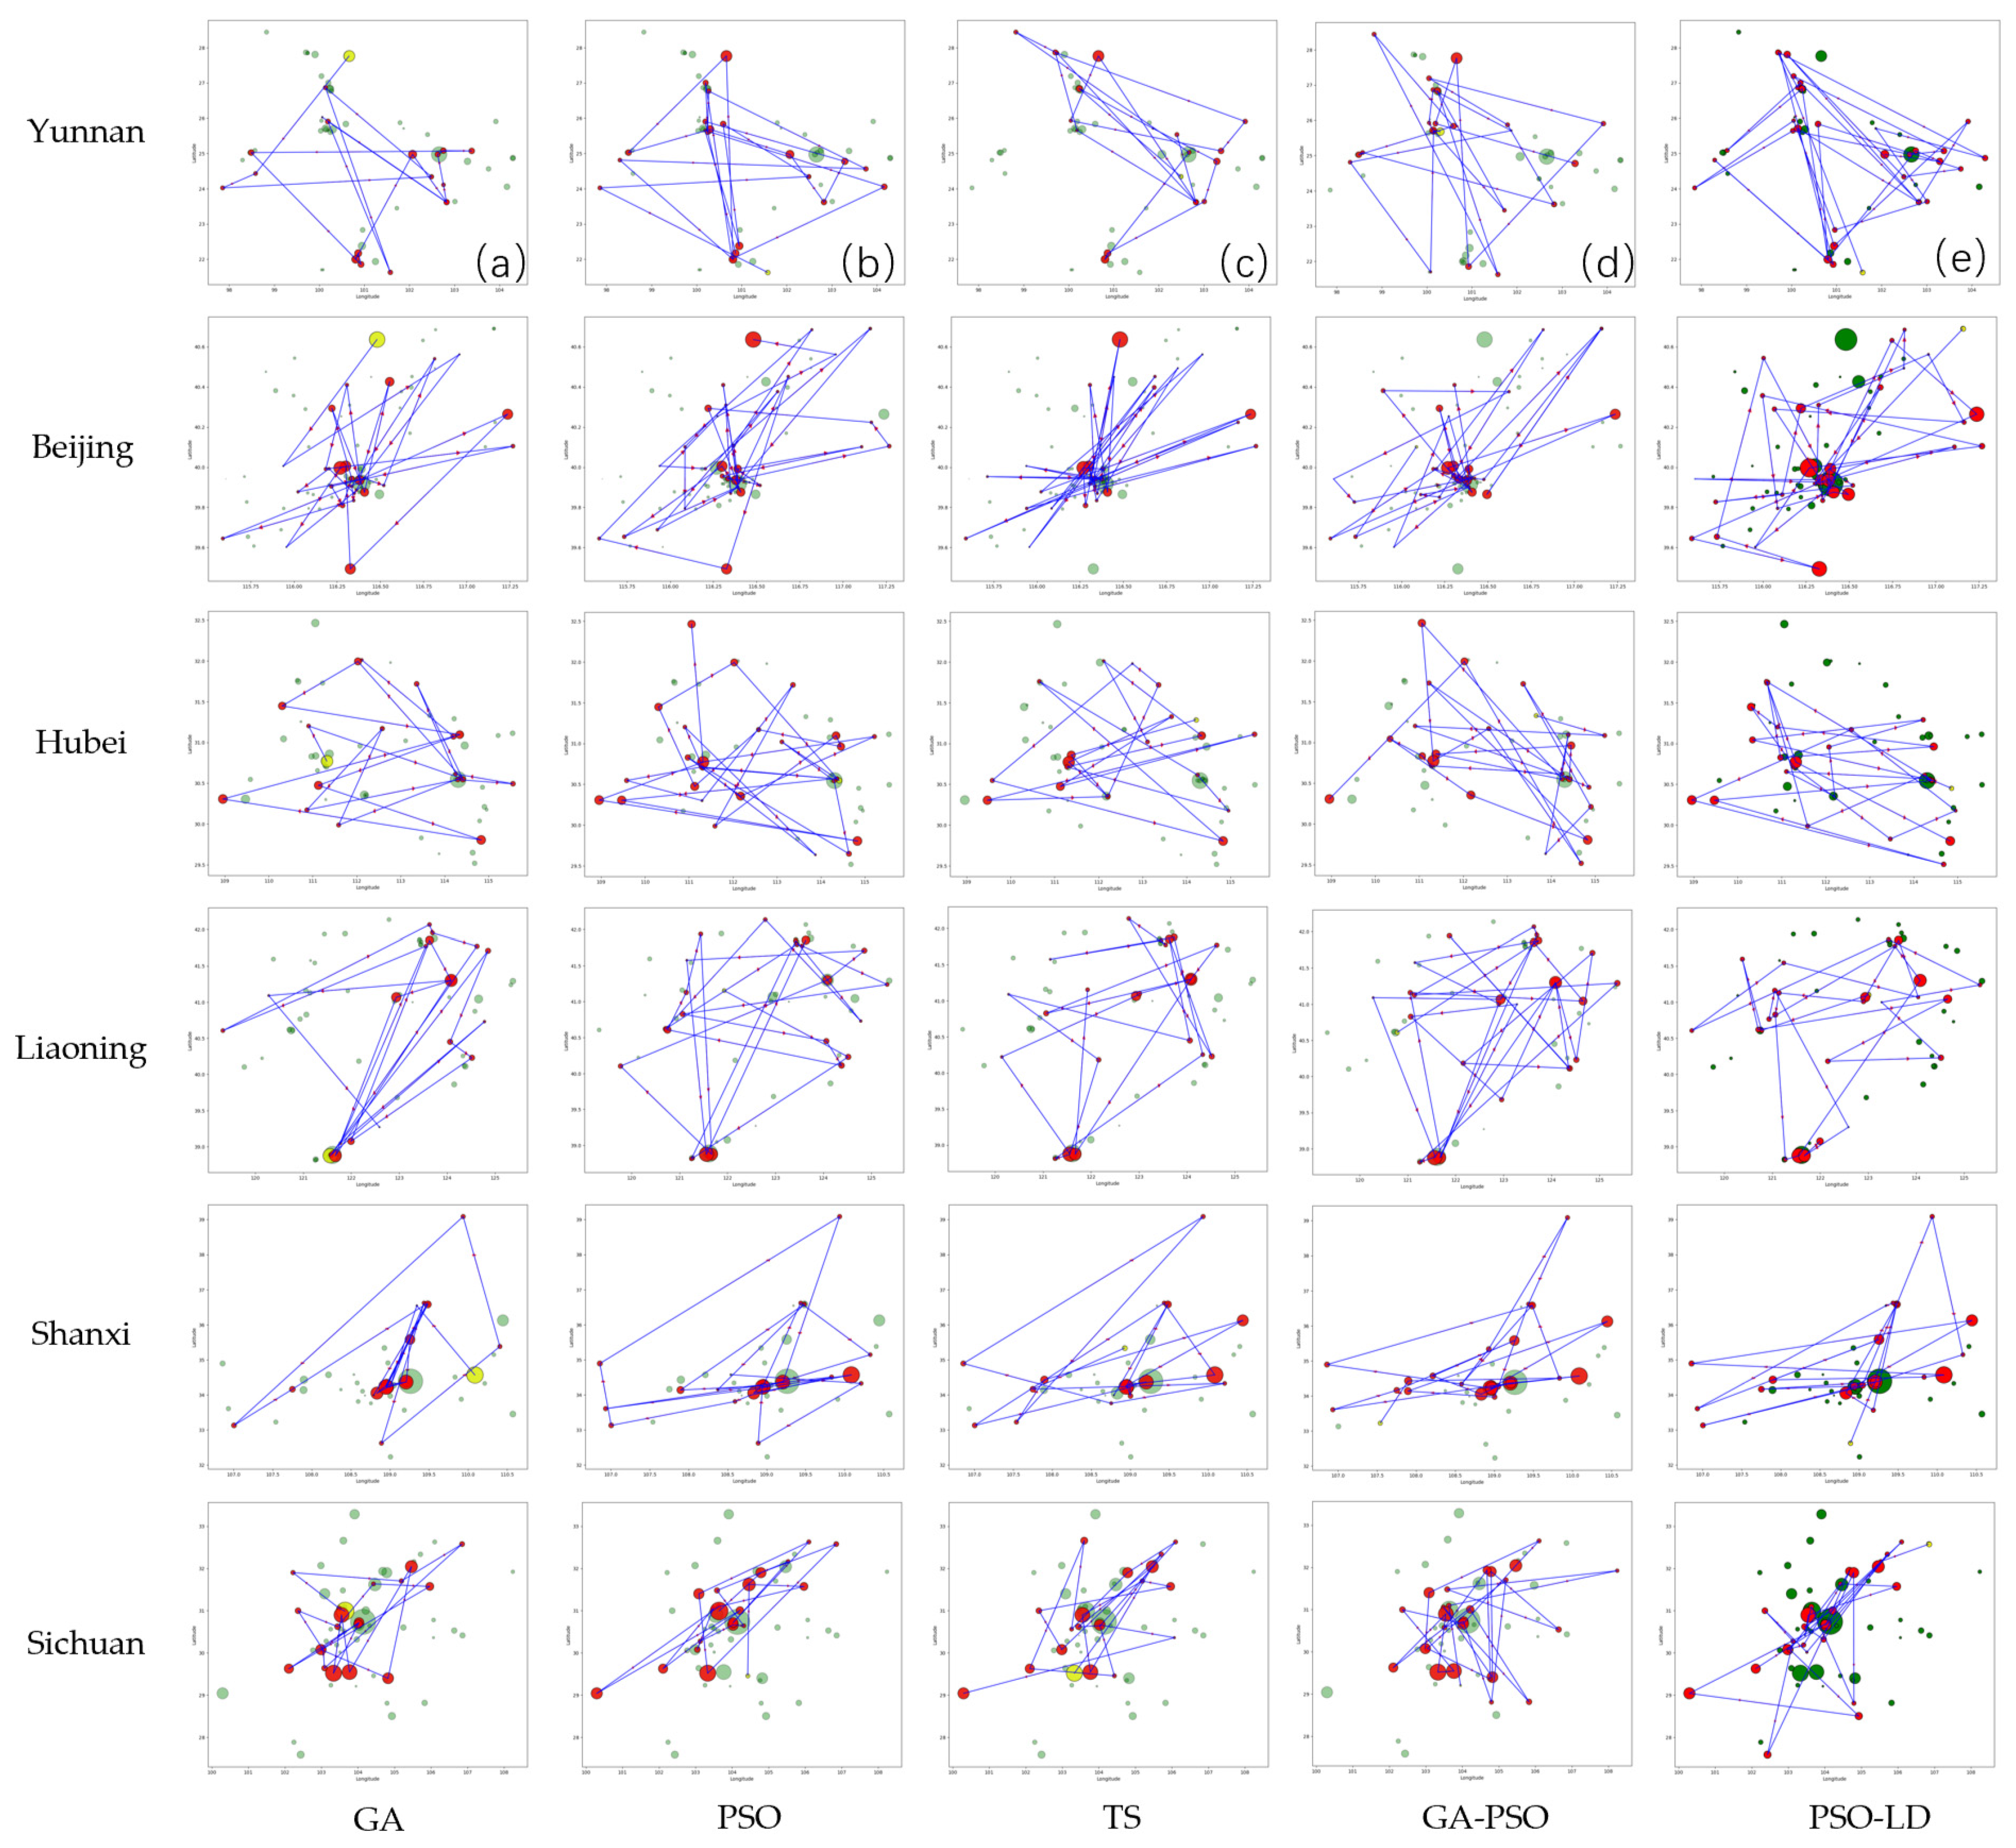
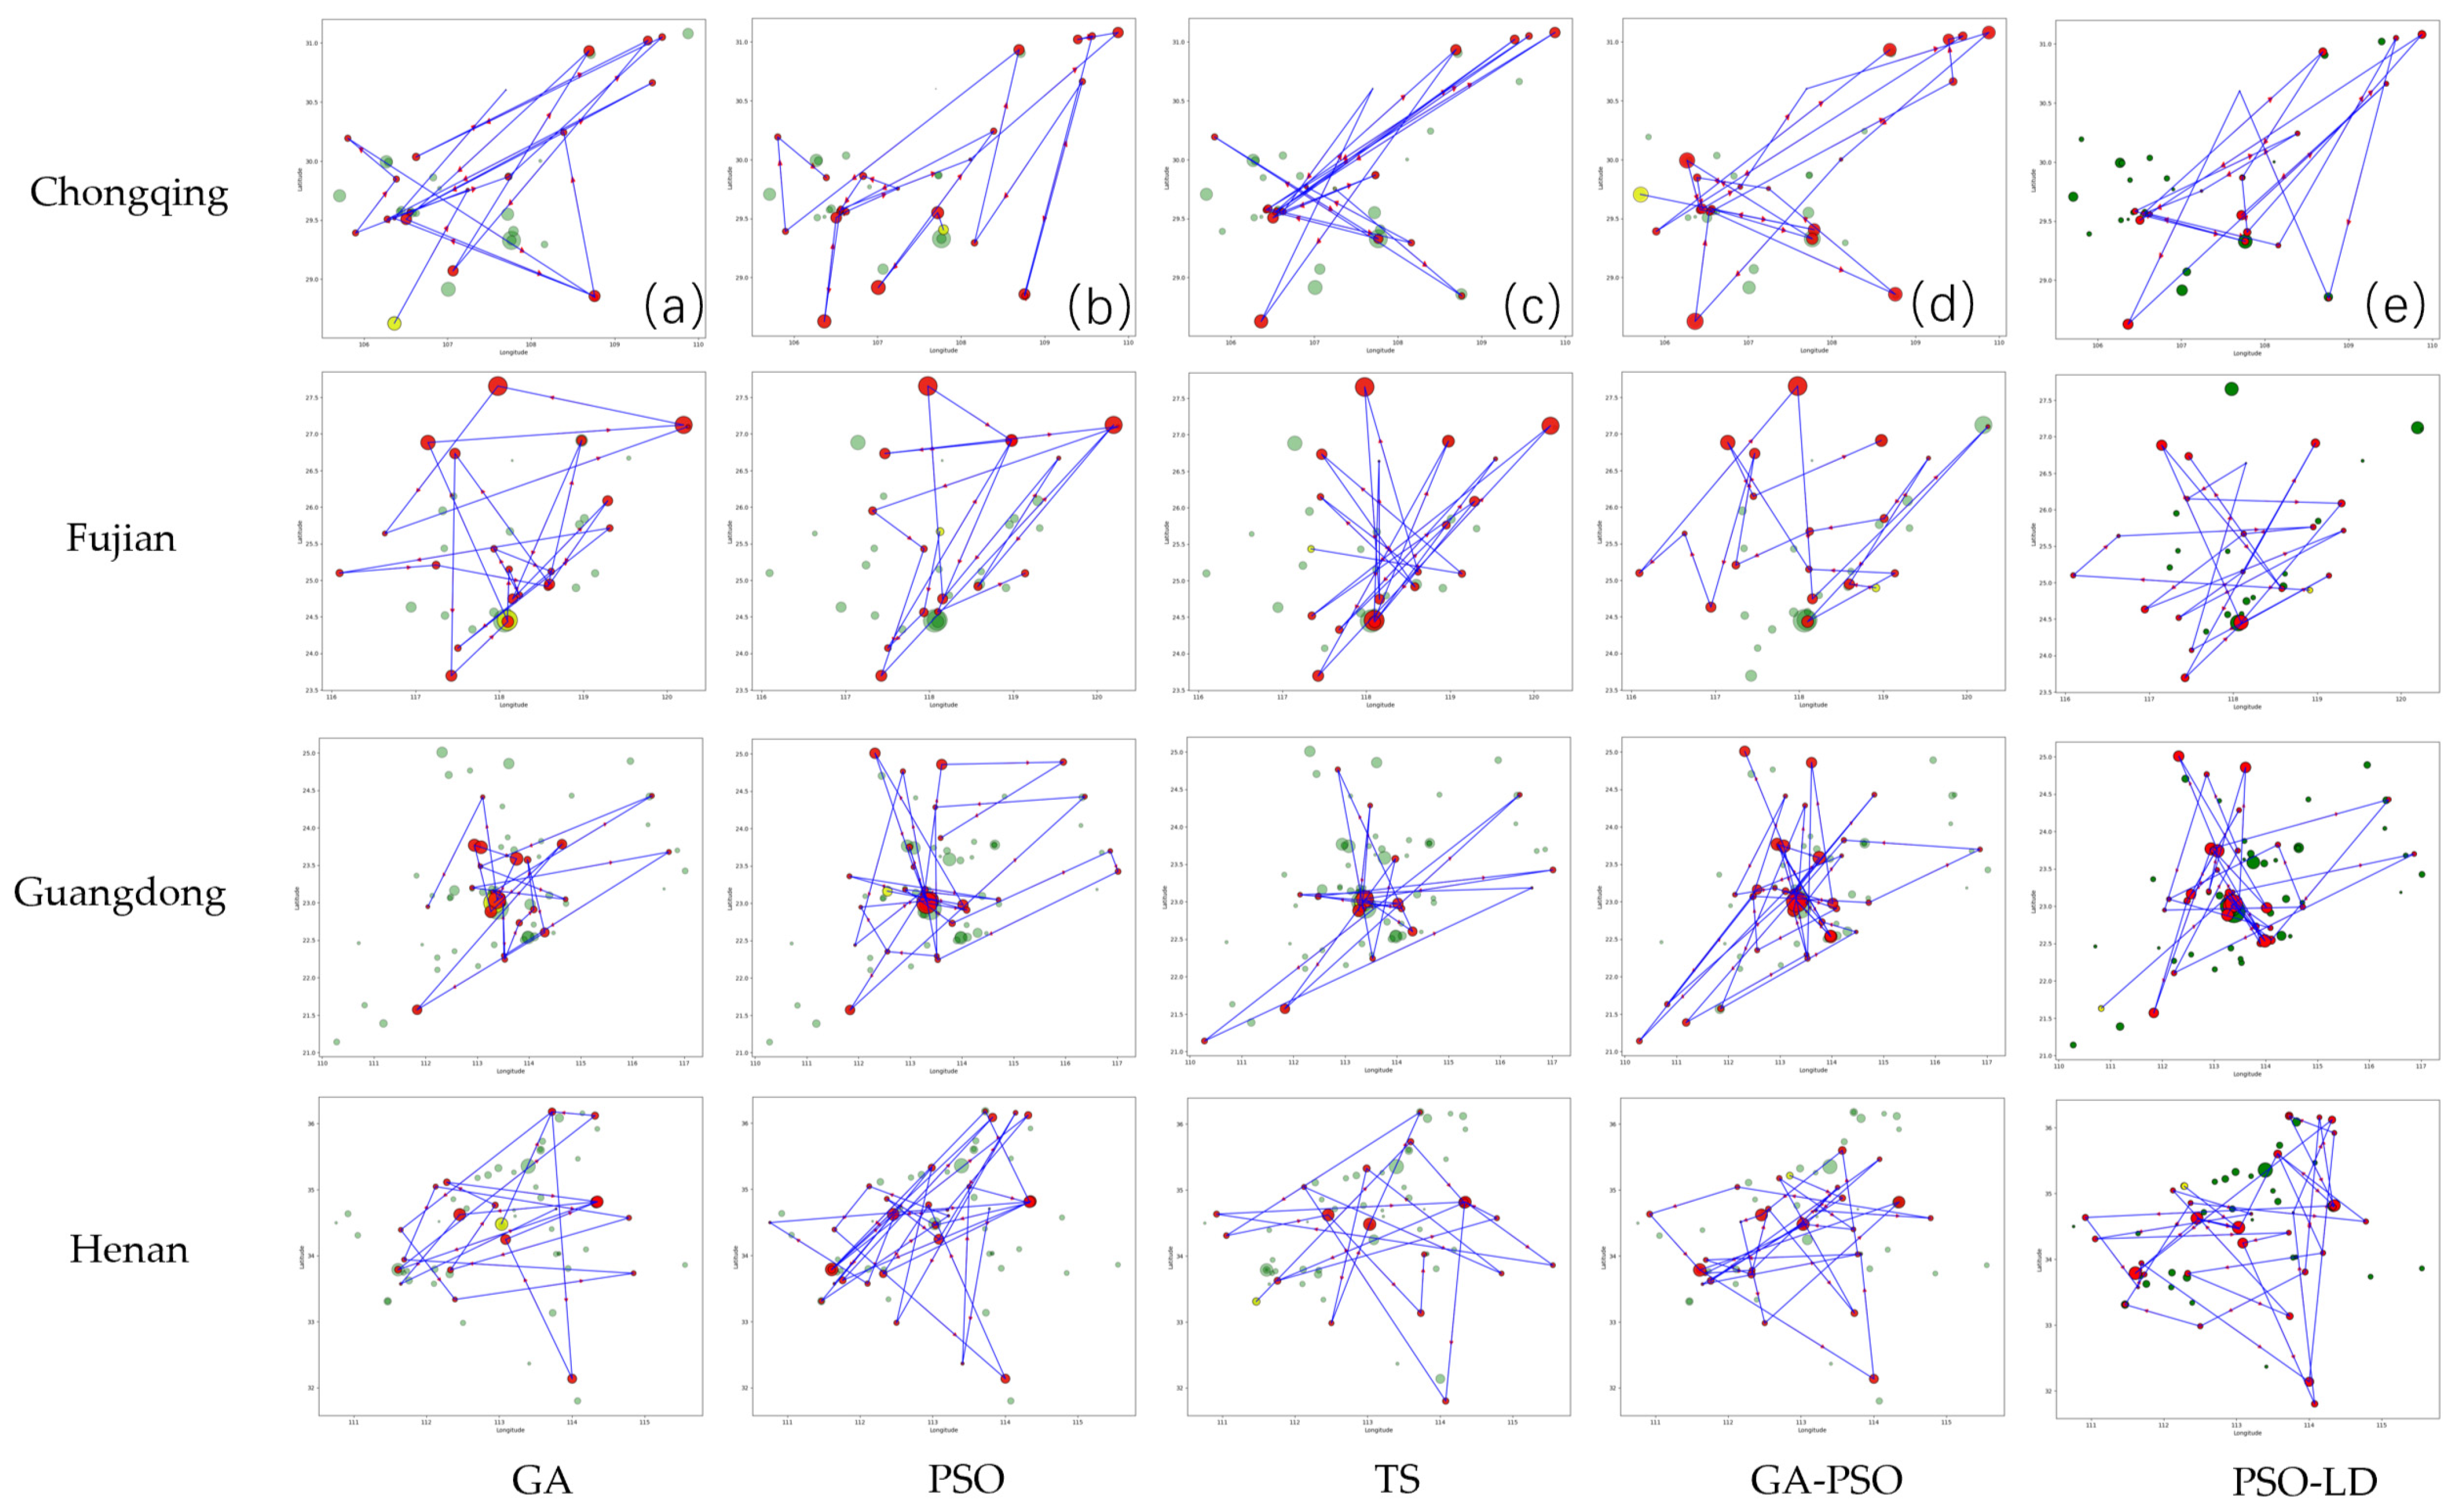
Figure 7 illustrates the path planning results for four regions, while the results for the remaining six regions are available in Appendix B, with detailed route information provided in Appendix C, offering a comprehensive comparative analysis of different algorithms in path planning.
Figure 7.
Path planning results for selected regions using different heuristic algorithms. Introduction to each section: (a) GA; (b) PSO; (c) TS; (d) GA-PSO; (e) PSO-LD. Each red point represents a selected attraction, with larger points indicating higher star ratings. The size of the points highlights the quality of the attractions included in the optimized routes for the selected regions.
In Figure 7, the blue lines represent the planned paths, green dots indicate all attractions, red dots denote the selected attractions, and the yellow dot marks the starting point. The size of each attraction’s circle reflects its TOPSIS comprehensive score, with higher scores represented by larger circles, visually demonstrating the priority selection by each algorithm. Figure 7a shows the path planning result using GA; Figure 7b displays the result using PSO; Figure 7c shows the result using TS; Figure 7d shows the path planning result using GA-PSO; and Figure 7e shows the path planning result using PSO-LD.
PSO-LD shows the best performance in path planning, with highly optimized paths focusing on high-score attractions and excellent path efficiency. GA-PSO also performs well, generating well-optimized paths that cover broad areas and include many high-score attractions. In contrast, GA and TS generally have lower path efficiency, with GA often producing scattered paths and TS showing a more balanced but less optimized approach. PSO demonstrates better path efficiency than GA by focusing on central or key areas but is still outperformed by PSO-LD and GA-PSO. Overall, PSO-LD stands out as the most effective algorithm for optimizing paths for high-score attractions.
6. Sensitivity Analysis
To evaluate the robustness of the heuristic algorithms, this study conducted a parameter sensitivity analysis. Population size and iterations were selected as the analysis parameters based on their significance in previous studies [41]. The initial values were set to 200 for population size and 10,000 for iterations. These parameters were adjusted within a ±30% range of their initial values, using a step size of 3%. Robustness was assessed through both quantitative and qualitative methods.
6.1. Sensitivity Analysis of Population Size
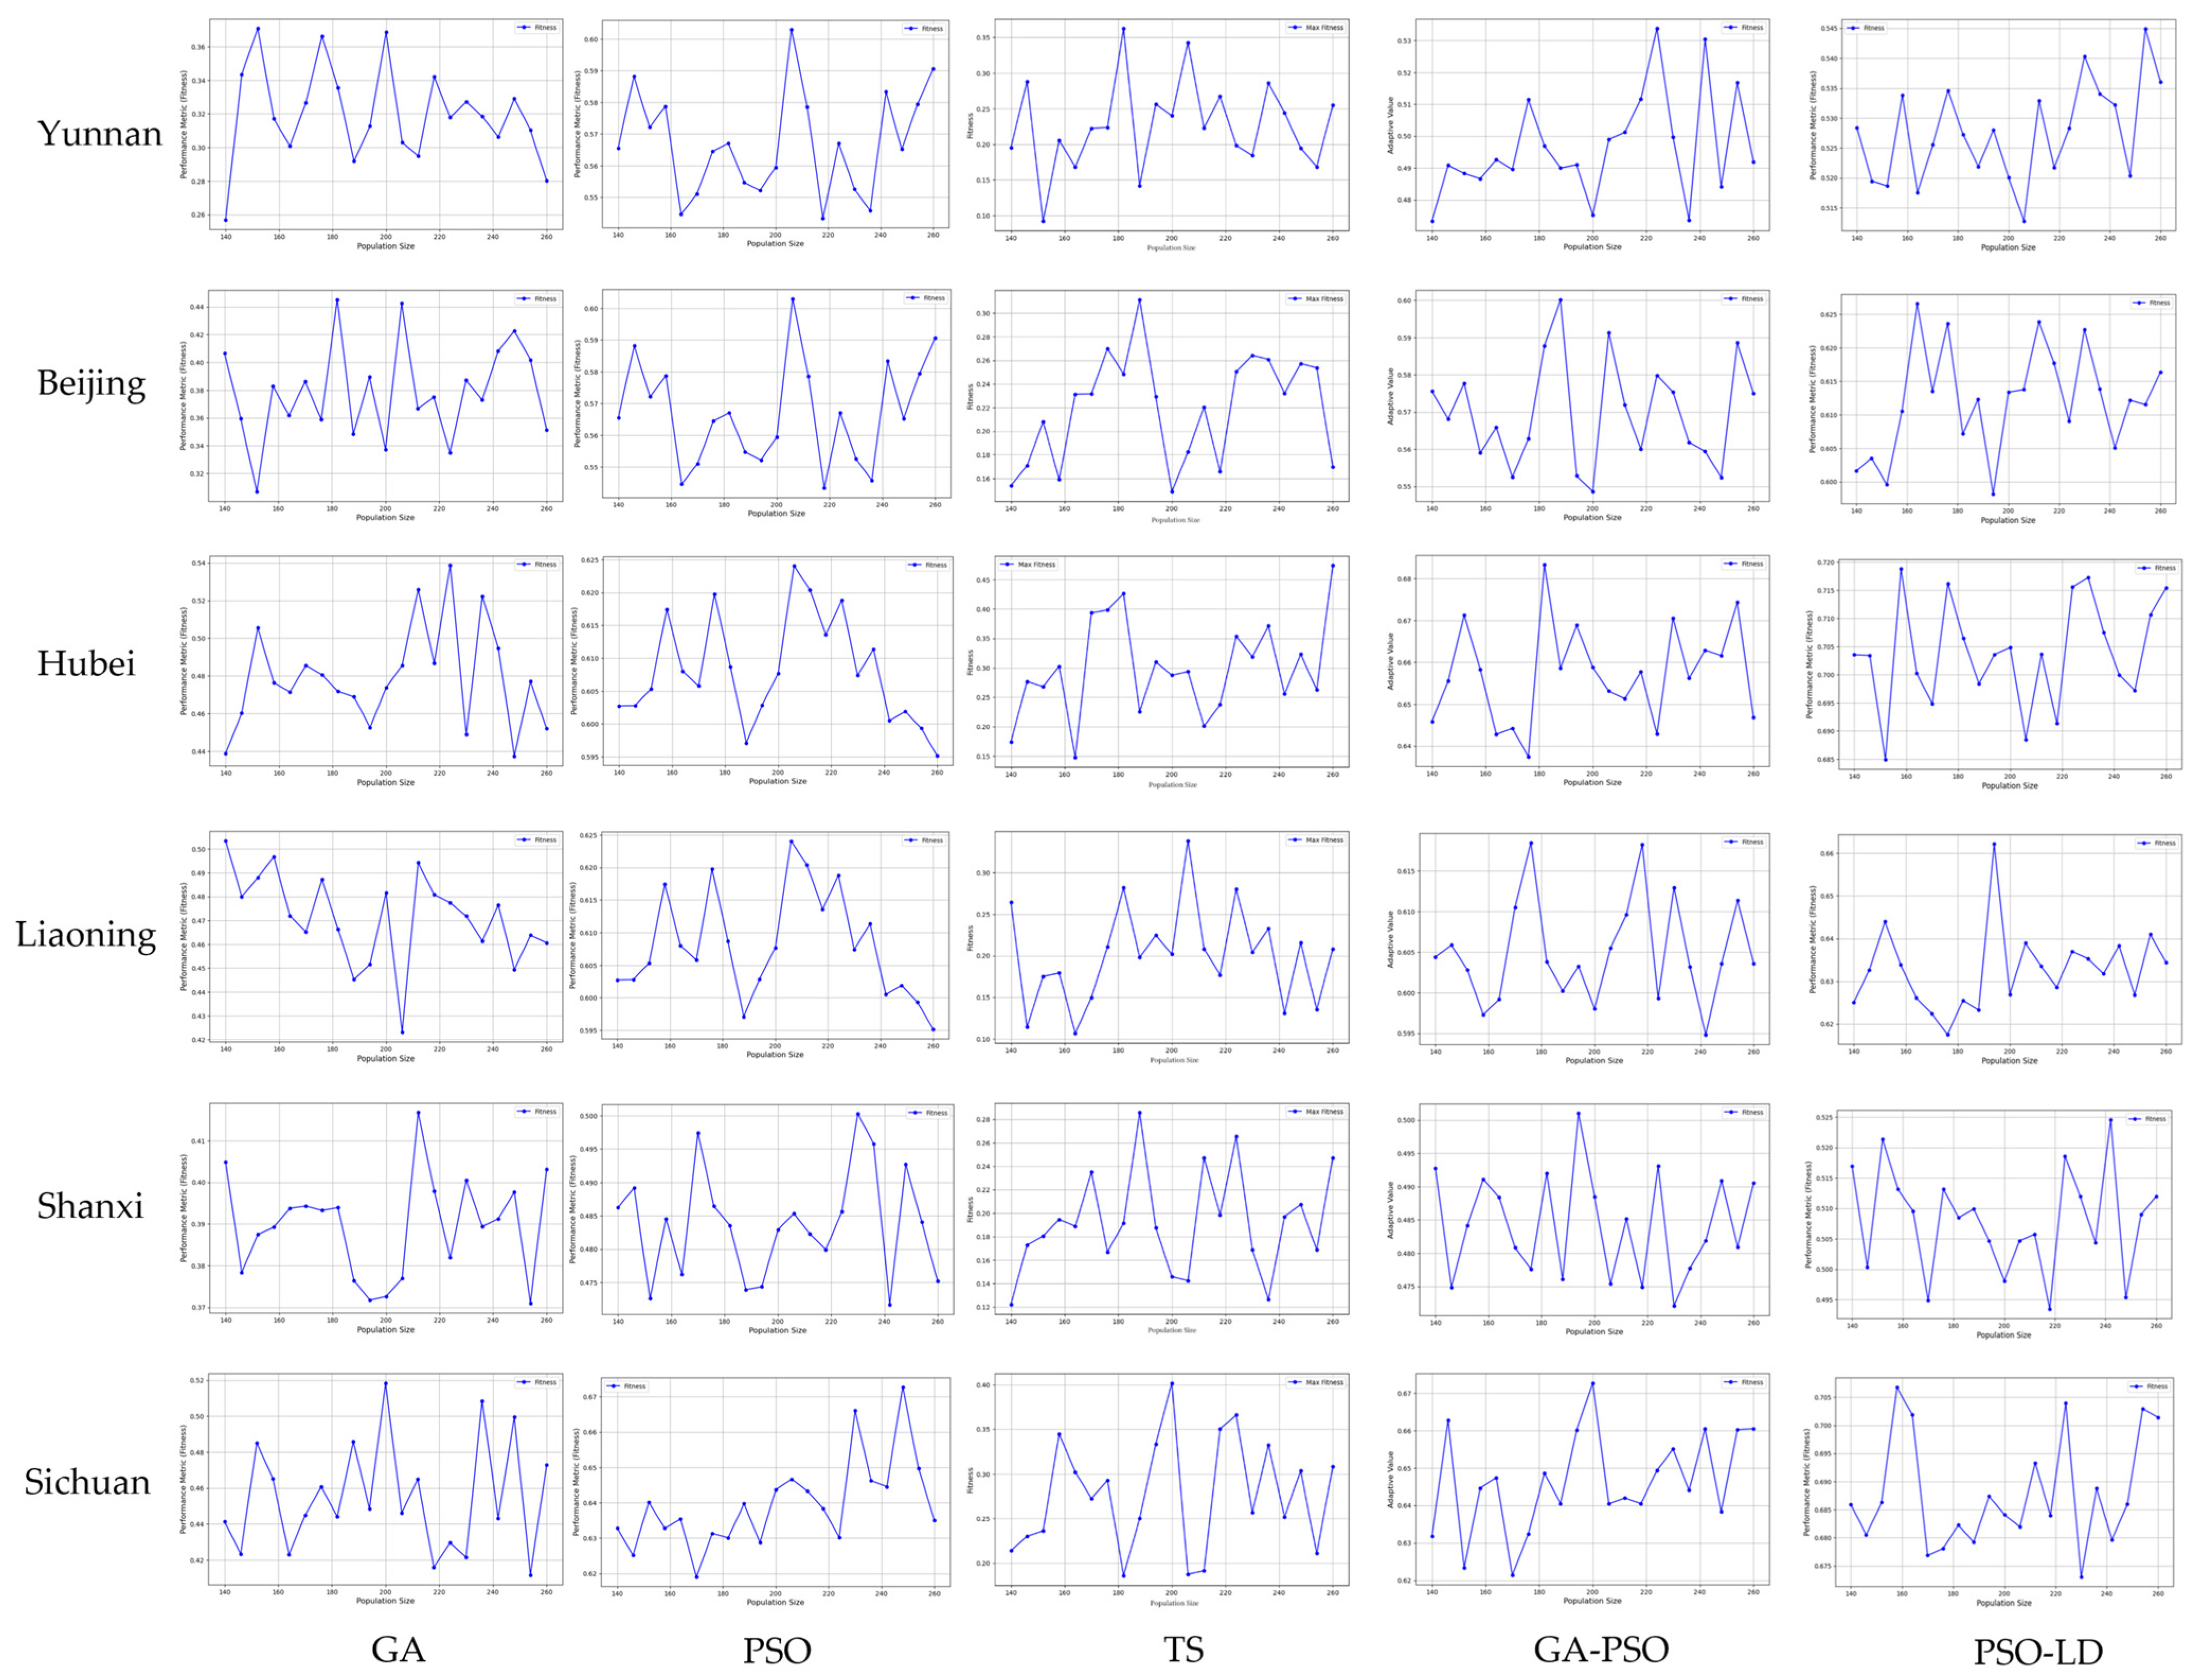
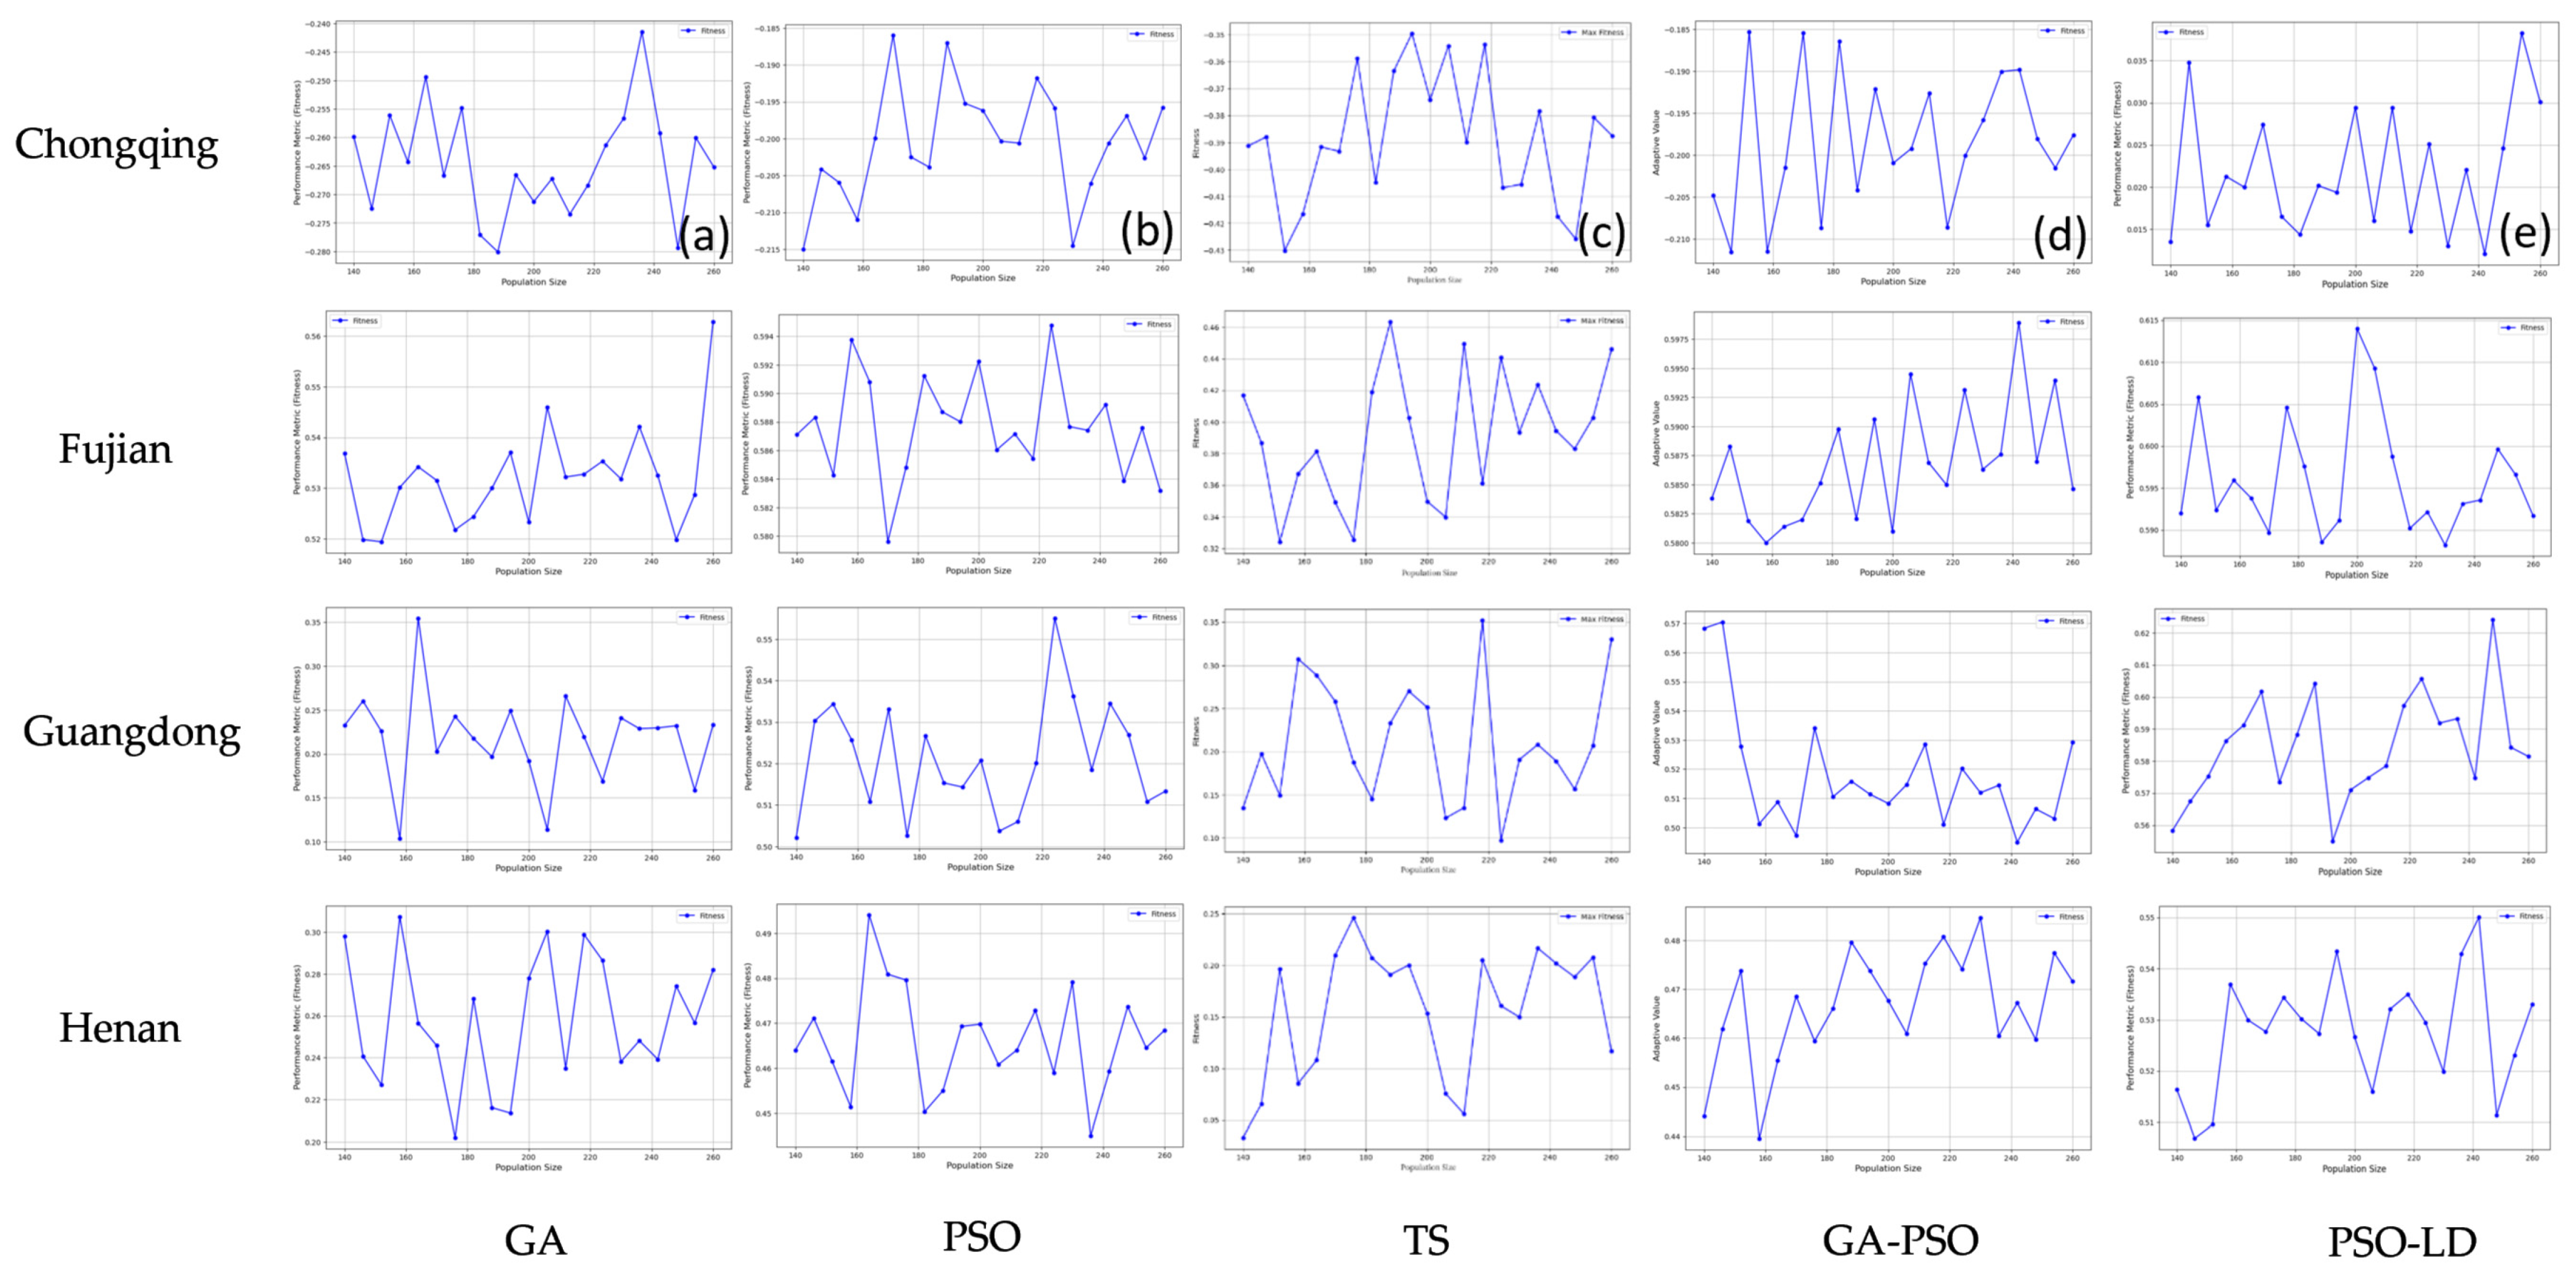
Figure 8 illustrates the solution results for the scenic spot planning problem in four cities, highlighting the sensitivity of five heuristic algorithms to variations in the population size parameter. Additional results for the remaining six regions are provided in Appendix D. The figure demonstrates that fitness values fluctuate to varying degrees in response to changes in the population size parameter, reflecting differences in the sensitivity and robustness of the algorithms.
Figure 8.
Line chart of the sensitivity analysis of population size. Introduction to each section: (a) GA; (b) PSO; (c) TS; (d) GA-PSO; (e) PSO-LD.
Among the algorithms, TS shows the largest fluctuations in its sensitivity curves, indicating a high sensitivity to the population size parameter and relatively low robustness. In contrast, PSO exhibits consistently smooth sensitivity curves across all four cities, with minimal changes in fitness values despite adjustments to the population size parameter. This behavior underscores the higher robustness of the PSO algorithm in comparison to the other methods.
To quantitatively assess the sensitivity of the algorithms to the population size parameter, the standard deviation of fitness values was used as a metric to measure dispersion. By evaluating the variation in fitness values as the population size parameter changes, the sensitivity and robustness of the five algorithms were analyzed. Table 9 summarizes the average standard deviation of each algorithm across ten regions, along with the standard deviation for individual regions.
Table 9.
Table of the population size sensitivity analysis results of the heuristic algorithms.
The results in Table 9 reveal that PSO-LD demonstrates the most consistent performance with the lowest standard deviations, both on average and in most regions, indicating high stability and reliability. GA and TS generally have higher standard deviations, suggesting less stable performance. PSO and GA-PSO fall in between. For example, in Chongqing, PSO-LD has a standard deviation of 0.006856436, lower than GA (0.006517431), PSO (0.004080315), TS (0.028811662), and GA-PSO (0.006822374). This pattern is repeated in other regions like Fujian, Guangdong, and Henan, where PSO-LD maintains lower standard deviations than other algorithms. Overall, PSO-LD is the most stable algorithm for this task.
6.2. Sensitivity Analysis of Iterations
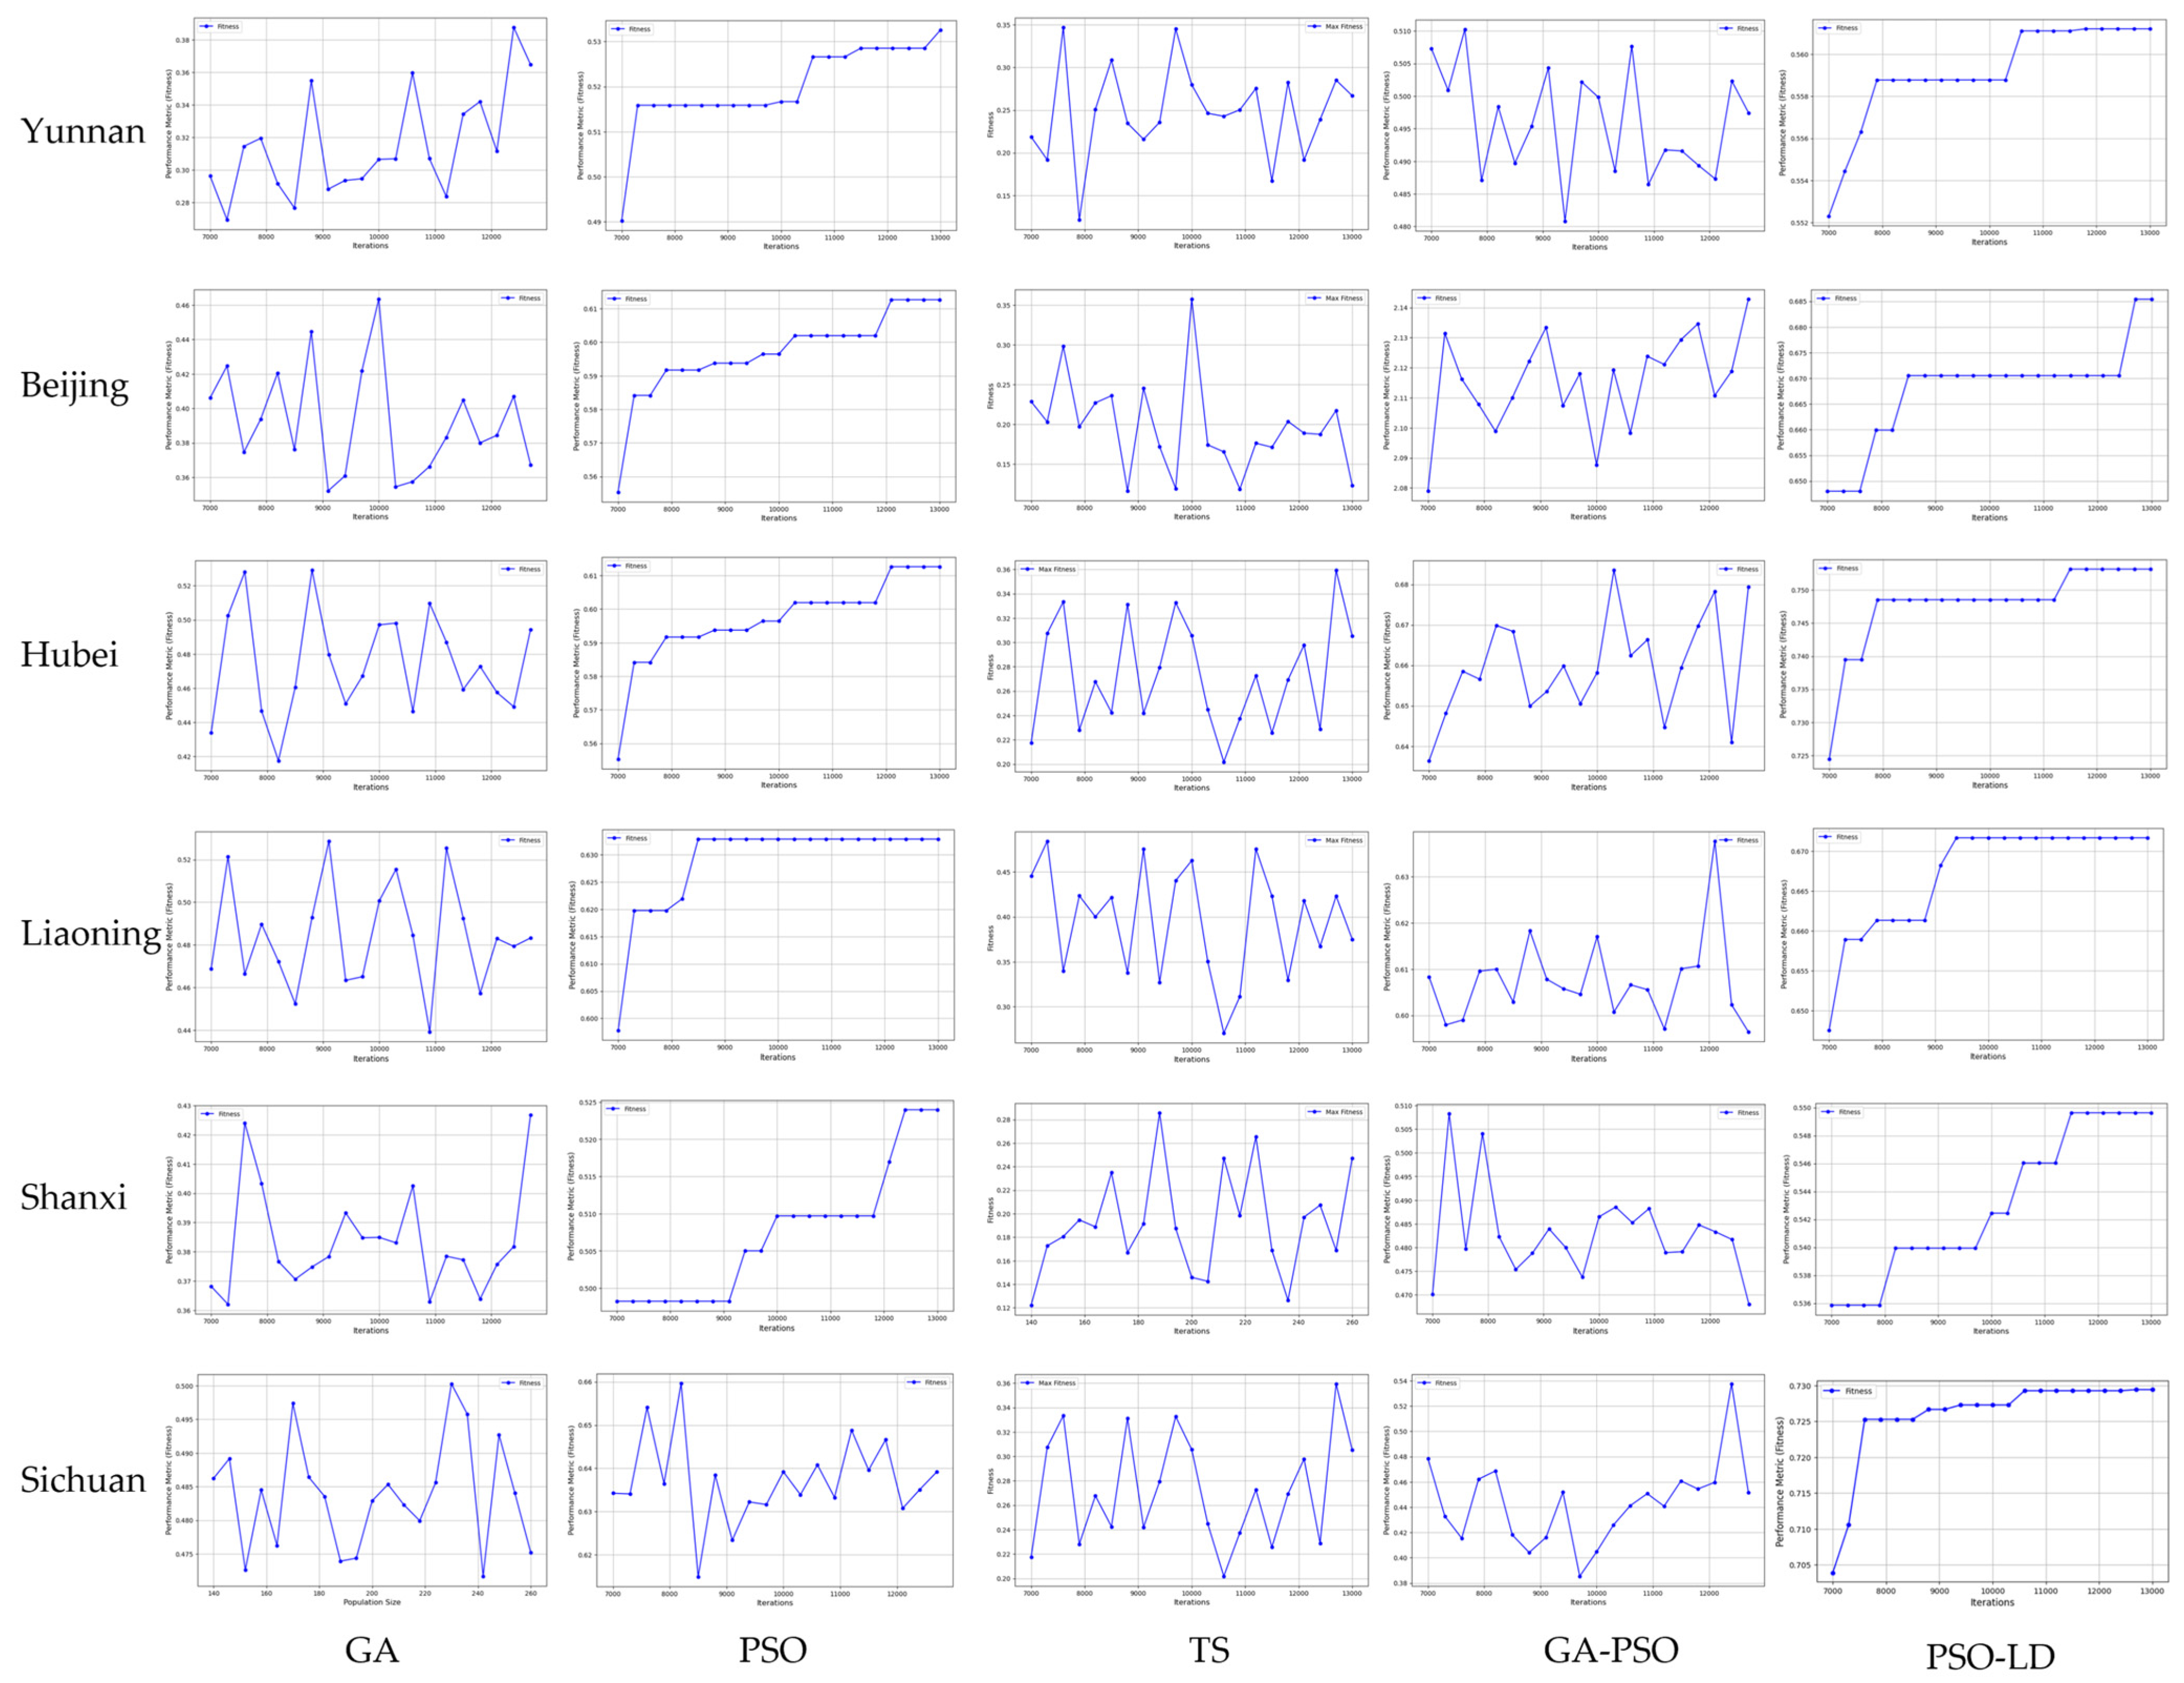
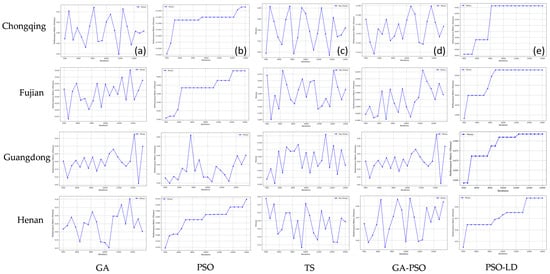
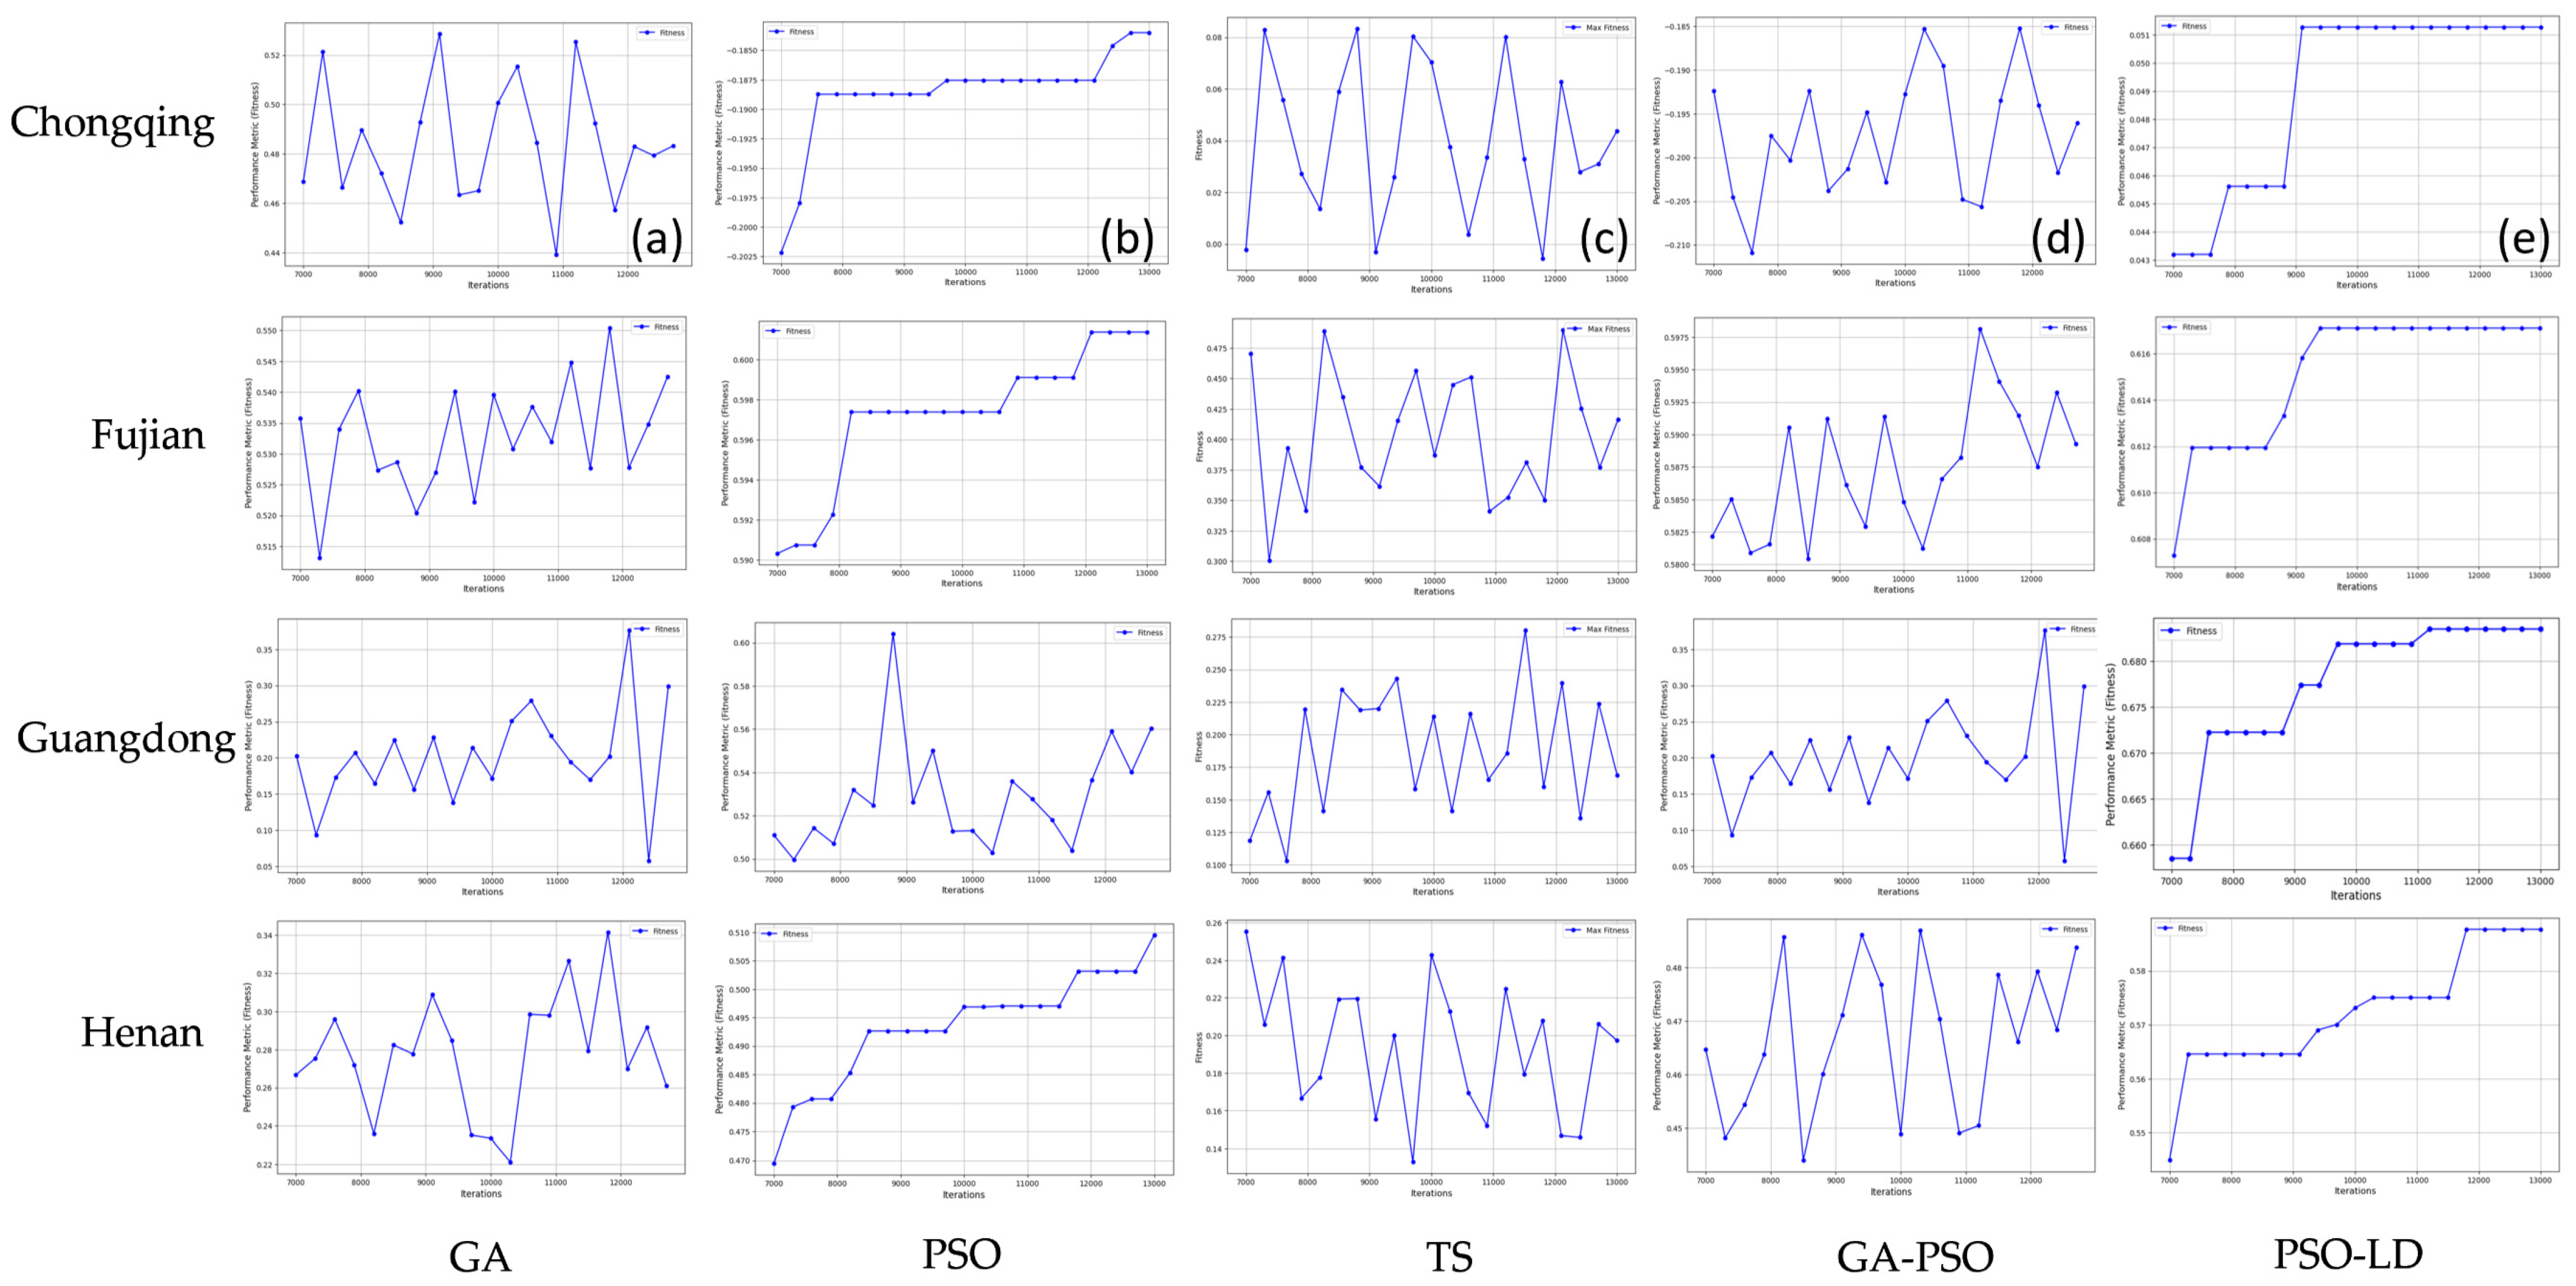
Figure 9 presents the fitness response of the GA, PSO, TS, GA-PSO, and PSO-LD algorithms to iterations in four regions: Chongqing, Fujian, Guangdong, and Henan. Detailed results for the other six regions are provided in Appendix E.
Figure 9.
Line chart of the sensitivity analysis of iterations. Introduction to each section: (a) GA; (b) PSO; (c) TS; (d) GA-PSO; (e) PSO-LD.
The results indicate that PSO and PSO-LD exhibit the most stable curves among all the algorithms. Their fitness values show a gradual convergence trend as the number of iterations increases, demonstrating superior robustness. Notably, PSO-LD exhibits a slightly faster convergence rate than PSO in some regions, but both maintain consistent overall trends. GA-PSO follows closely behind, with relatively small fluctuations in fitness values during iterations. In contrast, GA and TS display more significant fluctuations, with TS showing notable fitness oscillations in the four regions presented in Figure 9, indicating the lowest robustness.
In the robustness analysis of the iterations parameter presented in Table 10, PSO-LD demonstrates superior stability, achieving the smallest standard deviation of fitness values in seven out of ten regions. This indicates its strong robustness and reliability in handling complex optimization problems.
Table 10.
Table of the iterations sensitivity analysis results of the heuristic algorithms.
Compared to other algorithms, PSO-LD outperforms TS, which has the largest fitness value fluctuations and poorest stability. It also surpasses GA and GA-PSO, whose stability is inferior to that of PSO-LD in most regions. PSO-LD’s enhanced performance stems from its incorporation of local search mechanisms into the PSO framework, allowing for greater local optima refinement while preserving PSO’s global search capabilities. This makes PSO-LD particularly effective in complex optimization scenarios, where both global and local search capabilities are crucial.
7. Discussion
This study proposes a comprehensive approach to the tourist trip design problem (TTDP), integrating multi-criteria decision-making and heuristic algorithms to balance tourist experience, cost, and efficiency. The key contribution of this approach lies in combining subjective and objective weighting methods, incorporating expert judgment and data variability for weight distribution, resulting in a more balanced and scientific weighting process. Additionally, the introduction of the Lagrange multiplier method enhances the robustness of the approach by optimizing the weights under constraints, ensuring consistency and fairness in the evaluation of tourist destinations. The experimental results demonstrate that the PSO-LD algorithm performs excellently in multi-area planning, providing optimal solutions in most regions and leading other algorithms in both overall scores and individual attraction scores, highlighting the effectiveness of PSO-LD in comprehensive route optimization under complex constraints.
The strategy proposed in this study consists of three main components: the integrated evaluation model optimized by the Lagrange multiplier method, the weighted and optimization model, and the PSO-LD algorithm. The time complexity analysis of each component is as follows:
- Integrated Evaluation Model: This model involves solving small-scale systems of equations, with a time complexity of O(1), meaning the computation is constant in nature.
- Weighted and Optimization Model: During each fitness evaluation, all decision variables need to be traversed, resulting in a time complexity of O(n), where n represents the number of decision variables.
- PSO-LD Algorithm: In each generation, P particles need to be updated, and the computation of each particle’s update and fitness evaluation is linearly related to the problem size n. The total computation in a single iteration is P times the problem size n, and the algorithm iterates T times, resulting in an overall time complexity of O(PTn).
By combining these three parts, we find that the O(1) complexity of the integrated evaluation model and the O(n) complexity of the weighted and optimization model are relatively small, while the O(PTn) complexity of the PSO-LD algorithm is the dominant factor determining the overall computational load. Despite this, the multi-area planning optimization method based on the PSO-LD algorithm remains highly efficient and scalable in practical applications.
The integration of multi-criteria weighting methods with heuristic algorithms marks a significant advancement in TTDP research. Compared to existing approaches, this study not only compares multiple algorithms but also enhances the adaptability, scalability, and robustness of the method, providing valuable insights for real-world applications, particularly in multi-day travel planning under time or cost constraints.
To further substantiate the effectiveness of the heuristic algorithms employed, Table 11 below compares the characteristics of each algorithm used in this study based on various criteria, such as global search ability, computational cost, convergence speed, and suitability for different scenarios.
Table 11.
Comparison of the heuristic algorithms.
As shown in Table 11, each algorithm has distinct features and is suited to different types of optimization problems. For example, GA is highly effective for large-scale optimization problems, while PSO excels in continuous optimization and is quicker to converge compared to TS, which is better at avoiding local optima. PSO-LD, with its integration of a dynamic Laplace perturbation, outperforms the others, achieving the best overall results in most regions due to its enhanced global exploration and faster convergence. This algorithm’s superior performance underscores its effectiveness in solving the TTDP under complex constraints.
Despite these achievements, this study has certain limitations. For example, the dataset is limited to tourism data from China, restricting the generalizability of the findings to regions with different cultural, logistical, and economic characteristics. Furthermore, due to the limitations of the dataset, the model has not been fully validated for its adaptability to dynamic factors such as real-time pricing and weather changes. While dynamic parameter adjustments can address these factors, direct integration with real-time data streams still requires further development. Lastly, the robustness of the TOPSIS framework in different optimization domains has not been sufficiently explored, limiting its broader applicability across various fields.
Future research will validate the model’s adaptability and scalability using more diverse regional datasets and enhance its dynamic response capability by integrating real-time data streams via APIs and incorporating online learning techniques. Additionally, combining this framework with recommendation algorithms will further optimize the weighting and parameters, improving model performance. Through application validation in other fields, the robustness and improvements of the TOPSIS framework will be further confirmed, ensuring its broader applicability and providing more effective solutions for complex multi-objective optimization problems.
8. Conclusions
This study presents a comprehensive framework for tourism route planning by integrating a weighted sum optimization method with multi-criteria decision-making and heuristic algorithms. The method combines subjective and objective evaluation approaches for balanced and scientific analysis, using AHP for subjective weights based on expert judgment and EWM for objective weights based on data variability. The Lagrange multiplier method optimizes the combination of these weights, ensuring balanced and robust weighting, which are then applied in the TOPSIS model to generate fair rankings for tourist sites.
The study evaluates eight heuristic algorithms—GA, PSO, TS, GA-PSO, GWO, ACO, WOA, and PSO-LD—using the TOPSIS model across multiple regions. One innovation is that this study introduces the Lagrange multiplier method to solve GA, PSO, TS, GA-PSO, GWO, WOA, and ACO. The experimental results show that the introduction of the Lagrange multiplier method improves the solution quality of all seven heuristic algorithms, the quality of the average solution has been improved by 112.5% (from 0.16 to 0.34), and the PSO algorithm can achieve the best solution quality. Based on this, this study improves the PSO algorithm.
A key contribution is the development of the PSO-LD algorithm, which incorporates a dynamic adaptive Laplace perturbation into the PSO framework, enhancing its performance. PSO-LD outperforms other algorithms with the highest scores in most regions, demonstrating superior stability and robustness in sensitivity analyses. Compared with the traditional PSO algorithm, the total score obtained by the PSO-LD algorithm is improved by about 11% on average, achieving higher solution quality and faster convergence.
PSO-LD outperformed all baseline algorithms, achieving the highest total score (0.573 vs. PSO’s 0.516 and GA-PSO’s 0.509) and attraction score (1.518 vs. PSO’s 1.489) across regions, with statistical significance (p < 0.002 for all comparisons). Its superiority stems from the integration of dynamic parameter adaptation and Lagrange multiplier-driven constraints, enabling robust global exploration while maintaining precise local refinement. Unlike PSO, which balances resource efficiency (total price: CNY 4256) and runtime (142.0 s), PSO-LD prioritizes solution quality despite higher resource costs (price: CNY 4694; distance: 4605). GA-PSO, while consistent due to its hybrid GA-PSO structure, lagged behind PSO-LD in both total score and computational efficiency (runtime: 256.5 s vs. 143.2 s), reflecting the limitations of static hybrid mechanisms in dynamic environments. GA excelled in speed (139.6 s) and low resource use (price: CNY 3588) but delivered subpar optimization quality (total score: 0.322; p < 0.05). TS remained the weakest performer (total score: 0.276; runtime: 1084.5 s), highlighting its incompatibility with modern multi-objective tasks.
The results show that GA is suitable for time-sensitive tasks with relaxed quality thresholds. PSO performs well in multi-regional planning under specific constraints, achieving high solution quality and efficiency. GA-PSO is competitive in scenarios requiring more attractions due to its balanced exploration and exploitation. TS, however, shows limited performance under constraints. In the same way, GWO, ACO, and WOA should be avoided because their total scores are consistently lower than those of GA, PSO, GA-PSO, and PSO-LD. This performance gap may stem from the severe convergence of individuals in their later stages.
Author Contributions
Conceptualization, G.Z. and X.Y.; data curation, M.W. and H.L.; formal analysis, J.L. and Z.L.; funding acquisition, Y.Z.; investigation, G.Z., Y.Z. and M.Y.; methodology, G.Z., M.W. and H.L.; resources, M.Y.; software, G.Z.; supervision, Y.Z. and J.L.; validation, J.L. and Z.L.; writing—original draft, G.Z., X.Y. and M.W.; writing—review and editing, X.Y., M.Y., M.W., J.L. and Y.Z. All authors have read and agreed to the published version of the manuscript.
Funding
This research was supported by the National Natural Science Foundation of China (No. 12250410247), the Ministry of Science and Technology of China (No. WGXZ2023054L), the 2024 National Innovation and Entrepreneurship Training Program for College Students (202411078050), and the 2025 National Innovation and Entrepreneurship Training Program for College Students (202511078050).
Data Availability Statement
Data are contained within the article.
Conflicts of Interest
The authors declare no conflicts of interest.
Appendix A
Figure A1.
The number of attractions and total scores in six regions: Beijing, Hubei, Guangdong, Yunnan, Liaoning, and Henan.
Appendix B
Figure A2.
Path planning maps for Yunnan, Beijing, Hubei, Liaoning, Shaanxi, and Sichuan by using different heuristic algorithms. Introduction of to each section: (a) GA; (b) PSO; (c) TS; (d) GA-PSO; (e) PSO-LD.
Appendix C
Table A1.
Route-planning solutions for ten regions using GA, PSO, TS, and GA-PSO.
Appendix D
Figure A3.
Line charts of the population size sensitivity analysis in six regions: Yunnan, Beijing, Hubei, Liaoning, Shanxi, and Sichuan.
Appendix E
Figure A4.
Line charts of the iterations sensitivity analysis in six regions: Yunnan, Beijing, Hubei, Liaoning, Shanxi, and Sichuan.
References
- Holland, J.H. Genetic algorithms. Sci. Am. 1992, 267, 66–73. [Google Scholar] [CrossRef] [Scilit]
- Dorigo, M.; Birattari, M.; Stutzle, T. Ant colony optimization. IEEE Comput. Intell. Mag. 2006, 1, 28–39. [Google Scholar] [CrossRef] [Scilit]
- Toaza, B.; Esztergár-Kiss, D. A review of metaheuristic algorithms for solving TSP-based scheduling optimization problems. Appl. Soft Comput. 2023, 148, 110908. [Google Scholar] [CrossRef] [Scilit]
- Jiang, Y.; Weise, T.; Lässig, J.; Chiong, R.; Athauda, R. Comparing a hybrid branch and bound algorithm with evolutionary computation methods, local search and their hybrids on the tsp. In Proceedings of the 2014 IEEE Symposium on Computational Intelligence in Production and Logistics Systems (CIPLS), Orlando, FL, USA, 9–12 December 2014; IEEE: New York, NY, USA, 2014; pp. 148–155. [Google Scholar] [CrossRef] [Scilit]
- Miki, S.; Yamamoto, D.; Ebara, H. Applying deep learning and reinforcement learning to traveling salesman problem. In Proceedings of the 2018 International Conference on Computing, Electronics & Communications Engineering (ICCECE), Southend, UK, 17 August 2018; IEEE: New York, NY, USA, 2018; pp. 65–70. [Google Scholar] [CrossRef] [Scilit]
- Fausto, F.; Reyna-Orta, A.; Cuevas, E.; Andrade, Á.G.; Perez-Cisneros, M. From ants to whales: Metaheuristics for all tastes. Artif. Intell. Rev. 2020, 53, 753–810. [Google Scholar] [CrossRef] [Scilit]
- Vansteenwegen, P.; Van Oudheusden, D. The Mobile Tourist Guide: An OR Opportunity. OR Insight 2007, 20, 21–27. [Google Scholar] [CrossRef] [Scilit]
- Vansteenwegen, P.; Souffriau, W.; Berghe, G.V.; Van Oudheusden, D. A guided local search metaheuristic for the team orienteering problem. Eur. J. Oper. Res. 2009, 196, 118–127. [Google Scholar] [CrossRef] [Scilit]
- Lin, S.W.; Vincent, F.Y. A simulated annealing heuristic for the team orienteering problem with time windows. Eur. J. Oper. Res. 2012, 217, 94–107. [Google Scholar] [CrossRef] [Scilit]
- Potters, J.A.; Curiel, I.J.; Tijs, S.H. Traveling salesman games. Math. Program. 1992, 53, 199–211. [Google Scholar] [CrossRef] [Scilit]
- Goldbarg, E.F.; Goldbarg, M.C.; de Souza, G.R. Particle swarm optimization algorithm for the traveling salesman problem. Travel. Salesm. Probl. 2008, 1, 75–96. [Google Scholar]
- Toksari, M.D.; Toksari, M. Ant colony optimization approach for estimating tourism receipts and expenditures: The case of Turkey. Tour. Anal. 2009, 14, 651–663. [Google Scholar] [CrossRef] [Scilit]
- Wu, L.; Wang, Z.; Liao, Z.; Xiao, D.; Han, P.; Li, W.; Chen, Q. Multi-day tourism recommendations for urban tourists considering hotel selection: A heuristic optimization approach. Omega 2024, 126, 103048. [Google Scholar] [CrossRef] [Scilit]
- Coello, C.A. An updated survey of GA-based multiobjective optimization techniques. ACM Comput. Surv. 2000, 32, 109–143. [Google Scholar] [CrossRef] [Scilit]
- Ghobadi, F.; Divsalar, A.; Jandaghi, H.; Nozari, R.B. An integrated recommender system for multi-day tourist itinerary. Appl. Soft Comput. 2023, 149, 110942. [Google Scholar] [CrossRef] [Scilit]
- Gupta, I.K.; Shakil, S.; Shakil, S. A hybrid GA-PSO algorithm to solve traveling salesman problem. In Computational Intelligence: Theories, Applications and Future Directions-Volume I: ICCI-2017; Springer: Singapore, 2019; pp. 453–462. [Google Scholar] [CrossRef] [Scilit]
- Sopto, D.S.; Ayon, S.I.; Akhand, M.A.H.; Siddique, N. Modified grey wolf optimization to solve traveling salesman problem. In Proceedings of the 2018 International Conference on Innovation in Engineering and Technology (ICIET), Dhaka, Bangladesh, 27–28 December 2018; IEEE: New York, NY, USA, 2018; pp. 1–4. [Google Scholar] [CrossRef] [Scilit]
- Hong, L.; Liu, Y.; Xu, M.; Deng, W. Combining deep reinforcement learning with heuristics to solve the traveling salesman problem. Chin. Phys. B 2025, 34, 018705. [Google Scholar] [CrossRef] [Scilit]
- Gavalas, D.; Konstantopoulos, C.; Pantziou, G.; Vathis, N. An efficient heuristic for the vacation planning problem. In Proceedings of the 2019 IEEE 10th Annual Ubiquitous Computing, Electronics & Mobile Communication Conference (UEMCON), New York, NY, USA, 10–12 October 2019; IEEE: New York, NY, USA, 2019; pp. 803–808. [Google Scholar] [CrossRef] [Scilit]
- Saaty, T.L. Decision-making with the AHP: Why is the principal eigenvector necessary. Eur. J. Oper. Res. 2003, 145, 85–91. [Google Scholar] [CrossRef] [Scilit]
- Liu, J.; Zhang, Q.; Xie, M.; Lin, M.; Xu, Z. A blockchain platform selection method with heterogeneous multi-criteria Decision-Making based on hybrid distance measures and an AHP-EWM weight method. Expert Syst. Appl. 2024, 256, 124910. [Google Scholar] [CrossRef] [Scilit]
- Benítez, J.; Delgado-Galván, X.; Izquierdo, J.; Pérez-García, R. Improving consistency in AHP decision-making processes. Appl. Math. Comput. 2012, 219, 2432–2441. [Google Scholar] [CrossRef] [Scilit]
- Behzadian, M.; Otaghsara, S.K.; Yazdani, M.; Ignatius, J. A state-of the-art survey of TOPSIS applications. Expert Syst. Appl. 2012, 39, 13051–13069. [Google Scholar] [CrossRef] [Scilit]
- Chen, P. Effects of normalization on the entropy-based TOPSIS method. Expert Syst. Appl. 2019, 136, 33–41. [Google Scholar] [CrossRef] [Scilit]
- Zhu, Y.; Tian, D.; Yan, F. Effectiveness of entropy weight method in decision-making. Math. Probl. Eng. 2020, 2020, 3564835. [Google Scholar] [CrossRef] [Scilit]
- Roszkowska, E.; Wachowicz, T. Impact of Normalization on Entropy-Based Weights in Hellwig’s Method: A Case Study on Evaluating Sustainable Development in the Education Area. Entropy 2024, 26, 365. [Google Scholar] [CrossRef] [Scilit] [PubMed]
- Rodriguez-Carranza, C.E.; Loew, M.H. Weighted and deterministic entropy measure for image registration using mutual information. In Proceedings of the Medical Imaging 1998: Image Processing, San Diego, CA, USA, 21–26 February 1998; SPIE: Bellingham, WA, USA, 1998; Volume 3338, pp. 155–166. [Google Scholar] [CrossRef] [Scilit]
- Wu, R.M.; Zhang, Z.; Yan, W.; Fan, J.; Gou, J.; Liu, B.; Gide, E.; Soar, J.; Shen, B.; Fazal-e-Hasan, S.; et al. A comparative analysis of the principal component analysis and entropy weight methods to establish the indexing measurement. PLoS ONE 2022, 17, e0262261. [Google Scholar] [CrossRef] [Scilit]
- Wang, B.; Wang, Y.; Yang, G.; He, Q.; Zhang, Y.; Lu, Y. Ecological health evaluation of an urban riverside greenway based on the AHP-EWM-TOPSIS model: A case study of Hangzhou, China. Environ. Res. Commun. 2024, 6, 105029. [Google Scholar] [CrossRef] [Scilit]
- Wu, Y. Construction of the China financial pressure index measurement model based under the AHP-EWM-TOPSIS model. In Proceedings of the SHS Web of Conferences, Online, 15 September 2023; EDP Sciences: Les Ulis, France, 2023; Volume 169, p. 01018. [Google Scholar] [CrossRef] [Scilit]
- Maria, E.; Budiman, E.; Taruk, M. Measure distance locating nearest public facilities using Haversine and Euclidean Methods. J. Phys. Conf. Ser. 2020, 1450, 012080. [Google Scholar] [CrossRef] [Scilit]
- Fatimah, F.; Al Ikhsan, S.H.; Wulandari, B. Implementation of the haversine method for the application of finding tourist attractions in nanggung district. J. Pilar Nusa Mandiri 2022, 18, 59–64. [Google Scholar] [CrossRef] [Scilit]
- Morgan, D.J.; Lok, L. Assessment of a comfort indicator for natural tourist attractions: The case of visitors to Hanging Rock, Victoria. J. Sustain. Tour. 2000, 8, 393–409. [Google Scholar] [CrossRef] [Scilit]
- David, J.; Rögnvaldsson, T. Multi-robot routing problem with min–max objective. Robotics 2021, 10, 122. [Google Scholar] [CrossRef] [Scilit]
- Halim, A.H.; Ismail, I. Combinatorial optimization: Comparison of heuristic algorithms in travelling salesman problem. Arch. Comput. Methods Eng. 2019, 26, 367–380. [Google Scholar] [CrossRef] [Scilit]
- Albadr, M.A.; Tiun, S.; Ayob, M.; Al-Dhief, F. Genetic algorithm based on natural selection theory for optimization problems. Symmetry 2020, 12, 1758. [Google Scholar] [CrossRef] [Scilit]
- Branke, J.; Mostaghim, S. About selecting the personal best in multi objective particle swarm optimization. In Proceedings of the International Conference on Parallel Problem Solving from Nature, Dortmund, Germany, 10–14 September 2022; Springer: Berlin/Heidelberg, Germany, 2006; pp. 523–532. [Google Scholar] [CrossRef] [Scilit]
- Klincewicz, J.G. Avoiding local optima in the p-hub location problem using tabu search and GRASP. Ann. Oper. Res. 1992, 40, 283–302. [Google Scholar] [CrossRef] [Scilit]
- Kachitvichyanukul, V. Comparison of three evolutionary algorithms: GA, PSO, and DE. Ind. Eng. Manag. Syst. 2012, 11, 215–223. [Google Scholar] [CrossRef] [Scilit]
- Nasiri, J.; Khiyabani, F.M. A whale optimization algorithm (WOA) approach for clustering. Cogent Math. Stat. 2018, 5, 1483565. [Google Scholar] [CrossRef] [Scilit]
- Friesz, T.L.; Tobin, R.L.; Cho, H.J.; Mehta, N.J. Sensitivity analysis based heuristic algorithms for mathematical programs with variational inequality constraints. Math. Program. 1990, 48, 265–284. [Google Scholar] [CrossRef] [Scilit]

Disclaimer/Publisher’s Note: The statements, opinions and data contained in all publications are solely those of the individual author(s) and contributor(s) and not of MDPI and/or the editor(s). MDPI and/or the editor(s) disclaim responsibility for any injury to people or property resulting from any ideas, methods, instructions or products referred to in the content. |
© 2025 by the authors. Licensee MDPI, Basel, Switzerland. This article is an open access article distributed under the terms and conditions of the Creative Commons Attribution (CC BY) license (https://creativecommons.org/licenses/by/4.0/).