1. Introduction
Cilia are hair-like structures located on the surfaces of many organisms, such as Paramecium, amoeba, and complex multicellular organisms. The human body contains numerous cilia that can be found both inside the body and on the human skin. Cilia, for example, help move eggs through the fallopian tubes into the uterus and move sperm in the reproductive system [
1]. Cilia help pass food and waste through the digestive tract [
2]. They also aid digestion and prevent intestine blockages [
2]. Cilia in the respiratory system help move mucus and foreign particles out of the lungs and airways [
3]. They are self-propelled structures that move in a way called metachronal motion. This protects the lungs and respiratory system from infection. This research focuses on the cilia found in the innate immune system in the human respiratory system, which play an important role in protecting the body from small particles contaminated with inhaled air, such as dust.
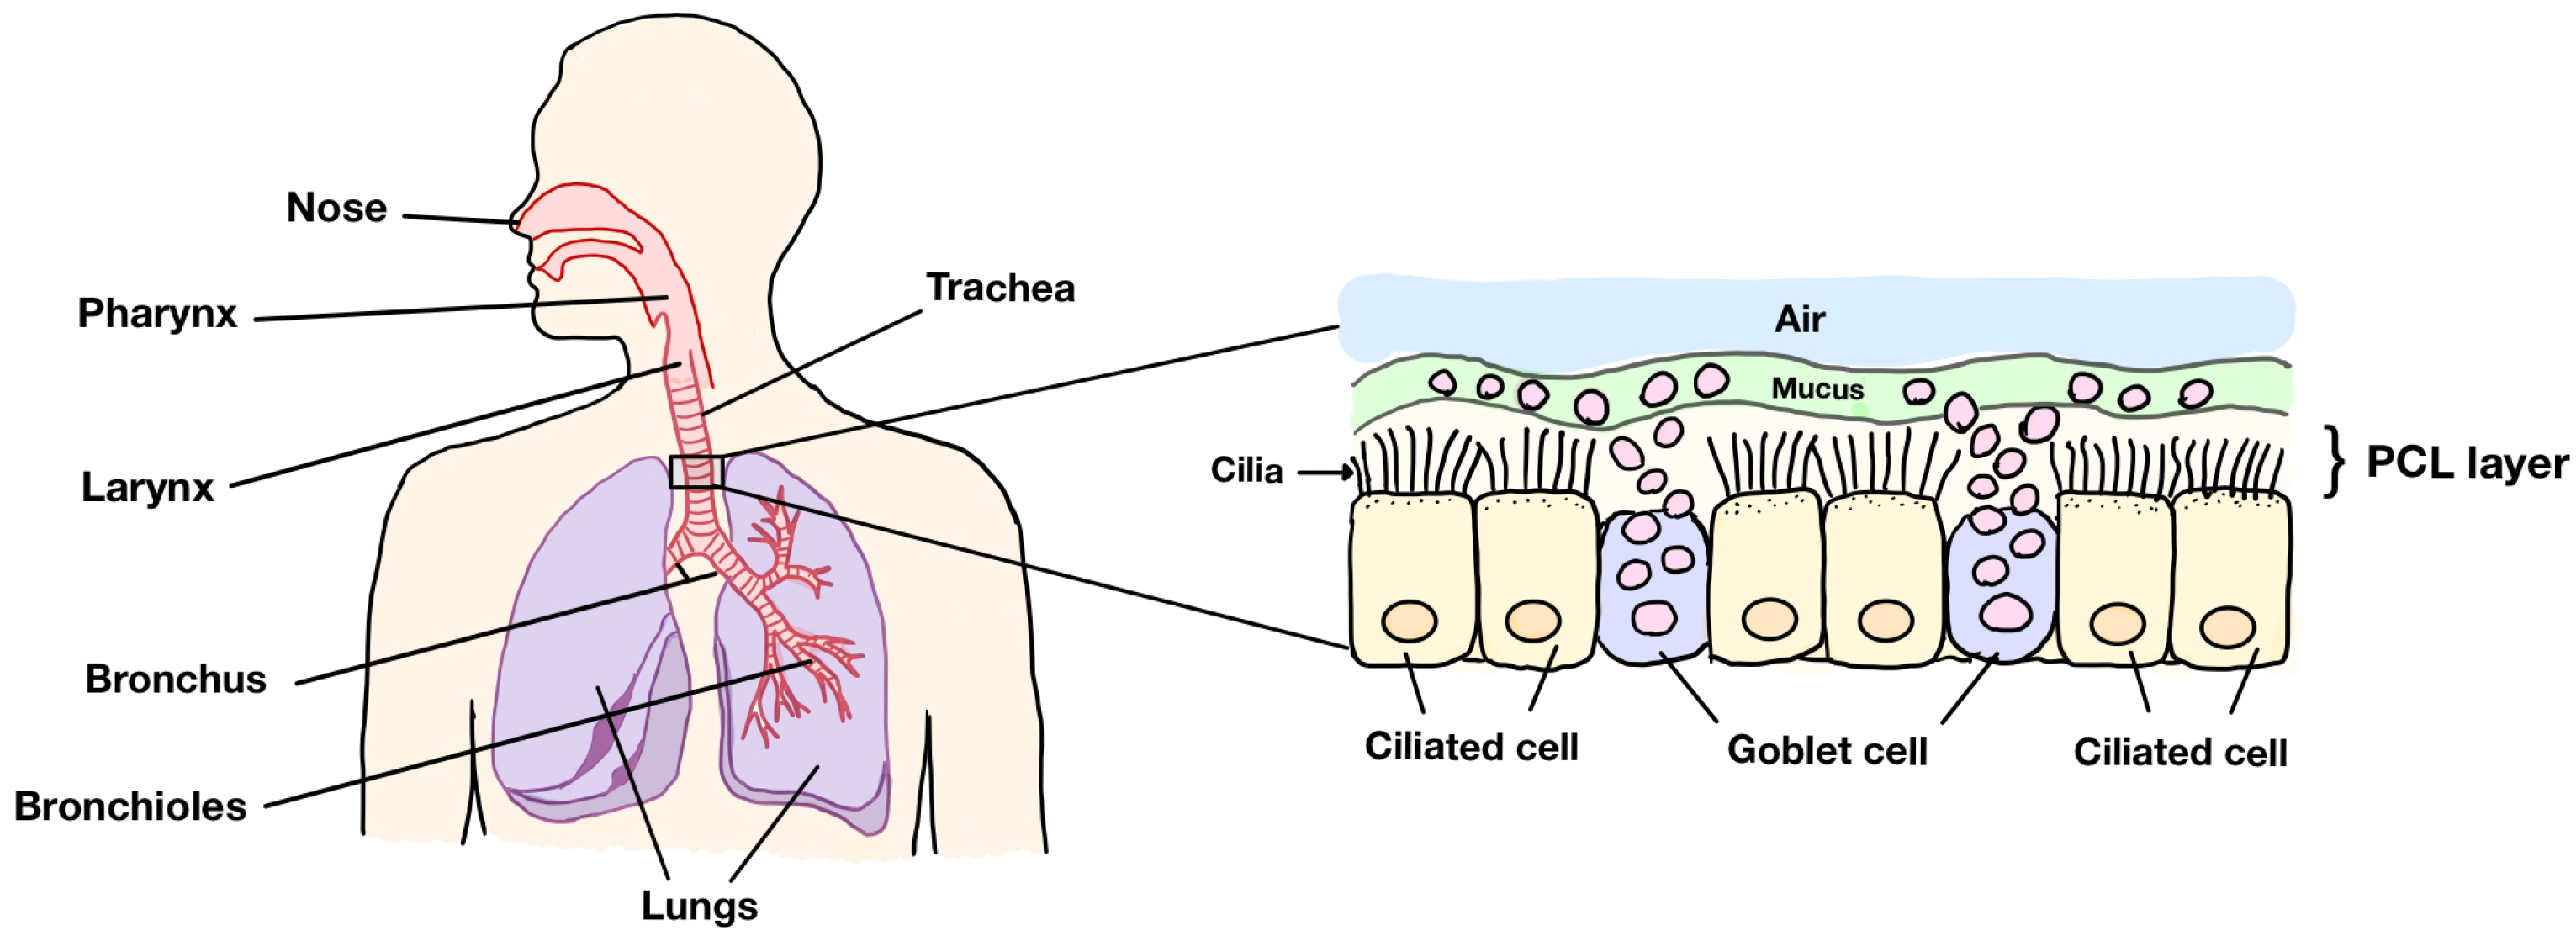
Figure 1 illustrates the human respiratory system (left) and a portion of the trachea in the respiratory tract (right). The system consists of the nose, pharynx, larynx, trachea, bronchus, bronchioles, and lungs. When closely inspecting the trachea, we can see that there are three main layers in the right figure: the periciliary layer (PCL), the mucus region, and the air at the top layer. In the respiratory tract, cilia are found in the PCL. The PCL also contains fluid that is considered to be an incompressible Newtonian fluid because the PCL fluid is a fluid similar to water in its properties, such as viscosity [
4]. The fluid in this layer is called PCL fluid. The area under the PCL is comprised of goblet cells scattering among the ciliated cells. The ciliated cell is the cell membrane where the cilia reside on the top of the cell. The goblet cells contain mucus granules, which secrete mucus to trap strange particles entering the human body. After capturing foreign particles, mucus forms a layer at the tips of cilia. To prevent the accumulation of mucus in the lungs, cilia beat forward and backward producing metachronal waves, which fully expand during the forward stroke and then bend close to the epithelium before rotating back to the beginning of the forward stroke to push mucus out of the lungs. This system is known as mucociliary clearance in human lungs. Above the mucus layer is the air row, which is the path for bringing oxygen in and sending carbon dioxide out of the body. In this research, we focus on the velocity of the fluid in the PCL moved via the movement of cilia, rather than a pressure gradient. Since the PCL consists of both solid phases (cilia) and the liquid phase (the PCL fluid) and the PCL has interconnected pores through which fluids can move, which is the characteristic of a porous medium, we consider the PCL a porous medium.
Problems of the PCL have been studied by several researchers [
5,
6,
7,
8,
9,
10,
11,
12,
13,
14]. For example, Zhu et al. [
5] proposed a two-dimensional model to explore the migration law of particles due to cilium beat in the PCL of the human respiratory tract using the immersed boundary-lattice Boltzmann method. Poopra and Wuttanachamsri [
6] provide boundary conditions at the top of the PCL due to the ciliary movement. Vanaki et al. [
7] studied the fluid flow in the PCL driven by cilia using the finite difference method and the immersed boundary method. Jayathilake et al. [
8] developed a three-dimensional numerical model to simulate human pulmonary cilia motion in the PCL and investigated the effects of the phase difference between cilia, the cilia beating frequency, the viscosity of PCL, the PCL height, and the ciliary length affecting the PCL fluid motion. Phaenchat and Wuttanachamsri [
14] determined the velocity of the PCL fluid in a two-dimensional domain. They used the nonlinear Brinkman equation in the porous medium. The equation was solved using a mixed finite element method combined with Newton’s method.
Many researchers have studied the fluid flow through porous domains using the Brinkman equation both analytically and numerically. For example, analytical studies focused on proving the well-posedness of the equation [
15,
16,
17,
18,
19,
20,
21]. Conti and Giorgini [
15] proved the existence and uniqueness of the Brinkman–Cahn–Hilliard system with logarithmic free energy density for the motion of binary fluids with different viscosities. Titi and Trabelsi [
16] derived the existence and uniqueness of a three-dimensional Brinkman–Forchheimer–Bénard convection model for an incompressible fluid in a closed sample of a porous medium. For numerical solutions of the Brinkman equation, they were studied by several researchers [
22,
23,
24,
25,
26,
27,
28,
29,
30,
31] in many aspects. For example, Wuttanachamsri [
23] observed the velocity of the PCL fluid and the shape of the free boundary at the tips of cilia when the fluid was driven via cilia movement using a one-dimensional Brinkman equation with the Stefan problem. Basirat et al. [
24] predicted the flow and transport of gaseous CO
2 in a porous medium using the Darcy–Brinkman equation with COMSOL software based on the finite element method. Wuttanachamsri and Schreyer [
25] applied a mixed finite element method of the Taylor–Hood type to the Stokes–Brinkman equations to find the PCL fluid velocities due to the cilia beating in a three-dimensional domain. Nishad et al. [
26] proposed a new Boundary Integral Equation (BIE) method and also investigated the two-dimensional Brinkman flow of incompressible Newtonian fluids through a porous channel. Cortez et al. [
28] provided the exact and numerical solutions for the Brinkman equation in a three-dimensional domain where the incompressible flow was driven by regularized forces. Kanafiah et al. [
30] investigated the numerical results of the Brinkman–viscoelastic fluid model for mixed convection transport via a horizontal circular cylinder saturated in a porous domain. Pranowo and Wijayanta [
31] proposed the numerical solutions of the Darcy–Brinkman–Forchheimer model for forced–convective fluid flow in a porous medium using the Direct Meshless Local Petrov–Galerkin (DMLPG) method. Most of the previous literature had studied the numerical solutions of the Brinkman equation when the fluid moved by the pressure gradient. Although some works [
6,
11,
12,
14,
23,
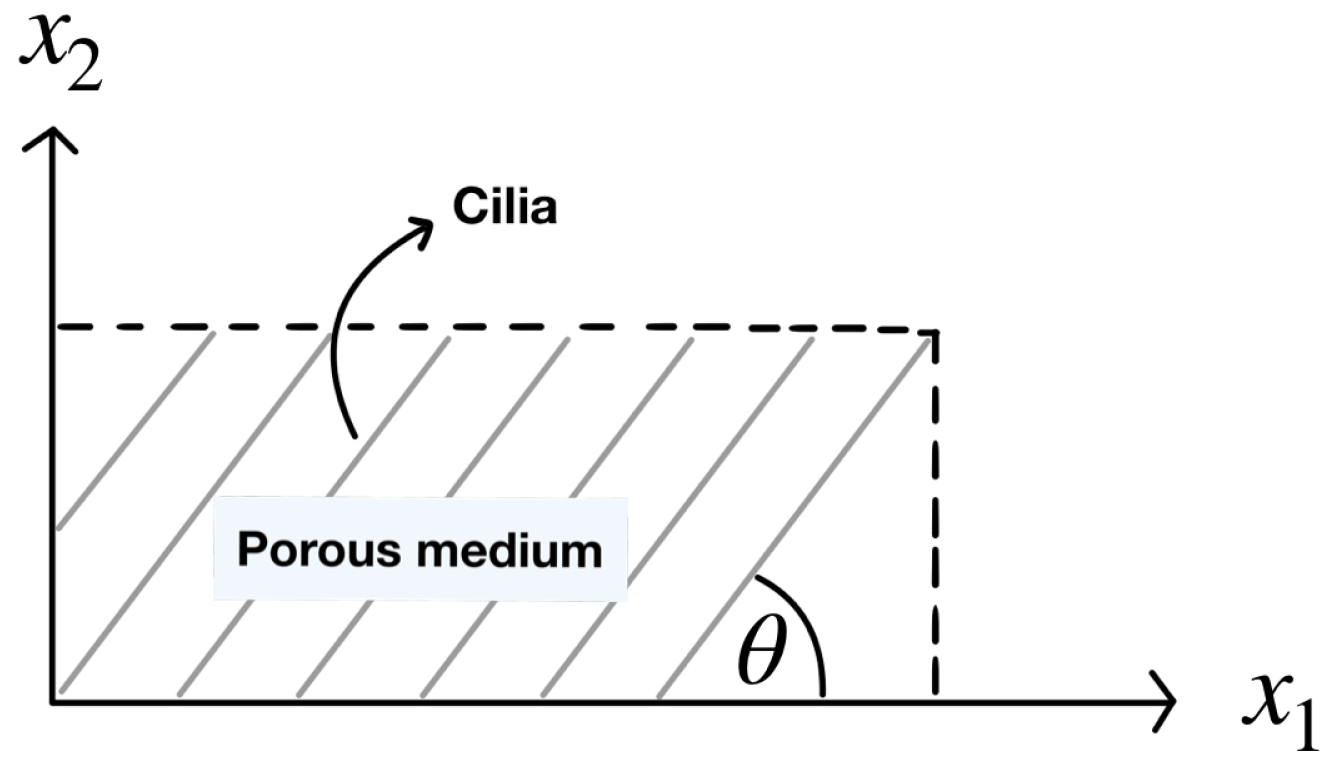
25] considered the fluid velocity due to the movement of the solid phases, they assumed that the porosity was a constant, and they calculated the numerical results for a fixed angle
on a rectangular domain, as shown in
Figure 2.
Figure 2 illustrates a rectangular porous domain composed of cilia that make an angle
with the horizontal plane. In fact, the angle
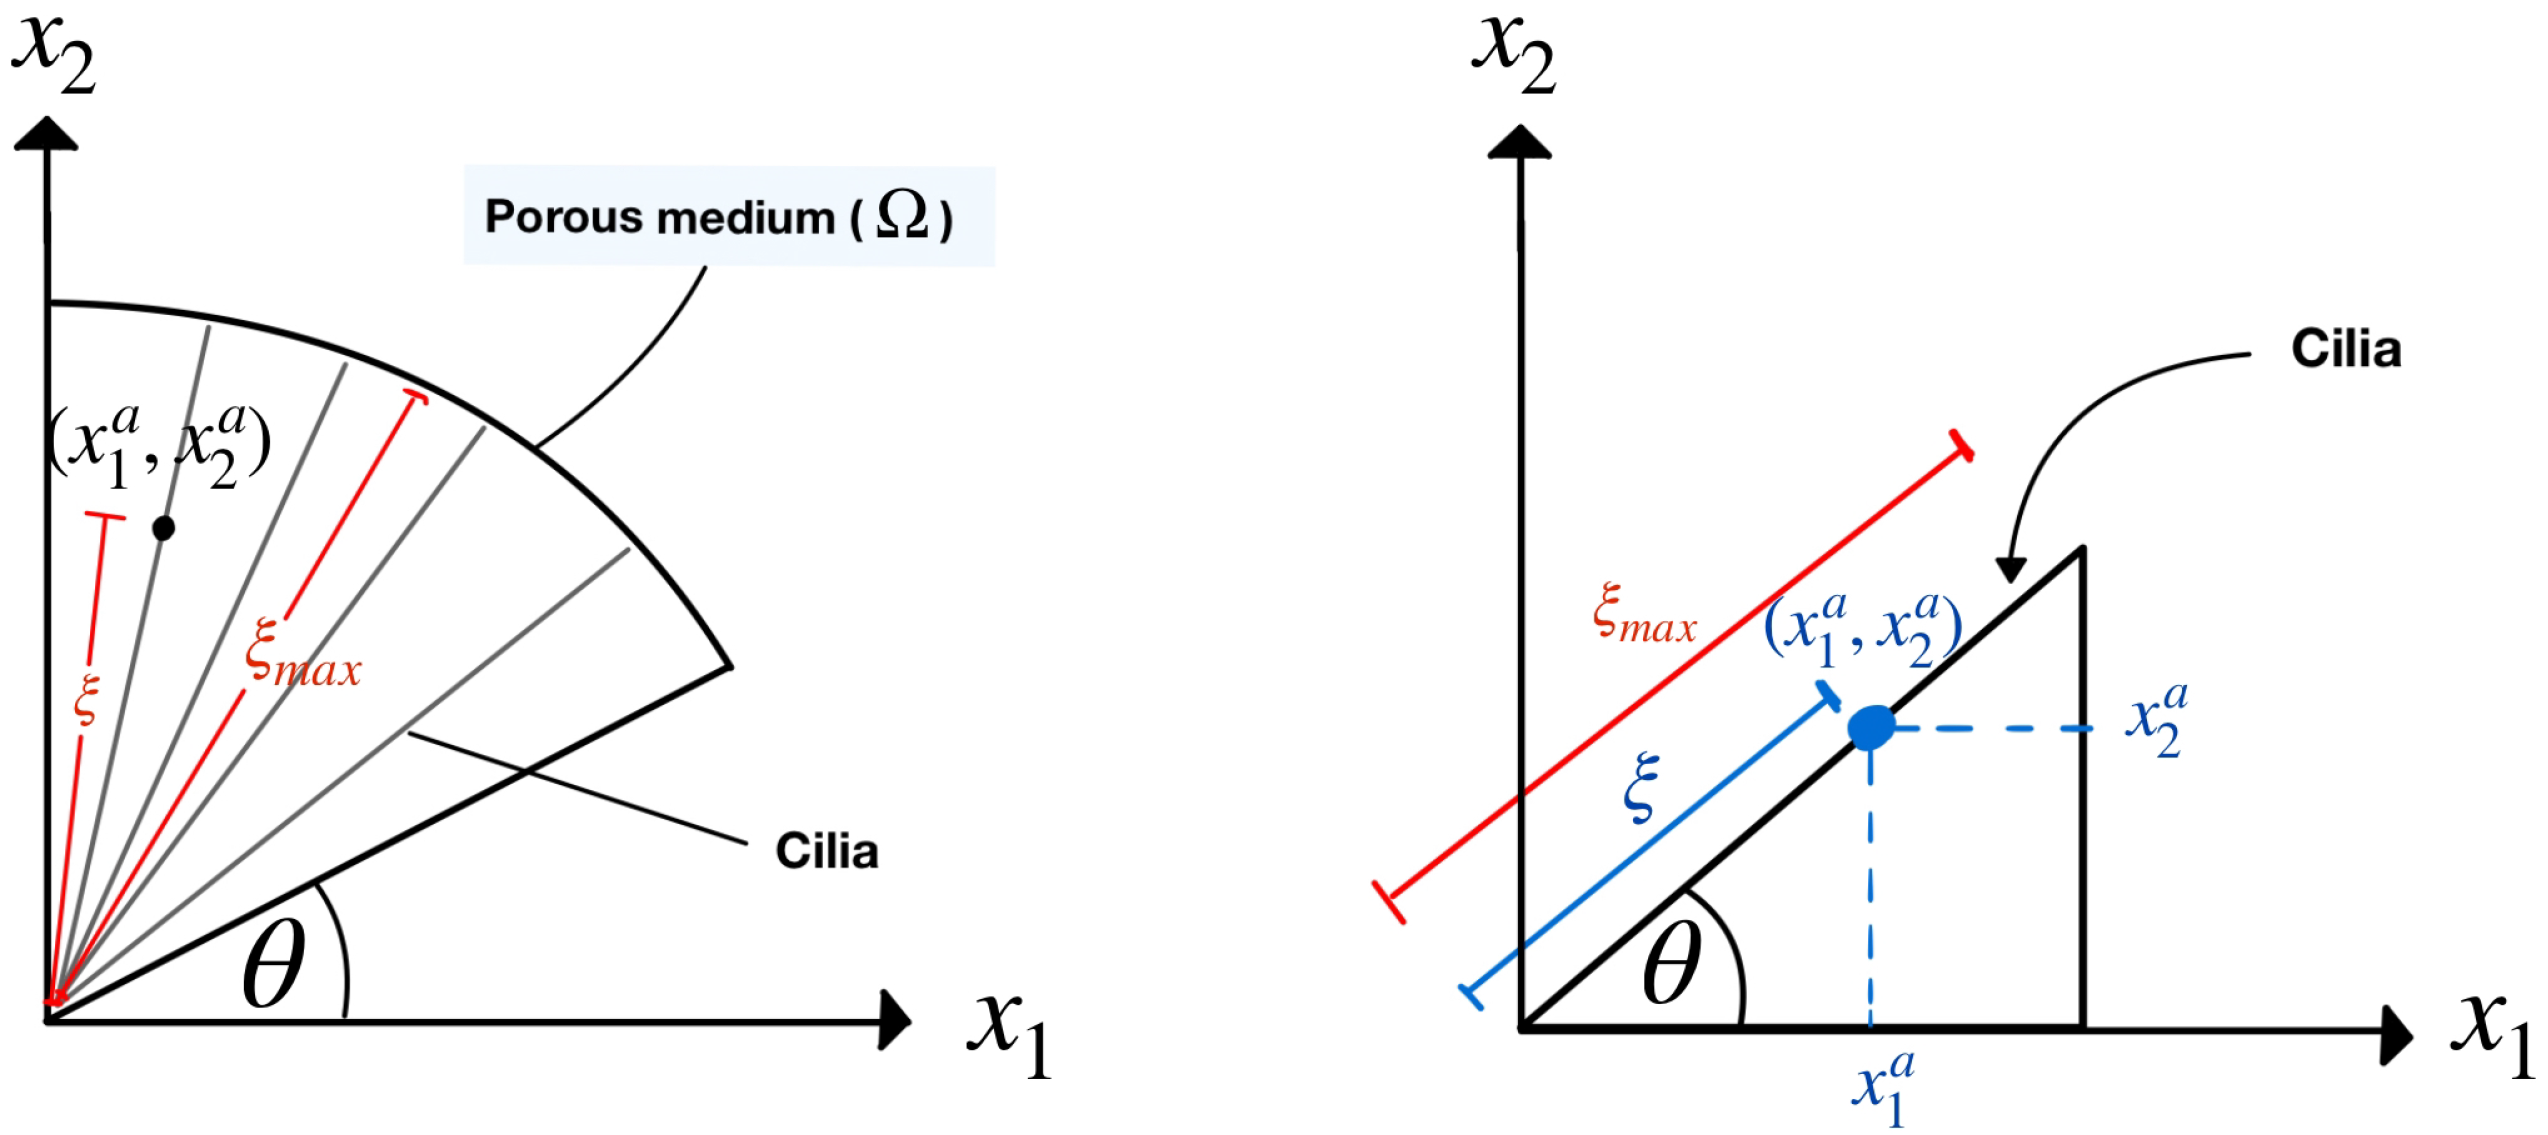
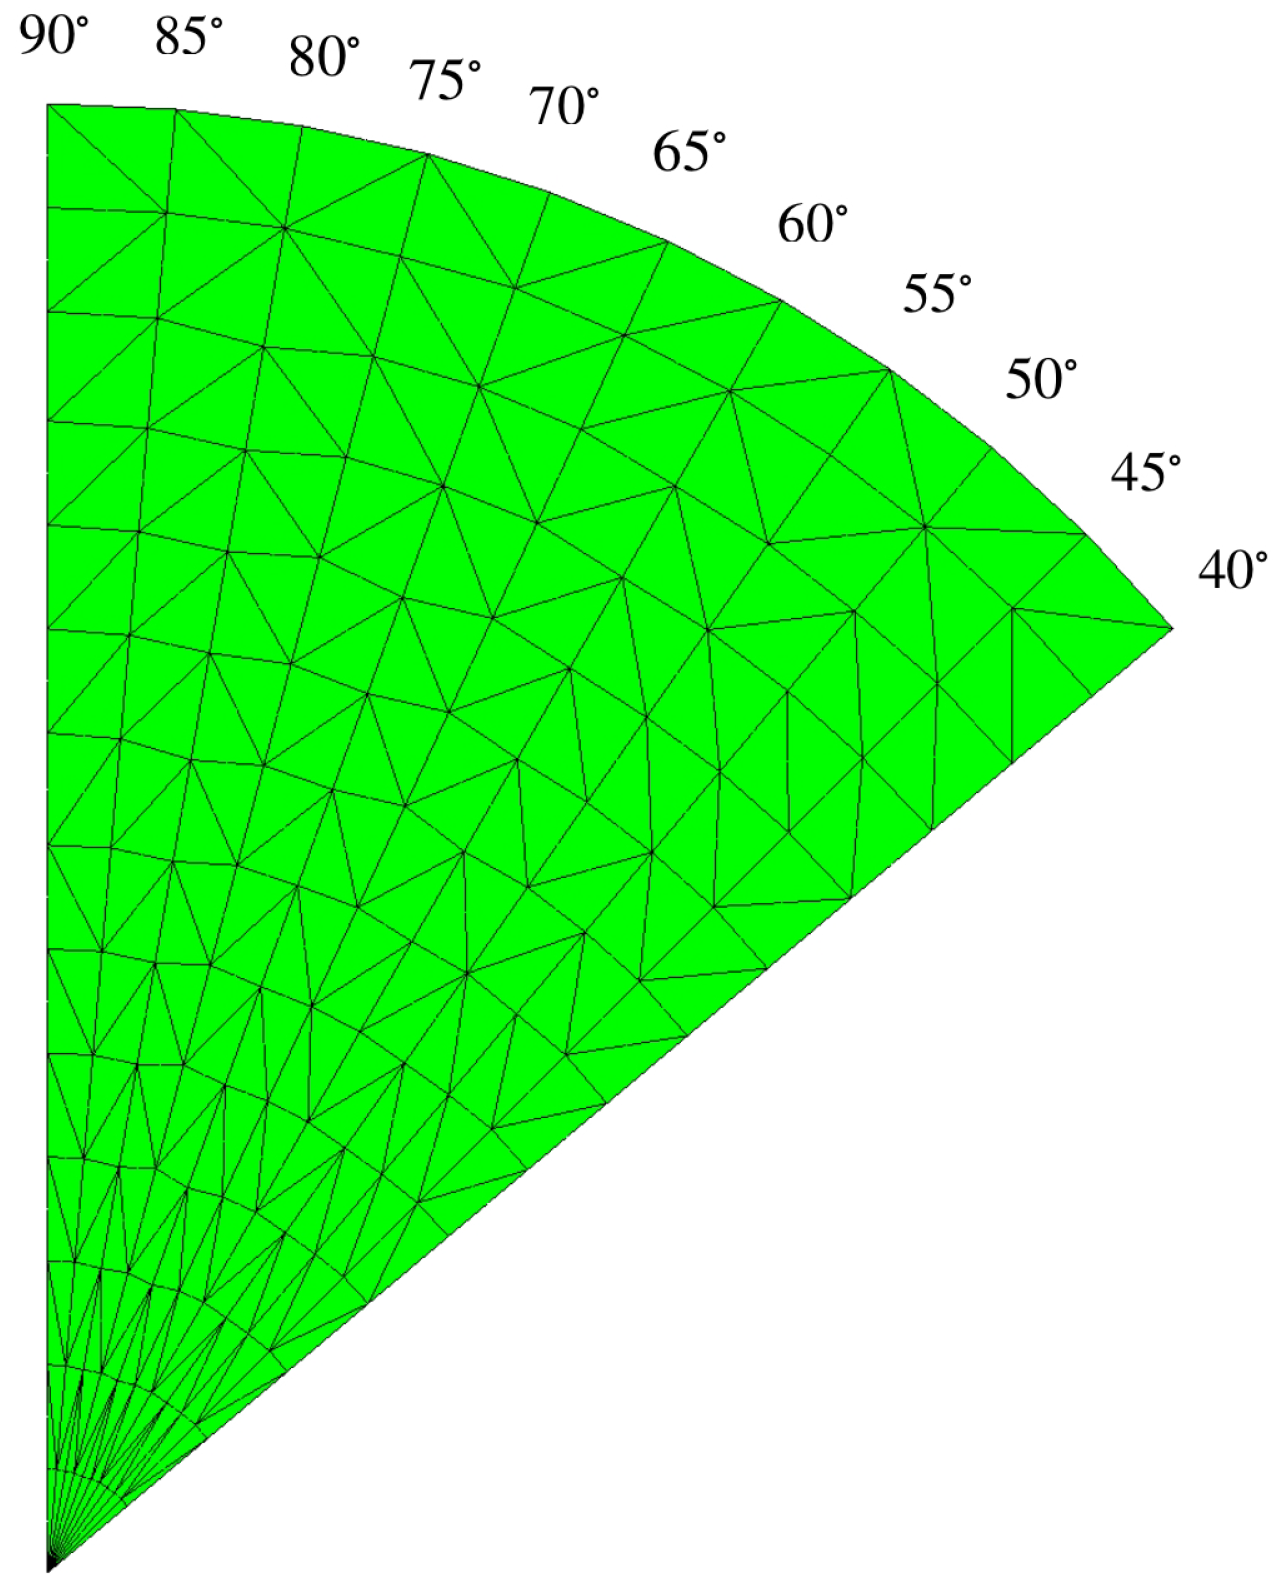
and the porosity should be varied in the numerical domain because of the metachronal waves of cilia. Unlike the other researchers, in this work, we define the numerical domain in the shape of a fan blade, resembling the wave pattern of cilia, as shown on the left side of
Figure 3, where the cilia are monitored as rigid cylinders because they have long and thin lines. Based on our information, this shape of the domain was not studied in the previous literature. The model designed is more closely to the actual beating pattern of cilia in that the cilia rotate as a clockwise pattern moving from left to right around their base. The movement of cilia generates the leftward flow of the PCL fluid.
Figure 3 on the left shows our numerical porous domain with the angular movement of the cilia. The angle
represents the angle that the cilia make with the horizontal plane. In previous research, scholars have not studied various angles,
, in one fixed numerical domain. They considered only one angle,
, for one fixed numerical domain. Notice that there are numerous angles,
, in our one fixed numerical domain. Since there are several angles,
, in the domain, the porosity cannot be used as a constant. So, the porosity in this work is considered a function of the angle,
, not a constant. The variable
is the dimensionless length along cilia, which is the distance from the roots of the cilia to a point
on the cilia divided by the length of the cilia, which is approximately 7.5 µm [
32].
Figure 3 on the right shows that, at each point
on the cilia, we can calculate the variable
using the formula
and the angle
, and the variable
represents the dimensionless length of the cilia, which is one. Because we consider the movement of bundles of cilia affecting the movement of the PCL fluid, we use the generalized Brinkman equation [
33] on a macroscopic scale to predict the velocity of the PCL fluid in the porous medium. The mathematical model we use is derived in [
33], which is a macroscale equation determined from an upscaling technique called Hybrid Mixture Theory (HMT) [
34,
35,
36] and the nondimensionalization method. This model is more general than the Brinkman equation in the literature because we choose to use the equation that the porosity in this equation is considered as a function since the beginning of the derivation starting from the conservation of momentum. The generalized Brinkman equation is not only derived in [
33] but the authors have also proved the existence and uniqueness of the numerical solution when the equation is applied via a mixed finite element method. In [
33], the authors used the Lax–Milgram theorem to prove the well-posedness of the equation. To the author’s knowledge, the generalized Brinkman equation was not solved numerically in any literature before. It is solved for the first time in this work. The aim of this research is to determine the velocity of the PCL fluid in the fan-blade shape of the porous domain using the generalized Brinkman equation, in which the fluid is driven by the beating of cilia.
Our mathematical model and boundary conditions are provided in
Section 2. To determine the numerical solutions, we discretize the governing equation by using a mixed finite element method in
Section 3. The velocity of cilia, permeability, and porosity are described in
Section 4. The validation of the numerical solutions is presented in
Section 5, and the numerical results are illustrated in
Section 6. The validation and numerical results are computed from our own code using MatLab R2025a. The conclusions are drawn in
Section 7.
3. Model Discretization
In this section, we discretize the system of equations, Equations (
11) and (
12) using a mixed finite element method. We begin with the generalized Brinkman equation in the indicial notation for two dimensions,
for
and
where
g is gravity. The index
i indicates the number of equations, and the repeated index
j indicates summation. Let
be the Hilbert space and
be the Sobolev space, defined as follows,
To find
, we first provide the weak formulation of Equation (
16). The weak formulation is the lower-order integral equations obtained from multiplying the higher-order differential Equation (
16) by a weight function and then integrating over the domain and after that applying the Green’s identity, which is integration by parts in one dimension, to the integral equation. To find the weak formulation, we multiply Equation (
16) by a weight function,
, and then we integrate over the domain
both sides. Therefore, the Equation (
16) becomes
The repeated index
i in Equation (
18) means the equation number, not a summation. Applying Green’s identity to the second and third terms in Equation (
18), we have
Substituting
into Equation (
19), we obtain the weak formulation of Equation (
11), which is
where
is the outward unit normal vector,
.
To obtain the weak formulation of the continuity Equation (
12), we apply the same process as we have done with Equation (
11). We begin with the indicial notation of Equation (
12)
where, again, the repeated index
j is the summation. Considering the term
in Equation (
21), we have
Using the angular velocity to determine
, we obtain
[
25]. Then,
where
is the speed of the solid velocity. Substituting Equation (
23) into Equation (
21) and applying the product rule to the last term of Equation (
21), we obtain
Multiplying a weight function
to Equation (
24) and then integrating the equation over the domain
both sides, we obtain the weak formulation of the continuity equation, which is
where we multiply
both sides of the weak formulation in order to obtain the symmetric form of the stiffness matrix Equation (
39), shown below. The well-posedness of the weak Formulations (
20) and (
25) is proven in [
33]. Next, we discretize the domain
into triangular elements and approximate the velocity and the pressure within each element using basis functions from the spaces
and
, respectively, defined below.
Let
be a triangulation of the domain
and we define the finite-dimensional subspaces of
and
as [
40]
respectively. Since
. The solutions
is approximated by the expansions of the forms
where
and
are the basis functions, the vector
and
are their vector forms,
, and
are vectors of the velocities and pressure, respectively, and the superscript
T represents the transpose. The constants
M and
L are integers determined by the interpolation functions. For a triangular element, in this work, we use a quadratic function for the velocities
and a linear function for the pressure
p.
Substituting the vector form of the basis functions
into
and
into
q, and substituting Equations (
28) and (
29) into Equations (
20) and (
25), we have
and
Let
be the element domains, such that
, where the interiors of the elements do not overlap. This decomposition enables the integral over the entire domain
to be written as the sum of integrals over each element domain
, that is
where
n is the total number of elements. Applying Equation (
32) to every integral term in Equations (
30) and (
31), we obtain the equations
where
Rewriting Equations (
33) and (
34) into matrix form for each element
e, we have the element matrix of the system of Equations (
33) and (
34) in 2 dimension as follows,
To return to Equations (
33) and (
34), the local element matrices are assembled to a global matrix in order to get the numerical solution. From Equations (
26)–(
39), this demonstrates the discretization details. In the next section, we present the cilia velocity, permeability, and porosity used in this study.
5. Numerical Validation
Before we provide our numerical results, we first validate our numerical solutions using the discretized model provided in
Section 3, Equation (
39). For this validation, we begin with the two-dimensional numerical domain, as shown in
Figure 4. The domain is in the shape of a portion of a quarter circle. After that, we apply the mesh generator Netgen [
43] to generate a triangular mesh, as shown in
Figure 7.
Figure 7 shows the example of our generated mesh with 5 degrees apart. To validate the numerical result, we use four different mesh refinements. The four discretized domains consist of
, and 704 elements. For the constant variables, we let
g/(μm·s),
g/μm
3, the gravity
μm/s
2, and the coefficient values
in Equation (
14). For the shape functions, we use quadratic triangular elements for the velocity and linear triangular elements for the pressure, confirming the stability of the method known as the Taylor–Hood elements [
44]. Therefore, in Equations (
28) and (
29),
, and
. Next, we clarify the value of the inverse of the permeability tensor,
, used in our program. Because the polynomial function (
40) used to approximate the permeability tensor is the function that depends on
, for each
where
, we have six values per element. In this work, for each element, we average the 6 values of each
and use the average value of each
to find the numerical solutions. We then compute the inverse of the matrix
to obtain
for each element.
For the solid velocity, we approximate the solid velocity in Equations (
37) and (
38) as
where
is the vector of solid velocities
.
For the porosity, we use the same process of calculating the permeability tensor to compute the value of the porosity
because the porosity
is a function that depends on
. That is, we use the average value of the porosity
for each element to find the numerical solutions. For the term
in Equation (
38), to compute the numerical solution, we approximate the derivative of the porosity as
where
is the vector value of
, consisting of six nodes per element. These values will be substituted into Equation (
39) to calculate the numerical solutions.
To validate the code, we choose to present the velocity profile of the PCL fluid when
. Since, in our work, we consider two cases of the boundary conditions, we provide our numerical results for the two cases.
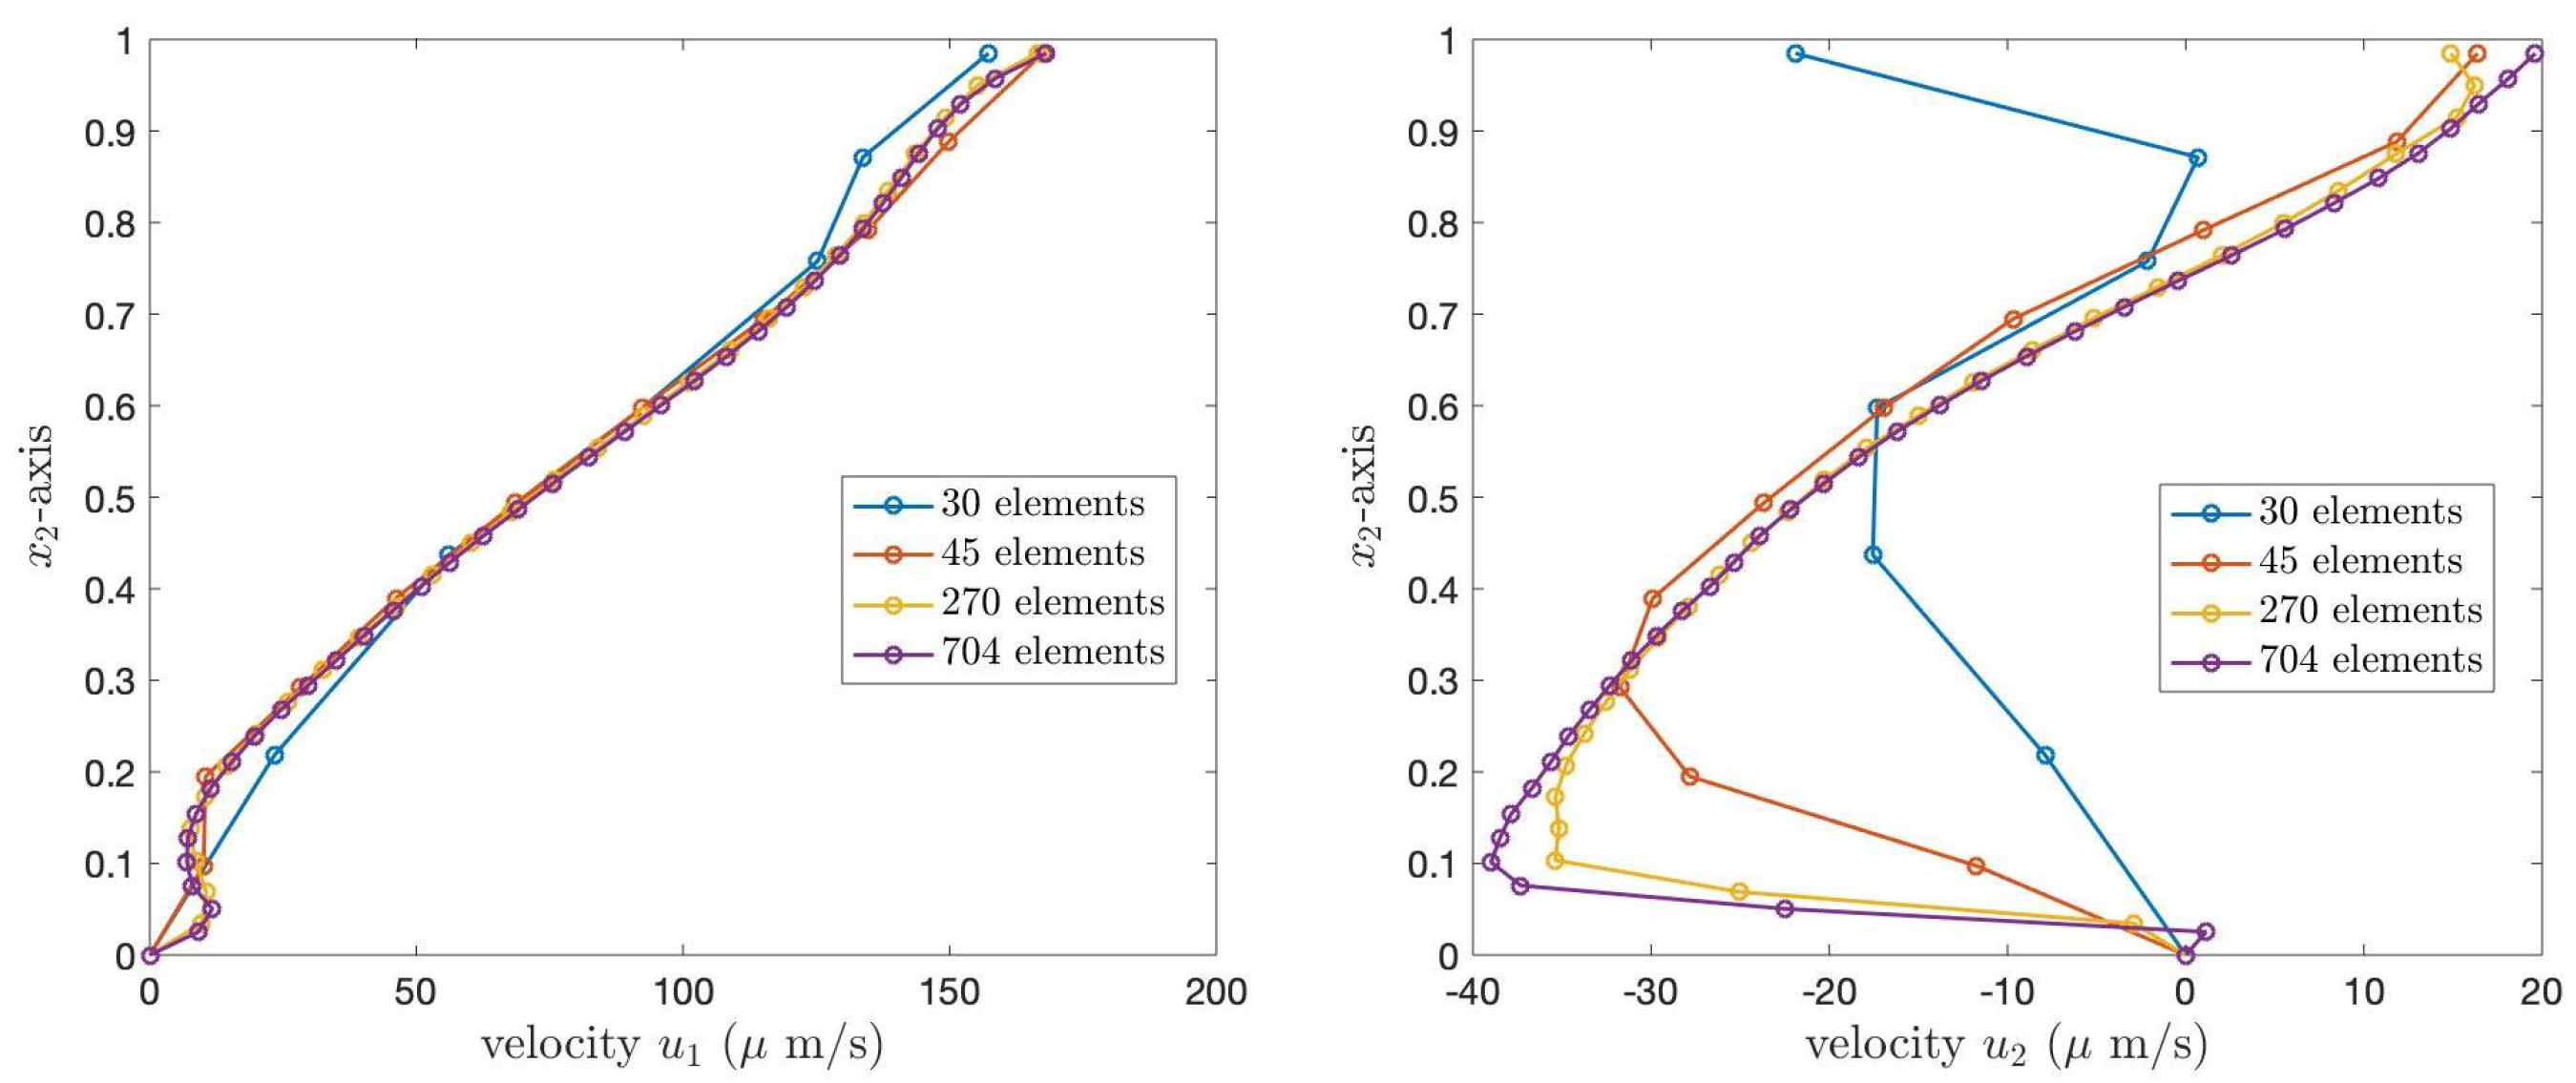
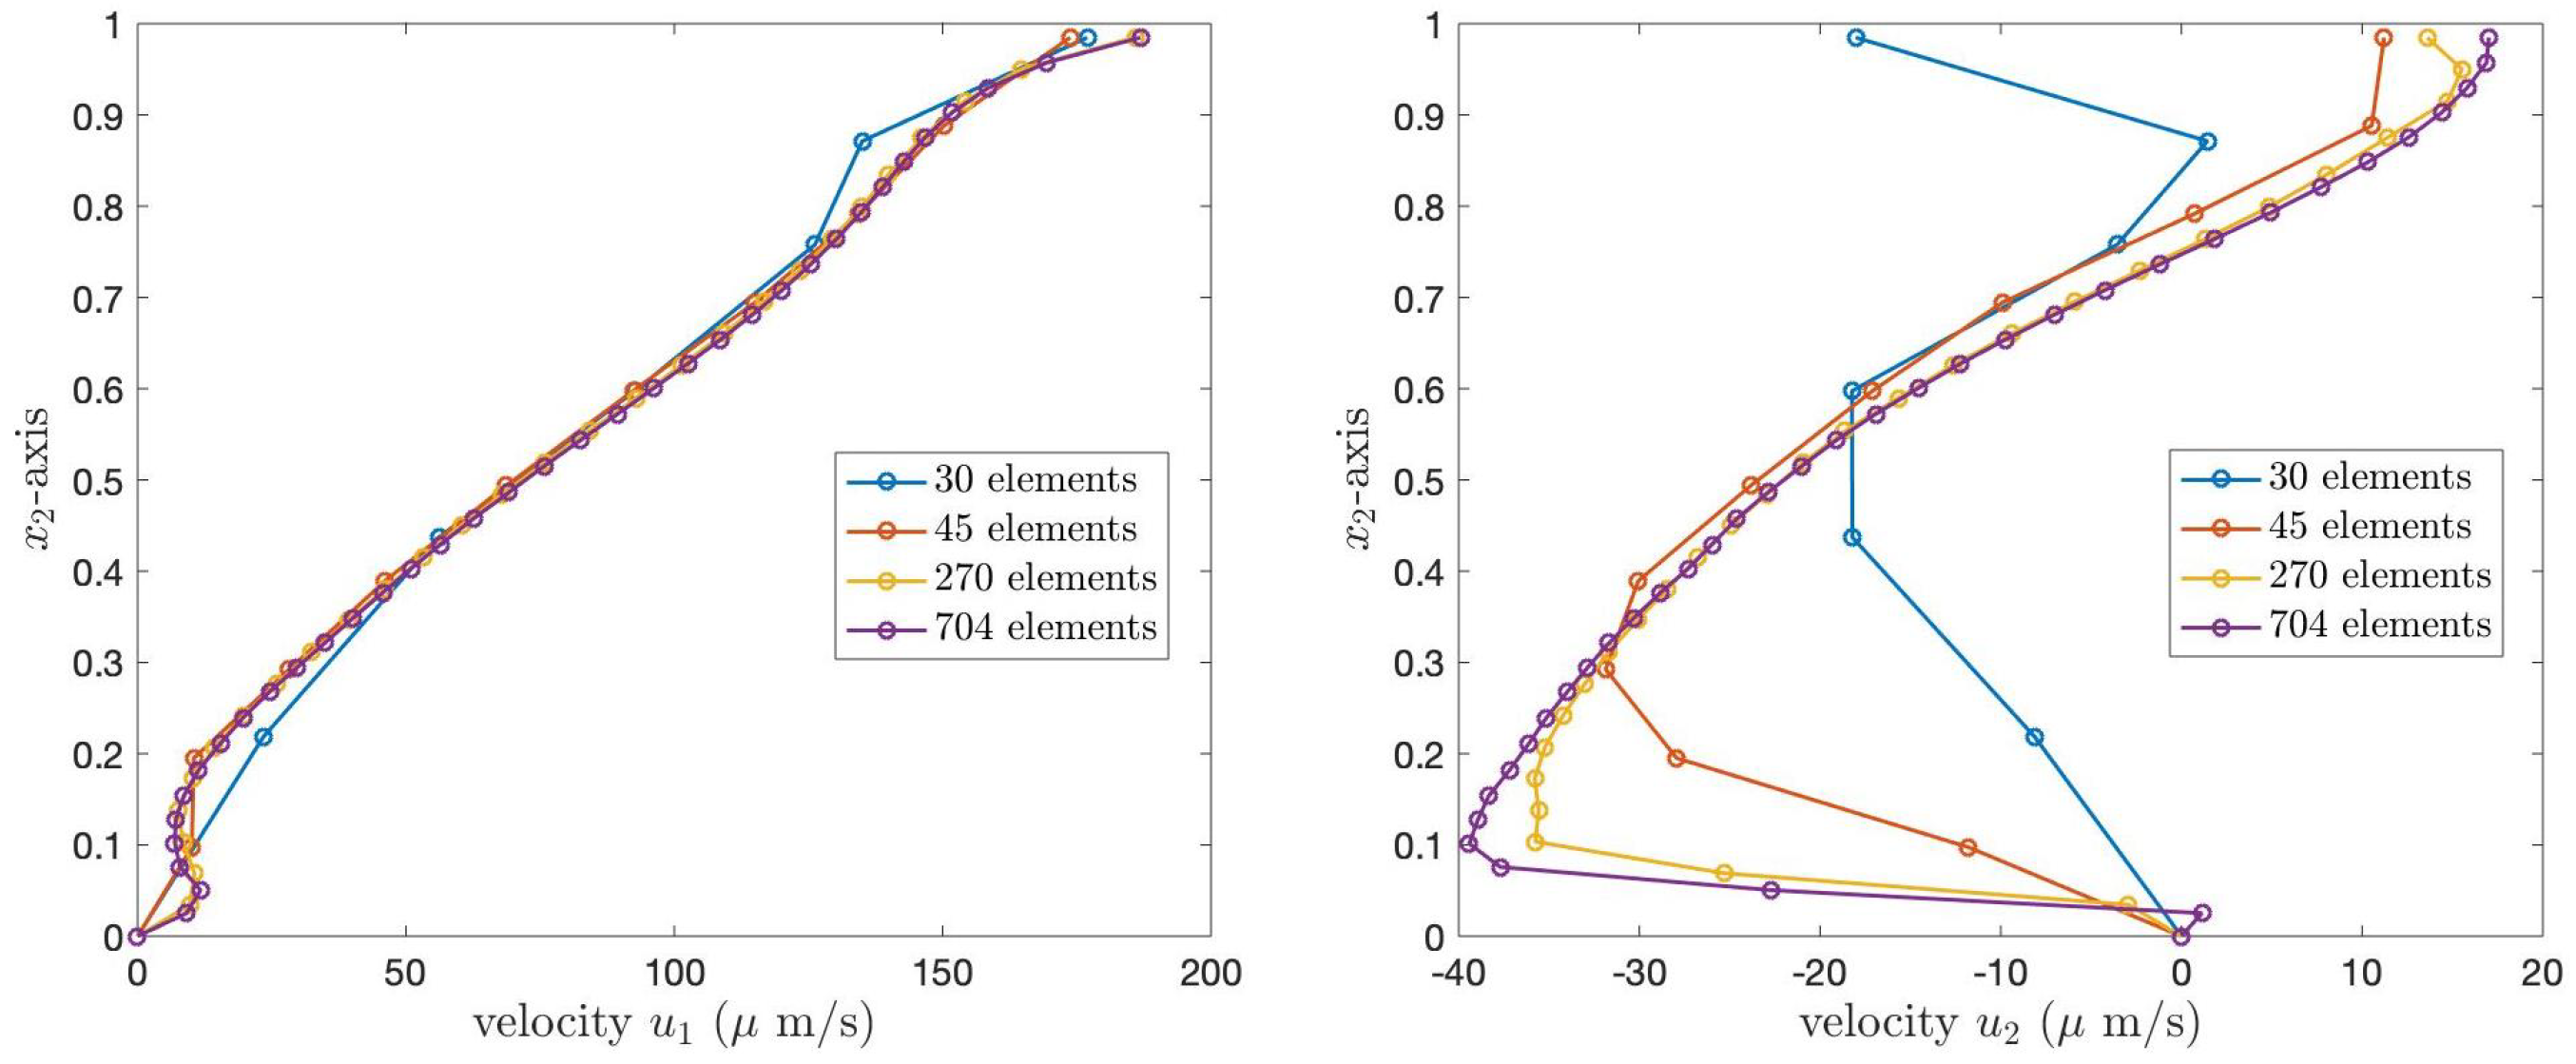
Figure 8 and
Figure 9 illustrate the PCL velocities for Case 1 and Case 2 boundary conditions, respectively. In both figures, the left graph shows the velocity,
, and the right graph presents
. The blue, orange, yellow, and purple lines represent the velocity of the PCL fluid obtained from the grid refinements containing 30, 45, 270, and 704 elements, respectively. In both figures, the numerical solutions obtained from the coarser grids converge to the numerical solutions obtained from the finest grid.
Table 2 presents the
norm errors of the velocities
and
of the PCL fluid at the angle
, compared to the solutions obtained from the finest grid, 704 elements. The results show that the errors decrease as the number of elements increases, illustrating the convergence of the numerical solutions.
6. Numerical Results
The numerical solutions of the generalized Brinkman equation and the continuity equation, Equations (
11) and (
12), are presented in this section. The existence and uniqueness of the numerical solution using the mixed finite element method have been proven in [
33]. We use the two-dimensional finite element method to determine the velocities of the PCL fluid propelled via moving cilia in the porous medium. We present the velocity of the PCL fluid when cilia make an angle of
to
to the horizontal plane. Two cases of the boundary conditions are considered. The values of the dynamic viscosity, fluid density, gravity, and the coefficients
are the same as in
Section 5.
We use the triangular mesh with 270 elements and 579 points generated via Netgen [
43], as shown in
Figure 7. The numerical domain
is divided into 10 subdomains. The first subdomain starts from the leftmost vertical line, at
, to the inclined line, at
. The second subdomain is next to the right of the first subdomain, starting from
to
. Continuing the process until reaching
, we have 10 different subdomains. By using the mixed finite element method of Taylor–Hood type, we obtain the numerical results, which are illustrated in
Figure 10. The first row of
Figure 10 shows the velocities of the PCL fluid using the Case 1 boundary condition. The top left graph represents the velocity
in the
direction, while the top right graph presents the velocity
in the
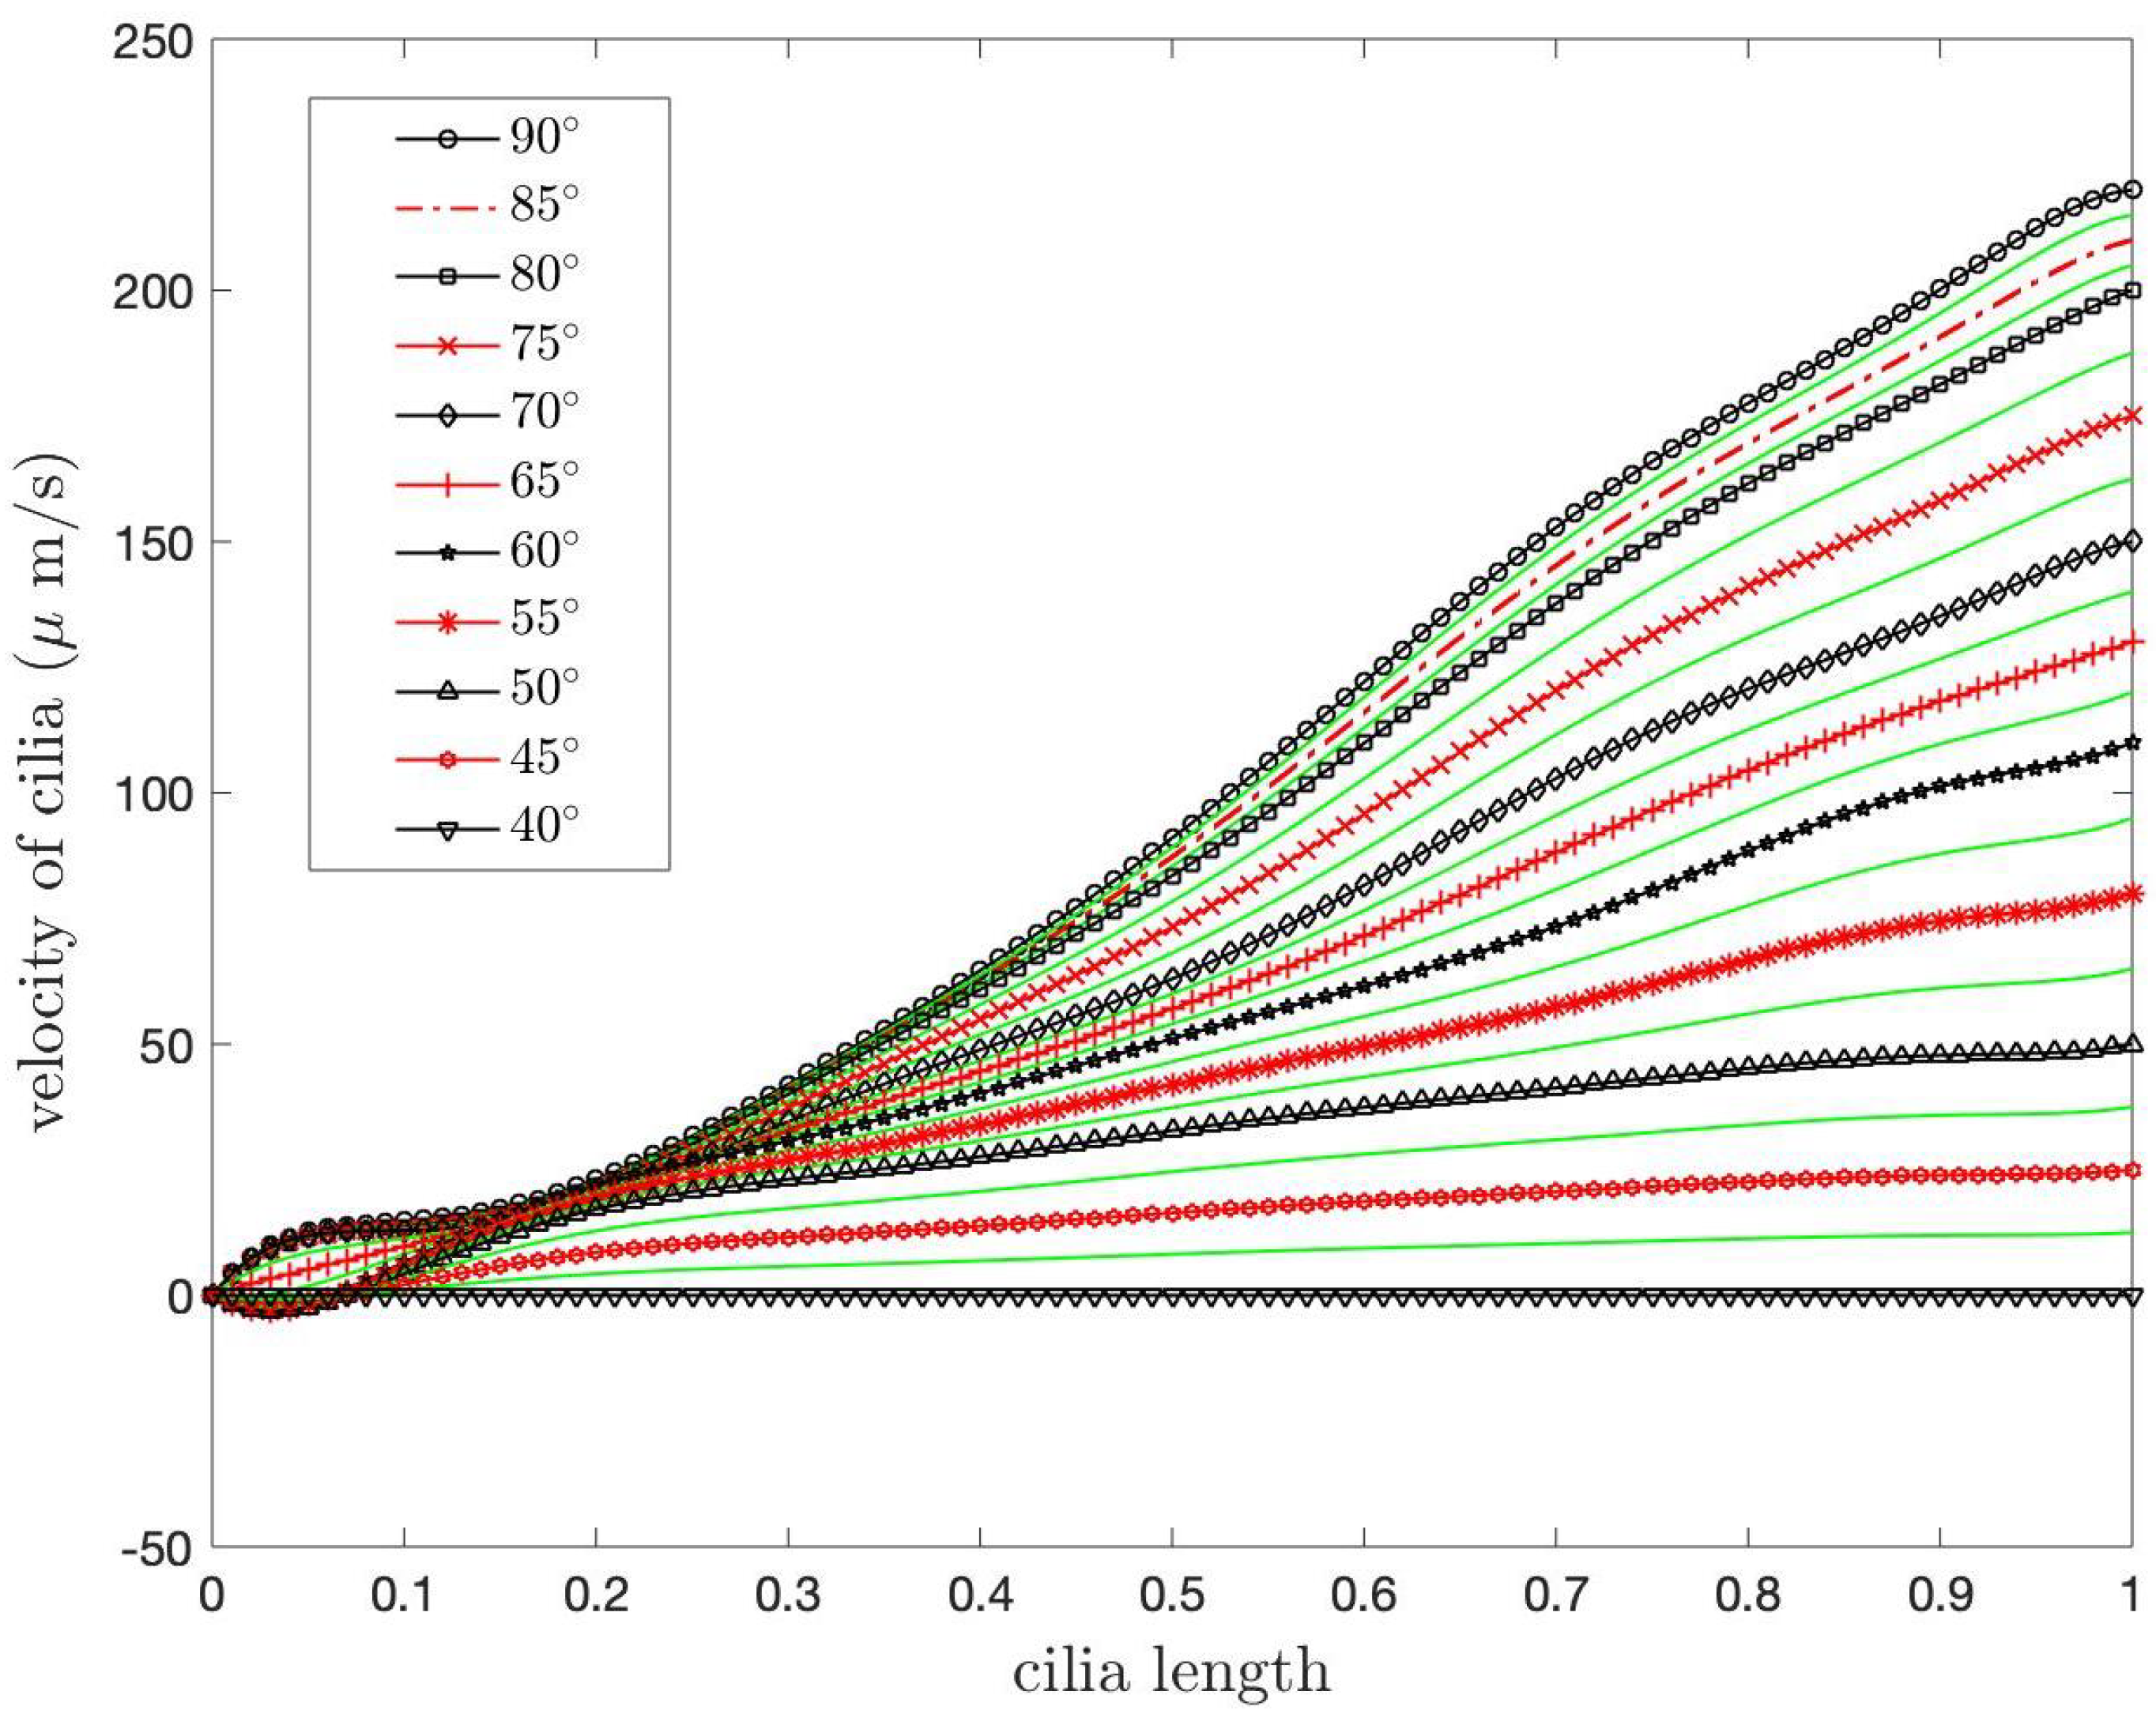
direction. The velocity of the PCL fluid decreases when the angle decreases. This is affected by the velocity of the cilia; see
Figure 6. The velocity
is highest when
, and the velocity is zero at
because the velocity of cilia is highest at
, and the cilia stop beating at
. For the velocity
, when the angle decreases, the velocity
at the tips of cilia decreases from
to
µm/s and then increases slightly until the velocity approaches zero at
. The velocity
is negative because, for the forward bend direction of cilia, the vertical velocity changes from the positive to the negative direction. The second row of
Figure 10 illustrates the velocities
and
of the PCL fluid under the Case 2 boundary condition for the angles ranging from
to
. The bottom left graph presents the velocity,
, and the bottom right graph represents the velocity,
. In this case, we assume that the boundary condition at
, at the tips of the cilia, is unknown. Similar to Case 1, the velocity
of the PCL fluid reduces as the angles decrease, and the maximum velocity of the PCL fluid occurs at the tips of cilia. The difference in
between Case 1 and Case 2 is that the velocity at the tips of cilia in Case 2 appears like a wave, moving up and down at the free interface. Similar to Case 1, the velocity
is highest at the tips of cilia at
. As the angle decreases, the velocity
at the tips of cilia reduces from
to
µm/s before gradually increasing in the positive direction until it reaches zero at
. We also observe that the velocity
at the tips of cilia in this case is smaller than the velocity
in Case 1 for all angles.
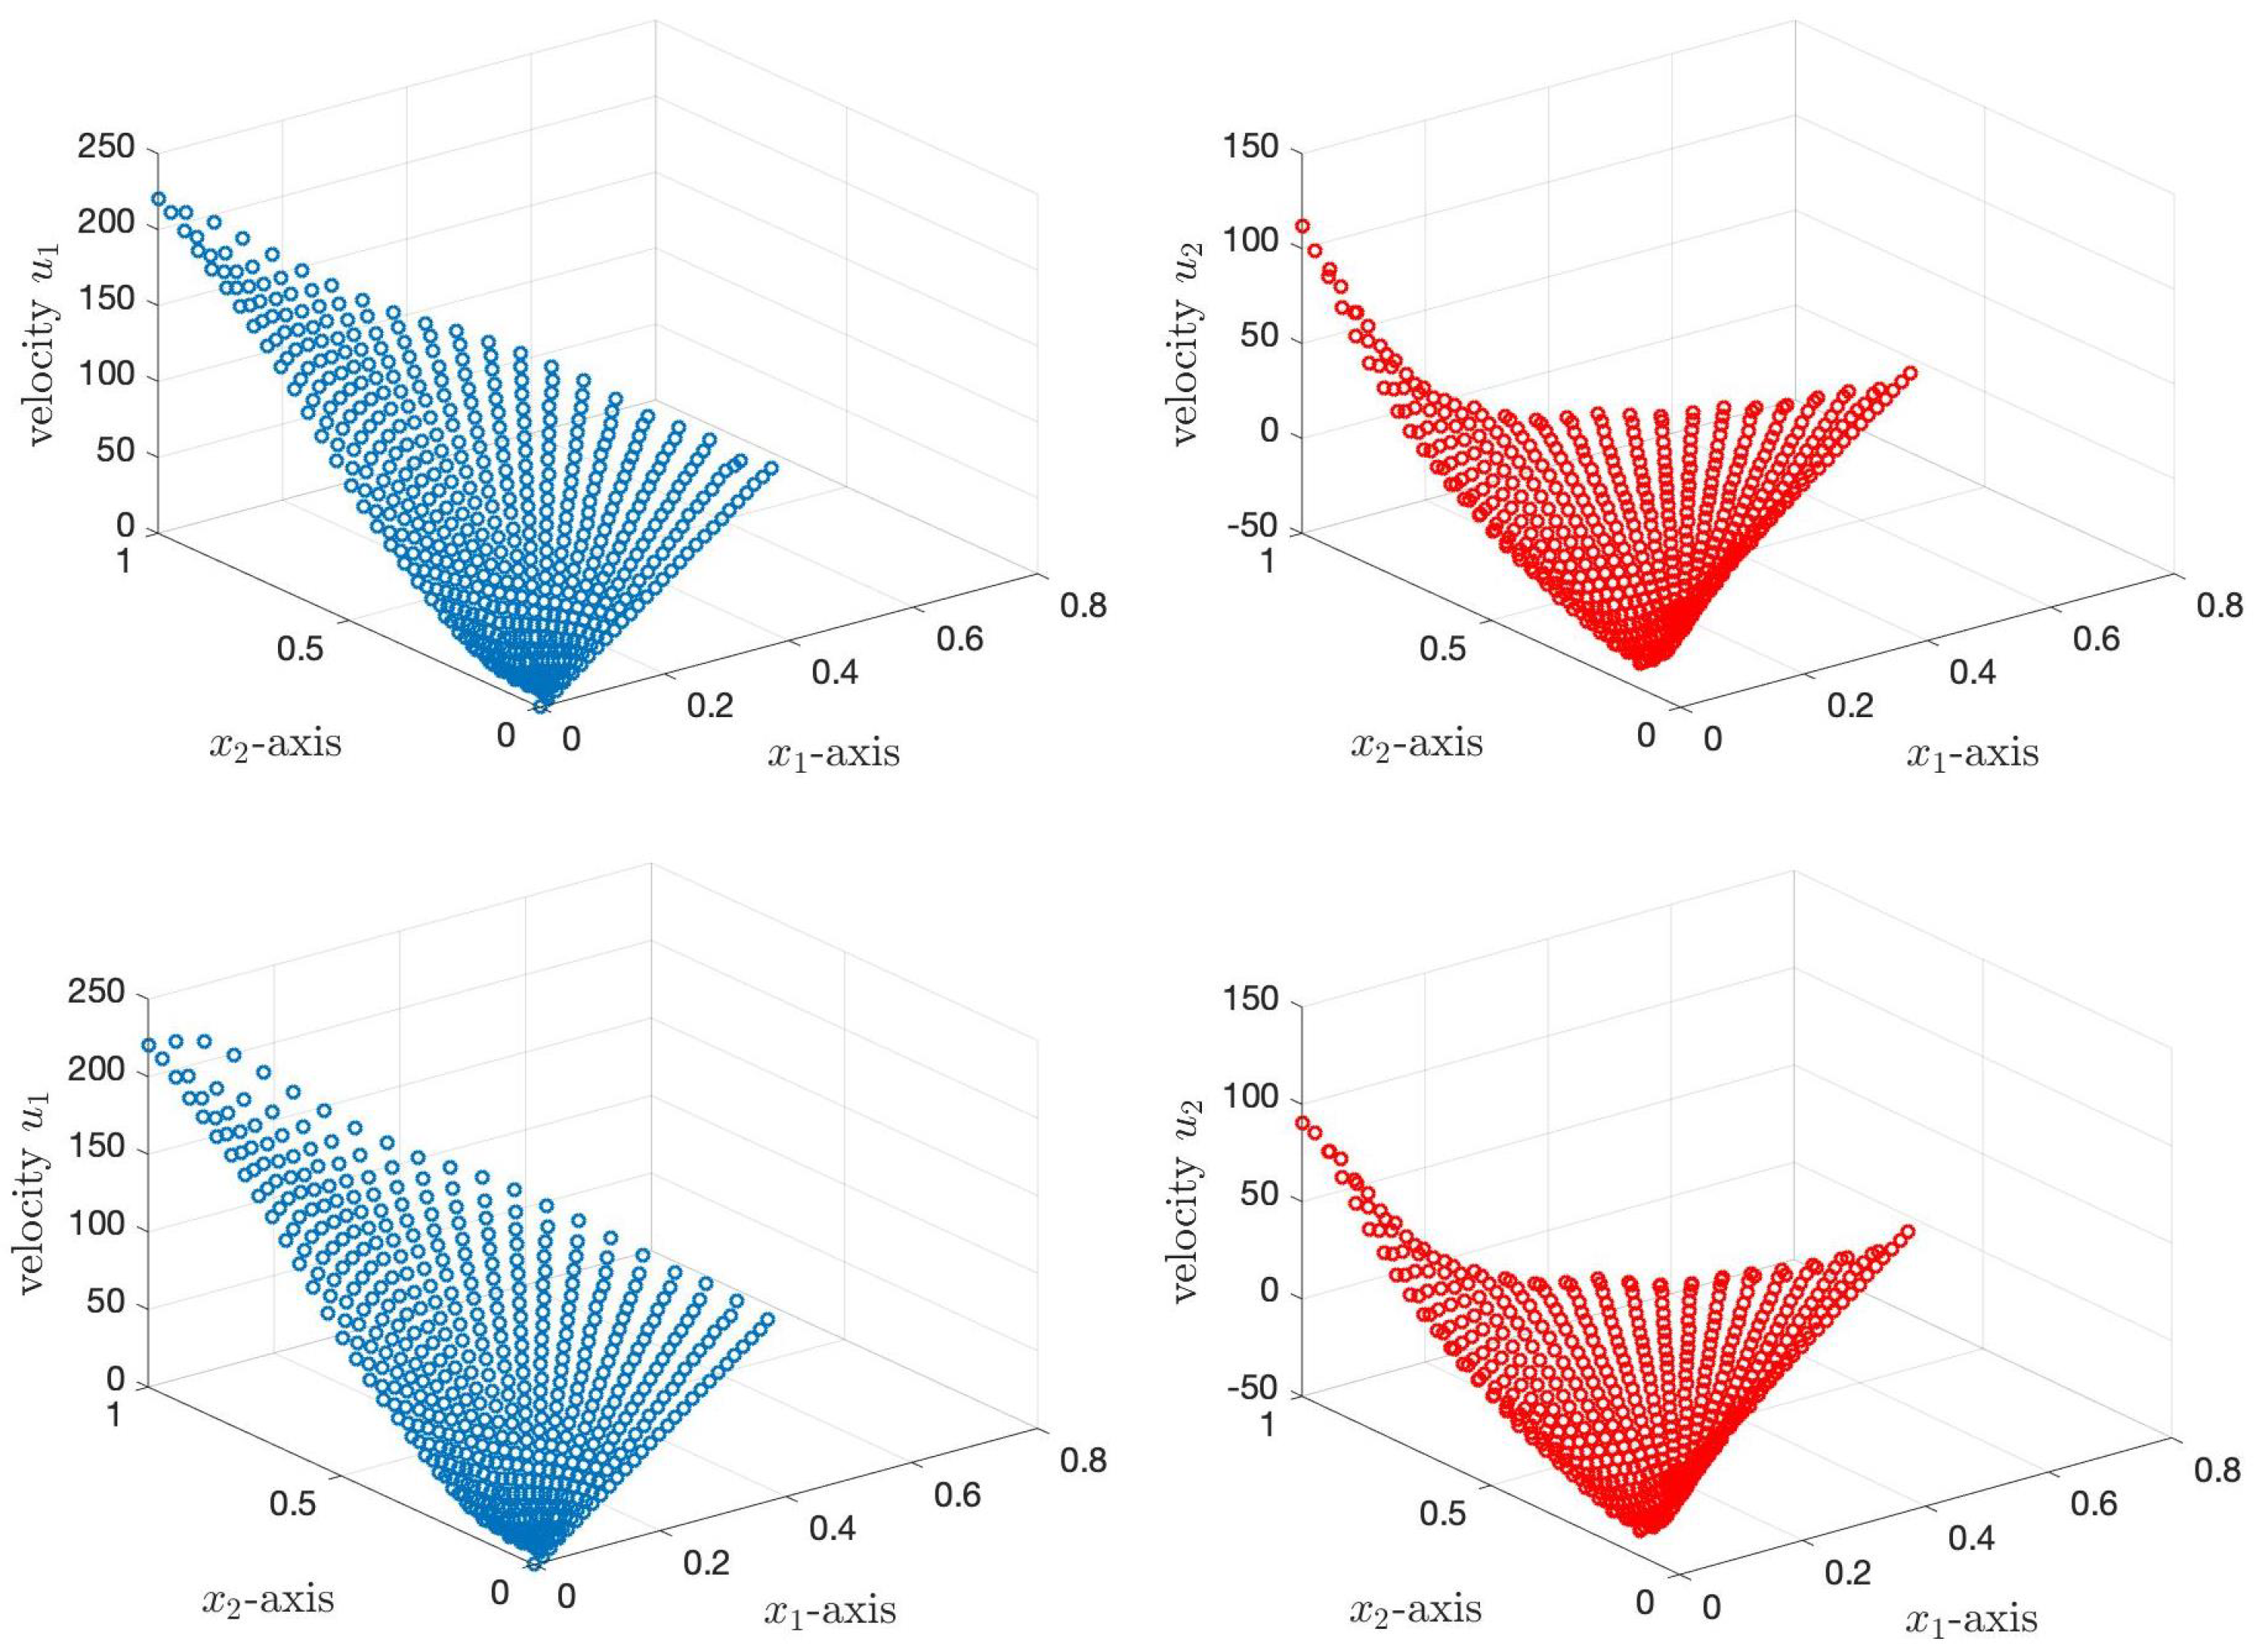
Next, we average the velocities
and
of the PCL fluid over the
-axis. The first row of
Figure 11 shows the average velocities of the PCL fluid for the Case 1 boundary condition, while the second row illustrates the average velocities of the PCL fluid for the Case 2 boundary condition. The top left graph shows the average velocity of
, while the top right graph shows the average velocity of
. The average velocities of
and
are almost the same for both cases. For the velocity
, near the root of cilia, the velocity has a negative value and the velocity gradually increases to a positive value along the cilia until the tips of the cilia. The highest average velocities are at the tips of cilia for all cases. The mean velocities of
for Case 1 and Case 2 are
and
µm/s, respectively. The mean velocities of
for Case 1 and Case 2 are
and
µm/s, respectively. The mean velocities for both cases of
are close to the velocity of the PCL fluid obtained from experimental data [
45].
Researchers studied the movements of PCL and mucus in human tracheobronchial epithelial cell cultures using conventional and confocal microscopy of fluorescent microspheres. They found that the PCL fluid and mucus move at similar rates, and µm/s, respectively, which is close to our mean velocity, , for both cases.
Figure 12 shows the speed of the PCL fluid of both cases of the boundary conditions. The left and right graphs illustrate the speed of the PCL fluid for Case 1 and Case 2, respectively. The shapes of the graphs for both cases are similar to the velocity
except at the bottom of the representations. The difference comes from the effect of the negative value
near the root of cilia. It shows that the velocity
is more impactful to the PCL-fluid movement than
. The average speeds of the PCL fluid for Case 1 and Case 2 are
µm/s and
µm/s, respectively. The numerical results are compared with the numerical results provided in [
13,
14,
25]. The authors determined the velocity of the PCL fluid due to the self-propelled cilia in one-dimensional, two-dimensional, and three-dimensional domains. In [
13], the researchers used the finite element method to solve the nonlinear Stokes–Brinkman equations in a one-dimensional domain, and they discovered that the average speed of the PCL fluid was
µm/s. In [
14], the authors solved the nonlinear Brinkman equation in two dimensions using a mixed finite element method and Newton’s method to obtain the velocity of the PCL fluid. They found that the average speed for all angles,
, was
µm/s. In [
25], the researchers determined the velocity of the PCL fluid caused by cilia beating using a mixed finite element method of Taylor–Hood type to solve the Stokes–Brinkman equations in a three-dimensional domain. The average speed over angles,
, was found to be
µm/s. Comparing the numbers with our results reveals that the maximum difference is
µm/s or about
. These comparisons demonstrate that the average speed for both cases obtained in our simulations is close to the average speed of the PCL fluid reported in the literature.
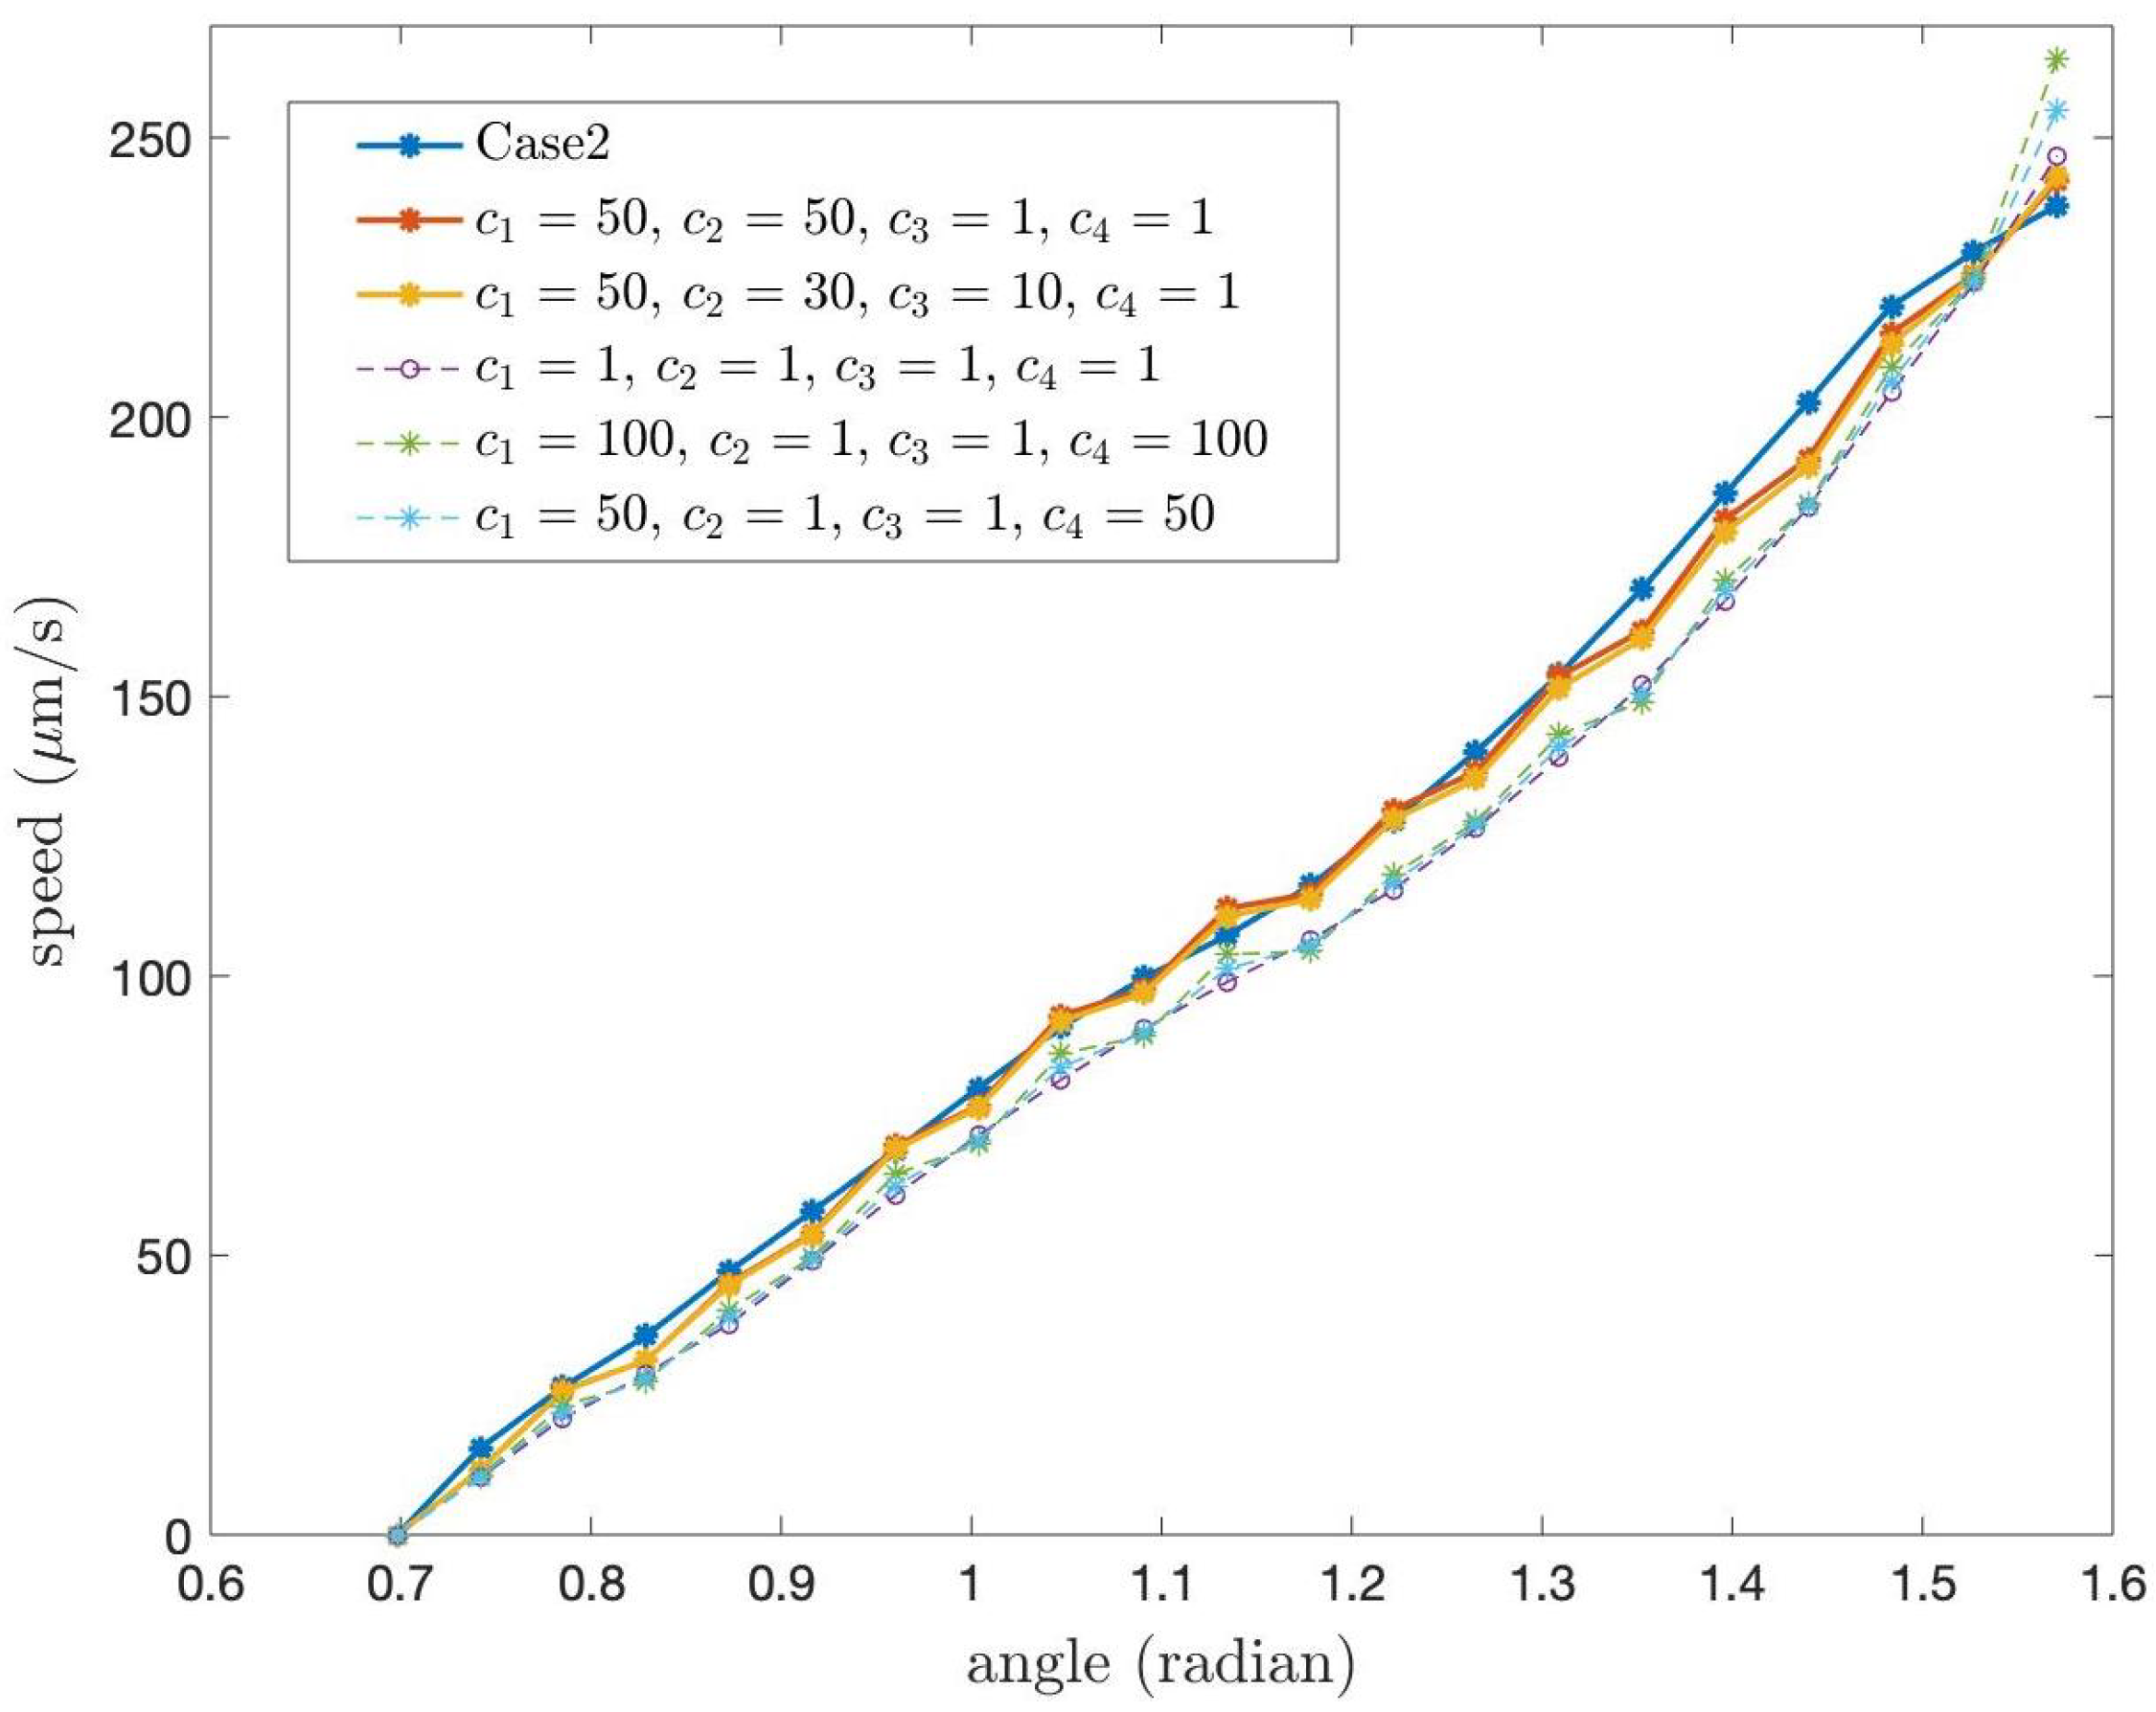
Next, we study the speed of the PCL fluid at the tips of cilia for different constants,
which are the coefficients in the boundary condition at
of Case 1. In the previous numerical results, we used
for all
i. For other values of
we present the speed of the PCL fluid at the tips of cilia in
Figure 13 and
Figure 14.
Figure 13 shows the speed at the tips of cilia when
where
. From the graph, it can be observed that the different values of
result in slight variations in speed.
Figure 14 illustrates the speed of the PCL fluid at the tips of cilia when the values of
, are not equal. We also present the speed of the PCL fluid at the tips of cilia for Case 2 in order to compare the speed for Case 1 and Case 2 with different value of
. From the graph, we observe that the red and yellow lines are close to the line of Case 2. We also found that, despite different values of
, the shapes of all speed profiles in
Figure 13 and
Figure 14 are similar.
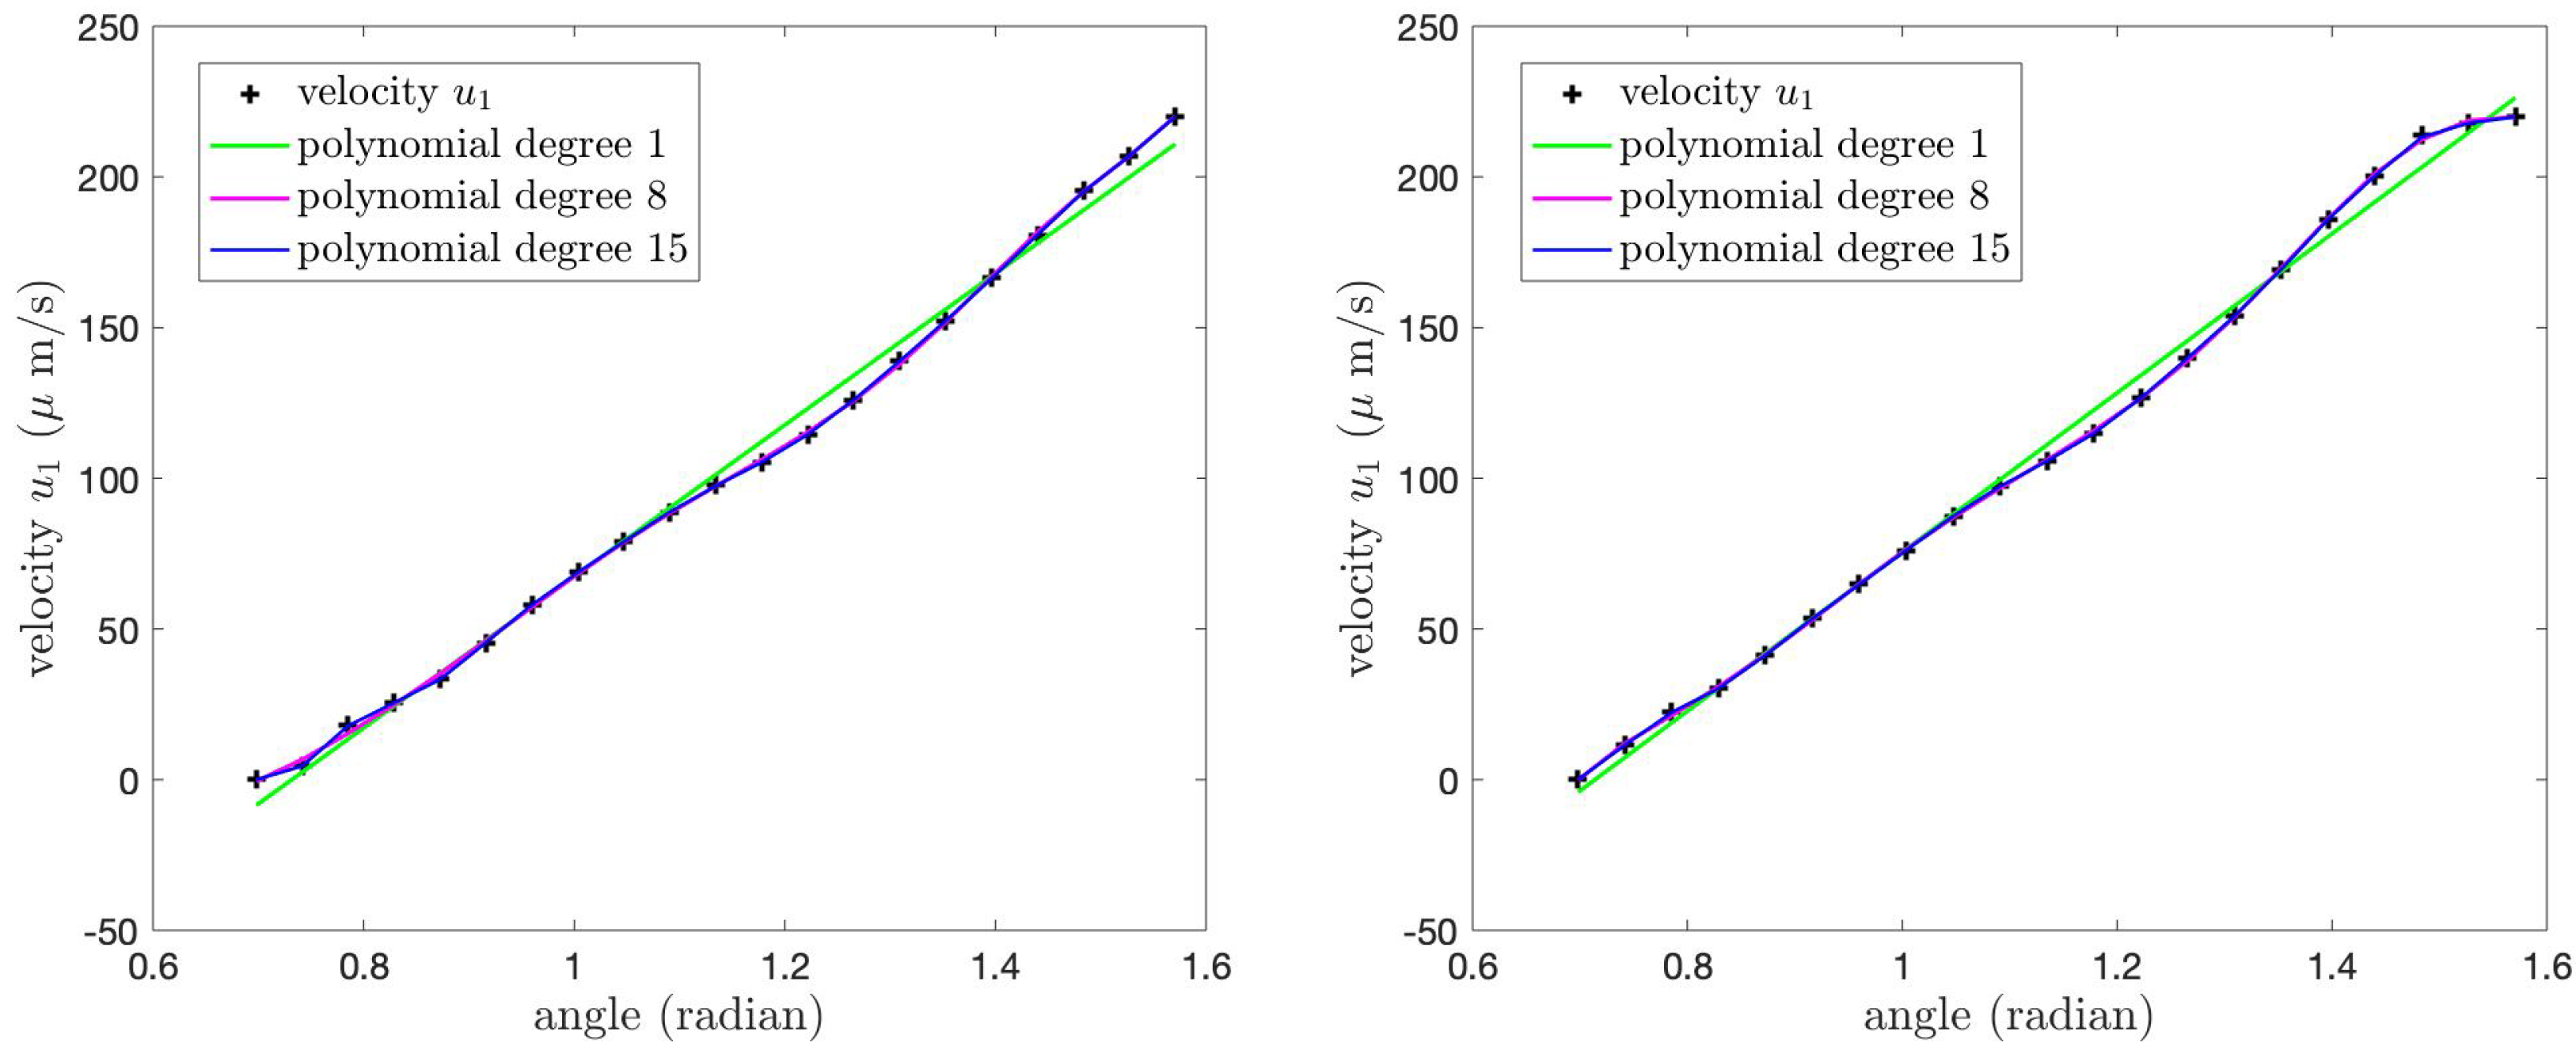
Because the velocity of the PCL fluid at the tips of cilia affects the velocity of mucus and the thickness of mucus can cause lung diseases, we focus on the velocity at the tips of cilia. We provide polynomial approximations of the velocities
and
, as well as the speed of the PCL fluid at the tips of cilia for both cases of the boundary conditions illustrated in
Figure 15,
Figure 16 and
Figure 17. We use
. Here, we provide the polynomial approximations of degrees 1, 8, and 15 for the velocities
and the speed at the tips of cilia because the velocity
and the speed profiles at the tips of cilia can be approximated by straight lines with an acceptable error, and sometimes it is convenient to use the first-degree polynomials for some problems. The polynomial approximations of degrees 8 and 15 are provided for
. In these figures, the horizontal axis represents the angle, measured in radians, ranging from
to
. The green, magenta, and blue lines represent the polynomial approximations of degrees 1, 8, and 15, respectively.
Figure 15 shows the velocity
of the PCL fluid at the tips of the cilia and its polynomial approximations for Case 1 (left) and Case 2 (right) boundary conditions. We find that the velocity
at the tips of the cilia in both cases increases as the angle
increases from
to
and the maximum velocity occurs at the angle
.
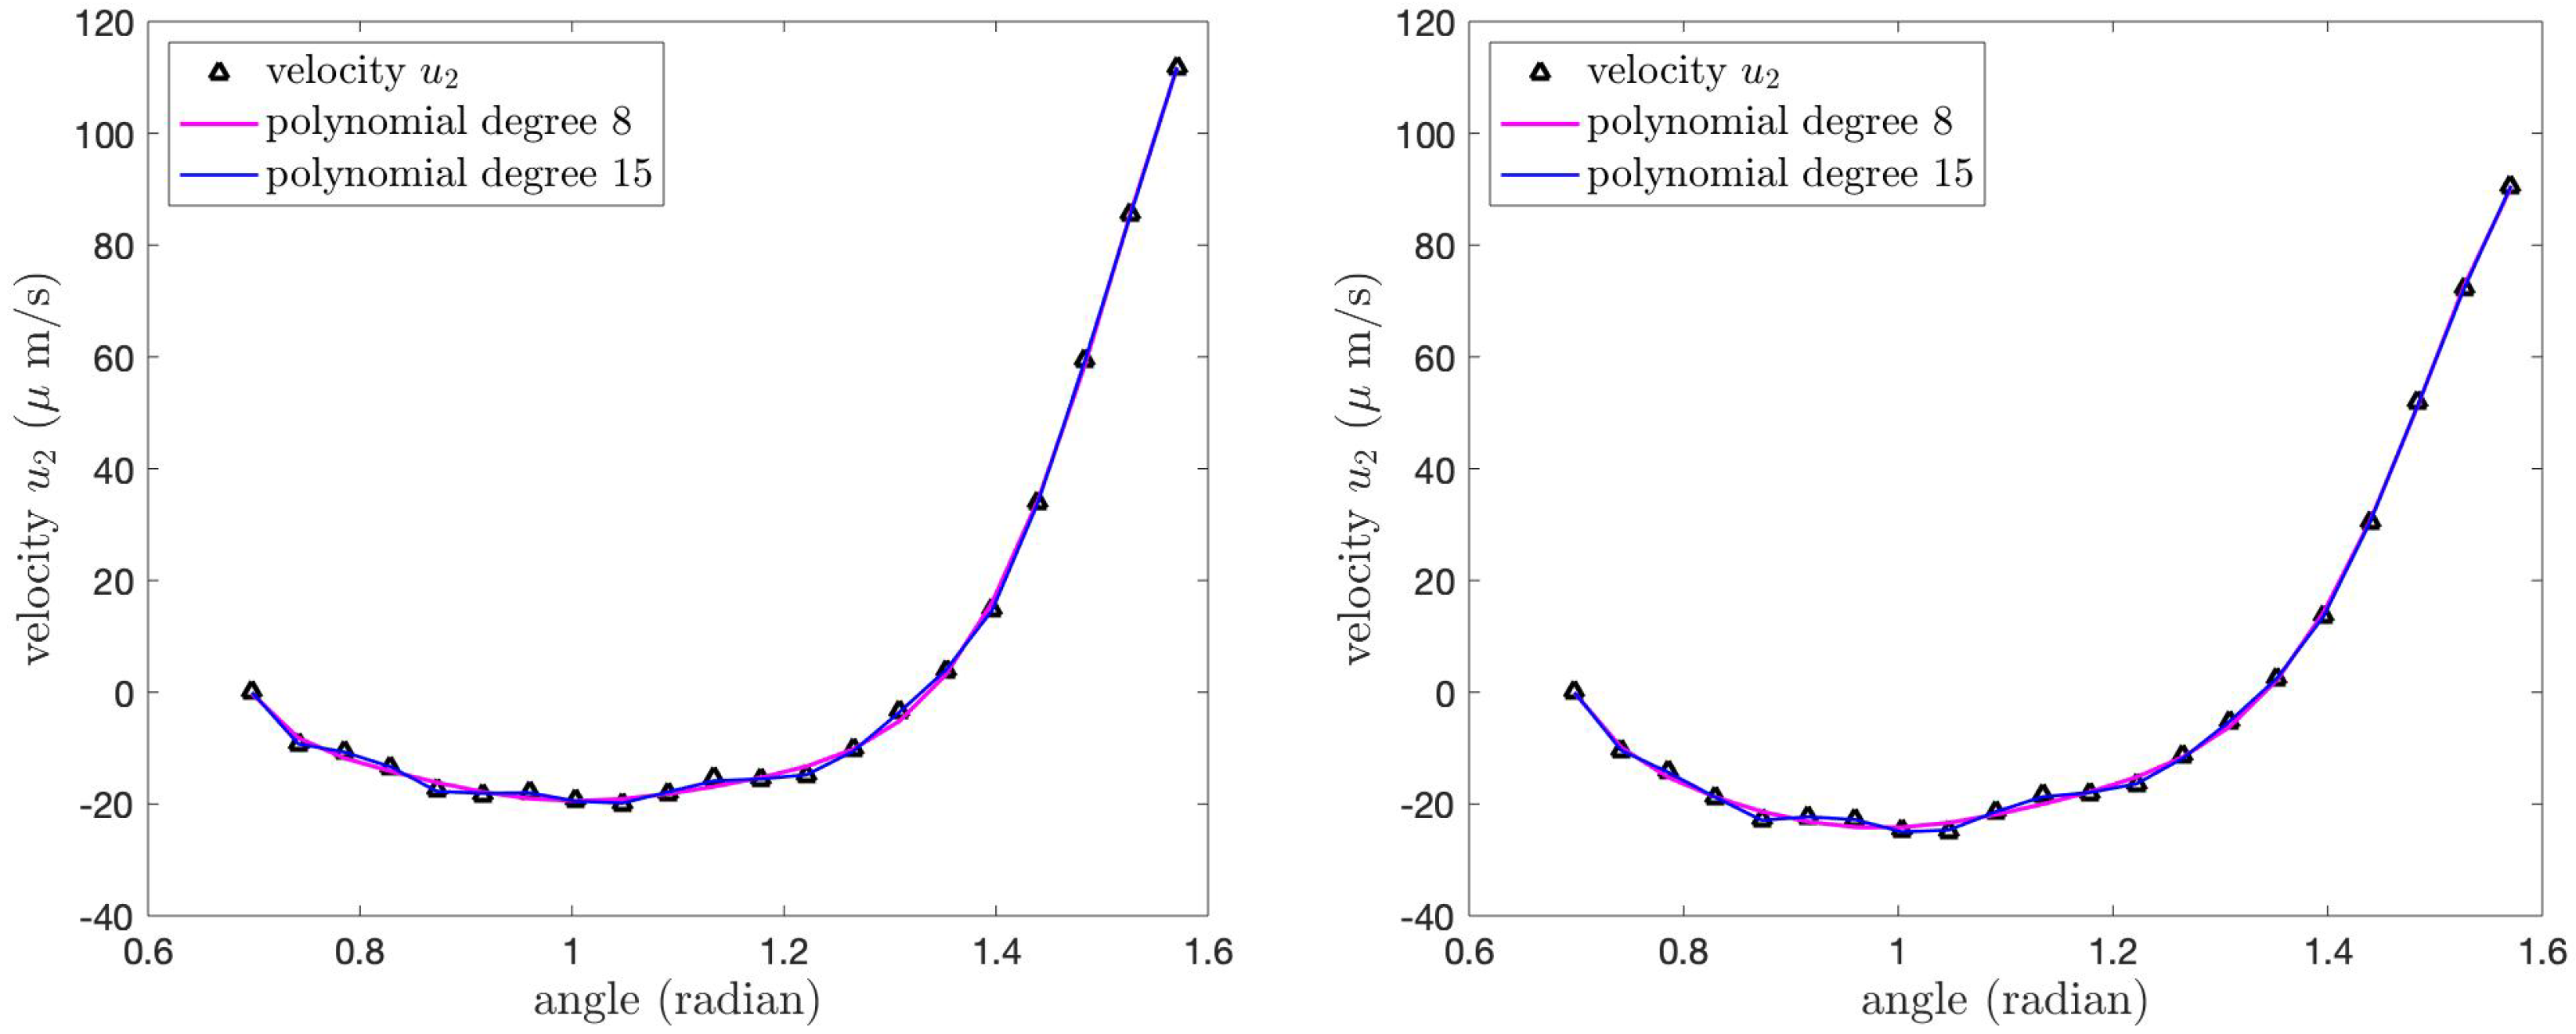
Figure 16 illustrates the velocity
of the PCL fluid at the tips of the cilia and its polynomial approximations for both cases of the boundary conditions. The velocity
for the Case 1 boundary condition (left) is greater than the velocity
for the Case 2 boundary condition (right), especially at
. Although the shapes of the graphs in both cases have similar shapes, the values of the velocity
are different. The velocity
is the maximum at
, and then it decreases as the angle decreases until
. Then, the velocity increases until it reaches zero at
.
Figure 17 shows the speed of the PCL fluid at the tips of cilia and the first-, eighth-, and fifteenth-degree polynomial approximations for Case 1 (left) and Case 2 (right) boundary conditions. We see that the shapes of the speeds at the tips of cilia are similar to the shapes of the velocity
for both cases; see
Figure 15. This means the velocity
affects the motion of the PCL fluid more than the velocity
.
From physical perspectives, the PCL fluid appears to move similarly to the motion of the cilia. That is, the velocity of the PCL fluid increases progressively from the base to the tips of cilia. As the cilia angle decreases, indicating greater bending, the fluid velocity at the tips also decreases, implying that propulsion efficiency is reduced during the motion. Since cilia are self-propelled organelles that move forward speedily and back gently, they perform their power stroke to move fluids, and then they gradually back to their starting position, which is slower than the forward stroke. This pattern of acceleration and deceleration repeats periodically due to the nature of cilia. As a result, the PCL fluid moves faster when the cilia are upright (effective stroke), slows down during the bending, and then accelerates again when the cilia are in the upright position, resulting in a pulsatile flow pattern similar to metachronal waves.
The polynomial functions and their coefficients are given in
Table 3,
Table 4 and
Table 5.
Table 3 illustrates the coefficients of the first-degree polynomial function.
Table 4 and
Table 5 show the coefficients of the eighth- and fifteenth-degree polynomial functions, respectively.
The
-norm errors of the polynomial approximations of the velocity
are presented in
Table 6.
Table 6 shows the errors of the first-, eighth-, and fifteenth-degree polynomials. When the degree of the polynomial increases, the error decreases. Although the 15th-degree polynomials provide the best fitting, we also present the lower-order approximations because, in some cases, one may need only a rough estimate.
The
-norm errors of the polynomials approximating
are shown in
Table 7. In
Table 7, we present the errors of the eighth- and fifteenth-order polynomials. The 15th-order approximation has better error than the 8th-order polynomial, but we also present both of them here because the smaller degree of the polynomial may be useful for some rough study cases.
The
-norm errors of the polynomial approximations of the speed at the tips of cilia are provided in
Table 8. The errors are small for the 15th-order approximation.


