1. Introduction
Floods are a threat to humans. Floods involve unusually high water levels that inundate the landscape in diverse settings, be it in urban areas, in mountains, at the coast or along rivers [
1]. Moreover, severe localized flood damages due to record-breaking heavy rains, attributed to extreme heat and global warming, have led to a continuous increase in human and property losses [
2]. Although flood defense measures are actively implemented in various rivers, flood prevention is still very difficult due to unexpected rainfall and inadequate emergency response systems. Therefore, structural measures alone are not enough to address flood damage, and non-structural measures such as flood forecasting and early warning are essential [
3]. These measures encourage residents and visitors in areas where damage is likely to occur to evacuate in a timely manner [
4].
To date, hydrology-based management techniques have been the most commonly employed for river management, including addressing droughts, floods, and pollution [
5,
6,
7,
8]. A representative hydrology-based model is the SWAT (Soil and Water Assessment Tool), which predicts river discharge. The SWAT model is a continuous simulation model based on physical parameters and accounts for climate, hydrology, soil temperature, and land management, enabling modeling that considers both natural phenomena and anthropogenic impacts on watersheds [
5].
The Clark modeling method is mainly used to directly predict river floods. This method predicts and tracks flood basins using travel time and storage coefficients as key parameters [
9,
10].
In recent years, with the advent of the Fourth Industrial Revolution and digital transformation, efforts to manage rivers using cutting-edge digital technologies have gained traction. Particularly, the development of digital twin-based river management systems has emerged prominently [
11,
12,
13,
14,
15]. Digital twin technology refers to digitally replicating real-world objects (such as people, things, facilities, or systems) and conducting various experiments on the virtual counterparts to effectively manage and optimize the real objects. This technology integrates advanced digital technologies such as analytical AI, diverse physical models, prediction engines, and high-precision 3D visualization [
16]. Managing rivers using digital twin technology allows for advanced modeling and predictions, enabling effective river management.
This study focuses on designing a river management and flood prediction system for volcanic geology using deep learning models based on accumulated real river data. In our research, we consider the rivers on Jeju Island, Korea. Jeju Island’s rivers are primarily dry due to the island’s volcanic geology [
17,
18,
19]. Most rivers flow along steep slopes near Jeju City and Seogwipo City on the northern and southern sides of Halla Mountain [
17,
18,
19]. Therefore, Jeju Island’s hydrological environment is significantly different from that of inland areas, and a specialized management model suited to regional characteristics is needed to establish a disaster safety system for Jeju Island.
This study designs a river management and flood prediction system targeting the Hyodon River. The upper stream, located on the slope of Halla Mountain, is characterized by steep terrain, and the lower stream flows into the sea through Soesokkak. Soesokkak is a very famous tourist attraction visited by many tourists, merchants, and residents. Predicting floods early in this area is crucial to preventing life and property damage.
The proposed river management and flood prediction system uses accumulated rainfall data from rain gauges in the upstream, water level data from water level monitoring stations in the downstream, and evacuation warning information to predict flood occurrence one hour in advance. The model is trained based on past data, enabling the early detection and warning of river floods. In addition, a 3D visualization-based digital twin platform is introduced to visualize the areas around Hyodon River and Soesokkak, allowing managers to monitor the current status and effectively issue flood warnings.
The structure of this study is as follows:
Section 2 discusses the characteristics of Jeju rivers and the current Seogwipo river early warning system.
Section 3 explains the design of the data-driven flood prediction models and data preprocessing for training.
Section 4 outlines methods to enhance prediction performance through sensor reinforcement and the use of digital twin technology.
Section 5 validates the performance of the designed model. Finally,
Section 7 and
Section 8 concludes the study and presents future research directions.
2. Character and River Data Collection Facilities for the Target River
This section describes the target river and related facilities selected for the development of the river management and flood prediction model.
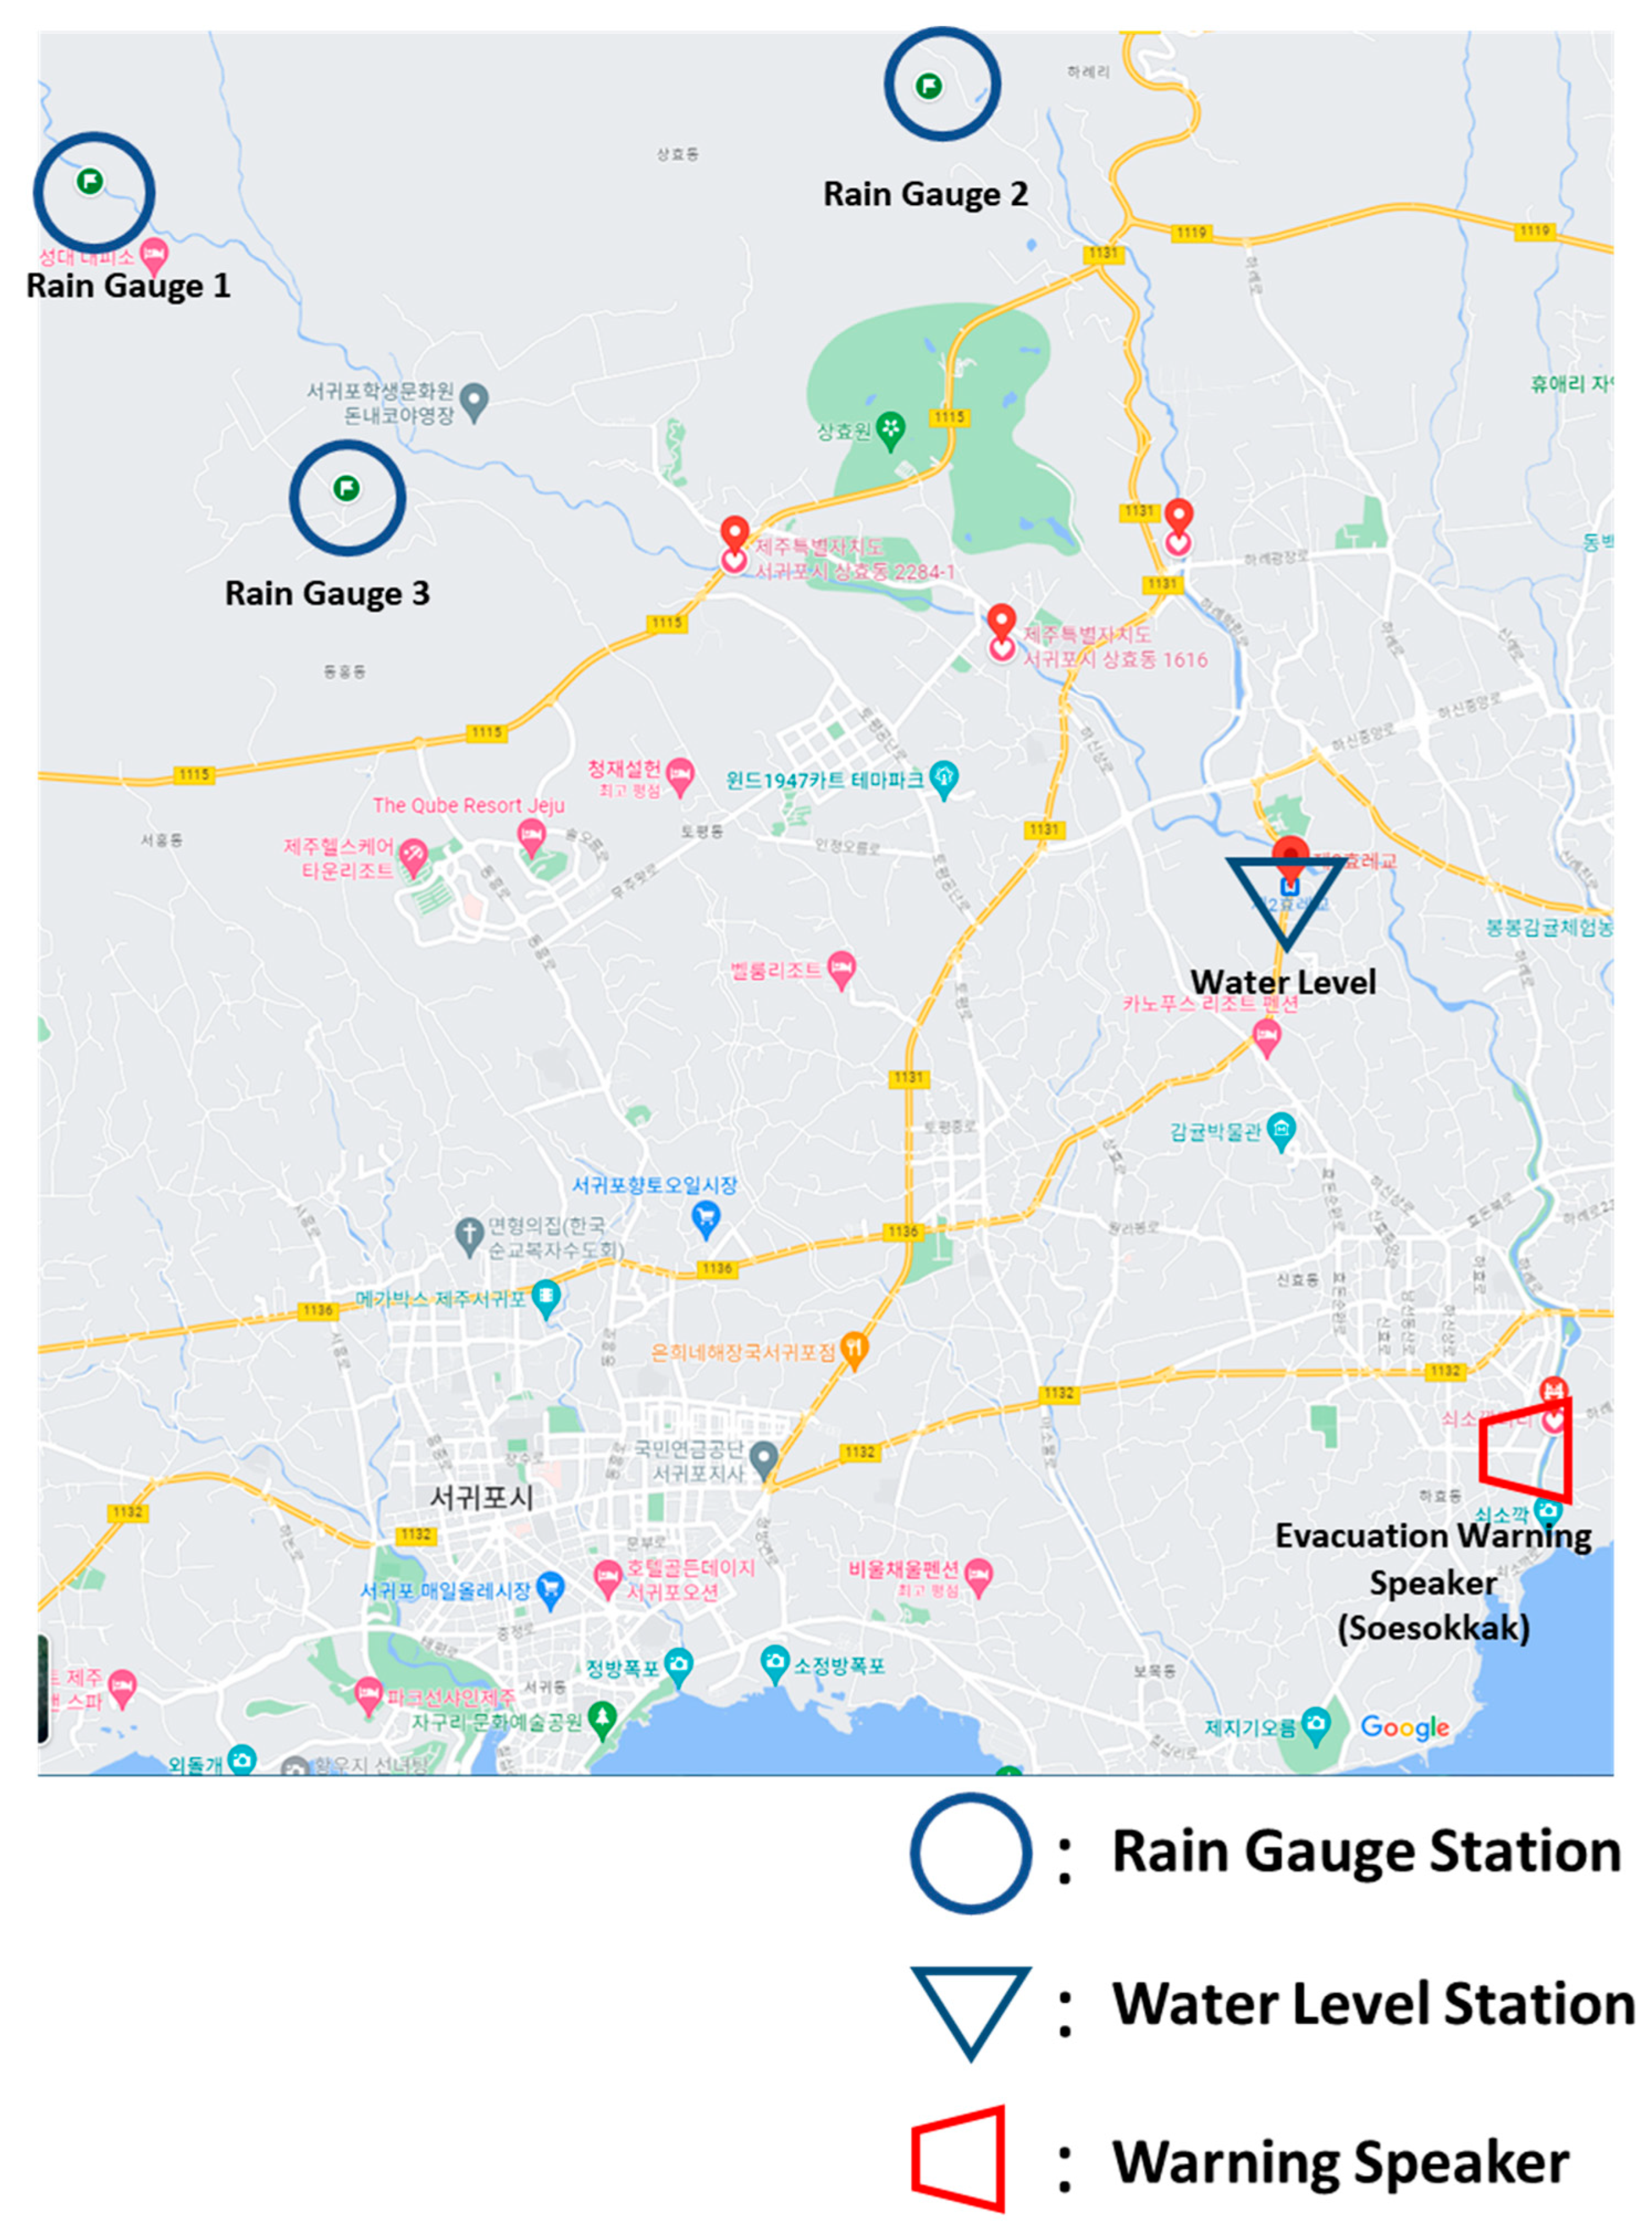
Figure 1 illustrates the Hyodon River along with the associated management facilities selected for developing the river management and flood prediction model. Hyodon River is a 13 km river that flows from the top of Hallasan Mountain downstream through Soesokkak to the sea in Seogwipo, as shown in
Figure 1, and is designated as Korea Natural Monument No. 182. Although it is a dry stream, there is also Donnako Valley, a valley with a steady flow of water in the middle and upper reaches. In addition, Soesokkak (downstream of Hyodon River), which meets the sea, maintains an abundant amount of water, making it a representative water attraction in Seogwipo City that is visited by many tourists. Hyodon River flows through Hahyo-dong Village and Namwon Harye-ri Village before flowing into the sea. Therefore, flooding of Hyodon River can have a significant impact on nearby villages and houses and can cause serious problems, such as taking the lives and property of many tourists and merchants in downstream Soesokkak. For these reasons, this study selected Hyodon River as a target area for river management and flood prediction model development.
As shown in
Figure 1, the facilities for managing Hyodon River are currently composed of three rain gauge stations: Rain Gauge 1, Rain Gauge 2, and Rain Gauge 3, and one water level station. The three rain gauge stations installed in the upstream of Hyodon River measure rainfall in the highlands of Halla Mountain. Halla Mountain is the area with the most rainfall in Jeju, and heavy rainfall on Halla Mountain often causes serious damage to the downstream areas of Jeju Island. Therefore, the rain gauges in the highlands of Jeju Island play an important role in river management. In addition, Hyorye-gyo is a bridge installed in the downstream of Hyodon River, and the water level of the river is measured at Hyorye-gyo bridge.
3. Data Structure Description
The preparation and organization of data are fundamental to the successful development of any predictive model. In this study, the dataset is critical for enabling accurate flood prediction. The collected data are sourced from multiple sensors installed along the Hyodon River, including rain gauge stations and water level monitor. This chapter elaborates on the collection, processing, and structuring of these data to ensure its readiness for training deep learning models.
The data were collected over a 12-year period, from 7 February 2011, to 19 April 2023, providing a comprehensive account of the river’s hydrological patterns. Three rain gauge stations, strategically located in the upstream regions, measured rainfall intensity. A water level monitoring station downstream provided measurements of river height. The dataset was formatted into a tabular structure for ease of analysis and model training, as shown in
Table 1. Each row in the dataset represents a single time step and includes measurements from all sensors. For instance, the rain gauge readings (Rg1, Rg2, and Rg3) capture rainfall intensity at three upstream locations, while the water level (Wl) reflects conditions downstream. The evacuation status was defined based on official flood alert records issued by local authorities during historical flood events, rather than arbitrary thresholds assumed by the authors.
Therefore, in this research, the river flood prediction models predict the river evacuation status. There are four evacuation warnings, as shown below:
- -
0: Safe
- -
1: Warning
- -
2: Evacuation
- -
3: Major evacuation
These levels were officially determined and announced by the government agency responsible for river management in Korea. The decision-making process for these alerts includes a comprehensive analysis of several hydrological parameters, including upstream rainfall and downstream water levels. However, the detailed algorithms or thresholds used in this decision-making process are not disclosed. The proposed technique is trained to learn patterns in rainfall and water level data corresponding to evacuation levels. Based on the learned patterns, the model can predict evacuation levels one hour in advance.
Before utilizing the data for training, extensive preprocessing was conducted to address inconsistencies and enhance its quality. Missing values, often encountered in real-world datasets due to sensor malfunctions or communication errors, were interpolated using linear methods to ensure continuity. Normalization was applied to scale the input features to a uniform range, thereby preventing any single feature from dominating the learning process. The evacuation statuses were one-hot encoded to facilitate multi-class classification, converting each status into a binary vector.
The processed dataset was divided into three subsets: training, validation, and test sets. The training set, comprising 80% of the data, was used to fit the models. The validation set, representing 10% of the data, was employed for tuning hyperparameters and preventing overfitting. Finally, the test set, also 10% of the data, was reserved for evaluating the models’ performance on unseen instances. The validation set was used to monitor the model’s performance during training and to tune hyperparameters. To further enhance generalization and prevent overfitting, we applied early stopping based on validation loss, introduced dropout layers, and employed L2 regularization where appropriate. This setup allowed the model to balance learning capacity and robustness across varying flood conditions.
Table 1 describes the structure of the sorted data. Each row of the sorted data, as shown in
Table 1, can be used as input to the prediction model. In
Table 1, Rg1(t), Rg2(t), and Rg3(t) denote the t-th measurement of the Rain Gauge Station 1, Rain Gauge Station 2, and Rain Gauge Station 3, respectively, and Wl(t) denotes the t-th measurement of the Water Level Station. The designed model should output the flood and evacuation warning status using the sorted data in
Table 1 as input.
4. River Flood Prediction Model
This chapter presents the design and implementation of a flood prediction model for the Hyodon River, leveraging deep learning methodologies and accumulated data from various sensors. Given the unique geological and hydrological conditions of Jeju Island, including steep terrains and frequent rainfall, traditional flood prediction systems often fall short of providing accurate and timely warnings. To address these challenges, we developed and optimized prediction models based on deep learning technologies.
In particular, we employed Convolutional Neural Networks (CNNs) and Recurrent Neural Networks (RNNs) with Long Short-Term Memory (LSTM) units. CNNs are a class of neural networks that are highly effective for extracting local patterns from structured input data. Originally developed for image analysis, CNNs apply sliding filters to detect features in multi-dimensional data, making them suitable for analyzing spatial and temporal dependencies in meteorological and hydrological inputs [
20,
21,
22]. RNNs, in contrast, are designed for processing sequential data, where each output depends on previous inputs [
23,
24,
25]. LSTM, a widely used variant of RNN, addresses the vanishing gradient problem and enables learning long-term dependencies across time steps—an essential capability in flood prediction where rainfall effects can accumulate over time [
26,
27].
We designed prediction models based on RNN with LSTM and CNN, which is suitable for extracting key features of input data. The CNN and LSTM can input large amounts of data at once and generate prediction values. As explained in
Section 3 above, the sorted data in
Table 1 is used as input values. Each row of the sorted data is used as an input value. In addition, the evacuation warning value of Soesokkak is used as an output value. Therefore, the models designed in this paper receive the data in
Table 1 as input and predict the evacuation warning value. The input data structure is designed to capture historical trends and instantaneous measurements over specific time intervals, ensuring that the model captures the dynamics of rainfall and water flow effectively.
4.1. CNN-Based River Flood Prediction Model
In this subsection, the CNN-based river flood prediction model is designed for the Hyodon River flood prediction and evacuation warning.
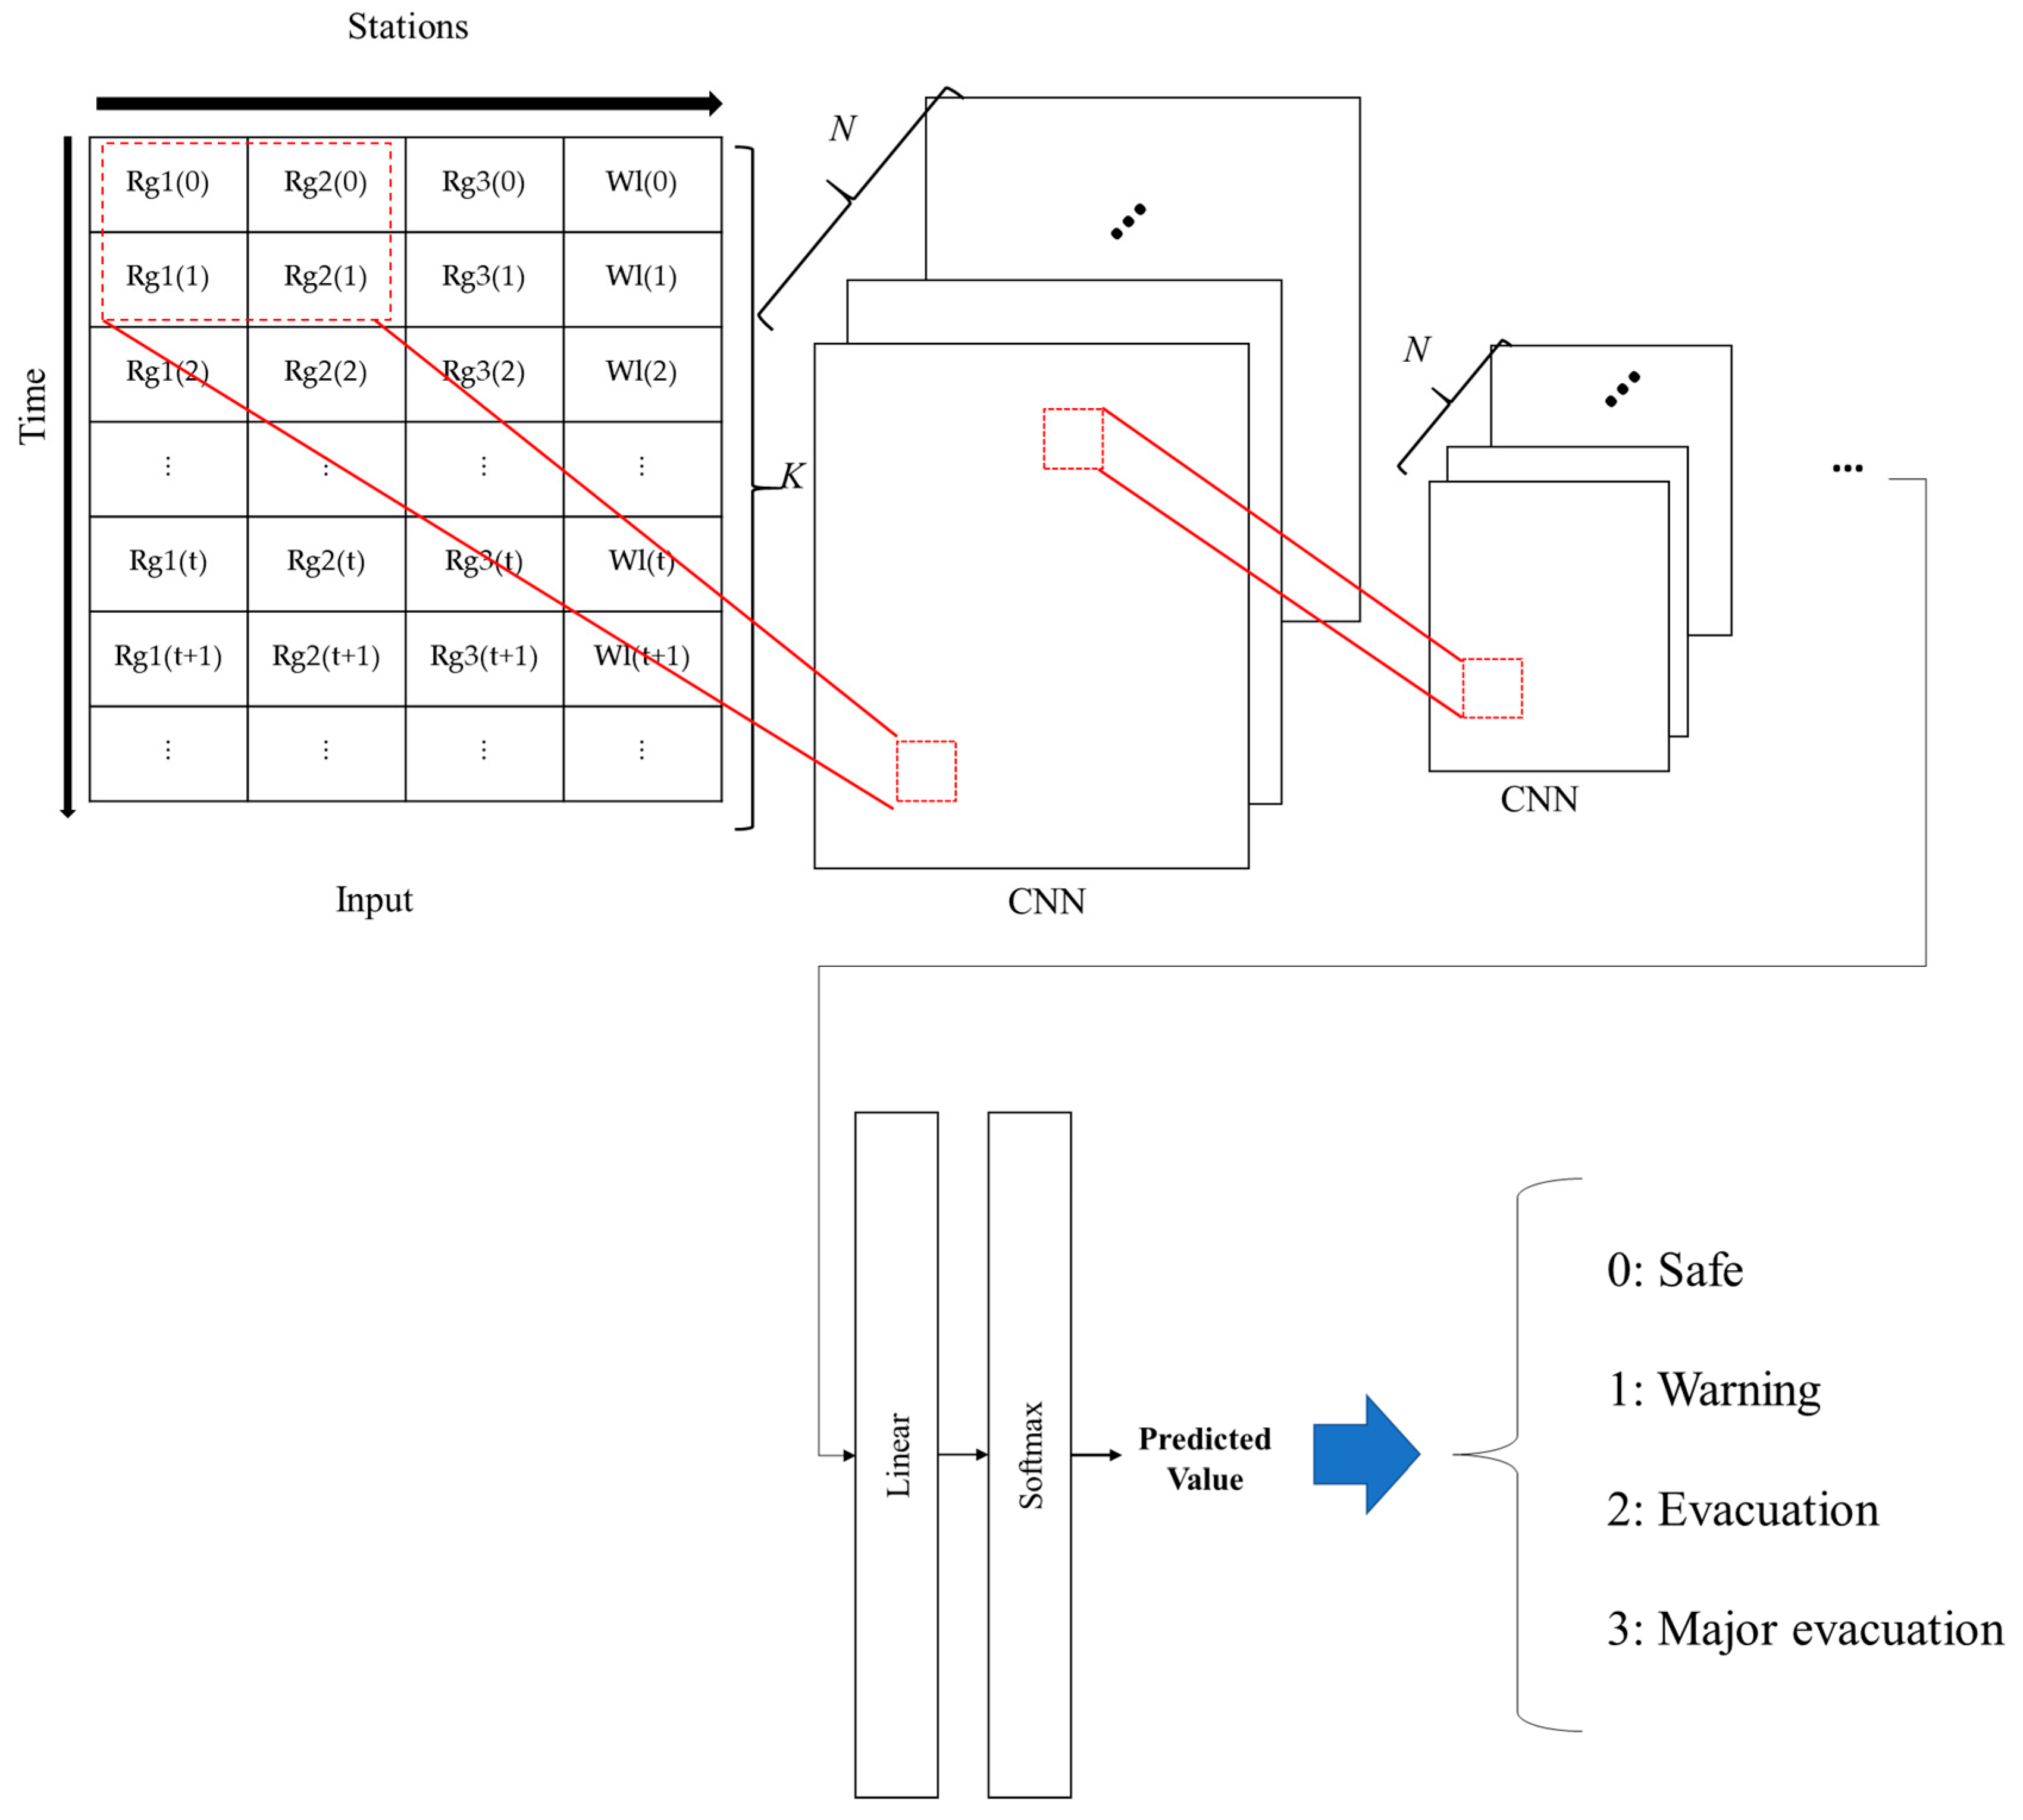
Figure 2 shows the CNN-based river flood prediction model. The CNN-based model for river flood prediction was specifically designed to handle large-scale input data comprising multiple features, including rainfall measurements and water level data. CNNs are well-suited for this task, as they excel at identifying patterns and features within spatial and temporal datasets.
As shown in
Figure 2, the input datasets are arranged as the table with
K × 4 size, and filtering computations are operated through
N depths. Since the flooding of a river is predicted based on various upstream rainfall data and water level data, past rainfall data and water level data must be considered simultaneously. The proposed CNN-based river flood prediction model structure predicts the flooding of a river using data accumulated for 4 h. The input window size of 4 h was empirically determined by observing that rainfall-to-evacuation effects typically occur within this time frame in the training data. Four evacuation warning states are predicted.
The CNN-based model employs a multi-layer architecture consisting of convolutional layers and fully connected layers. Each layer is designed to process the input data, which is organized as a matrix of
Figure 2, where K represents the time interval (e.g., 4 h) and 4 represents the data sources (three rainfall gauges and one water level sensor). The convolutional layers apply filters to extract local features, and the fully connected layers integrate these features to make final predictions.
4.2. RNN-Based River Flood Prediction Model
The RNN-based river flood prediction model leverages the ability of RNNs to process sequential data. Specifically, this model utilizes LSTM units, which address the vanishing gradient problem in standard RNNs, making them particularly suitable for long-term dependencies in time-series data.
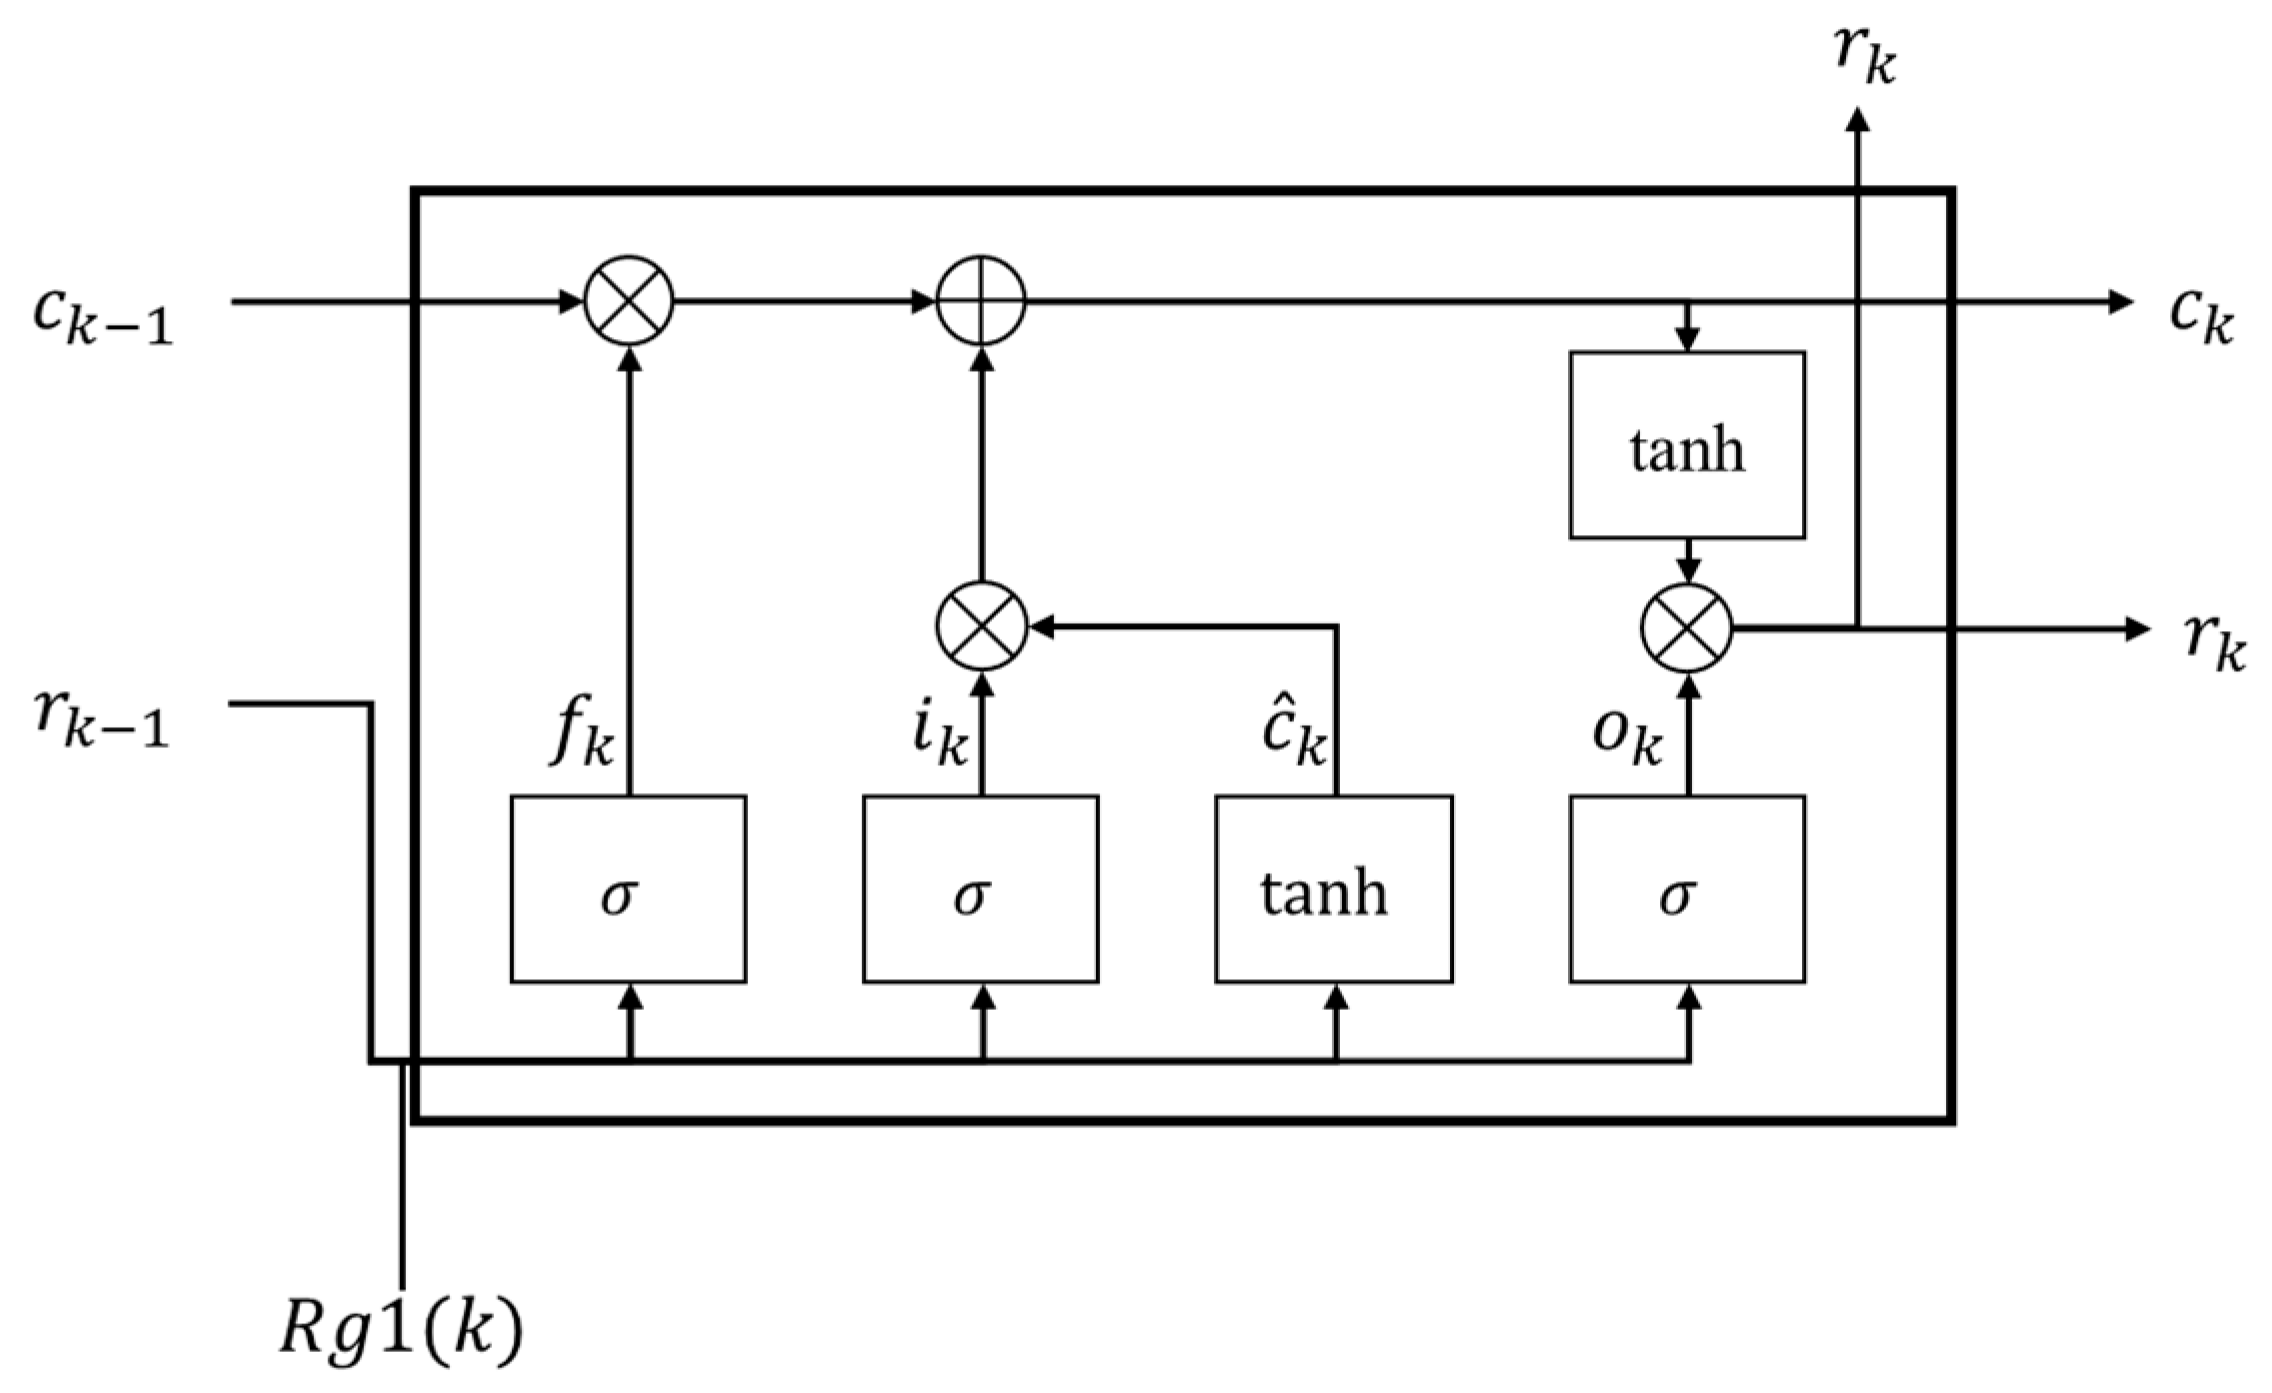
Figure 3 depicts the LSTM cell architecture. The LSTM cell consists of three types of gates. The Forget gate controls how much information the memory cell will receive from the memory cell from the previous step. The Update (input) gate decides whether the memory cell will be updated. Also, it controls how much information the current memory cell will receive from a potentially new memory cell. The Output gate controls the value of the next hidden state.
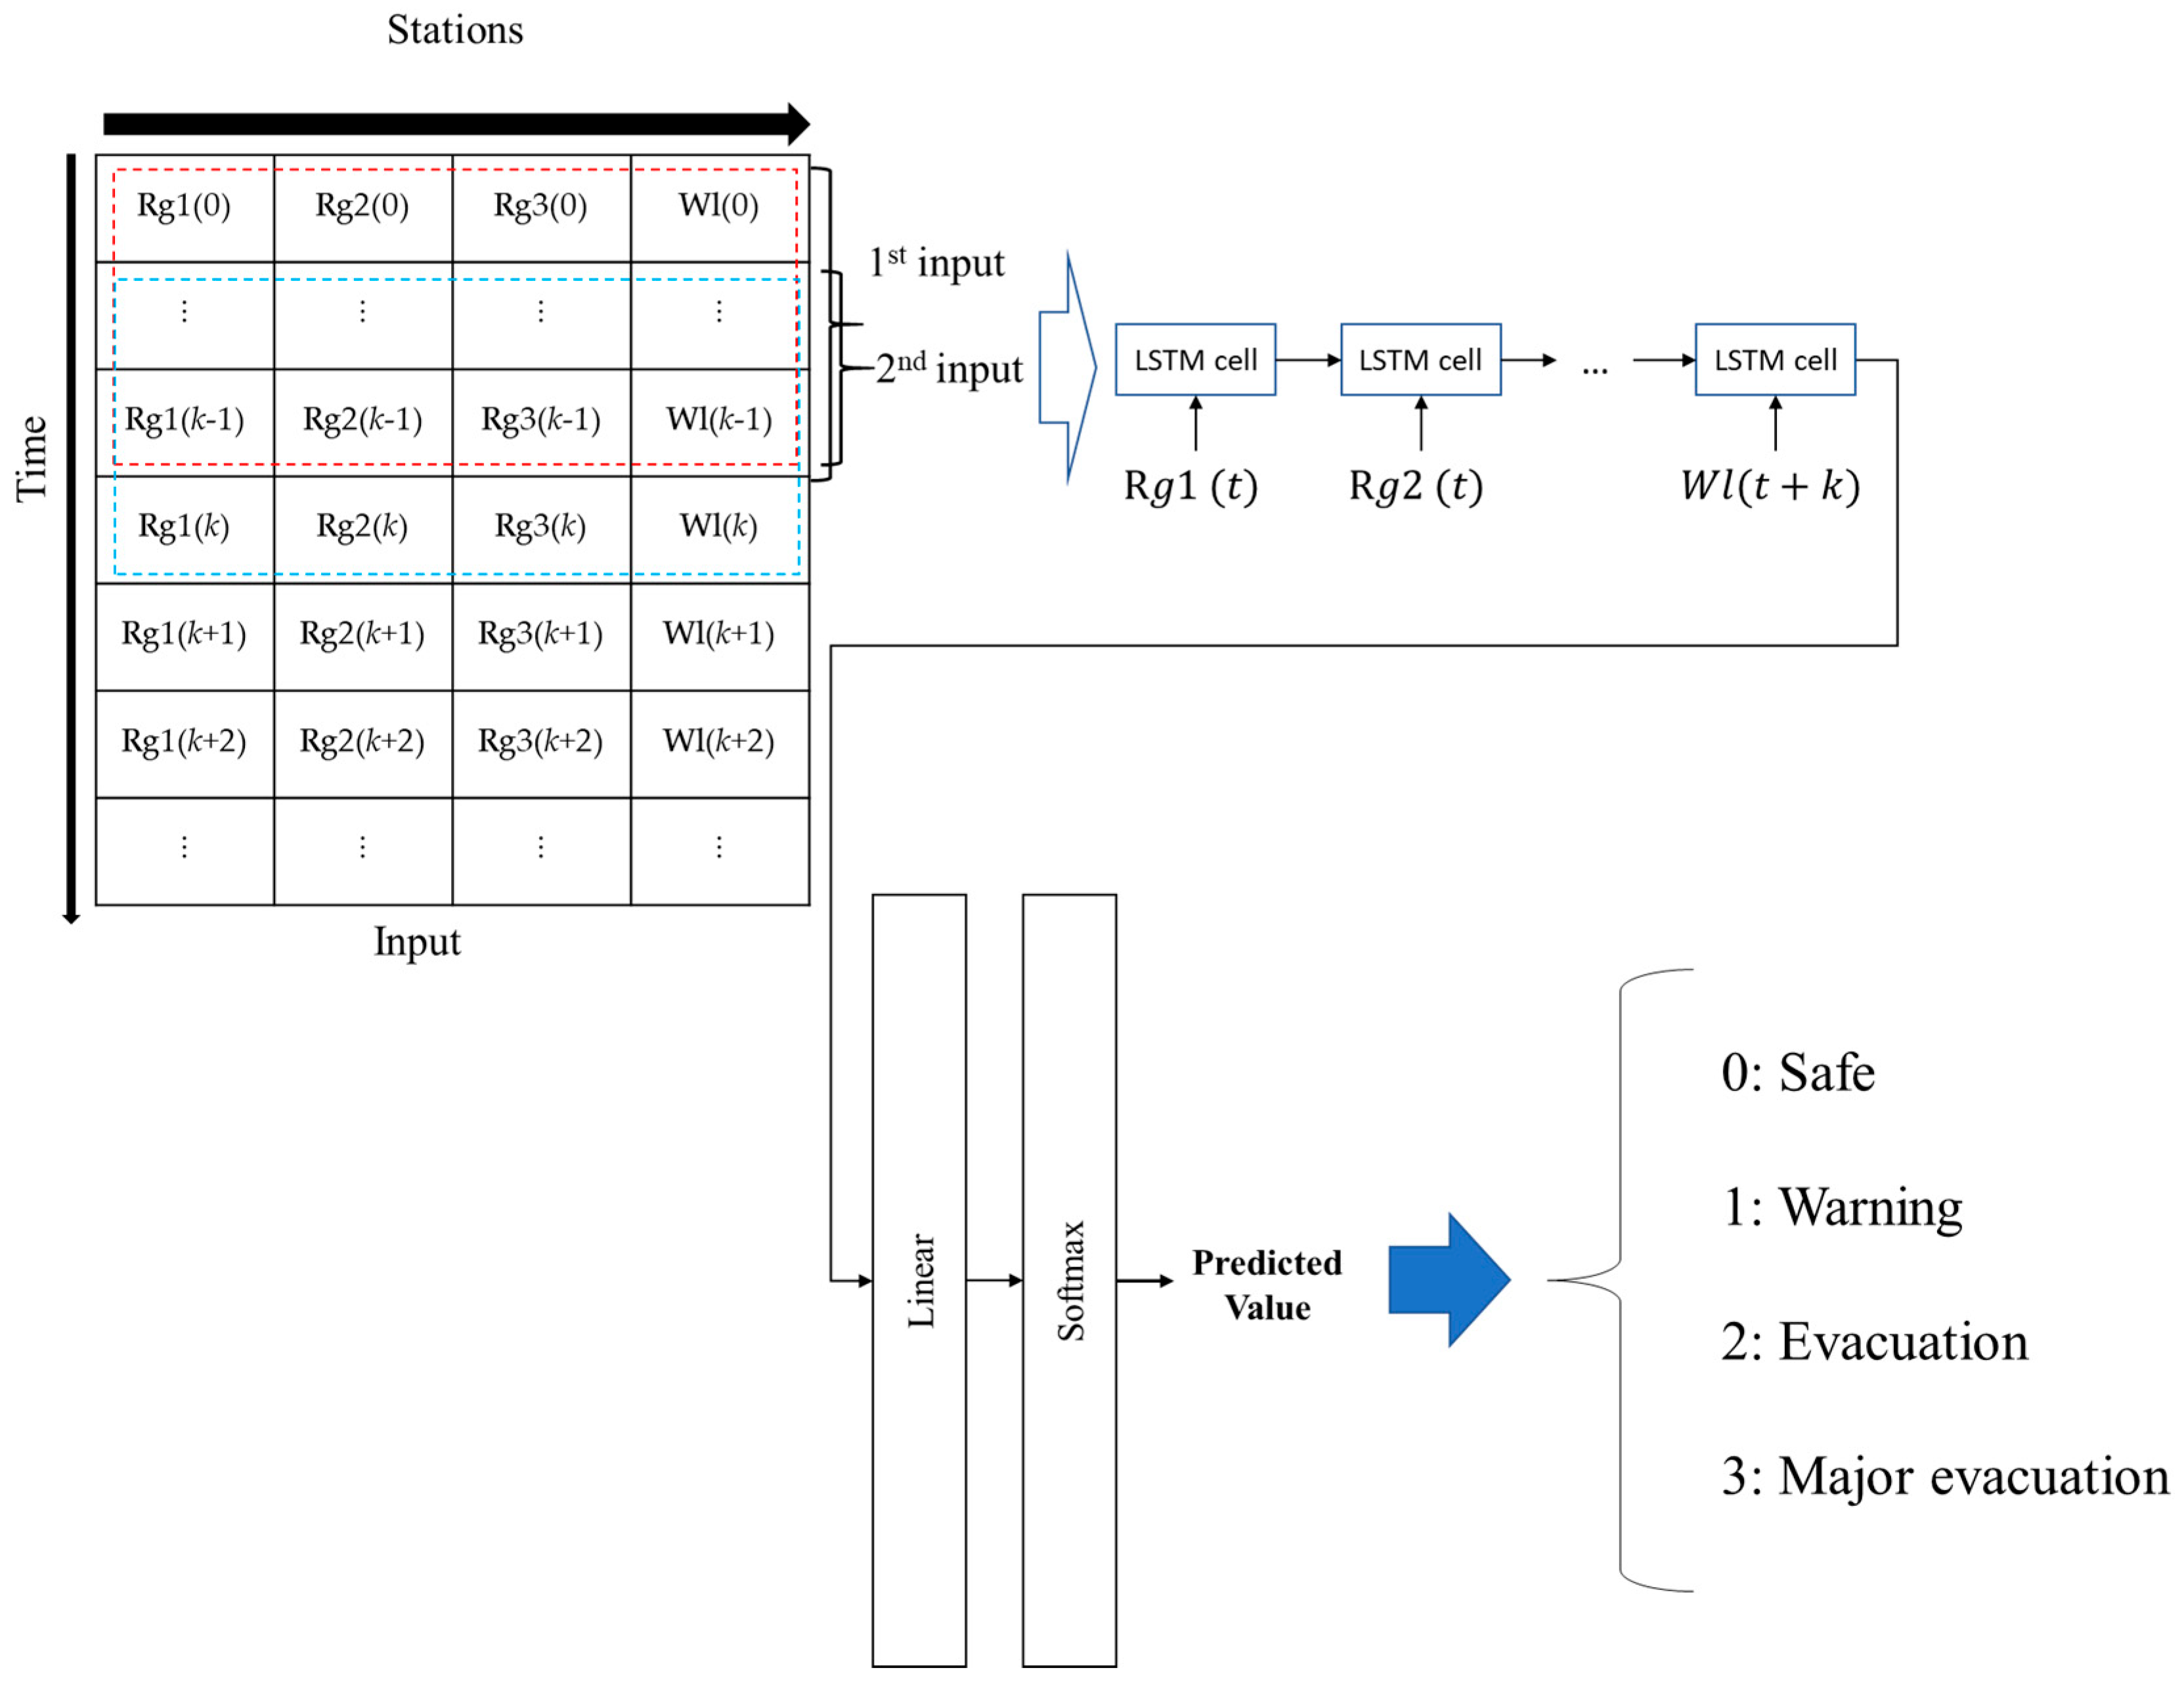
Figure 4 shows the RNN-based river flood prediction model. The RNN-based model is designed to predict river flood states by sequentially processing rainfall and water level data over a specified time window. The architecture consists of the following components:
- -
Input Layer accepts sequences of rainfall and water level measurements from the upstream and downstream sensors;
- -
LSTM Layers process the input sequences and learn temporal dependencies, enabling the model to recognize trends and predict future states;
- -
Dense Layers transform the learned features into a probability distribution over the four evacuation warning states;
- -
Output Layer produces the predicted evacuation state with corresponding confidence scores.
Since the input data can be seen as consecutive time series data, the RNN was properly learned in this case. As shown in
Figure 3, each consecutive subset of size
k × 4 is extracted from the input data and inserted to the RNN. The extraction filter moves by one row at each time, and the RNN architecture outputs four estimated values.
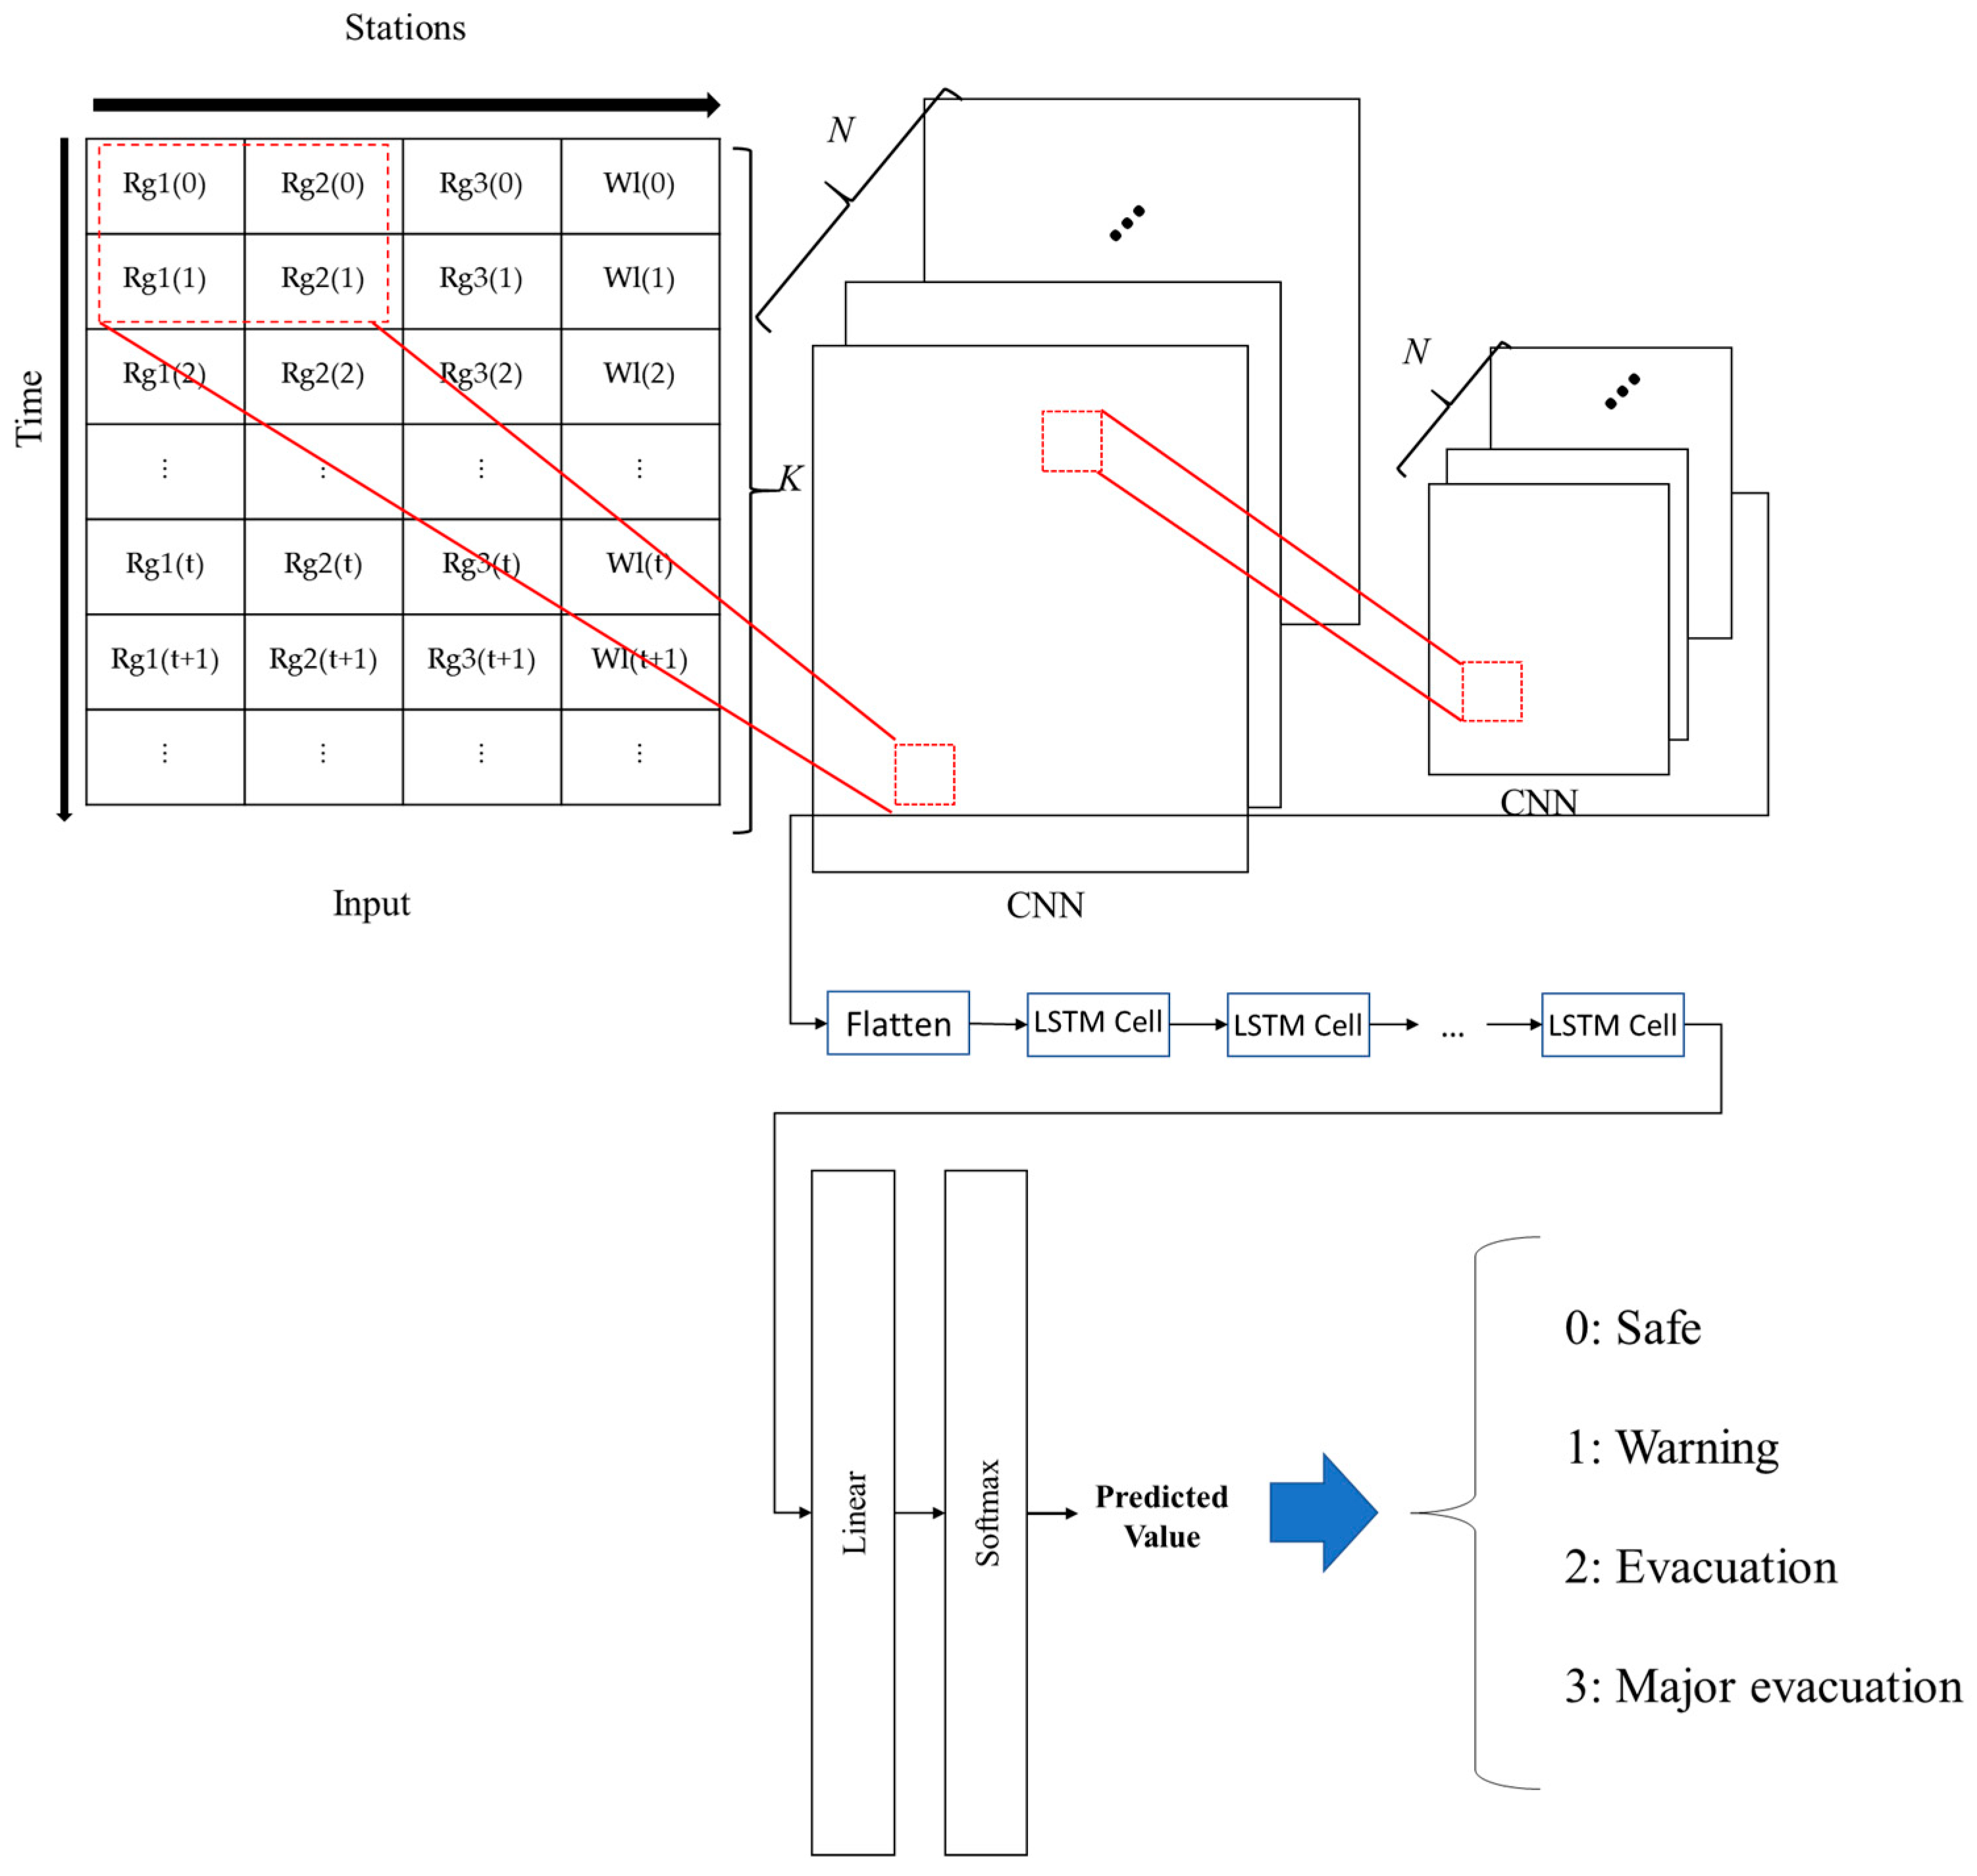
4.3. Combined CNN-RNN-Based River Flood Prediction Model
The combined CNN-RNN model integrates the strengths of both architectures to enhance flood prediction performance. CNN layers extract spatial features from the input data, while RNN layers process the temporal dependencies.
Figure 5 illustrates the architecture of this hybrid model. The combined model operates in two stages:
- -
Feature Extraction with CNN: Convolutional layers extract spatial features from the input matrix, representing rainfall and water level data.
- -
Temporal Analysis with RNN: The extracted features are sequentially processed by LSTM layers, capturing temporal patterns and trends.
The input layer processes rainfall and water level data as a multi-dimensional matrix. The CNN Layers apply filters to extract spatial relationships among the data. Flattening Layer converts the spatial feature maps into a sequence for the RNN layers. RNN layers analyze the temporal sequence to predict flood states. The dense layers map the learned features to the four evacuation warning states. The output layer provides the final predicted state with associated probabilities.
The selection of CNN and RNN models for the proposed flood prediction system is due to the special challenges posed by the volcanic hydrological conditions of Jeju Island. Existing physics-based models such as SWAT and Clark hydrographs require detailed parameterization of soil, topography, and hydrological processes, which are often difficult to characterize in areas with porous basalt geology and rapid runoff dynamics. CNN was adopted because it can efficiently extract spatial patterns from multivariate sensor data (rainfall and water level), making it ideal for identifying relationships between upstream and downstream points. On the other hand, RNN, especially LSTM, was selected to effectively identify temporal evolution patterns of rainfall accumulation and subsequent water level rise by modeling the temporal dependence of sensor sequences. These models have been successfully applied in other fields such as weather forecasting and industrial anomaly detection, but they have not been very useful for local flood prediction in volcanic areas. Our study demonstrates that combining CNN and RNN architectures can address both spatial and temporal complexities, providing a robust framework for flood prediction in the unique topographic and climatic context of Jeju Island.
5. Results and Discussions
The performance of the flood prediction models was evaluated using various metrics to assess their accuracy and reliability. Each model was tested on the dataset prepared in the study, and the results were analyzed in depth. The results of the CNN-based, RNN-based, and CNN-RNN combined models are comprehensively discussed to highlight their respective strengths and weaknesses. For the simulation, this research considers the following hardware specifications:
Training: NVIDIA A6000 GPU, Intel i9 CPU, 64 GB RAM.
Inference testing: Intel i9 CPU, 32 GB RAM, (no GPU).
Shows the hyper-parameters and spatial feature parameters according to the deep learning architectures. Furthermore, to comprehensively evaluate the multi-class classification performance of the proposed model, we report both the macro-average and weighted average values for precision, recall, and F1 score. The macro-average computes an unweighted average of the metrics for all classes, i.e., it treats each class equally regardless of the number of samples belonging to each class. This is useful for understanding the performance of the model for minority or rare classes (e.g., “major evacuation”) that may be hidden in imbalanced datasets. On the other hand, the weighted average computes the average by considering the support (actual number of instances) of each class. This provides a more realistic overall performance score, especially when the dataset is imbalanced, since the contribution of each class is proportional to its occurrence frequency in the data. By reporting both metrics, we provide a more balanced view of the strengths of the model. The macro-average reflects fairness across all layers, while the weighted average captures the practical applicability in terms of distribution-aware performance.
Table 2 shows the prediction results of the CNN-based model. The CNN-based model performed strongly in predicting general flood conditions, especially the “Safe” and “Warning” categories. In the “Safe” condition, the model achieved almost perfect precision and recall, indicating that it is reliable in classifying cases where flooding is unlikely to occur. Similarly, in the “Warning” condition, the model showed high precision and recall, ensuring accurate predictions in scenarios that require moderate warning. However, the CNN-based model struggled to predict less frequent events, such as the “Major Evacuation” condition. This condition showed a noticeable drop in performance, and the precision and recall reflect the difficulty in handling rare occurrences in the dataset. Overall, the model achieved an accuracy of 98%, which, while impressive, shows its limitations in addressing imbalances in the data.
Table 3 shows the prediction results of the RNN-based model. The RNN-based model, which incorporated a LSTM layer, excelled at capturing temporal patterns in the data. This strength was particularly evident in its ability to predict transitions between flood states. For example, the “Major Evacuation” state improved performance metrics compared to the CNN-based model. The model’s ability to analyze sequential data allowed it to better understand rapid changes in water levels and rainfall patterns, resulting in more balanced predictions. However, despite these improvements, the RNN-based model still had limitations in precision for certain states, such as “Evacuation,” where some inconsistencies were observed. The overall accuracy was 98%, which matched the CNN model, but the macro-average F1 score was slightly higher, indicating better handling of rare events.
Table 4 shows the prediction results of the combined CNN-RNN-based model. The combined CNN-RNN model, which combined the spatial feature extraction capabilities of CNNs with the temporal pattern recognition strengths of RNNs, turned out to be the most effective of the three. This hybrid model showed significant improvements across all evaluation metrics. It received perfect scores in both precision and recall for the “Safe” and “Warning” states, reflecting its robustness in predicting these frequent categories. In addition, the “major evacuation” condition, which posed a challenge to the standalone model, significantly improved accuracy and reliability. By combining CNN and RNN, the model was able to leverage the best aspects of both architectures to ensure accurate predictions for both frequent and rare events. With an overall accuracy of 100% and a macro-average F1 score of 0.98, the combined model outperformed its counterpart by a significant margin.
These results highlight the strengths and weaknesses of each approach. The CNN-based model excels at identifying spatial patterns in the data, making it very effective for general flood conditions. However, its limited ability to analyze temporal sequences reduced its effectiveness in predicting dynamic flood situations. On the other hand, the strength of the RNN-based model was its ability to handle sequential data, which improved its performance for transitional and rare flood conditions. Nevertheless, it lacked the spatial analysis capabilities necessary for a holistic understanding of the data. The combined model successfully addressed these individual limitations by integrating the strengths of the CNN and RNN architectures. This integration proved to be especially beneficial for predicting rare flood conditions, where k precision and recall are important for effective flood management.
In addition to the performance metrics, it is important to consider the computational tradeoffs of the proposed models. CNN-based models are relatively lightweight and can process inputs in parallel, making them suitable for low-latency applications such as on-site edge computing. On the other hand, RNN-based models require sequential processing, especially when using LSTM units, which increases inference time and memory usage, especially as the time window becomes longer. The combined CNN-RNN model achieves the best accuracy and F1 score, but it incurs computational overhead in both the convolutional layer and the time-dependent LSTM layer. This increases the GPU memory usage and training time. However, after training is complete, it is possible to predict flooding in a river with minimal computational effort. Training requires a lot of resources, but after training is complete, it can be operated in real time. Therefore, if you invest a little more resources in training the CNN-RNN, you can obtain a real-time prediction model with excellent performance.
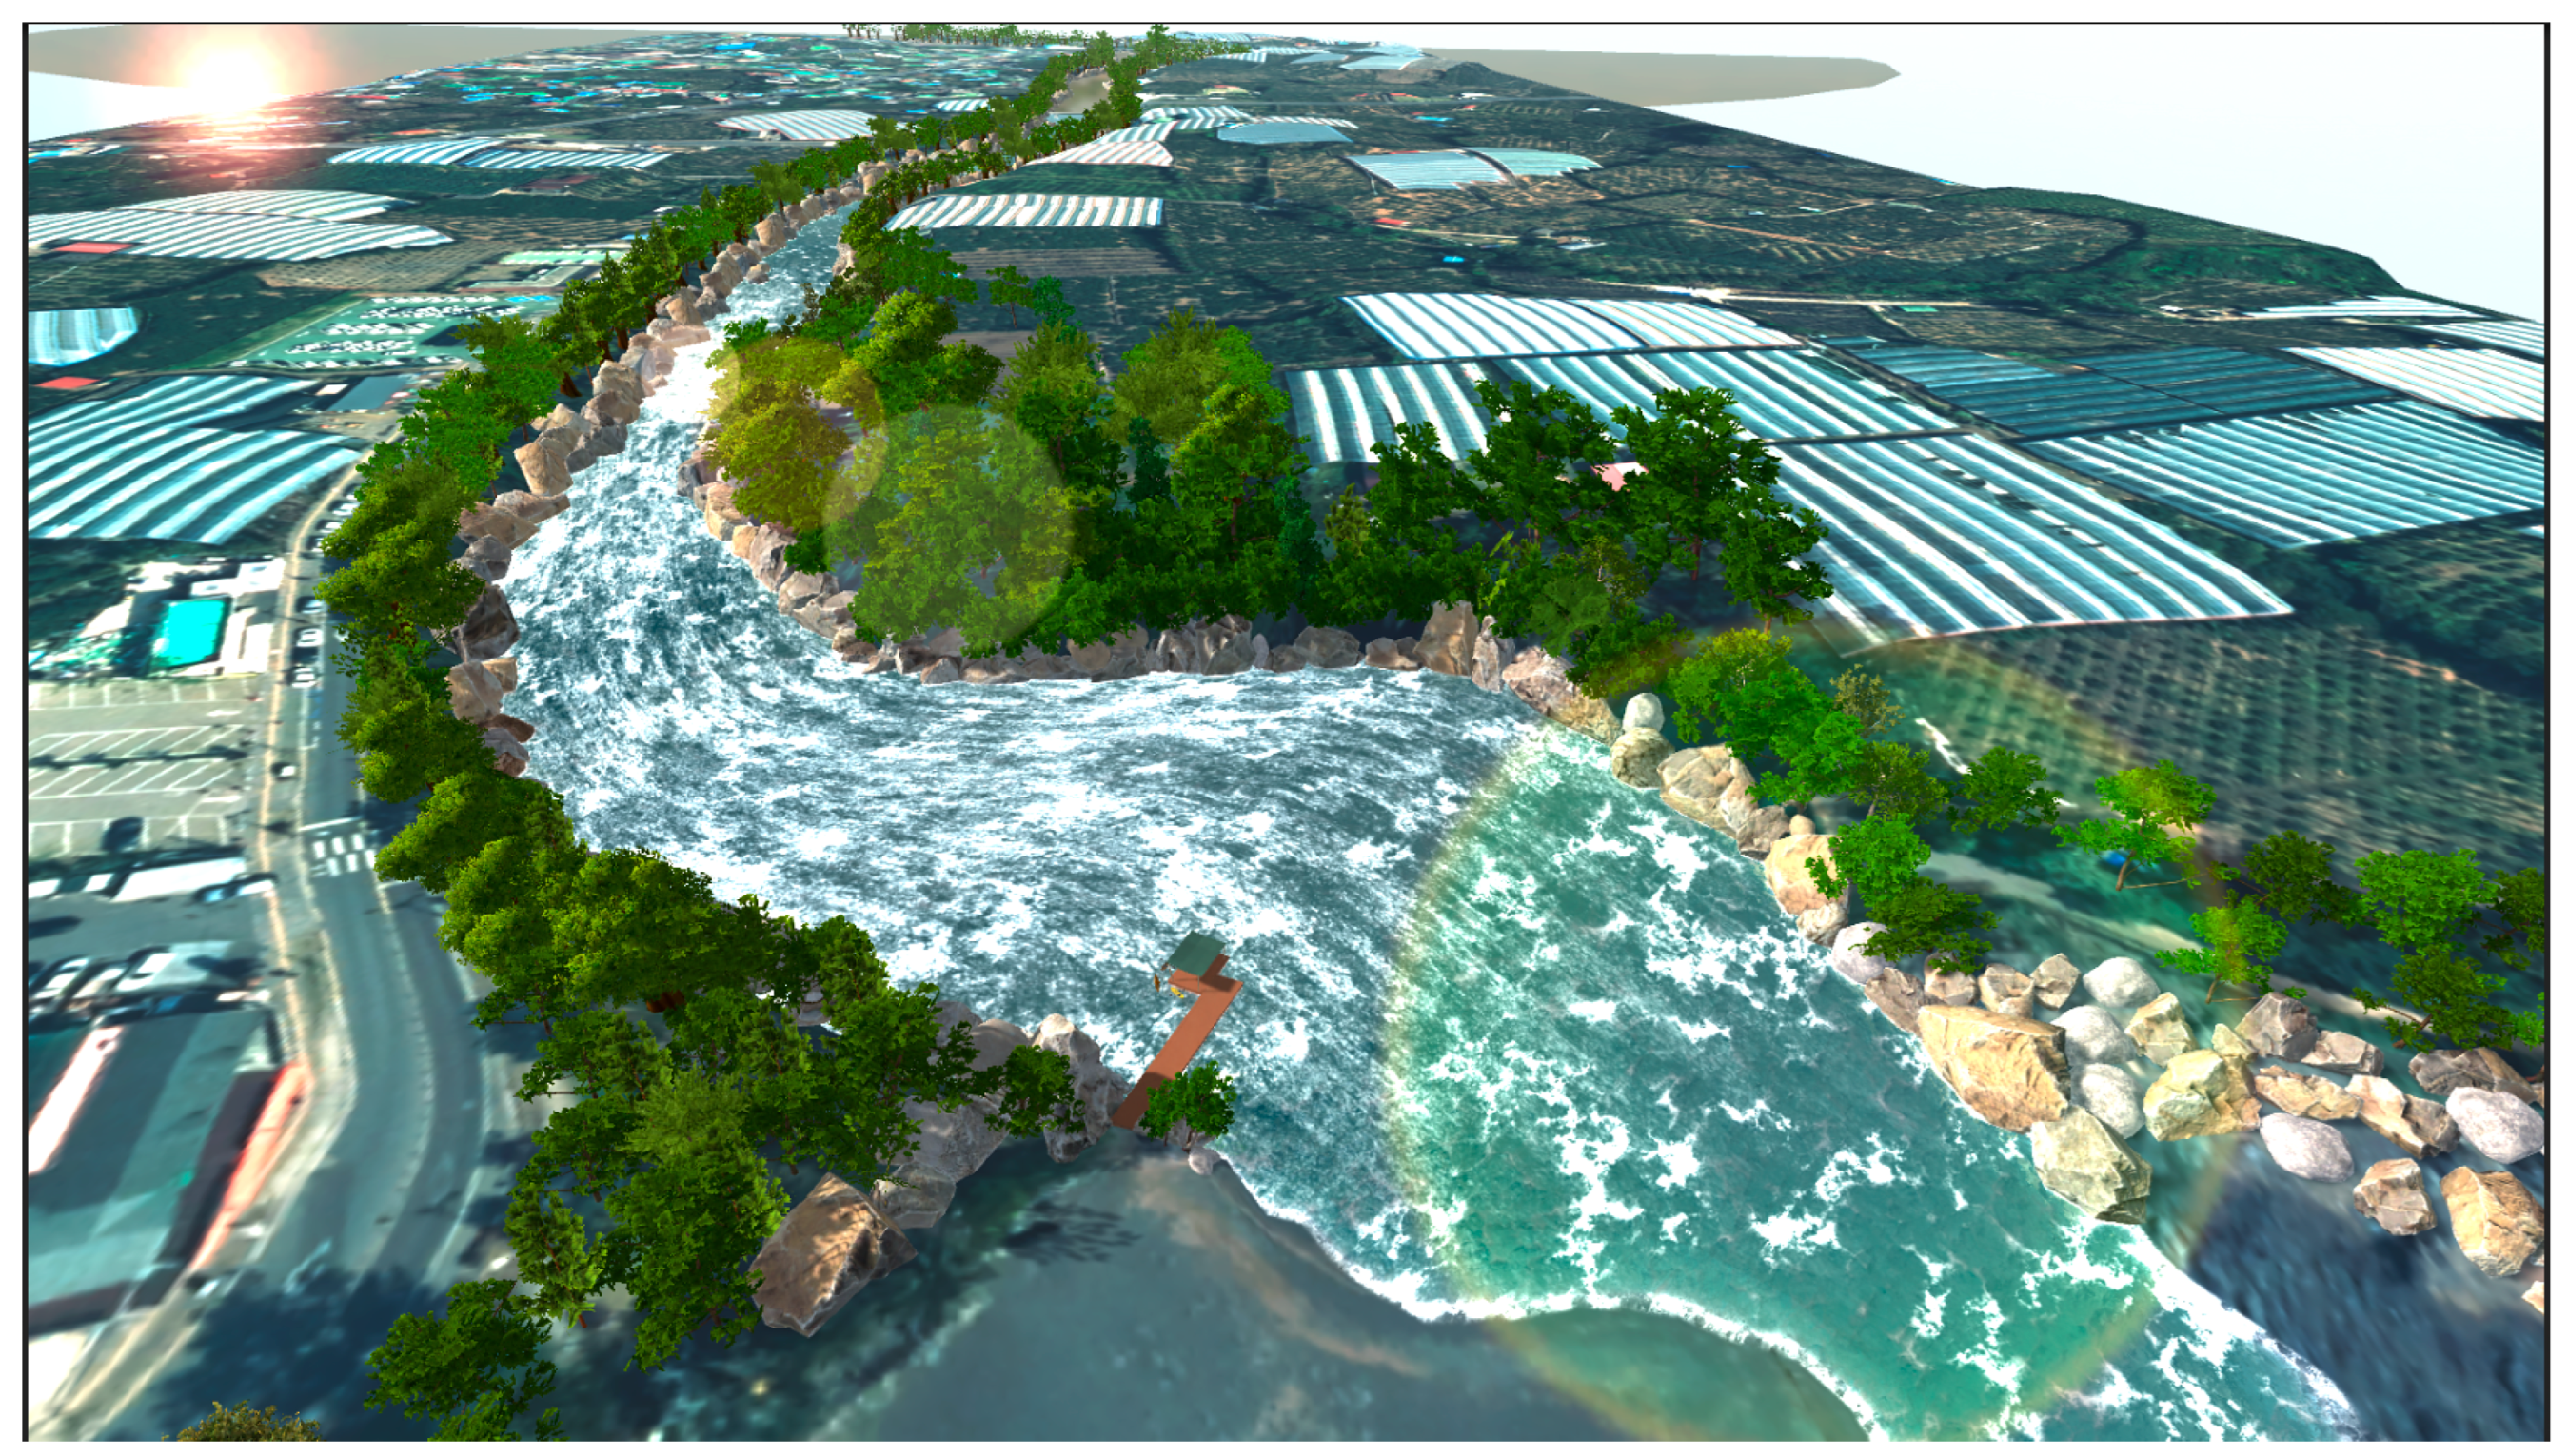
6. Digital Twin-Based Application
The practical application of the developed flood prediction model is realized through the implementation of a digital twin-based platform for river management. This chapter describes how to integrate advanced deep learning models with digital twin technology to create a comprehensive system for real-time flood monitoring, prediction, and decision-making.
Figure 6 describes the digital twin-based application of the designed river flood prediction technologies.
The digital twin technology uses in this study virtually represents the Hyodon River and its surroundings. It integrates real-time data from rain gauges and water level sensors processed by the prediction model to provide an accurate and up-to-date overview of the river conditions. The platform visualizes this information in a three-dimensional (3D) environment, allowing users to interact with realistic simulations of the river’s hydrological behavior.
The main function of the digital twin platform is to display predicted flood conditions and evacuation warnings. By integrating the outputs of CNN-based, RNN-based, and CNN-RNN combined models, the platform provides accurate predictions of potential flood events up to one hour in advance. These predictions are visualized in a user-friendly interface, with different warning levels displayed with unique colors and markers to help users quickly identify risk areas.
Future work will focus on further enhancing the digital twin platform by installing additional sensors. In particular, we will add water level sensors to various areas of the Hyodon River to more accurately monitor the river’s conditions.
7. Conclusions
This study demonstrates the design and implementation of an advanced flood prediction system tailored to the unique hydrological characteristics of Hyodoncheon, Jeju Island. By leveraging the complementary strengths of CNN and RNN architectures, the proposed hybrid model achieves high prediction accuracy at all flood severity levels, including rare large-scale evacuation events. Our data-driven approach provides a practical and scalable solution that leverages existing sensor infrastructure to enable 1 h advance predictions essential for timely evacuation and disaster mitigation. Experimental results show that the combined CNN-RNN model outperforms the standalone architecture. The model achieves a macro average F1 score of 0.98 and an overall accuracy of 100%, significantly outperforming the CNN-only model (macro F1 score: 0.88) and the RNN-only model (macro F1 score: 0.90). These widely accepted indicators in predictive modeling demonstrate the reliability of this model, especially in situations where false negatives can result in high social costs. Furthermore, integrating this model into a 3D visualization-based digital twin platform would add real-world value by enabling real-time monitoring and intuitive risk communication. This convergence of deep learning and digital twin technologies will make a new contribution to smart flood management.
In particular, there are three major innovations in this study. First, it is the first study to apply a CNN-RNN combined architecture to flood prediction in a volcanic river system characterized by steep terrain and rapid runoff dynamics, such as Jeju Island. Second, the system is built entirely on real sensor data and provides a data-driven alternative to existing hydrological models by predicting multi-level evacuation warnings through end-to-end learning. Third, the prediction model is tightly coupled with a 3D digital twin visualization platform to not only provide accurate predictions but also provide an intuitive and actionable decision-making tool for disaster management authorities.
8. Future Works
The proposed deep learning-based flood prediction and digital twin system showed excellent performance in multi-stage evacuation warning prediction, but it has several limitations that suggest future research directions.
First, the model was trained and validated using data from a single river in a volcanic area. Therefore, the generalizability to other hydrological contexts is not yet verified. In future studies, we plan to apply transfer learning or meta-learning techniques to apply the model to other rivers with minimal retraining. Second, we plan to introduce modeling techniques that are more resilient to errors to address the risk of partial data loss or corruption. These include assessing the robustness of the prediction model under various missing data scenarios, developing alternatives to linear interpolation (e.g., model-based or attention-based methods), and introducing redundancy mechanisms such as cross-sensor validation or ensemble prediction. These improvements aim to ensure the reliability and resilience of the real-time flood prediction system under the constraints of real environments.
Future work will also include a more comprehensive benchmarking of existing models and machine learning approaches. These include hydrological simulation models such as SWAT, statistical time series models such as Auto Regressive Integrated Moving Average (ARIMA) [
28,
29,
30], and traditional machine learning algorithms, such as random forests, gradient boosting, and support vector machines (SVM) [
31,
32,
33]. Through these comparative experiments, we aim to quantitatively verify the superiority, limitations, and trade-offs of deep learning-based frameworks in terms of predictive accuracy, interpretability, and computational cost.


