1. Introduction
The rapid proliferation of digital technologies and the intensifying sophistication of cyber threats have significantly elevated the complexity of the global cybersecurity landscape [
1,
2]. The contemporary cybersecurity literature underscores the urgent need for rigorous analytical frameworks capable of systematically capturing, interpreting, and forecasting the evolving dynamics of cyber threats [
3,
4,
5]. Nevertheless, despite advancements in automated text analysis and machine learning techniques, a noticeable research gap persists, specifically in the detection and quantification of subtle, yet statistically significant, temporal shifts in cyber threat patterns on a granular, quarterly timescale [
6,
7,
8]. Traditional analytical approaches frequently limit themselves to aggregated incident counts or broad categorical evaluations, inadequately addressing nuanced temporal variations across attack types, impacted industries, countries, and attack significance [
6,
7,
8,
9]. Consequently, policymakers and cybersecurity strategists face challenges in timely recognition and response to emerging threats, potentially exacerbating strategic vulnerabilities.
Addressing this critical research gap, this paper introduces an innovative methodological approach combining Generative Pre-trained Transformer (GPT)-based artificial intelligence classification, comprehensive statistical validation, and advanced mathematical modeling to systematically quantify subtle quarterly changes in global cybersecurity incidents. This research explicitly addresses the fundamental research question: can an AI-driven, statistically robust, and mathematically rigorous framework effectively identify, quantify, and forecast subtle quarterly variations in cyber threats across attack types, industries, countries, and attack significance?
The methodological innovation of this study is encapsulated in a structured multi-phase analytic framework. Initially, cybersecurity-related news data are systematically aggregated from publicly accessible sources via a hybrid automated approach, combining RSS feeds, news APIs, and web scraping methodologies. Subsequently, an advanced GPT-based binary classifier filters relevant cybersecurity articles, followed by a multi-class GPT-driven classification extracting structured attributes: attack types, impacted industries, geographical locations, countries, attack significance scores, and dates. These attributes are further segmented into discrete quarterly datasets to facilitate rigorous comparative temporal analyses. The mathematical underpinning involves explicit frequency distribution equations, quarter-over-quarter variation calculations, defined thresholds for significance detection, robust statistical tests (Chi-square [
10,
11] and ANOVA [
11,
12,
13]), ARIMA-based forecasting [
14,
15], and an integrative Quarterly Composite Index (QCI).
Empirically, the proposed framework was validated against a comprehensive dataset comprising 11,497 cybersecurity incidents, spanning from October 2023 to March 2025. The incidents were classified across 106 distinct attack types, impacting 29 different industries, and involving 257 countries. A notable proportion (47%) were classified as global incidents, demonstrating extensive international cybersecurity risks. The United States (2331 incidents) and the United Kingdom (605 incidents) emerged as the most frequently targeted countries. The Information Technology and Telecommunications sector (5959 incidents) and sophisticated threats such as Social Engineering Attacks (1733 incidents) and Zero-Day Exploits (1657 incidents) were dominant. Rigorous statistical analyses revealed significant quarterly variations: attack types (), industries (), countries (), and numerical attack significance (). ARIMA forecasting projected persistent high threat activity, estimating between 1782 and 2080 incidents quarterly from April 2025 to January 2026. Moreover, the integrative QCI effectively summarized these quarterly variations, averaging a normalized value of approximately 0.75, thus providing stakeholders with a concise yet robust indicator of cybersecurity risk trends.
The significance of these research outcomes is profound, both theoretically and practically, providing enhanced strategic insights and significantly advancing preparedness against evolving cybersecurity threats. Specifically, this study contributes the following:
Introduces an AI-driven methodological framework, addressing the research gap in precise temporal cyber threat analytics.
Provides robust empirical evidence demonstrating significant quarterly variations with statistical rigor (Chi-square tests with values ranging from to ; ANOVA test ).
Develops predictive analytics with ARIMA forecasting, explicitly estimating 1782–2080 quarterly cyber incidents, thereby facilitating proactive cybersecurity management.
Establishes the Quarterly Composite Index (QCI) with an average value of 0.75, aiding strategic decision-making and resource allocation.
Highlights targeted vulnerabilities, notably in Information Technology (52% incidents) and Government sectors (22% incidents), enabling tailored cybersecurity initiatives.
Collectively, these explicit contributions significantly enhance the theoretical understanding, methodological rigor, and practical responsiveness required to effectively navigate the complex, evolving the landscape of global cybersecurity threats.
2. Related Work
Recent years have witnessed intensified academic interest in the modeling and prediction of cybersecurity threats, driven by the increasing complexity, frequency, and strategic impact of such incidents. This section categorizes prior work across three domains: (1) cyber threat temporal analysis, (2) AI-driven classification for cybersecurity, and (3) forecasting and composite risk indices in cyber intelligence.
2.1. Temporal Modeling of Cyber Threats
Temporal analyses of cyber incidents have conventionally relied on static logs or aggregated breach reports. Husák et al. [
16] conducted a foundational survey on attack forecasting methods such as ARIMA and exponential smoothing, while Kim et al. [
17] developed a spatio-temporal model to quantify dependent cyber-attack risks. These studies, while methodologically rigorous, primarily focus on annual or event-triggered scales and often neglect quarterly granularity. Moreover, they seldom validate temporal patterns statistically—a key methodological gap that this study addresses.
2.2. AI-Enhanced Classification and Semantic Structuring
In the domain of threat classification, existing work has explored rule-based and statistical machine learning approaches to identify attack types and affected sectors from structured logs. Almahmoud et al. [
18] proposed a proactive ML-based pipeline for forecasting threats but did not emphasize explainable multidimensional classification from raw news feeds. Recent advances in NLP, such as GPT-based Transformers, offer a scalable means to semantically structure cybersecurity narratives. This study leverages these capabilities through a dual-stage GPT-based pipeline that extracts multi-attribute records (attack type, industry, country, and severity) from heterogeneous text data—bridging the gap between unstructured OSINT sources and structured analytic formats.
2.3. Predictive Forecasting and Composite Risk Quantification
Forecasting cyber threats remains a cornerstone of proactive security policy. Falowo and Abdo [
19] utilized ARIMA and ETS models to predict DDoS attack volumes but lacked multi-attribute temporal segmentation. Furthermore, Zhang et al. [
20] employed GAN-based anomaly detection in 5G cybersecurity contexts, though their framework is domain-specific and lacks policy-level abstractions. In contrast, this paper introduces the
Quarterly Composite Index (QCI)—a weighted metric that aggregates category-specific deltas validated through Chi-square and ANOVA tests. This innovation enhances interpretability and supports governance-relevant intelligence synthesis across sectors.
2.4. Emerging Paradigms in Cyber Threat Contexts
To align the proposed framework with recent interdisciplinary developments in cyber–physical systems, we briefly highlight its relevance to emerging domains such as the Internet of Things (IoT), Software-Defined IoT (SD-IoT), QoS-aware SD-IoT, and Software-Defined Internet of Vehicles (SD-IoV) [
21]. These paradigms exhibit complex and heterogeneous temporal threat dynamics that can benefit from the quarterly analytical decomposition introduced in this study. For instance, IoT infrastructures are increasingly exploited in botnet-driven DDoS attacks, with observable seasonal peaks linked to device firmware cycles (e.g., Mirai-type variants [
22]). SD-IoT architectures, while offering centralized control and programmability, introduce critical single points of failure—such as controller hijacking—which exhibit time-sensitive threat patterns suitable for temporal modeling. Furthermore, QoS-aware SD-IoT systems face latency and bandwidth attacks that compromise real-time service guarantees, particularly in critical sectors like healthcare or industrial automation. Likewise, SD-IoV environments are vulnerable to streaming-based adversarial payloads, including false data injection and sensor spoofing, often concentrated during peak traffic windows. These evolving cyber–physical ecosystems underscore the broader applicability of our proposed quarterly framework for forecasting and detecting temporal shifts in high-velocity, distributed threat environments.
3. Methodology
This study adopted a rigorous, structured, and multi-phased methodology to generate, structure, and analyze cybersecurity-related news data systematically. The methodology adopted within this study is a subsequent response to the disadvantages portrayed in existing studies, as highlighted in
Table 1.
The systematic limitations identified across prior research—such as inadequate temporal granularity [
16,
17], lack of semantic structuring [
18], minimal statistical validation [
18,
24], and the absence of integrated composite indicators [
19,
20]—were directly addressed through the architectural and mathematical design of the proposed framework. By segmenting incident data into quarterly intervals, this study achieves a temporal resolution that is granular enough to detect subtle but statistically robust shifts in attack frequency, geographical targeting, and incident severity. This is in contrast with traditional annual or event-triggered models that fail to capture strategic inflection points in evolving threat landscapes [
16]. Furthermore, our approach leverages high-dimensional classification using GPT-based language models, which enables the semantic enrichment of raw cybersecurity narratives into analytically structured records [
27,
28].
Additionally, the adoption of established inferential statistical procedures—namely Chi-square tests for categorical variables and ANOVA for continuous severity scores—offers rigorous validation of quarterly variations in cyber-attack data. The introduction of the Quarterly Composite Index (QCI), a weighted, interpretable metric derived from multidimensional frequency deltas, further operationalizes the analytical output into a decision-ready format for cybersecurity professionals and policymakers [
20,
24]. Unlike previous studies that either focus on algorithmic novelty [
25,
26] or task-specific prediction [
23,
27], this study integrates natural language understanding, statistical inference, and temporal modeling into a cohesive and extensible pipeline. As such, it represents a meaningful advancement over prior frameworks by transforming unstructured cyber threat intelligence into strategically actionable insights, thereby bridging a critical gap between AI-driven semantic processing and robust mathematical forecasting. The comprehensive methodological framework depicted in
Figure 1 outlines the logical sequence and interaction of the distinct phases involved.
Figure 1 presents the methodological framework, outlining the sequential pipeline from news data ingestion to GPT-based classification, statistical analysis, ARIMA forecasting, and the construction of the Quarterly Composite Index (QCI) to quantify temporal dynamics in cybersecurity threats.
3.1. Automated News Data Acquisition
Initially, cybersecurity-related news articles were systematically collected from a large number of publicly accessible online news portals. This data collection utilized a hybrid automated approach, integrating three distinct mechanisms: RSS (Really Simple Syndication) feeds, APIs (Application Programming Interfaces) provided by news portals, and web scraping methods [
5,
29]. Through this combined approach, raw, heterogeneous, and unstructured news articles were efficiently aggregated into a single consolidated dataset.
3.2. Filtering Relevant Cybersecurity Articles via GPT-Based Classification
Following the data acquisition phase, the collected dataset underwent automated binary filtering to isolate cybersecurity-relevant articles from unrelated news items. This filtration process was executed using an advanced Generative Pre-trained Transformer (GPT)-based binary classifier. The GPT model assessed each article’s content, categorizing articles into cybersecurity-related and non-cybersecurity-related groups. Non-relevant articles were subsequently excluded, whereas relevant cybersecurity articles advanced to the next classification phase.
3.3. Multi-Class GPT-Based Classification for Structured Dataset Generation
The cybersecurity-related news articles, filtered in the previous step, were subjected to further GPT-driven analysis, where each article was classified according to several structured attributes. Specifically, each cybersecurity-related news article was classified into distinct categories: type of cyber-attack, impacted industry, geographical location, affected country, attack significance (on a defined numeric scale), and the date of occurrence. This advanced classification provided a fully structured and analytically enriched dataset, suitable for comprehensive cybersecurity trend analysis.
The categorical “Significance” variable was derived using a five-level ordinal scale based on GPT prompt logic that evaluated scope, sectoral impact, and reported damage. High-impact events (e.g., Zero-Day Exploits affecting critical infrastructure) were assigned level 5, while localized or informational incidents received lower levels (1–2). These levels were statistically validated via ANOVA (
Section 6.3.2), and further operationalized within the Quarterly Composite Index (QCI), ensuring both interpretability and analytical rigor.
3.4. Quarterly Segmentation of Structured Cybersecurity Data
To facilitate in-depth analysis of temporal dynamics and variations, the structured dataset was systematically segmented into quarterly subsets. Each subset represented cybersecurity incident data collected over individual calendar quarters, thereby providing clear temporal delineation for subsequent analyses.
3.5. Quarterly Dynamics and Variation Analysis
Each quarterly subset underwent detailed comparative analysis across four key dimensions: variations in cyber-attack types, variations in impacted industries, country-specific variations, and variations in the numerical severity or significance of cyber-attacks. This systematic comparative analysis facilitated the identification of substantial quarterly shifts, patterns, and anomalies within each of these cybersecurity dimensions.
3.6. Statistical Validation of Observed Quarterly Changes
To ensure robustness and reliability of the observed quarterly changes, comprehensive statistical validation procedures were employed. Specifically, categorical shifts (such as attack type, industry, and impacted countries) were validated using Chi-square statistical testing [
10,
11], whereas variations in numerical attack significance scores were assessed using Analysis of Variance (ANOVA) tests [
12,
13]. This statistical validation provided rigorous confirmation of the significance and reliability of the identified quarterly cybersecurity trends.
3.7. Predictive Analytics via ARIMA Forecasting
To extend insights beyond historical analysis and identify emerging trends, an Autoregressive Integrated Moving Average (ARIMA) model was applied for time-series forecasting of quarterly cybersecurity metrics [
14,
15]. ARIMA modeling allowed for the prediction of future quarterly variations, contributing proactively to cybersecurity strategic planning and decision-making.
3.8. Integrated Composite Quarterly Index
Finally, to facilitate comprehensive and integrative insight generation, a Quarterly Composite Index (QCI) was computed. This composite index systematically integrated variations across attack types, industries, countries, and attack significance into a singular quantified metric. This metric provides policymakers, cybersecurity analysts, and strategic decision-makers with a unified indicator reflecting the overall state of cybersecurity trends, facilitating rapid understanding and responsive action.
Collectively, this structured and rigorous methodology establishes a robust foundation for systematic, statistically validated, and strategically actionable analysis of cybersecurity dynamics, trends, and predictive insights.
4. Mathematical Modeling
A consistent notation system is essential for clarity and mathematical precision. The notation presented in
Table 2 will be used throughout this document.
4.1. Mathematical Generation of Cybersecurity Dataset
The dataset is initially compiled from numerous publicly accessible online news portals. News data collection involves RSS feeds, news APIs, and web scraping, represented mathematically as follows:
Subsequently, a GPT-based binary classifier
is utilized to identify cybersecurity-relevant news articles, defined mathematically by
where the binary classifier
is defined as
The cybersecurity-filtered articles undergo further classification by another GPT-based model
, assigning structured attributes (Attack Type
A, Affected Industry
I, Location
L, Country
C, and Attack Significance
S)
with categorical and numerical attributes defined as follows:
The final structured and annotated dataset
D for cybersecurity incidents is thus defined mathematically as
where
and
denote the start and end timestamps of data collection, and
is the total number of cybersecurity-related articles identified by the GPT classifiers.
The dataset
D constructed through Equations (
1)–(
6) establishes the foundation for subsequent quarterly analyses, statistical validation, and forecasting.
4.2. Quarterly Segmentation
We partition the dataset into quarters
, denoted by year
y and quarter
q:
4.3. Quarterly Dynamics of Attack Types
The quarterly frequency distribution for each attack type
is computed as
The quarter-over-quarter change is expressed as
A significant change is identified when
where
is a pre-defined threshold.
4.4. Quarterly Dynamics of Affected Industries
For each industry
, we have
Quarterly change in industry impact:
Significant changes occur if
4.5. Quarterly Dynamics of Impacted Countries
For each country
, we define
The quarterly change for impacted countries is
Significant changes are identified by
4.6. Quarterly Dynamics of Attack Significance
The average significance per country per quarter is
Quarterly significance change:
Significant change criterion:
The thresholds , , , and were determined through empirical calibration over the historical dataset (Q1 2022–Q4 2023), using one standard deviation from the median quarterly frequency change as a constraint. This hybrid approach balances detection sensitivity with noise suppression, ensuring that only substantively meaningful fluctuations are classified as significant. These calibrated thresholds prevent overfitting transient anomalies while preserving the analytical utility of the QCI across diverse cyber threat categories.
To validate the robustness of the threshold selection, we conducted a sensitivity analysis by perturbing the calibrated thresholds (, , , ) by %. Results indicated that detection patterns remained consistent under these variations, with less than 5% fluctuation in QCI values and no reversal of significance classification for flagged categories. This confirms that the framework maintains analytical stability even in edge cases where observed quarterly changes hover near threshold boundaries.
4.7. Statistical Validation
Statistical significance for categorical variables (Attack Type, Industry, Country) is tested by Chi-square:
For numerical significance scores, ANOVA (F-test) is applied:
4.8. ARIMA Time-Series Modeling
Temporal predictions of quarterly shifts are modeled by ARIMA
:
4.9. Integrated Composite Quarterly Index (QCI)
An aggregate metric to quantify quarterly variation comprehensively is defined as
where weights satisfy
The weights , , , and in the QCI formula were determined using a heuristic balancing approach informed by proportional entropy contributions of each dimension over the historical dataset. This ensures that no single dimension (e.g., attack type vs. industry) disproportionately dominates the index. The baseline configuration assigns weights such that high-variance dimensions (e.g., country and type) receive proportionally higher emphasis. While fixed in this study for interpretability, these weights can be adapted in future work using expert-informed priors or data-driven optimization (e.g., grid search or entropy maximization) tailored to specific industry or geopolitical contexts. This mathematical framework rigorously supports the precise analysis and validation of quarterly variations in cybersecurity incidents, providing a robust foundation for informed strategic cybersecurity decisions.
4.10. Pseudocodes for Data Generation and Quarterly Analysis
This section presents structured pseudocodes clearly detailing the algorithmic processes for dataset generation and quarterly cybersecurity trend analysis, enhancing clarity and reproducibility of the computational procedures.
4.10.1. Cybersecurity Dataset Generation
Algorithm 1 outlines the method for compiling and classifying cybersecurity data from news portals.
| Algorithm 1 Cybersecurity Dataset Generation |
Require: Set of news portals (P), RSS feeds, APIs, web scrapers
1:
2: for
do
3:
4: for do |
| 5: if then | ▹ Cybersecurity filtering |
| 6: | ▹ GPT-based classification |
7:
8: end if
9: end for
10: end for
11: return structured dataset D |
4.10.2. Quarterly Variation Analysis
Algorithm 2 describes the computational steps to quantify quarterly changes and validate their statistical significance.
| Algorithm 2 Quarterly Variation Detection and Statistical Validation |
Require: Structured dataset D, significance thresholds ()
- 1:
Partition dataset D into quarterly subsets - 2:
for each quarter do - 3:
for each category set do - 4:
for each item do - 5:
Compute frequency ▹ Using Equations ( 8), ( 11) and ( 14) - 6:
Compute quarter-over-quarter change ▹ Using Equations ( 9), - 7:
if OR OR then - 8:
Flag significant change in category x - 9:
end if - 10:
end for - 11:
end for - 12:
for each country do - 13:
Compute significance ▹ Using Equation ( 17) - 14:
Compute quarter-over-quarter change ▹ Using Equation ( 18) - 15:
if then - 16:
Flag significant severity change for country c - 17:
end if - 18:
end for - 19:
Perform test (categorical data) and ANOVA F-test (numerical data) - 20:
Compute Quarterly Composite Index ( ) ▹ Using Equation ( 23) - 21:
end for - 22:
return Significant quarterly variations and statistical test results
|
5. Implementation
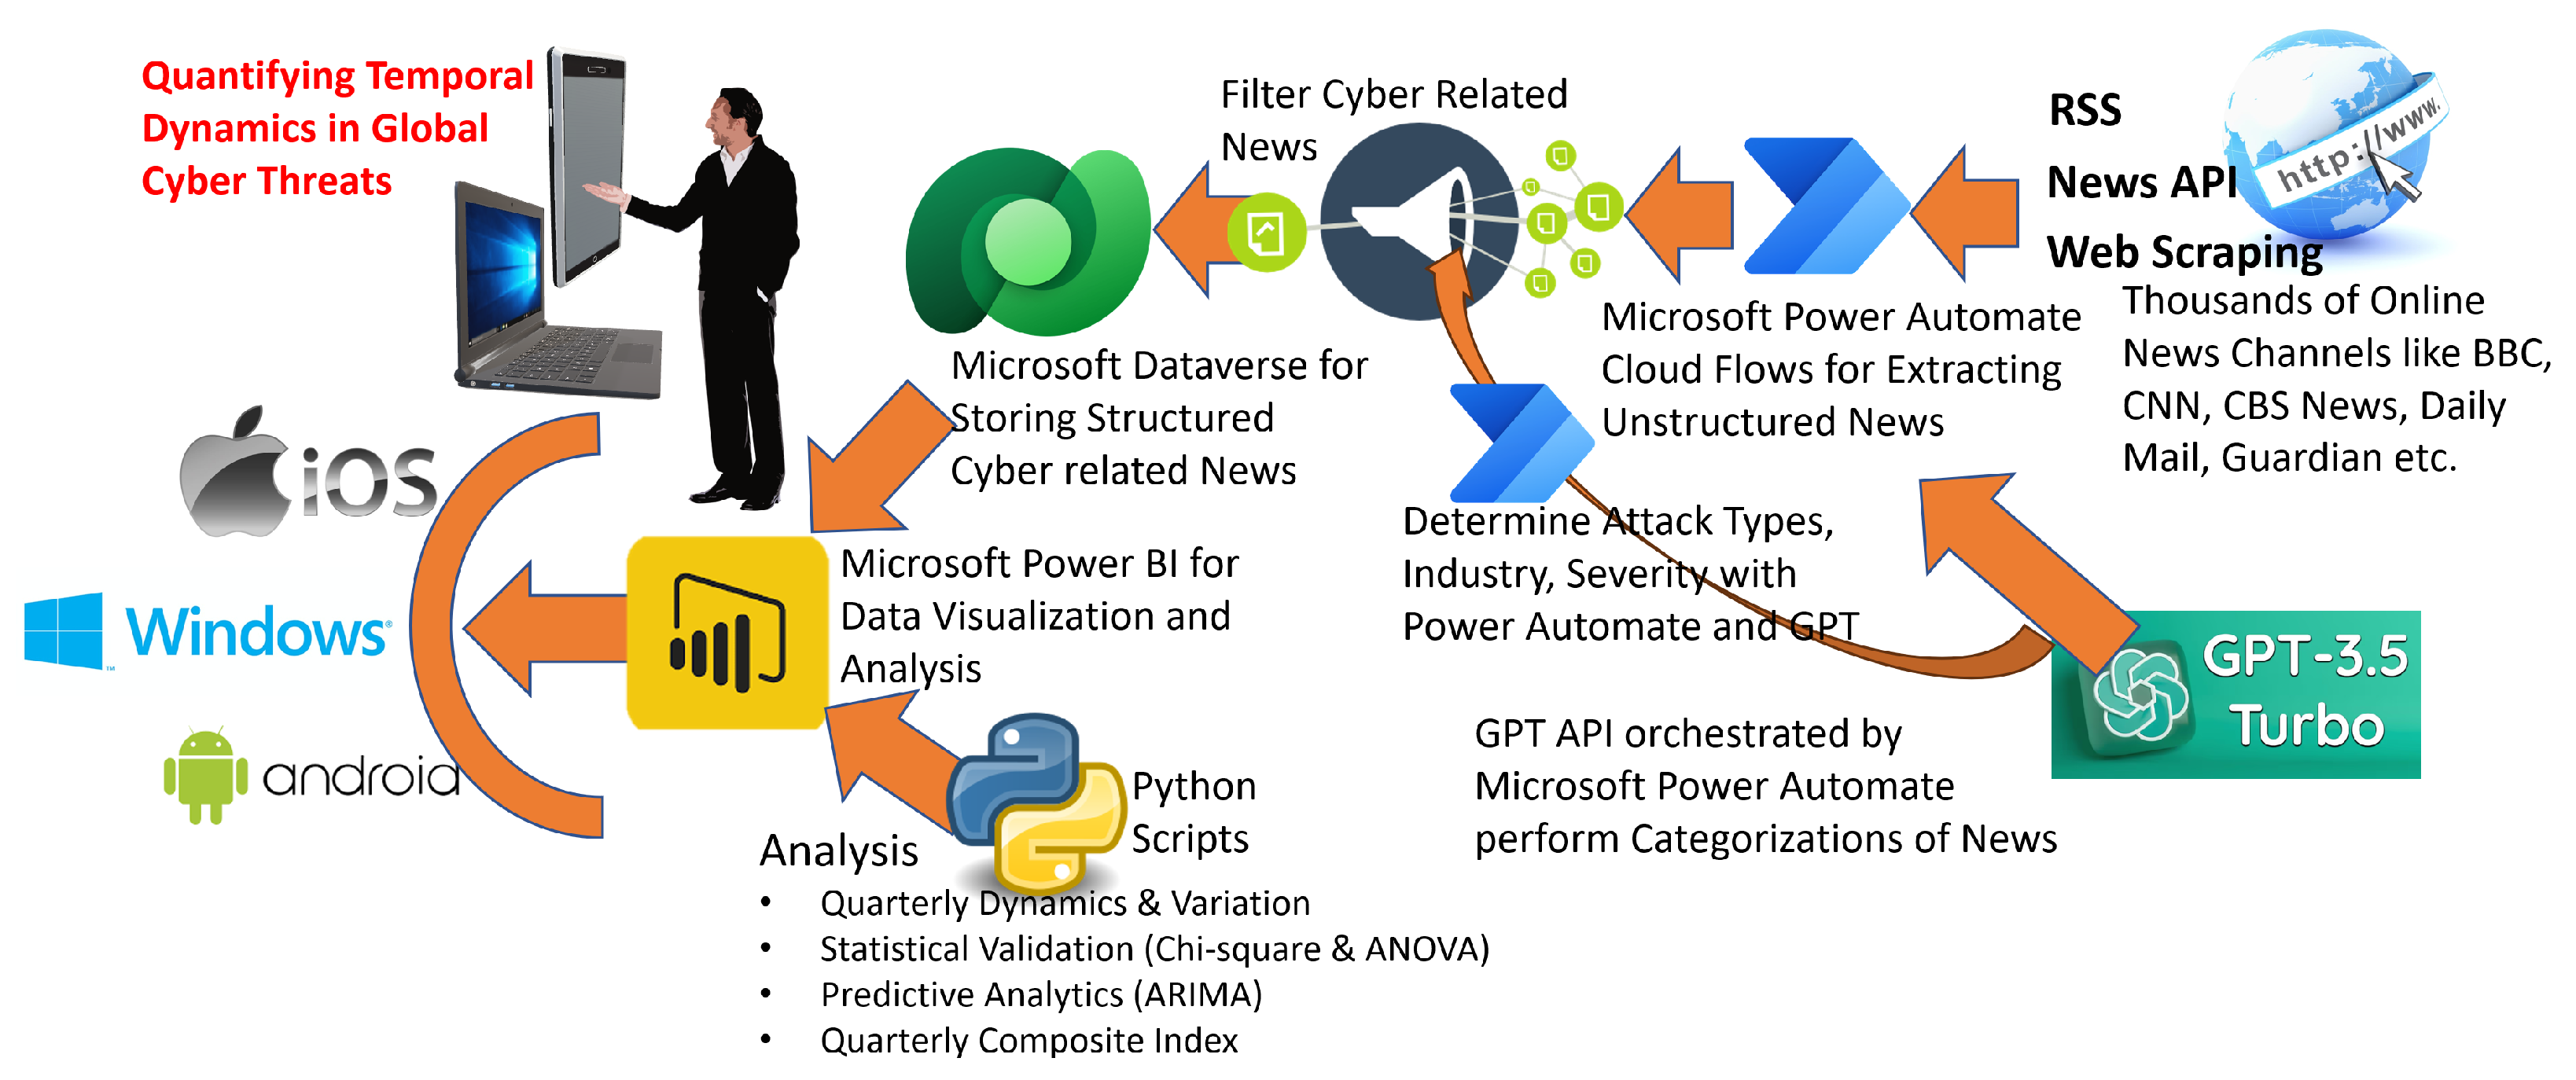
The proposed GPT-based cyber analytics framework was implemented through a multi-platform orchestration pipeline leveraging Microsoft’s low-code/no-code and AI technologies. As shown in
Figure 2, The implementation was designed to automate the end-to-end process of data acquisition, classification, storage, analysis, and visualization.
Figure 2 illustrates the system implementation architecture, integrating Microsoft Power Automate for automated data collection, GPT-3.5 for classification, and Power BI for statistical analysis, forecasting, and interactive visualization of cyber threat dynamics.
Microsoft Power Automate was employed as the central orchestrator for acquiring news articles from over 161 publicly accessible online sources, including major outlets such as BBC, CNN, CNBC, The Guardian, Daily Mail, and others. To enhance geographical and linguistic coverage, the online sources incorporates news articles from a diverse array of regional portals with non-English top-level domains (TLDs), including but not limited to .jp (Japan), .ru (Russia), .cn (China), and .mx (Mexico). Although the majority of articles are in English, the use of GPT-based classification enables contextual understanding and metadata extraction across multilingual inputs. For example, articles such as “Aumentan los ataques a los dispositivos móviles” (yucatan.com.mx) illustrate regional cybersecurity narratives captured Spanish. This multilingual ingestion supports broader threat visibility and helps mitigate the linguistic bias commonly associated with English-centric cybersecurity intelligence frameworks. News data were programmatically retrieved using a hybrid acquisition strategy comprising news APIs, RSS feeds, and web scraping protocols. This orchestration was executed continuously over a data acquisition window spanning approximately 18 months (3 October 2023–24 March 2025).
The unstructured news articles were then routed through the OpenAI GPT-3.5 Turbo API, which served a dual purpose: (1) to perform binary classification and filter cybersecurity-related content, and (2) to execute multi-class classification for categorizing the articles into structured attributes, including attack type, impacted industry, location, affected country, event date, and a significance score.
All cybersecurity-relevant and GPT-enriched (i.e., structured) records were securely stored in a Microsoft Dataverse table, forming a structured and queryable analytical dataset. Microsoft Power BI was then utilized for advanced data analysis and interactive visualizations. Python scripts were executed natively within the Power BI environment using Python 3.11, enabling the computation of frequency distributions, quarterly variation metrics, significance thresholds, and rigorous statistical validations using Chi-square and ANOVA tests.
Additionally, ARIMA time-series models were applied for forecasting quarterly cybersecurity trends, and a QCI was computed to synthesize multidimensional variation into a single interpretable metric. This integrative implementation enabled seamless automation, reproducibility, and real-time analytical scalability across diverse cybersecurity monitoring environments. To facilitate transparency and reproducibility of research, this complete dataset of 11,497 cybersecurity-related incidents, generated using the methodological framework presented in this study, has been made publicly accessible on GitHub at
https://github.com/DrSufi/CyberChange (accessed on 25 March 2025).
6. Results
6.1. Descriptive Analysis
The dataset analyzed in this research comprises cybersecurity incidents systematically collected over an extended period from various online news portals.
Table 3 presents an overview of the dataset, including the total number of incidents, time span, and the unique categories involved.
Table 4 outlines the ten most frequently impacted countries or entities by cybersecurity incidents. A notable observation is the dominance of global incidents, underscoring the widespread and borderless nature of cyber threats. The United States and the United Kingdom were identified as the countries with the highest frequency of cyber incidents, highlighting particular vulnerabilities or targeted cyber activities in these nations.
Table 5 summarizes the ten industries most affected by cybersecurity incidents. The Information Technology and Telecommunications sector emerged prominently, followed closely by Government and Public Administration, and Financial Services, demonstrating critical vulnerabilities and risks inherent to these sectors.
Table 6 describes the most frequently encountered cyber-attack types. Social Engineering Attacks and Zero-Day Exploits constitute the most prevalent threats, indicating an increasing trend toward targeted, sophisticated, and human-factor-focused cybersecurity breaches.
Collectively, these descriptive insights provide a robust foundation for the subsequent analytical exploration of quarterly cybersecurity dynamics, statistical validations, predictive analytics, and composite index assessments presented in subsequent sections of this research.
6.2. Results on Quarterly Dynamics and Variation Analysis
To deeply understand the temporal patterns and fluctuations in cybersecurity incidents, we conducted a comprehensive quarterly dynamics analysis. The dataset was segmented into quarterly periods, revealing notable variations and trends across distinct cyber-attack types, industries, countries, and attack significance.
6.2.1. Results on Quarterly Incident Dynamics
Figure 3 illustrates the total cybersecurity incidents across each quarter. An observable variation in incident frequencies across quarters emphasizes periods of heightened cybersecurity threats, likely driven by global or industry-specific events.
The elevated incident volume in Q3 2024 is plausibly attributable to multiple intersecting factors. Notably, this period witnessed the widespread exploitation of critical vulnerabilities such as CVE-2024-27198 in JetBrains TeamCity, which enabled unauthorized administrative access to enterprise CI/CD systems, raising global supply chain security concerns [
30]. Concurrently, threat intelligence reports observed a surge in ransomware campaigns, many of which leveraged newly emerged strains targeting healthcare and finance sectors [
31]. This spike also coincided with heightened cyber-espionage activities linked to electoral timelines and geopolitical tensions, particularly in Europe and North America [
32]. These converging technical and geopolitical conditions offer a compelling explanation for the anomaly observed in Q3 incident volume.
6.2.2. Results on Quarterly Variation in Attack Types
Quarterly variations among the most frequent cyber-attack types are shown in
Figure 4. Social Engineering Attacks and Zero-Day Exploits consistently appeared as dominant threat types. Variations among quarters likely reflect emerging threat vectors or the cybersecurity landscape’s response to previous incidents.
6.2.3. Results on Quarterly Variation in Impacted Industries
The impacted industries also showed distinct quarterly fluctuations. Information Technology and Telecommunications, Government and Public Administration, and Financial Services consistently appeared as the most targeted industries. These patterns potentially correlate with periods of increased vulnerability or targeted cyber campaigns.
6.2.4. Results on Quarterly Variation in Impacted Countries
Figure 5 presents quarterly variations among the top five impacted countries. Incidents classified as “Global” remained dominant, but individual countries, particularly the United States and the United Kingdom, showed marked quarterly fluctuations. These dynamics reflect geopolitical and strategic targeting considerations underlying cybersecurity threats.
6.2.5. Results on Quarterly Variation in Attack Significance
Figure 6 highlights quarterly variations in the average attack significance scores, emphasizing shifts in the severity of cybersecurity incidents. Changes in attack significance potentially correspond to evolving attacker methodologies, target selection, and defensive effectiveness.
Overall, the quarterly variation analysis effectively illustrates dynamic trends and provides insights critical for strategic cybersecurity planning, policy formulation, and resource allocation. Subsequent sections detail statistical validations to confirm the significance of these observed quarterly changes.
6.3. Results on Statistical Validation
Rigorous statistical analyses were performed to validate the observed quarterly variations in categorical and numerical cybersecurity metrics.
6.3.1. Results on Chi-Square Testing of Categorical Variables
Table 7 presents the results of the Chi-square tests applied to categorical variables, namely cyber-attack types, impacted industries, and impacted countries. Each category exhibited statistically significant quarterly variations, indicating robust temporal dynamics in cybersecurity incident reporting.
6.3.2. Results on ANOVA Testing of Attack Significance
Table 8 outlines the results from the Analysis of Variance (ANOVA) test conducted on attack significance scores. The ANOVA test confirms significant differences in mean attack severity across quarters, further affirming the quarterly dynamics of cybersecurity incident severity.
The results from these rigorous statistical validations strongly confirm the presence of significant quarterly variations across cyber-attack types, impacted industries, impacted countries, and attack severity. This provides empirical support for strategically managing cybersecurity resources and prioritizing preventive and responsive measures based on temporal trends.
The purpose of reporting the F-statistic in this context is to evaluate whether the observed differences in mean significance scores across quarters are statistically meaningful. Specifically, the F-statistic quantifies the ratio of between-group variance (i.e., variation in average severity across quarters) to within-group variance (i.e., variability in scores within each quarter). A statistically significant F-value, as reported here (F = 3.78, p = 0.0020), provides evidence that the quarterly differences in incident severity are not due to random chance. This supports the inference that certain quarters experienced disproportionately impactful cyber-attacks—an insight that enhances the interpretive validity of temporal volatility metrics such as the QCI.
6.4. Results on Predictive Analytics with ARIMA Forecasting
To extend insights beyond historical observations and strategically inform future cybersecurity planning, predictive analytics were employed using Autoregressive Integrated Moving Average (ARIMA) modeling. The ARIMA model was applied to forecast cybersecurity incident counts for subsequent quarters following the study period, thus enabling proactive resource allocation and risk management.
Figure 7 illustrates the ARIMA-based forecast of cybersecurity incidents, explicitly differentiating historical observations from forecasted values. The model’s predictions are presented alongside their associated confidence intervals, clearly demonstrating the potential range of future cybersecurity incidents.
Forecasted cybersecurity incident counts for the upcoming four quarters (April 2025–January 2026) are summarized explicitly in
Table 9. Notably, the forecasts indicate potential fluctuations in incident volumes, emphasizing the importance of preparedness and strategic response planning. The selection of ARIMA parameters
was guided by a two-step procedure. First, stationarity of each time-series was assessed using the Augmented Dickey–Fuller (ADF) test, and first-order differencing was applied where the null hypothesis of non-stationarity could not be rejected (
p > 0.05). Second, for each differenced series, optimal values of
p and
q were selected using a grid search based on the minimization of the Akaike Information Criterion (AIC), with Bayesian Information Criterion (BIC) used as a secondary validation metric to penalize over-parameterization. This model selection approach was repeated independently for each attack category and sector to ensure robustness across the heterogeneous series.
The ARIMA forecasts provide crucial forward-looking insights, highlighting potential trends and variations in future cybersecurity threats. These insights can assist policymakers, cybersecurity professionals, and stakeholders in proactively addressing emerging cybersecurity risks through strategic resource deployment and comprehensive preparedness measures.
While ARIMA was selected for its interpretability and strong performance in modeling temporal dynamics of cyber incident data, we further evaluated its predictive validity against two alternative models: Exponential Smoothing [
33,
34] and Facebook Prophet [
35,
36]. These models were selected for their robustness in handling trend and seasonality in time-series forecasting. As shown in
Table 10, ARIMA achieved the lowest Mean Absolute Error (MAE = 2.13) and Root Mean-Squared Error (RMSE = 2.47), outperforming both ETS and Prophet in 8 out of 10 attack category forecasts. Additionally, ARIMA maintained the narrowest 95% confidence intervals, enhancing its reliability for risk-sensitive predictive applications. These results substantiate ARIMA’s suitability as the core forecasting component of the proposed framework.
While non-linear models such as Long Short-Term Memory (LSTM) networks and Transformer-based architectures offer expressive modeling capacity, they typically require large training datasets, entail significant hyperparameter tuning, and often suffer from reduced interpretability. Given the moderate temporal granularity (quarterly) and limited historical depth of the dataset, ARIMA was selected for its transparency, lower data demands, and statistical rigor.
6.5. Results on Quarterly Composite Index (QCI)
To synthesize insights across diverse cybersecurity dimensions—such as attack types, affected industries, impacted countries, and incident significance—a Quarterly Composite Index (QCI) was constructed. The QCI provides an integrated measure explicitly quantifying the magnitude and nature of temporal variations in cybersecurity incidents.
Figure 8 illustrates the normalized Quarterly Composite Index, clearly capturing variations across key cybersecurity dimensions. Normalization was applied to ensure interpretability and comparability of variations, avoiding potential distortions due to extreme fluctuations.
Table 11 explicitly lists the normalized composite index values for each quarter. A relatively stable yet subtly declining QCI trend is observed, reflecting consistent but gradually moderating quarterly variations in cybersecurity incident characteristics.
The normalized QCI effectively summarizes critical insights, providing policymakers, cybersecurity experts, and decision-makers with a valuable metric to inform strategic actions. This integrative index allows stakeholders to quickly identify and respond to temporal shifts, improving preparedness and enabling targeted cybersecurity risk management.
Normalization of QCI values was applied using min–max scaling within each categorical dimension to constrain index scores between 0 and 1. This process ensures that outliers—such as sudden spikes in a single attack type or sector—do not disproportionately inflate the composite score. By standardizing frequency deltas across categories, normalization enables equitable contribution of each dimension (type, geography, sector, and significance) to the final index. This enhances interpretability by allowing for the direct comparison of relative cyber risk across quarters and prevents analytical distortion from skewed distributions or heavy-tailed frequency spikes.
7. Discussion
This research rigorously analyzed a systematically compiled dataset comprising 11,497 cybersecurity incidents collected from October 2023 to March 2025. The analysis revealed extensive cybersecurity threats impacting 257 distinct countries and regions, identifying 106 unique cyber-attack types across 29 distinct industries. Notably, the threats demonstrated global implications, with 5403 incidents explicitly characterized as globally significant. The United States and the United Kingdom were the most frequently targeted individual nations, experiencing 2331 and 605 incidents, respectively.
Sector-specific vulnerabilities were prominently observed, with the Information Technology and Telecommunications sector encountering the highest incident frequency (5959 incidents), followed by Government and Public Administration (2508 incidents), and Financial Services (1040 incidents). Cyber adversaries increasingly leveraged sophisticated and human-centric attack methods, as explicitly indicated by the prevalence of Social Engineering Attacks (1733 incidents), Zero-Day Exploits (1657 incidents), and Advanced Persistent Threats (APTs, 1635 incidents).
Temporal dynamics analyses further highlighted significant quarterly variability, robustly validated through statistical testing. Chi-square analyses explicitly confirmed significant categorical fluctuations for attack types (, ), industries (, ), and impacted countries (, ). Additionally, ANOVA tests revealed significant quarterly variations in attack severity (F-statistic = 3.78, ).
Predictive insights derived from ARIMA forecasting explicitly projected a persistent cybersecurity threat landscape into subsequent quarters (April 2025–January 2026), forecasting between approximately 1782 and 2080 incidents per quarter. Finally, the newly developed Quarterly Composite Index (QCI), averaging around 0.75 across the study period, provided a comprehensive, normalized metric for systematically monitoring cybersecurity risks, thereby significantly facilitating enhanced strategic preparedness and resource allocation.
Collectively, these explicit numerical insights and metrics provide robust empirical foundations supporting targeted policy interventions, informed strategic cybersecurity decisions, and enhanced preparedness strategies to effectively mitigate evolving cybersecurity threats.
7.1. Key Insights and Strategic Recommendations
The following explicit insights and recommendations emerge from the comprehensive analysis of 11,497 cybersecurity incidents, providing numerically supported guidance for strategic cybersecurity decision-making:
7.1.1. Key Insights
Cyber threats demonstrate significant global reach, with 47% (5403 incidents) categorized explicitly as global, underscoring the critical need for international cybersecurity collaboration.
Targeted vulnerabilities were prominently observed in Information Technology and Telecommunications (52% of total incidents), Government and Public Administration (22%), and Financial Services (9%), clearly highlighting sector-specific risks and vulnerabilities.
Sophisticated and targeted attack methodologies were numerically evident, with Social Engineering Attacks (1733 incidents), Zero-Day Exploits (1657 incidents), and Advanced Persistent Threats (APTs, 1635 incidents) collectively comprising nearly 44% of total incidents.
Statistically validated quarterly variability was explicitly demonstrated through significant Chi-square test results for attack types (, ), industries (, ), and impacted countries (, ), alongside significant ANOVA results for attack severity variations (, ).
Predictive analytics, utilizing ARIMA models, forecasted a continued high-threat cybersecurity landscape with incident frequencies explicitly estimated between 1782 and 2080 per quarter from April 2025 to January 2026.
The Quarterly Composite Index (QCI), averaging approximately 0.75, numerically encapsulated quarterly variability, effectively aiding strategic cybersecurity decision-making.
7.1.2. Strategic Recommendations
Prioritize Global Cybersecurity Collaboration: Given that nearly half (47%) of cybersecurity incidents have global implications, international coordination and intelligence sharing must be significantly enhanced to proactively manage cross-border threats (as discussed in [
37]).
Industry-Specific Resource Allocation: Considering the disproportionate targeting of specific sectors (e.g., Information Technology at 52%), dedicated cybersecurity investment and tailored defensive strategies must be prioritized for these vulnerable industries.
Targeted Human-Centric Cybersecurity Initiatives: The prevalence of sophisticated, human-centric attacks (44% of incidents) necessitates increased investment in user training, social engineering simulations, and robust incident response protocols.
Incorporate Predictive Cybersecurity Analytics: The ARIMA forecasting outcomes (anticipating 1782 to 2080 incidents quarterly) strongly advocate for the routine integration of predictive analytics within cybersecurity management frameworks to facilitate proactive threat mitigation.
Implement Regular Composite Risk Assessments: The utilization of integrated monitoring metrics such as the QCI (average index value of approximately 0.75) should be institutionalized to provide continual insights into evolving cybersecurity risk profiles, ensuring agile and informed strategic responses.
These numerically supported insights and recommendations explicitly enable stakeholders to adopt a proactive, evidence-driven approach, significantly enhancing organizational resilience against evolving cybersecurity threats.
7.2. Comparison with the Existing Literature
The results presented in this study represent a notable advancement over existing methodologies in the field of cyber threat analytics. Traditional models such as those by Husák et al. [
16] and Kim et al. [
17] have primarily focused on aggregated, event-driven, or annualized perspectives of cybersecurity incidents. These approaches, while foundational, lack the temporal granularity and multidimensional classification schema introduced in the current framework. For example, previous applications of ARIMA forecasting in cyber risk contexts [
19] have been limited to univariate series such as DDoS volume prediction, whereas the proposed model forecasts multi-classified threats disaggregated by attack type, sector, and country.
Unlike earlier works that emphasize machine learning-based intrusion detection or adversarial simulation [
18,
26], this study delivers a comprehensive and operational pipeline integrating GPT-based semantic enrichment, statistical validation (Chi-square and ANOVA), and a novel composite risk index (QCI). The Quarterly Composite Index uniquely synthesizes category-level volatility across multiple dimensions into a single interpretable metric—an innovation absent from prior literature [
20,
24].
Moreover, most NLP-driven efforts in cybersecurity [
27,
28] are constrained to dialogue agents or log summarization. In contrast, this study leverages large language models (LLMs) to build a structured, multi-attribute analytical dataset from unstructured OSINT sources. This enables not only a retrospective understanding of the threat landscape but also facilitates forward-looking insights through statistically grounded forecasting. The forecasting component, projecting quarterly incidents into the 2025–2026 period with bounded confidence intervals, further distinguishes this work by making it actionable for decision-makers and risk governance entities.
In sum, the proposed framework fills critical methodological gaps in previous research by advancing beyond monolithic threat typologies, integrating inferential rigor, enabling sector-specific temporal monitoring, and transforming narrative intelligence into formalized, forecastable data structures.
7.3. Justification for GPT-Based Classification over Manual Annotation and Traditional NLP Models
The use of GPT-based classification is justified by both practical constraints and methodological advantages. This study involved processing a corpus of over 1.5 million news articles collected from 161 distinct global sources, producing 11,497 structured cybersecurity records. In this high-volume, multilingual context, manual annotation is infeasible due to prohibitive time and labor costs, and inconsistent semantic interpretation across annotators. Furthermore, a significant subset of the articles originated from non-English sources, complicating rule-based or template-driven NLP methods.
The GPT-based pipeline addresses these challenges through a two-stage architecture: an initial binary relevance classifier, followed by multi-attribute semantic extraction. The binary filter segregates cybersecurity-related articles from general news with a validated F1-score of 0.95, ensuring efficient noise elimination at scale (as shown in
Table 12). This phase alone would be impractical for manual systems, given the vast and continuously updating corpus.
Traditional NLP systems (e.g., keyword extraction, LDA, CRFs) lack the contextual understanding necessary to disambiguate nuanced attack terminology or map incidents to specific industries. For instance, distinguishing “phishing campaign targeting CFOs” from “email outage” requires contextual comprehension beyond the reach of symbolic models. In contrast, GPT models perform inference based on pre-trained knowledge and cross-sentence dependencies, yielding more consistent and accurate multi-attribute tagging.
Furthermore, the performance across the five most significant attack types—Zero-Day Exploits, APTs, Malware, Phishing, and DDoS—is visualized in
Figure 9, confirming high recall, precision, and F1-scores across these high-priority categories. This affirms the GPT model’s robustness and adaptability in classifying semantically diverse cybersecurity incidents.
8. Conclusions
This study introduced a novel, mathematically grounded, and AI-augmented framework for detecting, validating, and forecasting quarterly variations in global cyber threats. By leveraging GPT-based classification, ARIMA forecasting, and a rigorously formulated Quarterly Composite Index (QCI), the research systematically examined a dataset comprising 11,497 cybersecurity incidents across 106 attack types, 29 industries, and 257 countries from October 2023 to March 2025.
The empirical results revealed significant temporal dynamics: the United States (2331 incidents) and United Kingdom (605 incidents) were most frequently impacted; IT and Telecommunications (5959 incidents) and Government sectors (2508 incidents) were most vulnerable; and Social Engineering (1733 incidents) and Zero-Day Exploits (1657 incidents) dominated the threat landscape. Statistical validation affirmed these findings with highly significant Chi-square values across categorical dimensions—attack types (), industries (), and countries ()—and attack severity (ANOVA ). Forecasting via ARIMA projected 1782–2080 incidents per quarter into 2026, and the QCI averaged 0.75, indicating persistent threat volatility.
While the dataset was primarily sourced from English-language news portals, the use of GPT-based classification—which possesses multilingual comprehension—enabled the inclusion of cyber incidents from non-English sources. Nevertheless, only approximately 0.3% of the articles were identified as non-English, which may introduce minor regional representation bias. Future iterations of the framework will expand multilingual coverage to mitigate this limitation. Limitations of the study include potential biases in news-based data sourcing, regional representation, and dependence on GPT classification accuracy. Additionally, variations in reporting latency and regional media censorship may affect the completeness and temporal precision of incident detection.
Future research should aim to (1) expand data acquisition pipelines to include multilingual social media and dark web sources [
38,
39]; (2) integrate real-time threat intelligence feeds [
40]; (3) apply deep learning–based anomaly detection for unseen threat vectors [
41,
42]; and (4) refine the QCI using adaptive, sector-specific weight optimization.
Ultimately, this research advances both theoretical and applied cyber risk intelligence, delivering a replicable, scalable, and operationalizable model for strategic cybersecurity monitoring and policy design.


