Article

An Incentive Mechanism Based on Lottery for Data Quality in Mobile Crowdsensing

1
Tiangong Innovation School, Tiangong University, Tianjin 300387, China
2
School of Computer Science and Engineering, Central South University, Changsha 410075, China
*
Author to whom correspondence should be addressed.
Mathematics 2025, 13(10), 1650; https://doi.org/10.3390/math13101650 (registering DOI)
Submission received: 2 April 2025 / Revised: 10 May 2025 / Accepted: 11 May 2025 / Published: 18 May 2025

Abstract

:
Mobile Crowdsensing (MCS) leverages smart devices within sensing networks to gather data. Given that data collection demands specific resources, such as device power and network bandwidth, many users are reluctant to participate in MCS. Therefore, it is essential to design an effective incentive mechanism to encourage user participation and ensure the provision of high-quality data. Currently, most incentive mechanisms compensate users through monetary rewards, which often leads to users requiring higher prices to maintain their own profits. This, in turn, results in a limited number of users being selected due to platform budget constraints. To address this issue, we propose a lottery-based incentive mechanism. This mechanism analyzes the users’ bids to design a winning probability and budget allocation model, incentivizing users to lower their pricing and enhance data quality. Within a specific budget, the platform can engage more users in tasks and obtain higher-quality data. Compared to the ABSEE mechanism and the BBOM mechanism, the lottery incentive mechanism demonstrates improvements of approximately 47–74% in user participation and 14–66% in platform profits.
MSC:
68W15; 91B32

1. Introduction

Mobile crowdsensing addresses the sensing requirements of the surrounding environment through the use of mobile devices [1]. Currently, a diverse array of mobile crowdsensing systems has been developed and integrated into our daily lives, serving purposes such as environmental monitoring [2], real-time traffic condition assessment [3,4], and noise pollution monitoring [5]. In these scenarios, participants must expend resources, such as device power and network bandwidth, to support data collection and transmission during sensing tasks [6]. Given the resource expenditure by users, platforms often need to offer greater compensation, which constrains the number of users that can be engaged within a fixed budget. Moreover, providing high-quality data requires users to consume more resources, thereby diminishing their potential profits. As a result, users may compromise data quality during task execution to minimize resource consumption. Data quality is pivotal for the platform’s services. Substandard data not only fail to benefit the platform but also undermine the overall data accuracy, impairing information extraction and analysis and ultimately resulting in unreliable outcomes [7]. Consequently, attracting user participation and providing high-quality data within budget constraints is crucial for the successful application of crowdsensing.
At present, the mainstream incentive mechanism design is divided into the non-monetary incentive mechanism [8,9,10,11,12,13,14,15,16,17,18,19,20,21,22] and monetary incentive mechanism [6,23,24,25,26,27,28]. The monetary mechanism is used in most studies due to its wide range of practical application scenarios and effective incentives [29]. It uses direct monetary rewards to compensate for resource consumption in mobile devices [6,23,24,25,26,27,28], i.e., the rewards are given based on the quality of data. The non-monetary incentive mechanism uses forms other than money to motivate participants, including reputation-based incentives, social network mechanisms, and other approaches. The reputation mechanism refers to the form of motivating participants based on their historical reputation. Participants can enhance their status through accumulated reputation values, achieving an incentive effect. The social network mechanism disseminates tasks through social networks and recruits selected workers to complete them. However, these studies still employ fixed reward mechanisms to compensate users for resource consumption. This approach limits the number of selectable users due to platform budget constraints.
To address the mentioned problems, this paper proposes a lottery-based incentive mechanism that focuses on motivating user participation and improving sensing data quality. The mechanism reconstructs the user utility function and establishes a winning probability model and budget allocation scheme. Furthermore, it examines how winning probabilities and budget allocations influence users’ strategies regarding data quality, thereby motivating them to enhance data quality voluntarily to secure greater rewards. Consequently, within a fixed budget, the lottery-based incentive mechanism not only enables the selection of a larger number of users but also encourages them to improve the quality of their data, thereby boosting platform profits.
The rest of the paper is organized as follows: Section 2 presents relevant studies for incentive mechanisms in crowdsensing. Section 3 provides a detailed description of the lottery-based incentive mechanism. Section 4 validates the proposed models through simulation experiments and compares them with traditional incentive mechanisms.

2. Related Work

This paper focuses on the design of incentive mechanism for data quality and user participation, so this overview section also focuses on these two aspects of incentives.

2.1. Non-Monetary Incentive Mechanism for Data Quality and User Participation

Non-monetary incentive mechanisms generally select users using reputation records [8,9,10,11,12,13,14,15] or social network mechanisms [16,17,18,19,20,21,22]. The online incentive mechanism designed in [11,12] integrates the historical records of user reputation and evaluation models, thus selecting users to improve data quality. Reference [10] proposes a crowdsensing task selection algorithm and rewards allocation incentive mechanism based on the Reputation Evaluation model (CTSRE), which deploys the reputation-weighted rewards allocation method to encourage users to participate in tasks actively. Ref. [13] designs an incentive mechanism based on historical reputation, which attracted high-quality users to participate in tasks through a more fine-grained reputation evaluation scheme, thereby achieving fairer reward distribution. Ref. [14], based on a model for predicting user task quality, combines historical reputation to calculate the user’s direct reputation and evaluate his or her importance in the sensing team. In [15], after selecting low-cost and high-quality users to perform tasks, the users’ reputations are updated, the rewards are paid by evaluating the data quality provided, and the users are encouraged to continue providing high-quality data. According to the literature [12,13,14,15], new users may find it difficult to obtain tasks or receive fewer rewards because they have no historical reputation, which may frustrate their enthusiasm and reduce system activity and the rate of new users joining. In [19], to address the problem of insufficient participation in MCS systems with a limited number of workers, social networks are used to recruit workers to complete tasks by combining epidemic models with task propagation and completion processes. In order to solve the problem of malicious workers in crowdsensing social networks, ref. [20] proposes the ZPV-SRE framework to improve the utility of the platform. Ref. [21] proposes a multi-task, multi-issuer mobile crowdsensing system mechanism based on game theory and the Stackelberg game to promote user participation. Ref. [22] promotes users’ willingness to complete tasks by leveraging social relationships between users and design rewards based on data quality. In references [19,20,21,22], even if workers are invited through social relationships, their willingness to participate is still highly heterogeneous. Different workers have different task interests, trust, and reward sensitivities. A single communication mechanism is difficult to fully mobilize participation enthusiasm.

2.2. Monetary Incentive Mechanism for Data Quality and User Participation

Ref. [6] proposed a dynamic payment control mechanism for uncertain tasks and privacy-sensitive bidding, which constructed a lightweight auction model that can drive high-quality data submission with minimal social cost. However, since payments are adjusted dynamically, workers may observe payment trends and engage in gaming behaviors (such as deliberately delaying bids and falsifying costs), resulting in reduced system stability and even payment fluctuations or manipulation. Ref. [23] proposed a two-stage hybrid sensing-driven cost–quality collaborative payment framework, which realizes opportunistic vehicle recruitment through reverse auction and combines it with a participatory vehicle trajectory scheduling algorithm based on SAC reinforcement learning to dynamically optimize the sensing coverage quality and fairness. However, since the reverse auction and trajectory scheduling are two stages connected in series, and since the recruitment and scheduling strategies are optimized independently, a “local optimum” may appear in the middle, that is, low-priced but difficult-to-schedule vehicles are selected in the auction stage, which greatly increases the difficulty of subsequent trajectory scheduling. Ref. [24] proposed a full-stage quality-driven dynamic payment control mechanism, which can dynamically screen users with the potential to submit high-quality data in the long term and adjust the payment weight according to the quality assessment results, so that high-quality data contributors can obtain excess utility. However, in ref. [24], once the system identifies some users as high-quality users, these users may gradually reduce their efforts and continue to enjoy overpayment based on their historical reputation. Ref. [25] uses the drift plus penalty (DPP) technique in Lyapunov optimization to handle the fairness requirements to ensure continuous user participation and high-quality data. However, in actual systems, it is necessary to minimize payment, maximize quality, and ensure fairness at the same time, which makes the penalty function design very complicated. Ref. [26] proposes a quality-driven online task bundling incentive mechanism that combines task profits and rewards accounts to increase participant willingness and provide high-quality data. Ref. [26] may show that in order to quickly complete the bundled task and receive the reward, users may tend to “take shortcuts” and submit low-quality or sloppy data. Ref. [27] proposed a deep learning prediction scheme based on sparse MCS for predicting undetected data. The process first uses a deep matrix decomposition method to restore the current complete perceptual map, and then captures and uses spatiotemporal correlation to predict undetected data, thereby improving data quality. However, when the number of initial participants is very small, the quality of the perceptual map restored by matrix decomposition is poor. The subsequent spatiotemporal prediction based on the erroneous recovery data will further amplify the error, causing the prediction result to deviate from the actual situation. When the data are unevenly distributed in the crowdsensing area, the existing algorithm will ignore the differences in information between blocks, and still require the central server to uniformly sample from each block stored on the mobile device, resulting in a decrease in the overall reconstruction accuracy. To solve this problem, ref. [28] proposed an adaptive sampling allocation strategy which deeply analyzes the statistical information of each block and helps the central server adaptively collect the number of measurements of each block, thereby improving data quality. Although this adaptive sampling allocation strategy can better adapt to the problem of uneven data distribution than uniform sampling, it still has problems such as large initial statistical errors and slow dynamic adaptation.
The above references have studied incentive mechanisms based on data quality and user participation. Still, most of them motivate user participation by offering fixed rewards to compensate for the resource consumption incurred during task execution. This results in a limited number of users being selected under platform budget constraints, which may compromise the quality of sensing data. To solve these issues, this paper designs a lottery-based incentive mechanism to convince users to lower their prices so that the platform can recruit more users to participate in the task with a specific budget. At the same time, it treats users’ data quality as a key factor in reward allocation, motivating users who prefer high-risk, high-reward outcomes to further enhance their data quality.
Section 3 analyzes the impact of objective winning probability and budget allocation on users’ data quality, strategies, and pricing. The model’s winning probability scheme and budget allocation scheme are also established. Next, this paper presents the specific process used to motivate users to participate in the task and improve data quality.

3. The Lottery-Based Incentive Mechanism

3.1. Physical Model

Figure 1 shows the physical model and execution process of mobile crowdsensing with a lottery-based incentive mechanism. The mobile crowdsensing system consists of two main parts: (i) the platform, responsible for issuing tasks, selecting participants, and rewarding them for the data, and (ii) the participants use of their mobile devices to execute tasks.
Figure 1 shows the basic flow of the mechanism. The platform takes one round from issuing tasks to paying rewards. In step 1, the set of tasks published by the platform in the t-th round is denoted by Γ t , Γ t = τ 1 t , τ 2 t , , τ n t , where τ i t denotes the i-th task in the t-th round. U t denotes the set of users in the t-th round, U t = u 1 t , u 2 t , , u n t , where u i t denotes the user u i in the t-th round. In step 2, users select the tasks according to their conditions, the location of the tasks, and the specific reward rules, and submit the pricing. The set of bids of the user in the t-th round is denoted by B i d t , B i d t = b 1 t , b 2 t , , b n t , where b i t denotes the bid of u i in the t-th round. In step 3, the platform selects users to perform the tasks. The selected users form the winner set, denoted as S t = s 1 t , s 2 t , , s n t , where s i t denotes the u i chosen by the platform in round t. These participants consume certain resources when performing the task, and C t denotes the set of user’s costs in the t-th round, C t = c 1 t , c 2 t , , c n t , where c i t is the cost of u i in the t-th round. In step 4, the platform pays a certain amount of rewards. The total amount of rewards paid by the platform will not be higher than the budget. R t is the set of utilities of users in the t-th round, R t = r 1 t , r 2 t , , r n t , where r i t denotes the utility of user i in the t-th round. The rest of the basic parameters of this paper are shown in Table 1.

3.2. Design of the Lottery-Based Incentive Mechanism

3.2.1. Mapping of the Lottery Model

This section develops a lottery model for introducing lotteries into the mobile crowdsensing system. For the convenience of understanding, in Table 2, the correspondence between the real-life lottery and the lottery model in mobile crowdsensing is described.
In real-world lottery systems, participants typically select m numbers from a pool of n possible numbers to create their lottery ticket combination. In a lottery-based mobile crowdsensing system, first, the platform publishes the crowdsensing task, including the task content, bonus pool allocation rules, and bonus pool size. Users select the tasks of interest based on their own situation, task location, and reward rules. Then, the user specifies the data quality strategy, decides how much resources to invest in improving data quality, and determines the bid based on the data quality strategy and utility model, and submits it to the platform. Then, the user performs the task. After the task is completed, the platform shows the user a set of lottery numbers. The platform draws the prize according to the lottery rules. If the user holds a matching lottery number, he will obtain a reward. The above mapping is further translated into a system flow, as shown in Figure 2.
Figure 2 introduces the logical process of the lottery-based mobile crowdsensing data quality incentive mechanism. First, the platform will publish the crowdsensing task, in which the platform will divide the rewards and bonuses, see Theorem 3 for the specific division details. In step 2, u i form their data quality strategy Q S i , determine their bidding price b i based on the utility model, and submit it to the platform. At this point, the platform evaluates the impact of winning probability p on the lower limit of user bidding price b l , After the user submits Q S i and b i , the platform determines the winner set based on Q S i and b i , and the winner set prioritizes completing tasks with a high-value weight. In step 4, the winner set submits sensing data. In step 5, the platform pays out the rewards and bonuses. At the same time, the platform can calculate the total platform utility based on the user’s data quality submission level.

3.2.2. Bonus Pool and User Utility

Definition 1 (objective reward probability). 
In the process of participating in a task, the user has the possibility of winning a reward. The probability that the number given by the platform matches the lottery number is the objective reward probability of the user, and the objective reward probability p is represented by the Formula (1), where C n m is the number of combinations of n and m.
p = 1 C n m   ,   p ( 0,1 )
The budget of the platform is represented by G . The budget is allocated into two parts. One part is assigned to the bonus pool and the amount of the bonus pool is represented by B . The other part is used to pay the user for completing tasks. The relationship between the budget and the bonus pool is shown in Formula (2), where γ is the budget allocation coefficient, representing the proportion of the total budget allocated to the bonus pool. γ exists in the range (0, 1).
B = γ G
In the case of a budget allocation coefficient γ , the budget of γ G is used to form the bonus pool, and the remaining budget of 1 γ G is used to select users to perform tasks and pay them rewards equal to their bidding. Considering that each user has different experience and equipment, the ability value of the user u i is denoted by θ i and the cost of providing the same data quality varies for users with different abilities. Therefore, this paper models cost and data quality as follows: for a user u i , its cost c i is a function of its data quality q i , where q i [ 0 ,   1 ], as shown in Formula (3).
c i q i = e q i θ i 1
The rewards received by the user for participating in tasks minus the costs used to perform tasks is the user’s utility, and the user’s utility for u i is denoted as r i .
In a traditional crowdsensing system, a user u i becomes the winner when it is selected to perform a sensing task, u i S . The utility of the user u i is the price b i that the platform pays minus the cost c i of performing a task. When the user u i is not selected to perform the sensing task, u i S , the utility of the user is 0. Therefore, the utility of the user u i in a traditional crowdsensing system is represented by r ~ i , expressed as in Formula (4), where S is the set of winners.
r ~ i = b i c i ( q i ) u i S 0 u i S
In Formula (4), b i is the reward the user u i expects to obtain for performing a task.
Definition 2 (lottery utility). 
In a lottery-based crowdsensing system, the platform provides a set of lottery numbers after the user completes a task. Therefore, in addition to the traditional utility function, there is utility from the lottery numbers, and the utility from the lottery numbers is the lottery utility. The lottery utility of a user u i is represented by  ψ i .
In a lottery crowdsensing system, the utility of the user u i is r i . denoted as Formula (5).
r i = b i + ψ i c i ( q i ) u i S 0 u i S
To incentive users to improve the data quality, the platform correlates the rewards B with the data quality q provided by users and issues rewards according to the data quality. The product of the subjective value of the rewards and the subjective probability of winning is the lottery utility ψ i of the user u i , which has been used in [30,31,32]. The expression ψ i is shown in Formula (6).
ψ i = v ( q i B , x 0 ) w ( p )
In the formula, B 0 ,   q 0 the value function in loss aversion theory is v ( x , x 0 ) , where x denotes the possible benefit of an event and x 0 denotes the reference point [33,34].
The probability weight function w ( p ) in prospect theory describes the subjective perception of objective probability when a human makes a risky decision [35]. The subjective perception of an event with objective probability p is w ( p ) . When facing a low-probability event, a human’s subjective probability w p tends to be higher than the objective probability p . In comparison, for high-probability events, the subjective probability w p perceived by humans is typically lower than the objective probability p The expression w p is shown in Formula (7).
w ( p ) = p β ( p β + ( 1 p ) β ) 1 / β
Here, β is the probability weighting coefficient. It takes the value of 0.61 when x x 0 and 0.69 when x < x 0 .
According to the value function of loss aversion theory in behavioral economics [36,37], Formula (8) can be obtained.
ψ i = ( q i B ) α i w ( p )
In Formula (8), α i is the risk attitude coefficient of the user u i . A higher value of α i indicates that user ui has a greater risk appetite. According to loss aversion theory, the average value of α i is 0.88. Therefore, lottery brings a higher utility to the user u i . Substituting Formula (8) into Formula (5) yields Formula (9).
r i = b i + ( q i B ) α i w ( p ) c i ( q i ) u i S 0 u i S
Once the utility model of users is determined, users need to determine the data quality strategy and rewards based on their requirements.

3.2.3. Users Data Quality Strategy and Bids

According to Formula (9), as the user u i improves data quality q i , they will receive more rewards upon winning. At the same time, as the user u i improves the data quality, the cost c i of u i will increase. Therefore, a data quality strategy Q S i , that maximizes the user’s utility, is used, as stated in Theorem 1.
Theorem 1. 
The user   u i has a data quality strategy Q S i that maximizes its utility.
Proof of Theorem 1. 
After substituting Formula (3) into Formula (9), the user’s utility function with respect to data quality q i becomes r i = ( q i B ) α i w ( p ) + b i ( e q i θ i 1 ) . After taking partial derivatives from q i , 𝜕 r i 𝜕 q i = α i B α i w ( p ) q i α i 1 1 θ i e q i θ i can be obtained. After setting the partial derivative to zero, the resulting equation involves both a power function and an exponential function, making it a transcendental equation. In mathematics, transcendental equations generally do not have closed-form solutions. They can only be solved approximately, through numerical substitution and iterative methods such as Newton’s method. Moreover, Newton’s method cannot yield explicit expressions in terms of the independent variable. In order to obtain a specific expression for the solution, take the average value of α i , 0.88, and substitute it into the calculation. When q [ 0,1 ] , q 0.88 q , so after replacing q 0.88 with q , r i = q i B α i w ( p ) + b i ( e q i θ i 1 ) can be obtained. Taking the derivative of the data quality   q i again, 𝜕 r i 𝜕 q i = B α i w ( p ) 1 θ i e q i θ i can be obtained. If the partial derivative is equal to 0, i.e., 𝜕 r i 𝜕 q i = 0 , q i θ i ln ( θ i B α i w ( p ) ) is obtained. On the interval q i ( , θ i ln θ i B i α i w p ), 𝜕 r i 𝜕 q i > 0 . On the interval q i ( θ i ln θ i B i α i w p , + , ) , 𝜕 r i 𝜕 q i < 0 , therefore q i = θ i ln ( θ i B α i w ( p ) ) is the extreme value point. Based on the definition of data quality q [ 0 ,   1 ] , when the extreme value point is on the left side of the definition domain, θ i ln θ i B i α i w p < 0 , user utility r i is monotonically decreasing on q [ 0,1 ] and has a maximum value at q i = 0 . When the extreme value point is on the right side of the definition field θ i ln θ i B i α i w p > 1 , user utility is monotonically increasing on and has a maximum value at r i , q 0,1 ,   q i = 1 . When the point of maximum value is in the domain of definition, θ i ln θ i B i α i w p [ 0,1 ] , user utility r i   increases then decreases on q [ 0 ,   1 ] ,when q i = θ i ln ( θ i B α i w ( p ) ) , user utility r i   has the maximum value. □
In summary, the user has a data quality strategy to maximize their utility, which is denoted as Q S i .
Theorem 1 proves that there exists a data quality strategy Q S i for the user u i that maximizes its utility. The specific expression for Q S i is shown in Formula (10).
Q S i = 0 θ i ln ( θ i B α i w ( p ) ) < 0 θ i ln ( θ i B α i w ( p ) ) 0 θ i ln ( θ i B i α i w ( p ) ) 1 1 θ i ln ( θ i B α i w ( p ) ) > 1
According to Formula (10), the bonus pool B affects the data quality strategy Q S i of the user u i , and the larger the bonus pool B , the higher the Q S i .
After determining the data quality strategy Q S i , user u i bids on the task of interest, submitting the chosen data quality strategy and the desired reward for performing the task. User u i will bid a price that guarantees the utility to be greater than zero. Therefore, u i ’s price b i should satisfy Formula (11).
b i + ( q i B ) α i w ( p ) c ( q i ) > 0
According to Formula (11), the user’s price is expressed as Formula (12).
b i > c ( q i ) ( q i B ) α i w ( p )
Based on Formula (12), b i   represents the lowest price that u i can accept, called the lower limit of price represented by b i l . At the same time, the user u i bids for a task while considering the possibility of being selected as the winner. Therefore, there is an upper limit on the user’s price b i , which is related to the cost c ( q i ) of performing the task. The upper limit of the price b i satisfies Formula (13).
b i < ξ c ( q i )
In Formula (13), b i denotes the highest price that a user u i can require, called the upper limit of price, and is represented by b i h . ξ is the degree to which the platform allows users to increase their bidding prices, known as the limiting factor. The platform evaluates the quality of data users provide, infers their consumption costs, and compares them with their bidding prices. If the user’s bidding price exceeds the range permitted by the platform, no compensation will be paid. The lower limits of the user’s price b i are discussed above. The user’s price needs to satisfy both the upper and lower limits, and the user’s price for the task should be greater than zero. Therefore, the price range for the user u i is shown in the Formula (14).
b i = b i l < b i < b i h b i > 0
According to Formula (12), the subjective reward probability affects the lower bound of the user’s price, and the subjective probability is a function of the objective probability. Section 3.2.4. will discuss the effect of the objective reward probability on the lower bound of the price.

3.2.4. The Effect of Objective Reward Probability on the Lower Bound of Price

In a traditional crowdsensing system, the price b ~ i for the user u i   should satisfy Formula (15).
b ~ i c i ( q i ) > 0
In the lottery crowdsensing system, the lower bound on the price b i l is shown in the Formula (12). Theorem 2 demonstrates how different objective reward probabilities affect the lower bound of the price in a lottery-based mobile crowdsensing system. The lower bound of price for a user u i at an objective reward probability of   p 1 is represented by b i l , p 1 . When the user u i has an objective reward probability of p 2 , the lower price is represented by b i l , p 2 .
Theorem 2. 
When the bonus pool B > 0 and  p 2 > p 1 , there is  b i l , p 2 < b i l , p 1 . That is, the higher the objective reward probability, the lower bound of the price.
Proof of Theorem 2. 
In the mobile crowdsensing system that introduces a lottery-based incentive mechanism, according to the user price lower bound Formula (12), b i l , p 1 b i l , p 2 = ( q i B ) α i ( w ( p 2 ) w ( p 1 ) ) , to prove   b i l , p 2 < b i l , p 1 , b i l , p 1 b i l , p 2 > 0 must be proved. Because q i (0,1), B > 0 ,   then   ( q i B ) α i > 0 . To prove w ( p 2 ) w ( p 1 ) > 0 , this theorem must prove w ( p ) is a monotonically increasing function with respect to p , because   p 2 > p 1 . According to Formula (7), w ( p ) = p β ( p β + [ 1 p ] β ) 1 / β , β = 0.61 , and p ( 0,1 ) .   Let f ( p ) = p β and let g ( p ) = ( p β + ( 1 p ) β ) 1 / β . Derive w ( p ) = f ( p ) g ( p ) f ( p ) g ( p ) g 2 ( p ) from w ( p ) . To prove that w ( p ) is monotonically increasing, w p > 0   must be proved. Because   g 2 ( p ) > 0 , f p g p f p g p > 0   should be proved. Because f ( p ) = β p β 1 , g ( p ) = ( p β + ( 1 p ) β ) 1 β 1 ( p β 1 ( 1 p ) β 1 ) . Bring f ( p ) and g ( p ) into f p g p f ( p ) g ( p ) to obtain β p β 1 g ( p ) p β g ( p ) p β + ( 1 p ) β ( p β 1 ( 1 p ) β 1 ) , that is g ( p ) p β ( β p 1 ( 1 p 1 ) β 1 p + ( 1 p p ) β 1 ( 1 p ) ) . According to the expression for g p > 0 , and p β > 0 , it is only necessary to prove β p 1 1 p 1 β 1 p + 1 p p β 1 1 p > 0 , that is to prove ( β β p + p ) ( 1 p 1 ) β 1 ( 1 β ) p p ( p + ( 1 p p ) β 1 ( 1 p ) ) > 0 . Since p  ( 0,1 ) , the denominator must be greater than zero, it is only necessary to prove ( β β p + p ) ( 1 p 1 ) β 1 ( 1 β ) p > 0. Since β = 0.61 and p ( 0,1 ) , so 1 p β 1 ( ( 1 p ) β 1 p β ) > 0 needs to be proved. This is obvious. Therefore, w ( p ) is a monotonically increasing function, and b i l , p 2 < b i l , p 1 . □
Theorem 2 proves that the higher the objective reward probability, the lower the bound of the user’s bidding price. The lottery-based incentive mechanism aims to reduce users’ bidding prices by introducing probabilistic rewards. This allows the platform to recruit more participants under a fixed budget, thereby improving user engagement and platform profits. However, the objective reward probability has an upper limit. In a particular round, if there are   N n u m   users in the platform, the number of winners in this round, that is, the expected value, should be guaranteed to be no more than one, as seen in Formula (16).
p N n u m < 1
According to Formula (1), the objective reward probability is determined by the number of combinations of n and m of lottery numbers issued by the platform, so Formula (16) is also written as Formula (17).
1 C n m N n u m < 1
Based on Formula (1), as the objective reward probability p depends on the combinations of n and m, p takes on discrete rather than continuous values when n and m vary. When the platform publishes reward rules, it is necessary to publish the combination number n and m, which determines the objective reward probability p .
After the platform determines the probability of rewards, the expected utility will attract more users to participate in the task. But at the same time, some users may receive rewards despite providing low-quality data. Hence, it is necessary to discuss how to select users and how to allocate the platform’s budget.

3.2.5. Winner Selection

In t-th round, the quality of the task τ k t is represented by g k t , with higher values representing the higher quality of the task τ k t . g k t is expressed in Formula (18).
g k t ( U k t ) = u i U k t q n
Here, U k t denotes the set of users who bid on the task τ k t , q n   denotes the data quality provided by the user u n in the set U k t , and the total task quality τ k t is calculated as the sum of the data quality provided by all users in τ k t . Drawing on the definition of task value from [37], the value of the task τ k t being completed in the t-th round is represented by V k t . Higher values represent the higher data quality of the task τ k t . V k t   is expressed as shown in Formula (19).
V k t = μ k ln ( 1 + g k t ( U k t ) )
Here, μ k   indicates the weight of the task τ k t , with higher weights representing higher values being completed. The value of the task V k t is reflected in the logarithmic form concerning the quality of the task g k t diminishing marginal utility. According to the expression g k t , task value increases with both the number of participating users and the quality of the data they provide.
The profits of the platform V t are obtained by summing the value of all tasks completed, denoted as Formula (20).
V t = τ k t Γ t μ k ln ( 1 + g k t ( U k t ) )
The set of users who bid on the task τ k t in the t-th round is represented by U k t , and the set of prices offered by the users in U k t for task τ k t is denoted by   B i d k t . The value created by the users u i   in the set U k t for the task τ k t is represented by V i , k t , combining Formulas (18) and (19), and the specific expression is represented by Formula (21).
V i , k t = μ k ln ( 1 + q i , k t )
Here, q i t indicates the data quality provided by the user u i when completing the task τ k t . The higher the data quality, the higher the value V i , k t .
The ratio of the value created by user u i to his bid price is defined as the competitiveness factor, denoted by Θ i , k t and shown in Formula (22).
Θ i , k t = V i , k t b i , k t
According to Formula (22), the higher the value of the task and the lower the price, the higher the user’s competitiveness factor. Among the users who bid on the task τ k t , the platform prioritizes the users with a high competitiveness factor. The set of users the platform selects is the set of winners, denoted by S t .

3.2.6. Budget Allocation

The higher the budget ( 1 γ ) G used for user selection, the more users can be recruited and the higher the platform’s profits will be. At the same time, according to the platform profits function, i.e., Formula (20), the platform profits are positively related to the data quality provided by the users. According to Theorem 1, data quality is correlated with the lottery reward. So when a larger budget is available as the lottery reward, more users are encouraged to participate and provide higher data quality, which in turn increases platform profits. Both of these components can increase the profits of the platform. The next part of the discussion is how to allocate these two components to maximize the platform’s profits.
Using γ to denote the coefficient of the budget allocated to the bonus pool, γ G denotes the money used as a lottery reward B and ( 1 γ ) G is used to reward users directly. In global terms, the total number of tasks performed in a round is denoted by τ , the mean weight value of task is μ , the mean value of users’ risk attitudes is   α , and the mean value of users’ ability values is θ . Next, Theorem 3 is used to obtain the budget allocation coefficient γ , which maximizes the relative profits of the platform.
Theorem 3. 
When θ G α w ( p ) > 1 , there exists an allocation coefficient γ , which satisfies θ G ( α ( 1 γ ) γ l n ( θ γ α G α w ) ) = 0 , and makes the profits of the platform is relatively maximized.
Proof of Theorem 3. 
To find the relationship between the budget allocation coefficient γ and the platform profits, we should express the relevant variables in the platform profits function in the form related to the budget allocation coefficient γ , and use τ to represent the total number of tasks being performed in a round, combined with Formulas (19) and (20), bring τ into it, we can obtain V = τ μ ln ( 1 + g k ( U k ) ) , where   g k U k   represents the data quality of task τ k . The average bidding price of users in the platform is represented by b, and in the case of selecting participant budget is 1 γ G , the mean number of users in a task is ( 1 γ ) G b . Because the mean number of tasks is τ , there are average users ( 1 γ ) G b τ per task. The quality function   g k ( U k ) for a particular task τ k is shown in Formula (18), and the number of participants per task ( 1 γ ) G b τ is brought into Formula (18) to obtain g k ( s ) = ( ( 1 γ ) G b τ q n ) . q n represents the data quality provided by u n and the users provide data quality according to their data quality strategy Q S n . According to Theorem 1, the user’s data quality strategy is Q S n , and considering the part related to the budget allocation coefficient γ the data quality provided is θ i ln ( θ i B α i w ( p ) ) , then the quality function is g k ( U k ) = ( ( 1 γ ) G b τ θ ln ( θ ( γ G ) α w ( p ) ) ) for task τ k at this time. Therefore, the platform profits function V = τ μ × [ ln ( θ ln ( θ γ α G α w ( p ) ) ( 1 γ ) G + b τ ) ln b τ ] can be obtained. After the partial derivative of γ , 𝜕 V 𝜕 γ = τ μ θ α ( 1 γ ) G γ θ G ln ( θ γ α G α w ( p ) ) θ ln ( θ γ α G α w ( p ) ) ( 1 γ ) G + b τ can be obtained. If the partial derivative equals zero, θ G ( α ( 1 γ ) γ ln ( θ γ α G α w ( p ) ) ) = 0 can be obtained because G , θ   are greater than zero. That is, G > 0 , θ > 0 , α ( 1 γ ) γ = ln ( θ γ α G α w ( p ) ) can be obtained. Y l ( γ ) equals α ( 1 γ ) γ and Y r ( γ ) equals ln ( θ γ α G α w ( p ) ) . μ equals θ G α w ( p ) and then Y r ( γ ) = ln ( μ γ α ) . □
The image of the function with Y l ( γ ) and Y r ( γ ) is shown in Figure 3. According to the image, the two functions intersect at γ = 1 when u = 1 . When u > 1 , the two functions intersect at γ ( 0 ,   1 ) . To the left of the intersection point, Y l ( γ ) is greater than Y r ( γ ) with a derivative greater than zero, and to the right of the intersection point, Y l ( γ ) is less than Y r ( γ ) with a derivative less than zero. Therefore, a γ exists such that the derivative is zero, and the platform profits are relatively maximum.
Theorem 3 proves the existence of a budget allocation coefficient γ that maximizes the platform’s profit. Next, simulation experiments will be conducted to analyze the values of the budget allocation coefficient under different environments and their impact on the platform’s profits.

4. Simulation Experiments

This section discusses the setup of the lottery incentive mechanism proposed in this paper using the Repast simulation tool and comparison with the ABSEE mechanism [36] and the BBOM mechanism [37]. This paper compares the lottery incentive mechanism with the ABSEE and BBOM regarding user participation, and platform profits. In the design context of the ABSEE mechanism, data quality determines the platform utility. Therefore, by specifying the winner selection rules and payment determination rules, the user’s perceived quality can be accurately estimated, ultimately achieving higher platform utility. The BBOM mechanism is a budget-feasible dual-objective incentive mechanism proposed through a series of problem conversions and function optimizations in a dual-objective optimization scenario, which improves the platform utility.
Section 4.1.1 discusses the effect of the allocation coefficient on data quality. Section 4.1.2 discusses the effect of the allocation coefficient on user participation. Section 4.1.3 discusses the effect of the allocation coefficient and platform budget on platform profits and the effect of allocation coefficient and user number on platform profits. To ensure fairness, the lottery incentive mechanism is compared with the ABSEE and BBOM under setting the same experimental environment and fundamental parameters, and the basic parameters are set as shown in Table 3.

4.1. Discussion of Coefficients

In the experimental part of this paper, it is necessary to first discuss the effects of some of the coefficients on the results and use them to determine the optimal intervals for these coefficients.

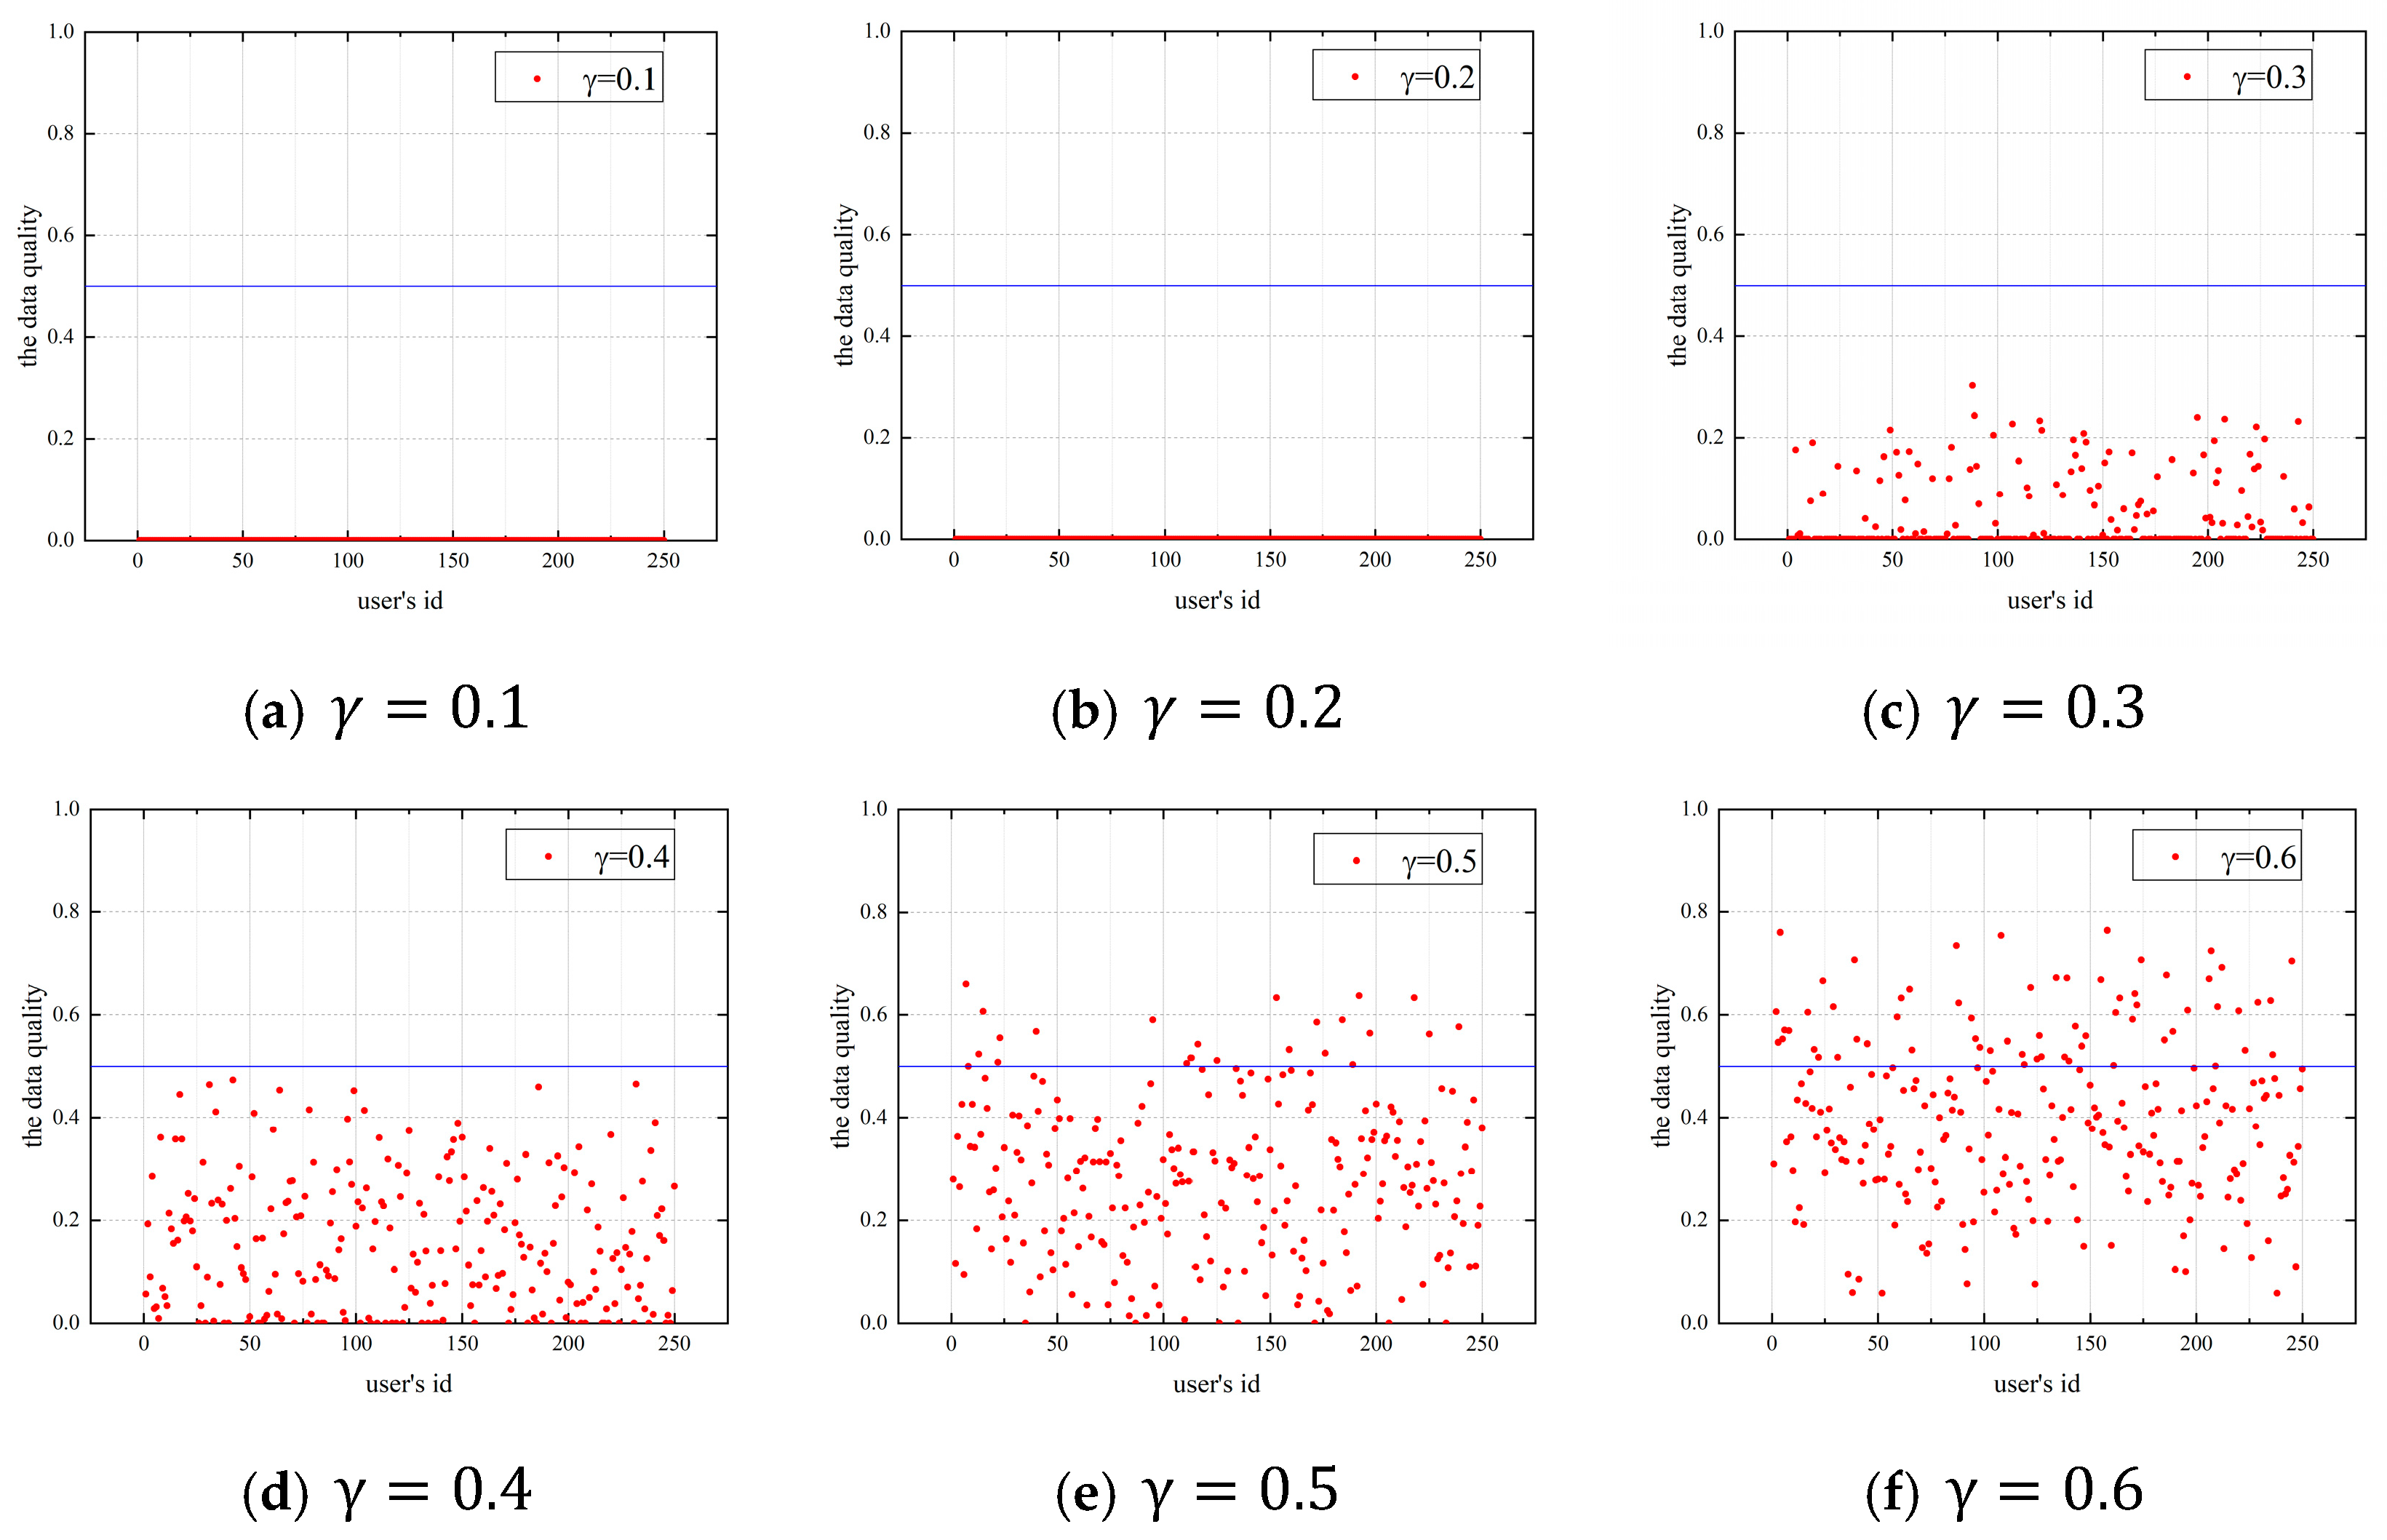
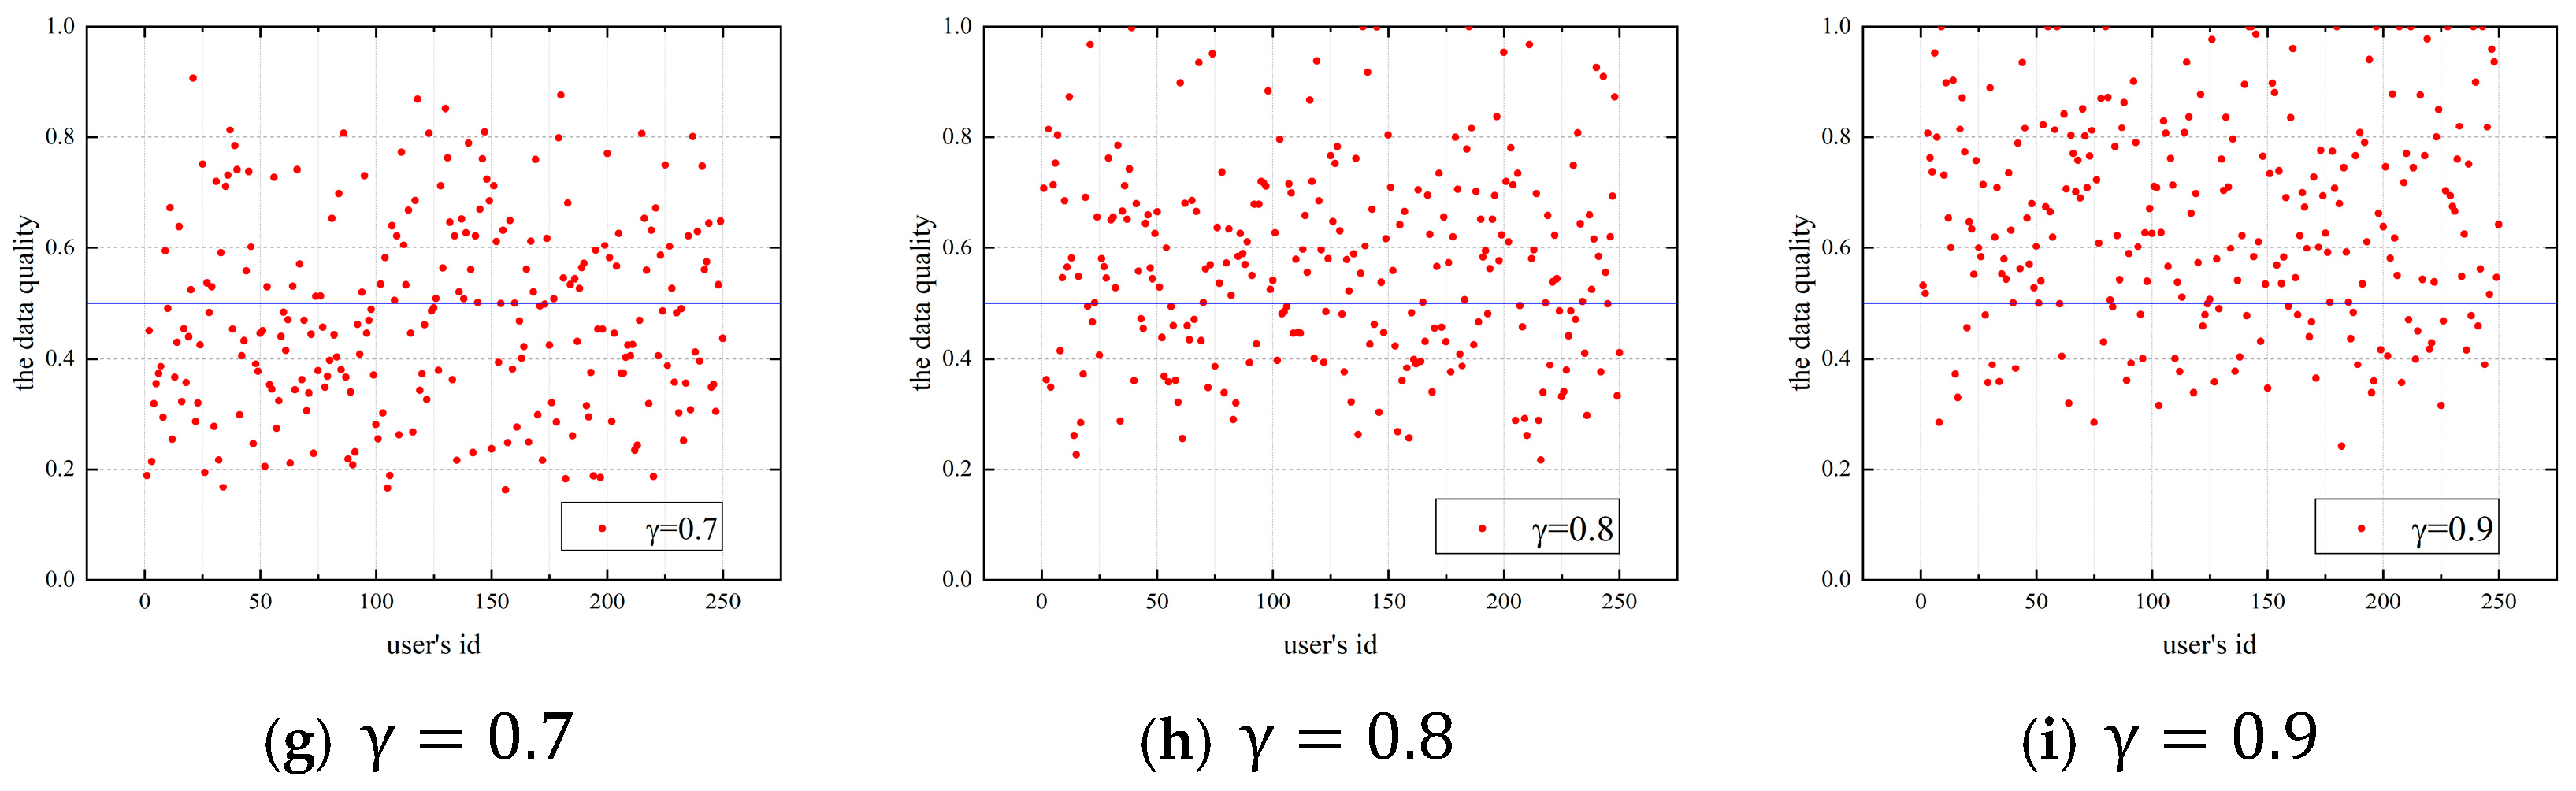
4.1.1. Impact of the Budget Allocation Coefficient γ on Users’ Data Quality

Figure 4 shows the budget allocation coefficient’s effect on users’ data quality when the allocation coefficient is 0.1–0.9 in the lottery incentive mechanism. The number of users is 250, and the platform budget is 500. The horizontal coordinate is the ID of each user, the vertical coordinate is the data quality of the user, and the blue line in the figure represents the data quality of 0.5,in order to more clearly observe the changes in data quality.
As shown in Figure 4a,b, most users’ data quality is 0 when the allocation coefficient γ is 0.1 or 0.2. This is because the budget allocated to the bonus pool by the platform is low, and the amount of the bonus pool is small. Users choose not to participate in the task, so the data quality of users is 0. As the allocation coefficient and the amount of the bonus pool increase, users with high ability and risk preference values choose to participate in the task, as shown in Figure 4c,d.
In subplots Figure 4e–g, the bonus pool is sufficient to attract the most users to participate in the task when γ is 0.5–0.7. The bonus pool increases with the increase of γ . The user reward is positively correlated with the data quality. Hence, the data quality strategy Q S i provided by the user increases with the increase in the allocation coefficient γ .
As shown in Figure 4h,i, users can provide higher-quality data when the budget allocation coefficient γ is 0.8–0.9. Since the platform has a specific budget, more is allocated to the bonus pool, and less is used for selecting users, i.e., the budget allocation coefficient affects the bonus pool and the budget for selecting participants. The higher the budget for selecting participants, the more users the platform can select, and the more user will participate in the task. The following section discusses the effect of the allocation coefficient on the number of participants in the task.

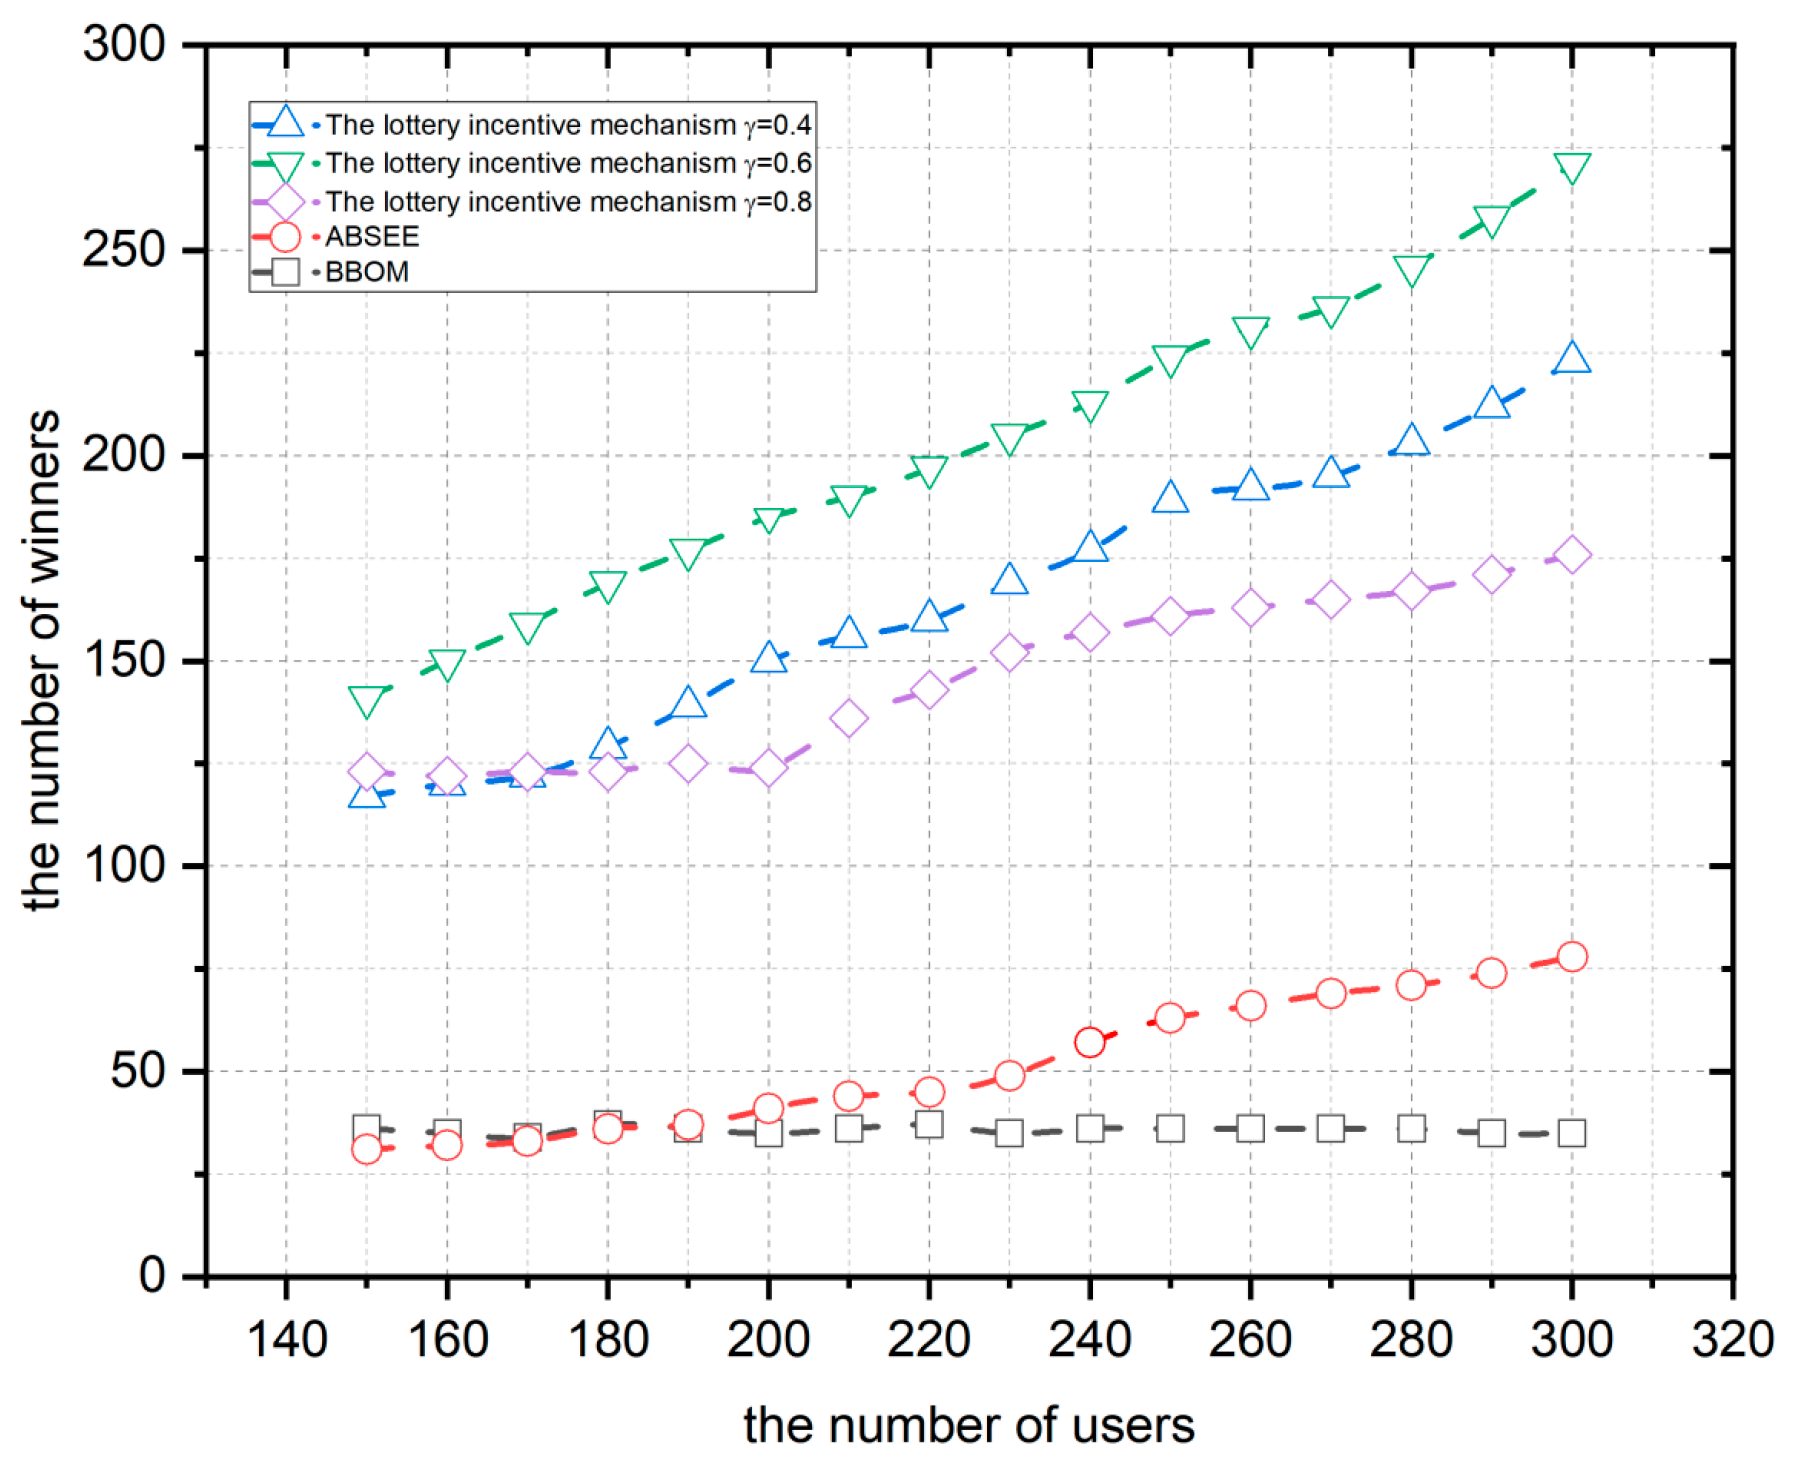
4.1.2. Impact of the Budget Allocation Coefficient γ on User Participation

This section shows the effect of the budget allocation coefficient γ on user participation. The impact of the allocation coefficient on the number of participants in the task when the platform budget is 500 in the lottery incentive mechanism is shown in Figure 5.
Figure 5 shows that the overall trend of the number of winners increases as the user number increases. As shown in Figure 5, the number of winners is 0 when the allocation coefficient γ is 0.1 or 0.2. In Figure 5, the number of winners increases with the number of user on the platform because each user has different risk attitude coefficients and ability values. The attractiveness of lottery rewards to different users varies. As the number of platforms increases, the number of users attracted by the lottery rewards increases, so the number of winners increases with the number of users.
As shown in Figure 5, the number of winners with a budget allocation γ of 0.7, 0.8, and 0.9 is 198, 123, and 58, when the user number is 200. and the number of winners tends to decrease as the allocation coefficient γ increases. This is because the bonus pool is gradually increasing. At the same time, the platform’s budget for selecting users to participate in the task is gradually decreasing. The number of winners tends to decrease as the allocation coefficient γ increases because the platform can select fewer users.
In general, the number of winners and user participation tends to increase and then decrease with the increase in the allocation coefficient γ . The number of winners and user participation is highest when the allocation coefficient γ is 0.6–0.7.

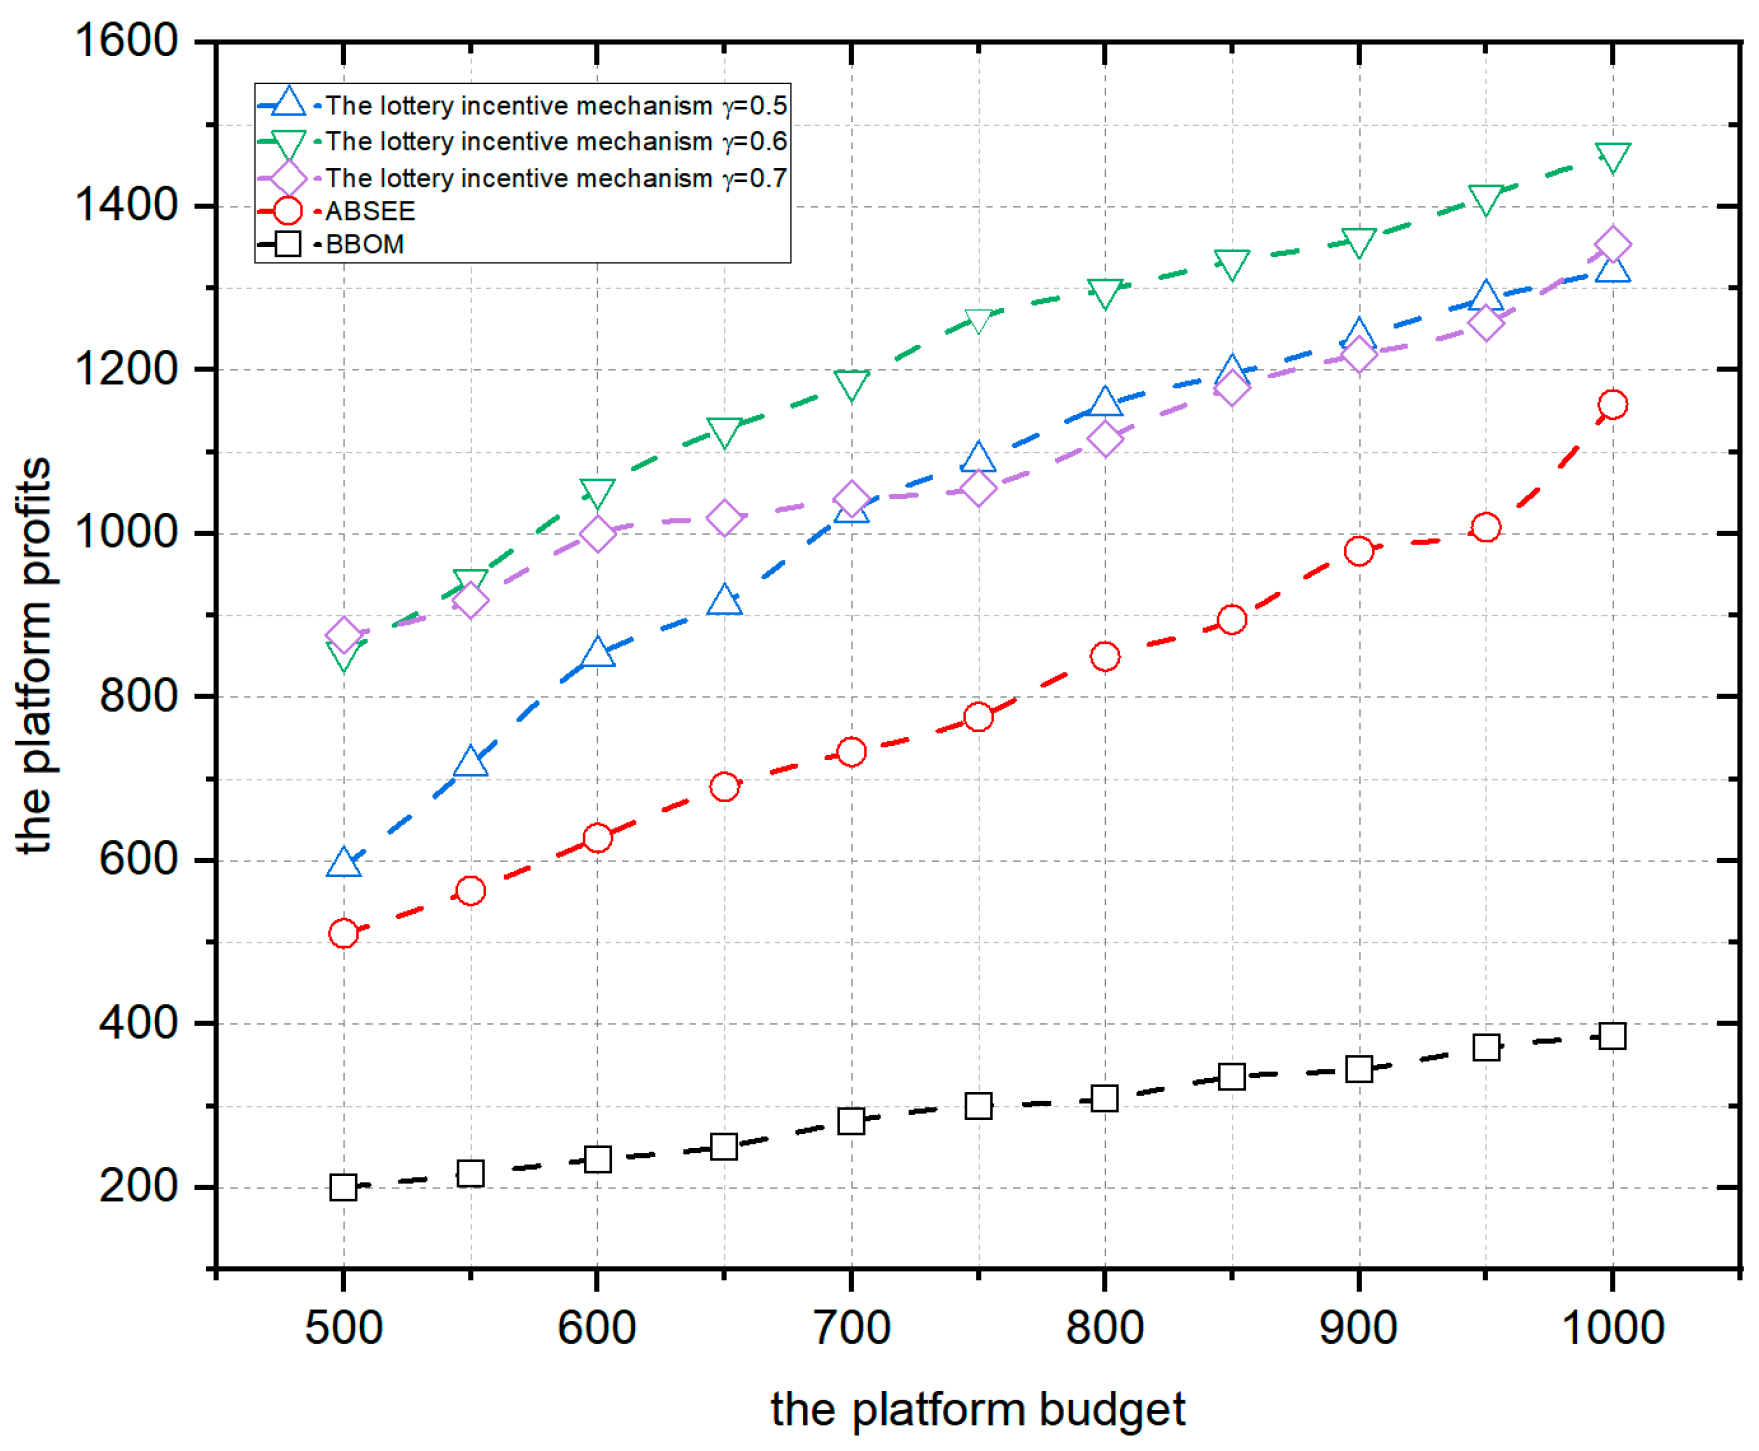
4.1.3. Impact of the Platform Budget and User Number on Platform Profits

Section 4.1.1 and Section 4.1.2 discuss the impact of the allocation coefficient γ on data quality and user participation. For a given budget, an increase in the budget allocated to the bonus pool is followed by increased data quality and platform profits. The budget allocated to selecting the users participating in the task increases, the platform can select more users to participate in the task, and the platform profits increase. This section discusses the impact of allocation coefficient γ , platform budget, and user number on platform profits.
Figure 6 shows the effect of allocation coefficient γ and platform budget G on platform profits when the number of platform users is 250.
Figure 6 shows that when the budget allocation coefficient γ is 0.7, the platform profits are 772, 972, and 1096 for platform budgets of 500, 800, and 1000, respectively., i.e., when the budget allocation coefficient γ is constant, the platform profits increase with the increase in the platform budget. This is because the lottery reward used to attract users increases as the platform budget increases with a constant budget allocation coefficient γ . The data quality enhanced by users increases as the platform budget increases. User participation increases with the increase in the platform budget used for selecting users. Furthermore, the platform’s profits depend on the data quality provided by users and user participation, so the platform’s profits increase with the increase in the platform’s budget.
Figure 6 shows that when the platform budget is 1000, and the budget allocation coefficient γ is 0.4, 0.5, 0.6, 0.7, and 0.8, the platform profits are 935, 1119, 1183, 1096, and 861, respectively. This is because when the budget allocation coefficient γ is 0.4–0.6, as the budget allocation coefficient γ increases, the rewards allocated to the rewards pool increase, the data quality provided by the users increases, the budget used to select users is sufficient to select most users to participate in the task, so the platform profits increase. When the budget allocation coefficient γ is 0.7–0.8, although the data quality provided by users increases as the budget allocation coefficient γ increases, the budget allocated to the platform for selecting users is insufficient, resulting in fewer users participating in the task, which leads to a decrease in the platform profits. This is consistent with Theorem 3 proved in Section 3.2.6. At a budget of 1000 and a budget allocation coefficient γ of 0.6, the platform profits peaked at 1183.
Figure 7 show the impact of the allocation coefficient γ and user number on platform profits when the budget is 500. When the budget allocation coefficient γ is 0.6, and the number of user on the platform is 100, 200, 300, the platform profits are 258, 545, 801, respectively. When the budget allocation coefficient γ remains unchanged, platform profits increase with the increase in user numbers. This is because the bonus pool amount is fixed when the platform budget and allocation coefficient γ are fixed. Due to the different risk attitude coefficients and ability values of each user, as the number of users increases, the number of users attracted by lottery rewards increases. Therefore, the number of users participating in tasks increases, and the platform’s profits increase accordingly.
In Figure 7, when the number of users is 250, the platform profits show a trend of first increasing and then decreasing. As described in Section 4.1.1 and Section 4.1.2, this is because when the budget allocation coefficient γ is 0.8, the quality of data provided by users increases, but the platform profits tend to decrease because the platform has a smaller budget for selecting users, resulting in fewer users being chosen to participate in the task, which leads to a decrease in the platform utility. This is consistent with the results of the proof of Theorem 3 in Section 3.2.6.
This section discusses the effect of the budget allocation coefficient γ and platform budget on platform profits and the effect of the budget allocation coefficient γ and user number on platform profits. As shown in Figure 4 and Figure 5, the budget allocation coefficient γ becomes 0.6, and at 0.7 it can relatively maximize the platform profits.

4.2. Experimental Comparison

In this section, the comparison with the ABSEE mechanism and BBOM mechanism is made mainly in terms of user participation and platform profits. Figure 8 shows the number of the lottery incentive mechanism and the ABSEE and BBOM winners at a platform budget of 500 and user numbers 150–300. User participation is the ratio of the number of winners to the user number.
As shown in Figure 8, the number of winners for the lottery incentive mechanism and the ABSEE increases with the increasing user number, while the number of winners of the BBOM mechanism shows a fluctuating trend. This is because the BBOM mechanism is affected by the marginal value calculation method, the number of winners will not continue to rise as the number of participants increases, but will fluctuate up and down according to the specific circumstances. When the user number is 200, the lottery incentive mechanism with a poor incentive effect is compared with the ABSEE and BBOM. For example, if the budget allocation coefficient is 0.4 and 0.8, the number of winners is 125 and 151, and the user participation is 0.625 and 0.755, which is still higher than that of the ABSEE (0.2) and the BBOM (0.175).
Figure 9 compares the platform utility of the lottery incentive mechanism, ABSEE and BBOM when the user number is 300, and the platform budget is 500–1000. The horizontal coordinate is the platform budget, and the vertical coordinate is the platform profits.
As shown in Figure 9, the platform profits of the lottery incentive mechanism, the ABSEE mechanism, and the BBOM mechanism increase with an increasing platform budget. As described in Section 4.1.3, when the platform budget increases, both the budget of the bonus pool and the budget used to select participants are increasing overall, resulting in increased user participation and quality of submitted data, leading to increased platform profits. The lottery incentive mechanism is better than the ABSEE and BBOM. For example, with a user number of 300, a platform budget of 800, and a budget allocation coefficient of 0.7 for the lottery incentive mechanism, the platform profits are 1116, respectively. Under the same conditions, the platform profits of the ABSEE are 848 and the BBOM are 309.

5. Conclusions

Inspired by real-life lotteries, this paper designs a lottery-based incentive mechanism. This paper analyzes user bids and designs the allocation of reward probability and budget in the lottery model to attract users to reduce their bids and participate in the task under a specific budget. At the same time, this paper designs the reward allocation to encourage users to improve the data quality spontaneously. In the experimental part, through the experiment on the impact of the budget allocation coefficient on user data quality and user participation, it can be seen that the higher the budget allocation coefficient, the higher the user data quality, and when the budget allocation coefficient is between 0.6 and 0.7, the user participation rate increases. By comparing it with the experimental results from ABSEE and BBOM, the lottery-based incentive mechanism improves about 47–74% in terms of user participation and 14–66% in terms of platform profits under the same experimental environment. Also, combining more accurate and low-cost data quality assessment methods will be an important direction to further improve system performance.

Author Contributions

X.H. and S.S. designed the project and drafted the manuscript. Z.L. and J.L. wrote the code and performed the analysis. All participated in finalizing the manuscript. All authors have read and agreed to the published version of the manuscript.

Funding

This research received no external funding.

Data Availability Statement

The original contributions presented in this study are included in the article. Further inquiries can be directed to the corresponding author.

Conflicts of Interest

The funders had no role in the design of the study; in the collection, analyses, or interpretation of data; in the writing of the manuscript; or in the decision to publish the result.

References

  1. Tong, F.; Zhou, Y.; Wang, K.; Cheng, G.; Niu, J.; He, S. A privacy-preserving incentive mechanism for mobile crowdsensing based on blockchain. IEEE Trans. Dependable Secur. Comput. 2024, 21, 5071–5085. [Google Scholar] [CrossRef]
  2. Wang, H.; Tao, J.; Chi, D.; Gao, Y.; Wang, Z.; Zou, D.; Xu, Y. A preference-driven malicious platform detection mechanism for users in mobile crowdsensing. IEEE Trans. Inf. Forensics Secur. 2024, 19, 2720–2731. [Google Scholar] [CrossRef]
  3. Silva, M.; Signoretti, G.; Oliveira, J.; Silva, I.; Costa, D.G. A crowdsensing platform for monitoring of vehicular emissions: A smart city perspective. Future Internet 2019, 11, 13. [Google Scholar] [CrossRef]
  4. Ye, S.; Zhao, L.; Xie, W. Crowd bus sensing: Resolving conflicts between the ground truth and map apps. IEEE Trans. Mob. Comput. 2022, 23, 1097–1111. [Google Scholar] [CrossRef]
  5. Marche, C.; Perra, L.; Nitti, M. Crowdsensing and Trusted Digital Twins for Environmental Noise Monitoring. In Proceedings of the 2024 IEEE International Mediterranean Conference on Communications and Networking (MeditCom), Madrid, Spain, 8–11 July 2024; pp. 535–540. [Google Scholar]
  6. Jiang, X.; Ying, C.; Li, L.; Düdder, B.; Wu, H.; Jin, H.; Luo, Y. Incentive Mechanism for Uncertain Tasks under Differential Privacy. IEEE Trans. Serv. Comput. 2024, 17, 977–989. [Google Scholar] [CrossRef]
  7. Liu, J.; Shao, J.; Sheng, M.; Xu, Y.; Taleb, T.; Shiratori, N. Mobile crowdsensing ecosystem with combinatorial multi-armed bandit-based dynamic truth discovery. IEEE Trans. Mob. Comput. 2024, 23, 13095–13113. [Google Scholar] [CrossRef]
  8. Tang, X.; Liu, J.; Li, K.; Tu, W.; Xu, X.; Xiong, N.N. IIM-ARE: An Effective Interactive Incentive Mechanism based on Adaptive Reputation Evaluation for Mobile Crowd Sensing. IEEE Internet Things J. 2025. [Google Scholar] [CrossRef]
  9. Yang, H.; Yang, C.; Wu, Q.; Yang, W. Reputation Based Privacy-Preserving in Location-Dependent Crowdsensing for Vehicles. In Proceedings of the 2024 International Conference on Networking and Network Applications (NaNA), Yinchuan, China, 9–12 August 2024; pp. 236–241. [Google Scholar]
  10. Li, Q.; Cao, H.; Wang, S.; Zhao, X. A reputation-based multi-user task selection incentive mechanism for crowdsensing. IEEE Access 2020, 8, 74887–74900. [Google Scholar] [CrossRef]
  11. Zhang, J.; Li, X.; Shi, Z.; Zhu, C. A reputation-based and privacy-preserving incentive scheme for mobile crowd sensing: A deep reinforcement learning approach. Wirel. Netw. 2024, 30, 4685–4698. [Google Scholar] [CrossRef]
  12. Cui, H.; Liao, J.; Yu, Z.; Xie, Y.; Liu, X.; Guo, B. Trust assessment for mobile crowdsensing via device fingerprinting. ISA Trans. 2023; in press. [Google Scholar]
  13. Ding, L.; Tong, F.; Xing, F. IMFGR: Incentive Mechanism With Fine-Grained Reputation for Federated Learning in Mobile Crowdsensing. In Proceedings of the 2024 International Conference on Artificial Intelligence of Things and Systems (AIoTSys), Hangzhou, China, 17–19 October 2024; pp. 1–8. [Google Scholar]
  14. Liu, H.; Zhang, C.; Chen, X.; Tai, W. Optimizing Collaborative Crowdsensing: A Graph Theoretical Approach to Team Recruitment and Fair Incentive Distribution. Sensors 2024, 24, 2983. [Google Scholar] [CrossRef]
  15. Cai, X.; Zhou, L.; Li, F.; Fu, Y.; Zhao, P.; Li, C.; Yu, F.R. An Incentive Mechanism for Vehicular Crowdsensing with Security Protection and Data Quality Assurance. IEEE Trans. Veh. Technol. 2023; in press. [Google Scholar]
  16. Ji, G.; Zhang, B.; Zhang, G.; Li, C. Online incentive mechanisms for socially-aware and socially-unaware mobile crowdsensing. IEEE Trans. Mob. Comput. 2023, 23, 6227–6242. [Google Scholar] [CrossRef]
  17. Wang, P.; Li, Z.; Long, S.; Wang, J.; Tan, Z.; Liu, H. Recruitment from social networks for the cold start problem in mobile crowdsourcing. IEEE Internet Things J. 2024, 11, 30536–30550. [Google Scholar] [CrossRef]
  18. Gao, Y.; Liu, W.; Guo, J.; Gao, X.; Chen, G. A dual-embedding based DQN for worker recruitment in spatial crowdsourcing with social network. In Proceedings of the 47th International ACM SIGIR Conference on Research and Development in Information Retrieval, Washington, DC, USA, 14–18 July 2024; pp. 1670–1679. [Google Scholar]
  19. Wang, Z.; Huang, Y.; Wang, X.; Ren, J.; Wang, Q.; Wu, L. Socialrecruiter: Dynamic incentive mechanism for mobile crowdsourcing worker recruitment with social networks. IEEE Trans. Mob. Comput. 2020, 20, 2055–2066. [Google Scholar] [CrossRef]
  20. Wang, P.; Long, S.; Liu, H.; Jiang, K.; Deng, Q.; Li, Z. Propagation verification under social relationship privacy awareness in mobile crowdsourcing. IEEE Trans. Mob. Comput. 2024, 23, 12461–12476. [Google Scholar] [CrossRef]
  21. Esmaeilyfard, R.; Moghisi, M. An incentive mechanism design for multitask and multipublisher mobile crowdsensing environment. J. Supercomput. 2023, 79, 5248–5275. [Google Scholar] [CrossRef]
  22. Gao, H.; An, J.; Zhou, C.; Li, L. Quality-Aware Incentive Mechanism for Social Mobile Crowd Sensing. IEEE Commun. Lett. 2022, 27, 263–267. [Google Scholar] [CrossRef]
  23. Wang, Z.; Cao, Y.; Zhou, H.; Wu, L.; Wang, W.; Min, G. Fairness-aware two-stage hybrid sensing method in vehicular crowdsensing. IEEE Trans. Mob. Comput. 2024, 23, 11971–11988. [Google Scholar] [CrossRef]
  24. Zhang, M.; Li, X.; Miao, Y.; Luo, B.; Ma, S.; Choo, K.-K.R.; Deng, R.H. Oasis: Online all-phase quality-aware incentive mechanism for MCS. IEEE Trans. Serv. Comput. 2024, 17, 589–603. [Google Scholar] [CrossRef]
  25. Montori, F.; Bedogni, L. Privacy preservation for spatio-temporal data in Mobile Crowdsensing scenarios. Pervasive Mob. Comput. 2023, 90, 101755. [Google Scholar] [CrossRef]
  26. Yu, R.; Oguti, A.M.; Ochora, D.R.; Li, S. Towards a privacy-preserving smart contract-based data aggregation and quality-driven incentive mechanism for mobile crowdsensing. J. Netw. Comput. Appl. 2022, 207, 103483. [Google Scholar] [CrossRef]
  27. Wang, E.; Zhang, M.; Cheng, X.; Yang, Y.; Liu, W.; Yu, H.; Wang, L.; Zhang, J. Deep Learning-Enabled Sparse Industrial Crowdsensing and Prediction. IEEE Trans. Ind. Inform. 2021, 17, 6170–6181. [Google Scholar] [CrossRef]
  28. Liu, X.; Zhou, S.; Peng, J.; Yu, J.; He, Y.; Zhang, W. Adaptive sampling allocation for distributed data storage in compressive CrowdSensing. IEEE Internet Things J. 2023, 11, 12022–12032. [Google Scholar] [CrossRef]
  29. Wu, E.; Peng, Z. Research Progress on Incentive Mechanisms in Mobile Crowdsensing. IEEE Internet Things J. 2024, 11, 24621–24633. [Google Scholar] [CrossRef]
  30. Li, D.; Li, C.; Deng, X.; Liu, H.; Liu, J. Familiar paths are the best: Incentive mechanism based on path-dependence considering space-time coverage in crowdsensing. IEEE Trans. Mob. Comput. 2024, 23, 9304–9323. [Google Scholar] [CrossRef]
  31. Liao, G.; Chen, X.; Huang, J. Prospect theoretic analysis of privacy-preserving mechanism. IEEE/ACM Trans. Netw. 2019, 28, 71–83. [Google Scholar] [CrossRef]
  32. Sun, L.; Zhan, W.; Hu, Y.; Tomizuka, M. Interpretable modelling of driving behaviors in interactive driving scenarios based on cumulative prospect theory. In Proceedings of the 2019 IEEE Intelligent Transportation Systems Conference (ITSC), Auckland, New Zealand, 27–30 October 2019. [Google Scholar]
  33. Bickel, W.K.; Green, L.; Vuchinich, R.E. Behavioral economics. J. Exp. Anal. Behav. 1995, 64, 257. [Google Scholar] [CrossRef]
  34. Kahneman, D.; Tversky, A. Prospect theory: An analysis of decision under risk. In Handbook of the Fundamentals of Financial Decision 667 Making: Part I; MacLean, L., Ziemba, W., Eds.; World Scientific: Singapore, 2013; pp. 99–127. [Google Scholar]
  35. Prelec, D. The probability weighting function. Econometrica 1998, 66, 497–527. [Google Scholar] [CrossRef]
  36. Song, B.; Shah-Mansouri, H.; Wong, V.W. Quality of sensing aware budget feasible mechanism for mobile crowdsensing. IEEE Trans. Wirel. Commun. 2017, 16, 3619–3631. [Google Scholar] [CrossRef]
  37. Zhou, Y.; Tong, F.; He, S. Bi-objective incentive mechanism for mobile crowdsensing with budget/cost constraint. IEEE Trans. Mob. Comput. 2022, 23, 223–237. [Google Scholar] [CrossRef]
Figure 1. The physical model.
Mathematics 13 01650 g001
Figure 2. Logic model of the lottery incentive mechanism.
Mathematics 13 01650 g002
Figure 3. Function images of Y l ( γ ) and Y r ( γ ) .
Mathematics 13 01650 g003
Figure 4. Effect of the budget allocation coefficient γ on data quality, (a) γ = 0.1, (b) γ = 0.2, (c) γ = 0.3, (d) γ = 0.4, (e) γ = 0.5, (f) γ = 0.6, (g) γ = 0.7, (h) γ = 0.8, (i) γ = 0.9.
Mathematics 13 01650 g004aMathematics 13 01650 g004b
Figure 5. Effect of the budget allocation coefficient γ on the number of winners.
Mathematics 13 01650 g005
Figure 6. The effect of the allocation coefficient γ and platform budget G on platform profits.
Mathematics 13 01650 g006
Figure 7. Effect of the budget allocation coefficient γ and user number on platform profits.
Mathematics 13 01650 g007
Figure 8. Comparison of user participation.
Mathematics 13 01650 g008
Figure 9. Comparison of platform profits.
Mathematics 13 01650 g009
Table 1. Parameters table.
ParametersDefinition
t Number of rounds
n , m Number of combinations of lottery numbers
N n u m t The total number of users in t-th round
Γ n u m t Number of tasks in t-th round
G t Total budget for the t-th round
B t The bonus pool for the t-th round
γ t The budget allocation coefficient in the t-th round
θ i t The ability value of u i in the t-th round
q i t The quality of data provided by u i in the t-th round
Q S i t Data quality strategy for u i in the t-th round
μ τ k t The weight of the task τ k t in the t-th round
p Objective reward probability
w ( p ) Subjective reward probability
α i Risk attitude coefficient of u i
Table 2. Table mapping a real-life lottery and the lottery model in crowdsensing.
The Real-Life LotteryLottery Model in Crowdsensing
Bonus Pool 50% of lottery rewardPart of the platform budget
Incentive recipientsBuyerParticipants
Participation methodThe buyer selects m numbers from n numbers to form a set of lottery numbersAfter the user performs the task, the platform presents the user with a set of lottery numbers
Participation costsSpend $2 to choose m numbersSpend the cost c i to complete the task
Additional rewardPlace additional bets on the purchased lottery tickets.Spend more resources to improve data quality and receive greater rewards.
Reference pointsLottery rewardReference Quality
RewardDistribute rewards based on the number of matches between the lottery number and the number chosen by the buyers.The reward is awarded according to whether the current lottery numbers match the user’s lottery numbers.
Table 3. Experimental parameter settings.
ParametersValue
N n u m [50, 300]
G [500, 1000]
Γ n u m 600
γ (0, 1)
n , m 14,3
p 0.0027
α i [0.82, 0.94]
φ [0.5, 1]
θ i [0.6, 0.8]
ξ 1.5
Disclaimer/Publisher’s Note: The statements, opinions and data contained in all publications are solely those of the individual author(s) and contributor(s) and not of MDPI and/or the editor(s). MDPI and/or the editor(s) disclaim responsibility for any injury to people or property resulting from any ideas, methods, instructions or products referred to in the content.

