Abstract
This study investigates a sequential clinical trial comparing two treatments with dichotomous outcomes. We evaluate the effectiveness of five adaptive procedures and three randomization methods for assigning patients to different therapies. The primary objective is to identify an optimal treatment allocation policy that maximizes the proportion of successful outcomes in a trial. By comparing the performance of adaptive and randomized procedures, this research provides valuable insights for enhancing treatment allocation strategies in clinical trials, ultimately aiming to improve the overall success rates of therapeutic interventions.
Keywords:
adaptive procedures; conditional probability lost; play-the-winner/switch-from-a-loser; randomization methods; robust Bayes MSC:
6208; 62P10
1. Introduction
In clinical research, identifying the most effective treatment from multiple available options is crucial, particularly when treatment outcomes are binary—classified as either a success or a failure. In sequential clinical trials, where patients are treated one after another, and their outcomes are observed in real-time, there exists the opportunity to dynamically adjust the treatment strategy to maximize the overall success rate. Given two treatments in a clinical trial, with the objective of maximizing the proportion of successes among a fixed number of patients, n, the sequential nature of treatment allocation presents both a challenge and an opportunity: Can a simple/tractable procedure be developed to optimally allocate treatments and thereby maximize the proportion of successful outcomes?
This challenge lies at the heart of sequential trial design. The goal is not only to maximize immediate successes but also to ensure that the chosen procedure is both robust and efficient. Investigating such procedures is essential for improving clinical decision-making, as it directly influences the efficacy of treatments administered in practice. Thus, this study aims to address these challenges by developing and proposing a methodology designed to improve the overall success rate in clinical trials.
To address this problem, one might initially consider randomized designs. Randomization is a conventional approach used to mitigate systematic differences between treatment groups, which could otherwise bias the trial’s outcomes. By randomly assigning treatments to patients, researchers ensure that any observed differences in outcomes are more likely due to the treatments themselves, rather than confounding factors. However, while randomization reduces bias, it does not necessarily maximize the proportion of successes in the trial.
In contrast, adaptive procedures have gained considerable attention for their ability to treat patients more effectively within a trial. These methods allow treatment allocation to depend on accumulating information, adjusting the strategy as the trial progresses. Notable works in this area include those by Thompson [1], Feldman [2], Zelen [3], Sobel and Weiss [4], Berry [5], Bather [6], and Berry and Fristedt [7], who explored various adaptive methods in clinical trials. These procedures aim to enhance the likelihood of successful outcomes by making informed decisions based on the observed responses of previous patients.
Since 1995, significant advancements have been made in this field. Berry and Eick [8] compared randomization with adaptive allocation methods, demonstrating the advantages of adaptive designs for maximizing the expected number of successes. Their foundational work highlighted the benefits of adaptive methods over traditional randomization and provided a framework for comparing different treatment allocation strategies. Subsequently, Pocock and Simon [9] discussed sequential treatment assignment with balancing for prognostic factors, while Chaudhuri and Lo [10] explored hybrid randomization strategies. Additional applications and theoretical insights into randomization and adaptive designs can be found in Berry and Eick [11], Rosenberger and Lachin [12], Hu and Rosenberger [13], Chow and Chang [14], Porcher et al. [15], Laage et al. [16], Bhatt and Mehta [17], Chang and Balser [18], Pallmann et al. [19], Kelly et al. [20], Thorlund et al. [21], Afolabi and Kelly [22], Kaizer et al. [23], and Ben-Eltriki [24].
Building on this foundation, our study employs a simulation-based approach to optimizing treatment allocation strategies. Specifically, we aim to maximize the probability of achieving at least k successes out of n trials, given two treatments, A and B, with known success probabilities and . The optimization problem is formally described as follows:
Let for represent the response of patient j. The value of is 1 if the response is positive and 0 if it is negative. Assume that the probability of success with treatment A is , and that with treatment B is . Thus, if patient j receives treatment A,
and if patient j receives treatment B,
Let denote the class of all treatment allocation procedures. For any given n and k (), the conditional probability of achieving at least k successes (given and ) under procedure is
where the distribution of the ’s is determined by . It is evident that the probability in (1) cannot exceed
where . Define
as the conditional probability lost (CPL) under procedure . We evaluate the CPL values for various combinations of and under three randomized procedures and five adaptive procedures studied by Berry and Eick [8]. Based on these numerical results, we aim to identify the most effective procedure.
The insights gained from our numerical analysis not only enhance our understanding of the performance characteristics of different allocation strategies but also offer practical recommendations for optimizing clinical trial designs. By integrating the CPL metric into the decision-making process, researchers can make informed choices about treatment allocation, ultimately improving the efficacy of clinical trials in real-world settings. The contributions of this study are particularly relevant in guiding future trials towards more effective treatment allocation strategies that consider the dynamic nature of sequential clinical trials.
Berry and Eick [8] introduced the conditional expected success loss (CESL) to evaluate and compare treatment allocation methods. The CESL quantifies the expected loss of treatment success due to an inefficient allocation strategy and is defined as
where represents the expected number of successes under the given allocation procedure. The CESL provides an ethical justification for adaptive methods by emphasizing the benefits to participants through more favorable treatment allocation. In contrast, the CPL metric focuses on optimizing the probability of achieving a pre-determined number of successes, thereby aligning with the trial’s objective of maximizing treatment effectiveness.
While CESL highlights the ethical benefits of adaptive methods, particularly in terms of benefiting participants, CPL prioritizes the achievement of trial objectives by optimizing the likelihood of achieving the desired success rate. A section of this paper will be dedicated to comparing these two metrics, providing a more comprehensive understanding of their respective advantages and applications in clinical trial design.
The remainder of this paper is organized as follows. Section 2 provides a detailed description of the eight discussed procedures, focusing on how they allocate treatments to n patients. Section 3 derives the formulas required to compute the probabilities of achieving at least k successes out of n trials for three randomized procedures and one adaptive procedure. Section 4 presents an extensive numerical analysis of these procedures, assessing their CPL and visualizing the results through heatmaps. The section concludes with observations on their application to the optimization problem at hand. Section 5 compares the CPL and CESL metrics, highlighting their respective strengths and applications in optimizing treatment allocation strategies. Finally, Section 6 provides concluding remarks, summarizing the main findings of this study and offering suggestions for future research in clinical trial design.
2. Procedures
There are eight potential procedures commonly used in bandit problems of this nature. For simplicity, we assume that n is an even positive integer. A comprehensive description of procedures ER, JB, PW, RB, and WT is provided in the work of Berry and Eick [8]. The references by Efron [25], Zelen [26], Wei [27], Pocock [28], and Rosenberger and Lachin [29] are related to procedure RR, while the references by Cornfield [30] and Fleiss [31] are associated with procedure SR. In this study, we propose a new procedure, PR, to enable a direct comparison with procedure JB.
- Procedure ER (equal randomized): Half of the n patients are randomly assigned to treatment A, while the other half receive treatment B. This approach ensures an equal representation of both treatments but may not maximize the overall success rate due to its lack of adaptability.
- Procedure RR (repeatedly randomized): Patients are randomized with equal probability at each assignment. This method provides flexibility by continuously adjusting treatment allocation but may introduce variability in treatment success.
- Procedure SR (single-randomized): Randomization occurs only at the first assignment, and the selected treatment is used for all subsequent patients. While this method simplifies the decision-making process, it risks poor outcomes if the initial randomization does not reflect the true effectiveness of the treatments.
- Procedure JB (J. Bather): Patients are randomized at each step using the following adaptive procedure. The first two patients are assigned treatments A and B randomly, ensuring that each receives a different therapy. Suppose that, by time t (), t patients have been treated, and the outcomes—successes and failures—on treatments A and B are recorded as , respectively, such that . DefineLetandUnder this procedure, the next patient (patient ) receives treatment A with probabilityThis procedure dynamically adjusts treatment based on previous outcomes, potentially enhancing overall success rates by favoring treatments that have shown higher effectiveness.
- Procedure PW (play-the-winner/switch-from-a-loser): The first patient is randomly assigned to either treatment A or B with a probability of 0.5 for each. For patients 2 to n, the treatment given to the previous patient is repeated if it was successful; otherwise, the other treatment is administered. This strategy leverages successful outcomes to inform subsequent treatment choices, thus optimizing the allocation based on real-time feedback.
- Procedure RB (robust Bayes): This policy utilizes a randomization strategy based on a uniform prior density:Due to the symmetry of the uniform prior distribution, the treatments for the first patient are initially equivalent and can be chosen at random. If the first patient experiences success, the second patient receives the same treatment. Conversely, if the first patient experiences a failure, the second patient receives the alternative treatment. Therefore, procedure RB mimics procedure PW for the first two treatment assignments. The same treatment is continued as long as it is successful. However, after a failure, switching to the other treatment may or may not be optimal. If the data strongly support the treatment that has just failed, that treatment will be used again. Specifically, if the current probability of success of treatment A (the posterior expected value of , ) is greater than that of treatment B, then treatment A will be used. Additionally, if both treatments are judged to be equally effective at any stage, the next treatment assignment will be randomized. This approach balances robustness and adaptability, utilizing Bayesian updating to make informed decisions while maintaining some level of randomness.
- Procedure WT (W. Thompson): Similar to procedure JB, this procedure randomizes between treatments X and Y for patients 1 through n. The randomization is based on the current probability distribution of , assuming a uniform prior density on :The next patient receives treatment X with a probability equal to the current probability that . This probability is given bywhere denotes the complete beta function:By continuously updating the probability estimates, this procedure aims to maximize the chances of success based on the accumulated data.
- Procedure PR (posterior probability ratio): This newly proposed procedure selects treatment A or B based on posterior probabilities. In contrast to procedure JB, this procedure randomizes between treatments A and B for patients 1 through n. The randomization is based on the current expected values of and , assuming a uniform prior density on . The next patient receives treatment A with a probability given byThis procedure provides a direct comparison of the posterior probabilities of success for each treatment, thus enabling more informed treatment decisions based on the most current data.
3. Probabilities
For procedures ER, SR, and RR, we can derive the formula for computing the probabilities of achieving at least k successes out of n trials, denoted as , for various values of and . Given that n is even, we let . This assumption simplifies calculations, allowing us to leverage symmetry in the analysis.
For procedure ER, we consider that the first m patients receive treatment A, while the remaining m patients receive treatment B. Consequently, we have the following:
For procedures SR, we may assign treatment A or B to patient #1, each with a probability of . If patient #1 receives treatment A, then the remaining patients will also receive treatment A. Similarly, if patient #1 receives treatment B, then the remaining patients will also receive treatment B. Hence,
For procedures RR, treatment A or B (each with probability 1/2) is assigned to patients independently. Clearly, the probability that a patient receives a positive response or a negative response, respectively, is and . Thus,
Note that the difference between procedures ER and RR is that procedure ER assigns m patients with treatment A and the remaining patients with treatment B. In contrast, we are unable to know how many patients receive treatment A or B under procedure RR in advance. At the end of the experiment, there may be fewer m patients receiving treatment A and more than m patients receiving treatment B, and vice versa.
4. Numerical Studies
The derivation of recursive formulas to calculate the probability of achieving at least k successes out of n trials for procedures RB, JB, WT, and PR is complex. Consequently, simulation studies are employed to effectively evaluate and compare these procedures. The computer program designed for calculations and generating graphics to enhance reproducibility and transparency was written in R (R Core Team [32]), and it is available from the authors upon request.
To assess the performance of these procedures using the conditional probability lost (CPL) metric discussed in Section 2, we conducted a simulation study with 1000 iterations. This study estimated probabilities for selected values of , , , and . The diverse parameter set allows for a comprehensive evaluation of the procedures across various scenarios.
Based on the simulation results, we draw several key observations regarding the performance of the procedures in maximizing the proportion of successes in clinical trials:
- Comparison of randomization procedures:
- Figure 1 and Figure 2 illustrate that the randomization procedures ER and RR perform similarly, with ER slightly outperforming RR. In certain cases, SR shows superior performance, indicating that the choice of randomization procedure significantly impacts outcomes. Notably, for each value of k, the range of over which SR outperforms ER and RR decreases as increases. Conversely, as k increases, these ranges widen for a fixed . Overall, SR is less effective for larger values of when or k is small to intermediate, underscoring the importance of tailoring randomization procedures to the specific trial conditions.
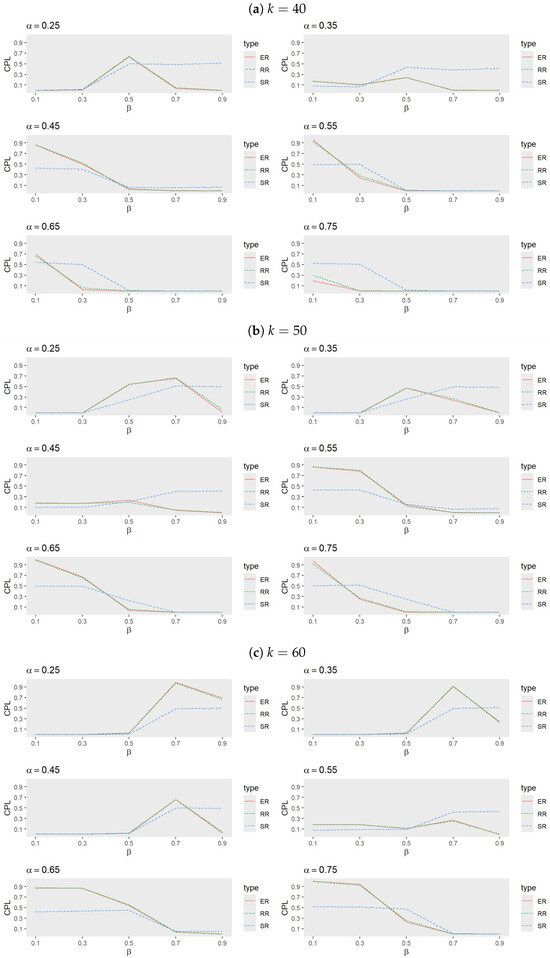 Figure 1. Comparison of randomization procedures for ER, RR, and SR when (a) , (b) , and (c) with , , and .
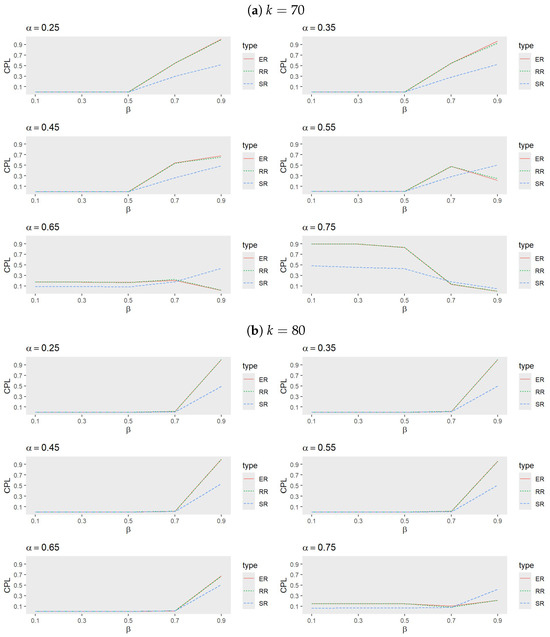 Figure 2. Comparison of randomization procedures for ER, RR and SR when (a) , and (b) with , , and .
 - Performance of adaptive procedures:
- Figure 3 and Figure 4 reveal that, among the adaptive procedures, PR consistently performs the worst. Conversely, JB and WT demonstrate a similar performance, with JB slightly outperforming WT. For a small , RB generally exhibits the best performance, followed by JB, WT, and PW. However, as increases, JB becomes the most effective procedure, with WT next in line, while PW and RB alternate in performance based on trial conditions.
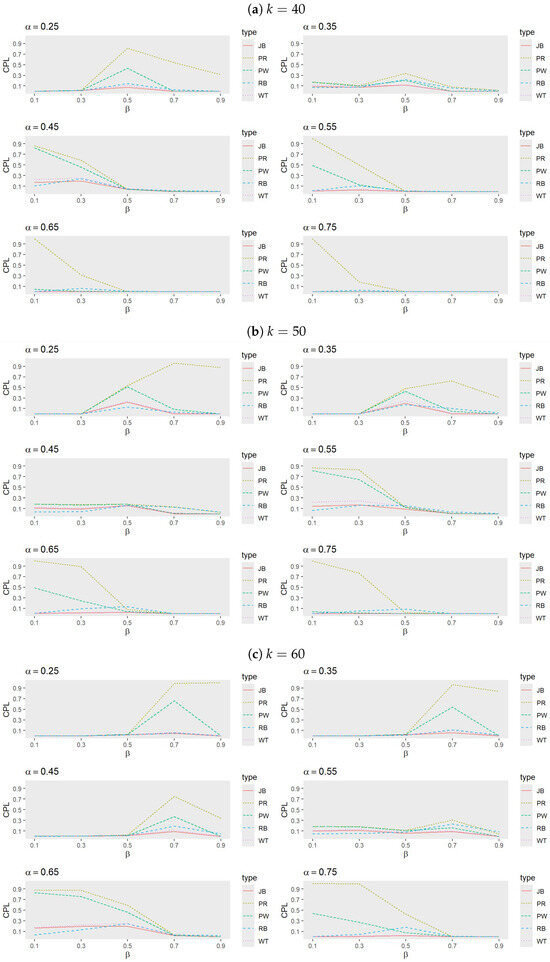 Figure 3. Comparison of adaptive procedures for JB, PW, RB, WT, and PR when (a) , (b) , and (c) with , , and .
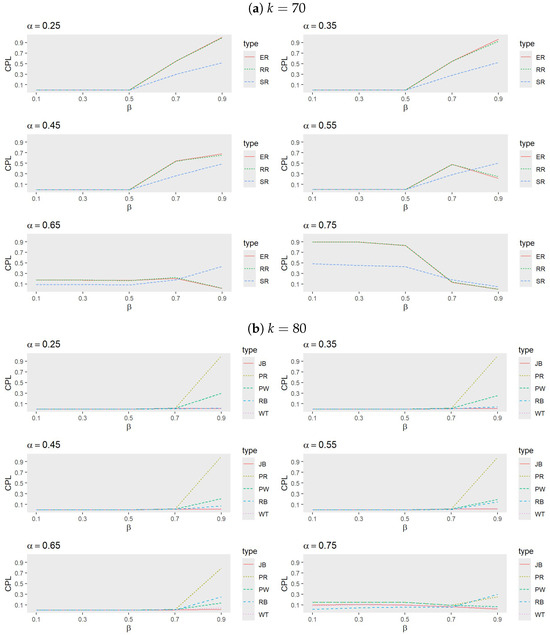 Figure 4. Comparison of adaptive procedures for JB, PW, RB, WT, and PR when (a) and (b) with , , and .For smaller values, RB tends to outperform JB when larger k values are combined with moderate to high values, but it underperforms compared to PW when smaller k values and lower to moderate values are involved. These performance shifts highlight the sensitivity of adaptive procedures to variations in k, , and , emphasizing the necessity of tailoring the choice of procedure to the specific trial conditions, target success probability, and desired number of successes.
 - Comparison between SR, ER, JB, and RB:
- Figure 5 and Figure 6 indicate that, for small values of , RB generally exhibits the best performance, followed by either JB or SR, while ER performs the least effectively. As increases, however, JB emerges as the most effective procedure, with the performance of RB, SR, and ER alternating based on trial conditions. Notably, ER outperforms RB when both and are large.
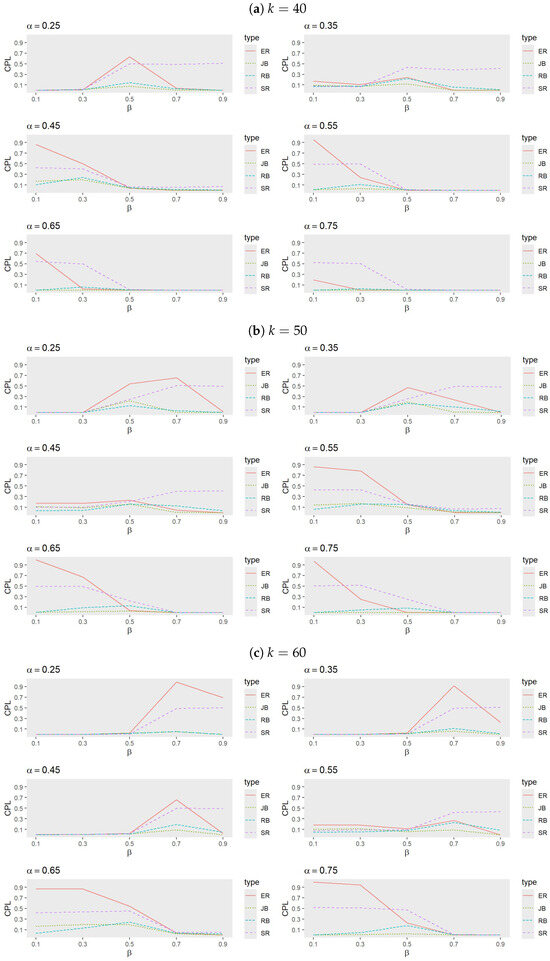 Figure 5. Comparison of procedures ER, SR, JB, and RB when (a) , (b) , and (c) with , , and .
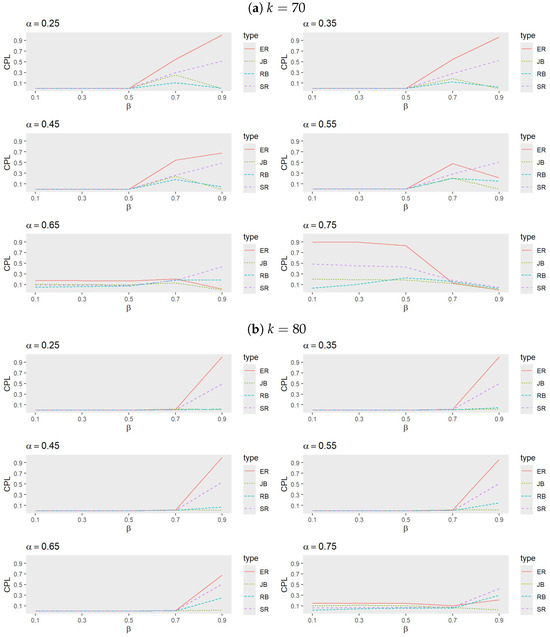 Figure 6. Comparison of procedures ER, SR, JB, and RB when (a) and (b) with , , and .
 - Analysis of heatmaps:
- The series of heatmaps displayed in Figure 7, Figure 8 and Figure 9 illustrate how each allocation procedure performs across varying values of k and the parameters and . Key observations include the following.
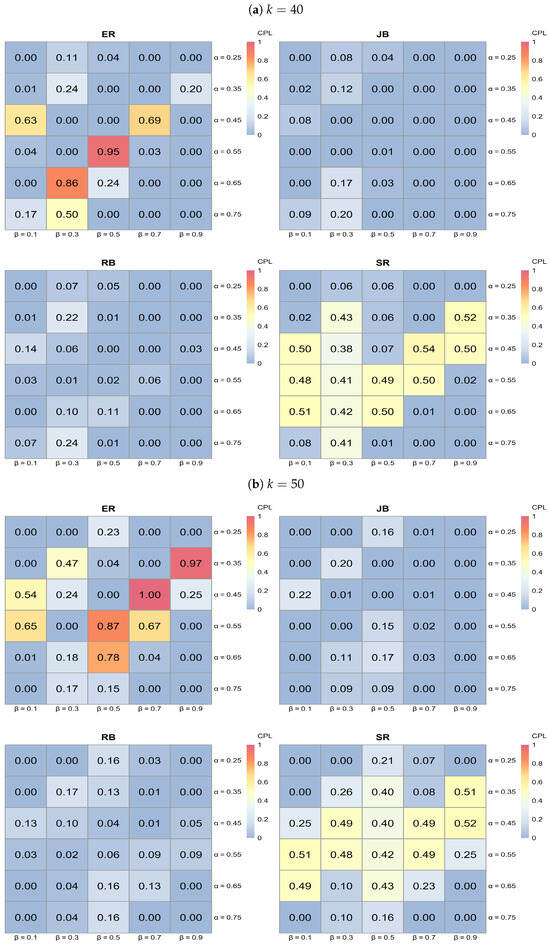 Figure 7. Heatmap analysis for ER, SR, JB, and RB when (a) and (b) with 0.25, 0.35, 0.45, 0.55, 0.65, 0.75, , and .
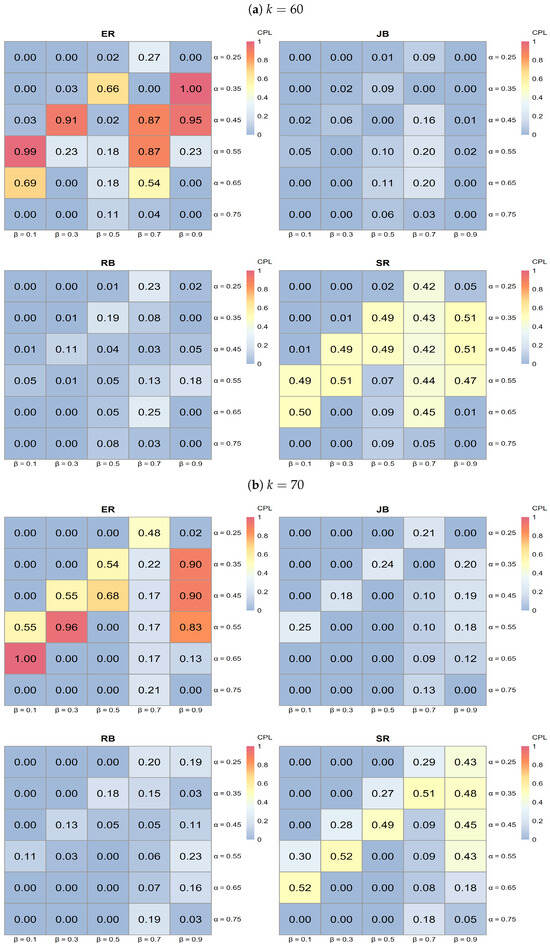 Figure 8. Heatmap analysis for ER, SR, JB, and RB when (a) and (b) with 0.25, 0.35, 0.45, 0.55, 0.65, 0.75, , and .
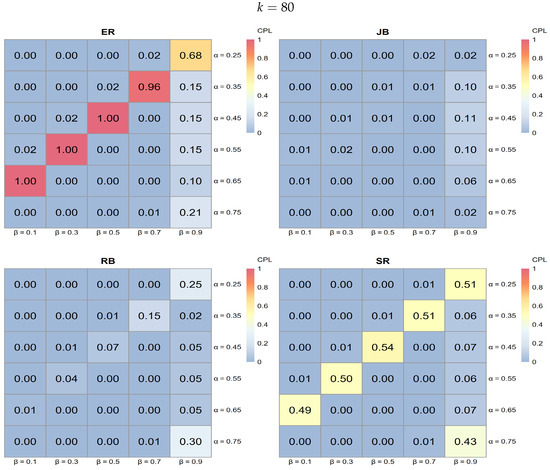 Figure 9. Heatmap analysis for ER, SR, JB, and RB when with 0.25, 0.35, 0.45, 0.55, 0.65, 0.75, , and .
- Performance variation by procedure:
- ER typically exhibits lighter shades of blue across various k values, indicating higher CPL and, thus, less favorable performance compared to the other procedures.
- JB shows darker blue regions in specific areas, particularly at higher k values, suggesting effective performance in minimizing CPL under those conditions.
- RB demonstrates dark blue regions, especially at a lower , indicating effective performance; however, its effectiveness diminishes as increases.
- SR shows darker blue regions at higher values, indicating better performance in reducing CPL, although its effectiveness varies across all k values.
- Influence of k on procedure performance:
- As k increases from 40 to 80, the distribution of darker blue regions varies across procedures. Notably, JB tends to achieve darker blue intensities (indicating better CPL performance) at higher k values, while RB displays a similar pattern but is more sensitive to changes in .
- Parameter sensitivity:
- The effectiveness of each procedure varies with and . For instance, both JB and RB exhibit darker blue regions (lower CPL) at lower values, while SR shows darker blue at higher values. This variability underscores the importance of selecting a procedure based on specific trial conditions, as some procedures yield better performance with low CPL in particular parameter settings.
In conclusion, this comparative analysis of randomization and adaptive procedures underscores the importance of aligning the chosen method with the specific conditions of the trial. The results presented in Figure 1, Figure 2, Figure 3 and Figure 4 reveal that, while randomization methods such as ER and RR exhibit comparable performance, procedure SR can excel in certain situations, particularly at lower values of . However, its effectiveness diminishes as increases or when and k are lower.
Among the adaptive procedures, JB consistently demonstrates superior performance, especially with an increasing , while PR remains the least effective across all scenarios. The performance of RB is noteworthy, showing advantages under specific conditions with a smaller , but it is highly sensitive to variations in the parameters k and .
To maximize effectiveness, the careful selection of randomization and adaptive procedures based on anticipated trial parameters is essential. The heatmap analysis further emphasizes the significant impact that the choice of procedure has on the CPL. Therefore, it is advisable for trial designers to consider the specific success target (k) and parameter values ( and ) when selecting procedures to optimize performance.
Moreover, the consistent performance of treatment allocation procedures for when , with exceptions noted for SR in randomization methods and PR in adaptive procedures, suggests that the applicability of the CPL metric and the recommended procedures may be limited to smaller sample sizes. Thus, further investigations are warranted to enhance the applicability of these findings in diverse clinical trial designs.
5. Comparison of CESL and CPL: Methodological Perspectives on Treatment Allocation
This section compares the CESL metric introduced by Berry and Eick [8] and the CPL metric developed in our study. The objective is to evaluate treatment allocation procedures based on these two metrics and identify the most effective approaches to clinical trial designs, depending on the trial’s goals and constraints.
Berry and Eick [8] used the CESL metric to assess the effectiveness of adaptive treatment allocation procedures by measuring the expected success loss. They analyzed several adaptive designs, including RB, JB, WT, and PW, comparing each against the ER design. Their findings indicated that the RB procedure generally minimized the expected success loss more effectively than other adaptive procedures, especially when trial sizes (n) were small. However, they observed that RB may not consistently perform well across all sample sizes, n, and for some combinations of , especially as these values moderate. Additionally, while RB demonstrated clear advantages over ER for small trials, its practical use diminished with larger trials, where it showed only marginal improvements over ER and was more challenging to implement due to its complexity.
In contrast, this study employed the CPL metric to evaluate treatment allocation procedures, focusing on the probability of achieving a predefined target of k successes within the trial. This alternative perspective enables a nuanced assessment of how well different procedures support success-driven trial goals. We examined three randomization-based procedures—ER, RR, and SR—alongside four adaptive approaches—RB, JB, PW, and PR. Our results indicate that the ER and RR designs perform similarly, with a slight edge for ER. Among the adaptive approaches, JB demonstrates consistently strong performance, particularly as increases, aligning well with trials that prioritize success maximization. Conversely, PR consistently shows the least efficacy across all parameter settings, highlighting its limitations in success-oriented applications. Notably, while RB maintains competitive performance under specific conditions, particularly with lower , it exhibits considerable sensitivity to changes in k and , which could limit its generalizability across varied trial designs.
Overall, both the CESL and CPL metrics offer valuable insights into procedure performance but serve distinct trial objectives. The CPL metric is particularly beneficial for trials focused on achieving specific success thresholds, such as a target number of successes. In contrast, CESL better aligns with adaptive designs where minimizing expected success loss is a priority. Our findings, together with Berry and Eick’s observations, underscore the importance of selecting the appropriate metric and procedure based on the trial’s primary objectives. For trials emphasizing broader applicability and adaptability, CESL-guided adaptive designs may be preferable. However, for trials with a targeted success criterion, CPL-based assessments provide more relevant guidance for achieving within-trial success objectives.
6. Concluding Remarks
This study has introduced the conditional probability lost (CPL) metric, designed to evaluate and compare various treatment allocation procedures in sequential clinical trials with a focus on achieving specific success targets. Through a comprehensive simulation study, we assessed the performance of both randomization-based and adaptive procedures under diverse parameter settings, allowing for an analysis of each procedure’s strengths and limitations.
Our results reveal that randomization procedures, specifically ER and RR, perform similarly, with ER showing a slight advantage in general. Adaptive procedures, however, display more variability: while RB minimizes expected success loss in scenarios with small values of and , it becomes more sensitive to parameter changes, particularly with higher values of k and . In contrast, JB consistently outperforms other adaptive approaches, particularly as increases, making it suitable for trials that prioritize reaching defined success targets. The consistently low performance of PR across all settings highlights its limitations in success-oriented applications.
This study, together with the work of Berry and Eick (1995), emphasizes the importance of selecting metrics that are closely aligned with the goals of the trial. The CPL metric is especially useful for trials aiming to meet specific success thresholds, offering actionable insights for procedures designed to maximize within-trial success. Conversely, CESL’s focus on minimizing expected success loss is beneficial in adaptive designs where broader patient benefit and loss minimization are primary concerns. The choice of metric and procedure should, thus, align with the trial’s primary objectives, balancing between adaptability (CESL) and targeted success achievement (CPL).
Although our findings offer promising insights, certain limitations should be acknowledged. The recursive formulations used to compute success probabilities add complexity to practical applications, and while our simulation study is extensive, it remains bounded by specific parameter ranges and sample sizes.
Future research could further expand the CPL framework to accommodate multi-armed trials, broader parameter spaces, and additional trial objectives. Additionally, integrating real-world data may enhance the applicability of our results, providing a practical validation of CPL’s utility in diverse clinical settings.
Moreover, the variability of allocation procedures, which may accompany procedures closely aligned with ethical goals, should also be considered in making recommendations. Reporting this variability provides a more complete evaluation of each procedure, helping to balance ethical outcomes with allocation stability.
Finally, we can explore the integration of early-stop designs with the CPL framework. These designs, which allow for trial termination upon observing strong evidence of treatment efficacy, could further balance the power and success rate, optimizing trial outcomes while improving patient benefit and efficiency.
In conclusion, the CPL metric and our simulation findings contribute to informed decision-making in clinical trial design, supporting a more tailored approach to treatment allocation. By aligning the choice of procedure with trial-specific objectives, researchers can enhance trial effectiveness, ultimately advancing patient outcomes and medical knowledge.
Author Contributions
Conceptualization, C.-T.L., Y.-W.L. and Y.-J.H.; methodology, C.-T.L., Y.-W.L. and Y.-J.H.; software, Y.-W.L. and Y.-J.H.; validation, C.-T.L., Y.-W.L. and Y.-J.H.; formal analysis, C.-T.L., Y.-W.L. and Y.-J.H.; investigation, C.-T.L., Y.-W.L. and Y.-J.H.; resources, C.-T.L., Y.-W.L. and Y.-J.H.; data curation, C.-T.L., Y.-W.L. and Y.-J.H.; writing—original draft preparation, C.-T.L.; writing—review and editing, C.-T.L.; visualization, C.-T.L., Y.-W.L. and Y.-J.H.; supervision, C.-T.L.; project administration, C.-T.L.; funding acquisition, C.-T.L. All authors have read and agreed to the published version of the manuscript.
Funding
This research was funded by the Ministry of Science and Technology of the Republic of China, Taiwan grant number MOST 112-2118-M-032-002-MY2.
Institutional Review Board Statement
Not applicable.
Informed Consent Statement
Not applicable.
Data Availability Statement
Data are contained within the article.
Acknowledgments
Authors would like to thank the anonymous referees for their suggestions and comments to significantly improve this manuscript.
Conflicts of Interest
The authors declare no conflicts of interest.
References
- Thompson, W.R. On the likelihood that one unknown probability exceeds another in view of the evidence of two samples. Biometrika 1933, 25, 285–294. [Google Scholar] [CrossRef]
- Feldman, D. Contributions to the ‘two-armed bandit’ problem. Ann. Math. Stat. 1962, 33, 847–856. [Google Scholar] [CrossRef]
- Zelen, M. Play the winner rule and the controlled clinical trial. J. Am. Stat. Assoc. 1969, 64, 131–146. [Google Scholar] [CrossRef]
- Sobel, M.; Weiss, G.H. Play-the-winner rule and inverse sampling in selecting the better of two binomial populations. J. Am. Stat. Assoc. 1971, 66, 546–551. [Google Scholar] [CrossRef]
- Berry, D.A. Modified two-armed bandit strategies for certain clinical trials. J. Am. Stat. Assoc. 1978, 73, 339–345. [Google Scholar] [CrossRef]
- Bather, J.A. Randomized allocation of treatments in sequential medical trials (with discussion). J. R. Stat. Soc. Ser. 1981, 43, 265–292. [Google Scholar] [CrossRef]
- Berry, D.A.; Fristedt, B. Bandit Problems: Sequential Allocation of Experiments; Chapman and Hall: London, UK, 1985. [Google Scholar]
- Berry, D.A.; Eick, S.G. Adaptive assignment versus balanced randomization in clinical trials: A decision analysis. Stat. Med. 1995, 14, 231–246. [Google Scholar] [CrossRef] [PubMed]
- Pocock, S.J.; Simon, R. Sequential treatment assignment with balancing for prognostic factors in the controlled clinical trial. Biometrics 1999, 35, 103–115. [Google Scholar] [CrossRef]
- Chaudhuri, S.; Lo, S.H. A hybrid of response-adaptive and covariate-adaptive randomization for multi-center clinical trials. Stat. Med. 2002, 21, 131–145. [Google Scholar]
- Berry, D.A.; Eick, S.G. The Design and Analysis of Sequential Clinical Trials; Springer: New York, NY, USA, 1995. [Google Scholar]
- Rosenberger, W.F.; Lachin, J.M. Randomization in Clinical Trials: Theory and Practice; John Wiley & Sons: Hoboken, NJ, USA, 2002. [Google Scholar]
- Hu, F.; Rosenberger, W.F. The Theory of Response-Adaptive Randomization in Clinical Trials; John Wiley & Sons: Hoboken, NJ, USA, 2006. [Google Scholar]
- Chow, S.C.; Chang, M. Adaptive design methods in clinical trials—A review. Orphanet J. Rare Dis. 2008, 3, 11. [Google Scholar] [CrossRef] [PubMed]
- Porcher, R.; Lecocq, B.; Vray, M. Adaptive methods: When and how should they be used in clinical trials? Therapies 2011, 66, 309–317. [Google Scholar] [CrossRef]
- Laage, T.; Loewy, J.W.; Menon, S.; Miller, E.R.; Pulkstenis, E.; Kan-Dobrosky, N.; Coffey, C. Ethical Considerations in Adaptive Design Clinical Trials. Ther. Innov. Regul. Sci. 2016, 51, 190–199. [Google Scholar] [CrossRef] [PubMed]
- Bhatt, D.L.; Mehta, C. Adaptive Designs for Clinical Trials. N. Engl. J. Med. 2016, 375, 65–74. [Google Scholar] [CrossRef] [PubMed]
- Chang, M.; Balser, J. Adaptive Design - Recent Advancement in Clinical Trials. J. Bioanal. Biostat. 2016, 1, 14. [Google Scholar] [CrossRef]
- Pallmann, P.; Bedding, A.W.; Choodari-Oskooei, B.; Dimairo, M.; Flight, L.; Hampson, L.V.; Holmes, J.; Mander, A.P.; Odondi, L.; Sydes, M.R.; et al. Adaptive designs in clinical trials: Why use them, and how to run and report them. BMC Med. 2018, 16, 29. [Google Scholar] [CrossRef]
- Kelly, L.E.; Dyson, M.P.; Butcher, N.J.; Balshaw, R.; London, A.J.; Neilson, C.J.; Junker, A.; Mahmud, S.M.; Driedger, S.M.; Wang, X. Considerations for adaptive design in pediatric clinical trials: Study protocol for a systematic review, mixed-methods study, and integrated knowledge translation plan. Trials 2018, 19, 572. [Google Scholar] [CrossRef]
- Thorlund, K.; Haggstrom, J.; Park, J.J.; Mills, E.J. Key design considerations for adaptive clinical trials: A primer for clinicians. BMJ 2018, 360, k698. [Google Scholar] [CrossRef] [PubMed]
- Afolabi, M.O.; Kelly, L.E. Non-static framework for understanding adaptive designs: An ethical justification in paediatric trials. J. Med. Ethics 2022, 48, 825–831. [Google Scholar] [CrossRef] [PubMed]
- Kaizer, A.M.; Belli, H.M.; Ma, Z.; Nicklawsky, A.G.; Roberts, S.C.; Wild, J.; Wogu, A.F.; Xiao, M.; Sabo, R.T. Recent innovations in adaptive trial designs: A review of design opportunities in translational research. J. Clin. Transl. Sci. 2023, 7, e125. [Google Scholar] [CrossRef] [PubMed]
- Ben-Eltriki, M.; Rafiq, A.; Paul, A.; Prabhu, D.; Afolabi, M.O.S.; Baslhaw, R.; Neilson, C.J.; Driedger, M.; Mahmud, S.M.; Lacaze-Masmonteil, T.; et al. Adaptive Designs in Clinical Trials: A Systematic Review—Part I. BMC Med. Res. Methodol. 2024, 24, 229. [Google Scholar] [CrossRef]
- Efron, B. Forcing a sequential experiment to be balanced. Biometrika 1971, 58, 403–417. [Google Scholar] [CrossRef]
- Zelen, M. The randomization and stratification of patients to clinical trials. J. Chronic Dis. 1974, 27, 365–375. [Google Scholar] [CrossRef] [PubMed]
- Wei, L.J. An application of an urn model to the design of sequential controlled clinical trials. J. Am. Stat. 1978, 73, 559–563. [Google Scholar] [CrossRef]
- Pocock, S.J. Clinical Trials: A Practical Approach; Wiley: Hoboken, NJ, USA, 1983. [Google Scholar]
- Rosenberger, W.F.; Lachin, J.M. Randomization in Clinical Trials: Theory and Practice, 2nd ed.; Wiley: Hoboken, NJ, USA, 2016. [Google Scholar]
- Cornfield, J. Randomization by group: A formal analysis. Am. Epidemiol. 1978, 108, 100–104. [Google Scholar] [CrossRef]
- Fleiss, J.L. The Design and Analysis of Clinical Experiments; Wiley: Hoboken, NJ, USA, 1986. [Google Scholar]
- R Core Team. R: A Language and Environment for Statistical Computing; R Foundation for Statistical Computing: Vienna, Austria, 2024; Available online: https://www.R-project.org/ (accessed on 11 December 2024).
Disclaimer/Publisher’s Note: The statements, opinions and data contained in all publications are solely those of the individual author(s) and contributor(s) and not of MDPI and/or the editor(s). MDPI and/or the editor(s) disclaim responsibility for any injury to people or property resulting from any ideas, methods, instructions or products referred to in the content. |
© 2024 by the authors. Licensee MDPI, Basel, Switzerland. This article is an open access article distributed under the terms and conditions of the Creative Commons Attribution (CC BY) license (https://creativecommons.org/licenses/by/4.0/).