Abstract
Laser deposition manufacturing (LDM) has drawn unprecedented attention for its advantages in manufacturing large-scale and complex metal components. During the process of LDM, a large thermal gradient is generated due to thermal cycling and heat accumulation. As a result, large residual stress and deformation are formed in the LDM metal components. Then, the dimensional accuracy of the metal components becomes poor. To achieve deformation control and increase dimensional accuracy, the deformation prediction of metal components is very meaningful and directional. However, the traditional thermoelastic–plastic method can only achieve deformation prediction for small-scale LDM metal components. Because of the low computational efficiency, it is extremely difficult to meet deformation prediction demand for large-scale metal components. Based on feature partitioning and the inherent strain method, a rapid deformation prediction method is proposed for large-scale metal components in this manuscript. Firstly, to solve the problem of poor consistency of formation quality due to the randomness of the partition process, the partitioning process was established according to typical geometric features. Secondly, the inherent strain values for different partitions were obtained by considering the effects of the extraction method, mesh size, equivalent value layer, and partition size on the inherent strain values. Then, using the inherent strain method, the deformation of large-scale components was predicted rapidly. Comparing the simulation results with the experimental results, the following conclusions were obtained. The deformation predicted by the method proposed in this manuscript is consistent with the deformations predicted using the traditional thermoelastic–plastic method and the experimental method. Significantly, applying the method proposed in this manuscript to predict the deformation of LDM metal components, computational efficiency is improved by 27.25 times compared with results using the conventional thermoelastic–plastic method.
MSC:
03C98; 80A21
1. Introduction
Directed energy deposition (DED) [1] is an additive manufacturing process that creates parts layer by layer. LDM is a widely adopted DED technique used to manufacture large metal components with high accuracy. It involves using metal powder as the raw material and coaxial powder as a feature, where a high-power laser is used to melt and rapidly solidify the metal powder layer by layer, creating near-net-shape components [2]. However, during the printing process, the presence of a moving heat source leads to a high temperature gradient around the molten pool, resulting in residual stress and deformation in the manufactured components [3,4]. These issues can negatively impact the accuracy and quality of the final products [5]. Therefore, accurately predicting and controlling residual stresses and deformations is crucial for deformation control, shape optimization, and increased support.
Currently, there are two main methods used to predict residual stress and deformation: experimental measurement and numerical simulation [6,7]. Experimental measurements can provide accurate data but may cause damage to components, and the data obtained are often limited. For example, Claudia et al. measured the residual stresses of components using the drilling method, but this method caused destructive damage [8]. Chen et al. used neutron diffraction to measure residual stresses and deformation, but the measurements were restricted to the near-surface region of the specimens [9]. Experimental methods are not effective for predicting these properties in large, additive-manufactured components.
Numerical simulations can overcome the limitations of experimental measurements and provide more comprehensive results for stress and deformation analysis [10,11,12]. Denlinger et al. used the thermoelastic–plastic finite element method to study temperature and stress fields during the forming process and optimize process parameters to reduce deformation [13]. Andreas et al. used a thermoelastic–plastic model to simulate the temperature and deformation fields of a thin-walled structure and compared the predicted results with experimental data, showing good agreement [14]. Although the thermoelastic–plastic finite element method can accurately predict the distribution of residual stress and deformation, it is time-consuming and mainly applicable to small-scale models [15]. Meeting the deformation prediction needs of large, additive-manufactured components remains challenging.
The inherent strain method [16] is commonly used to predict residual stresses and deformations in metal welding. This method was first proposed by Ueda et al. in 1975 [17,18]. It replaces the entire complex welding process with representative values of inherent strain and calculates stress and deformation using elastic calculations. However, due to the differences between additive manufacturing and welding processes, modifications are needed to predict the deformation of additive components accurately. Liang et al. [19,20,21] modified the inherent strain method by studying the forming characteristics of additive manufacturing. They developed a method to extract and incorporate inherent strains into large-size structures, resulting in accurate deformation predictions with high computational efficiency. Chen et al. [22] further improved the method by extracting inherent strain from a thermoelastic–plastic model and using it to simulate large-size structures through finite element analysis. Tran et al. [23] explored the relationship between inherent strain values in small-scale and large-scale models, using the local-to-whole analysis method to predict the deformation of large and complex components.
In the established research, there are few studies on the inherent strain method in the field of additive manufacturing. Prediction methods for large additive components still need to be improved. Although the traditional partitioning method can predict the deformation of large components, the complexity of the process leads to low prediction efficiency. Building upon these advancements, this manuscript proposes a fast prediction method for the deformation of large additive components by combining feature partitioning and inherent strain methods. Using LDM technology, a component was divided into four typical feature partitions: − shape, + shape, T shape, and L shape. The influence of the strain extraction method, application method, equivalent value layer, and partition size on the average inherent strain was considered, and inherent strain sets for different feature partitions were established. Experimental verification was conducted to assess the accuracy of the deformation predictions. The deformation of large and complex additive components was predicted using the method proposed in this manuscript.
2. Typical Feature Partitioning and Modeling
2.1. Feature Partitioning
LDM is an in-situ metallurgical technique that employs a high-energy heat source to rapidly melt metal powders and solidify them. During the manufacturing process, the large temperature gradient results in residual stress formation in deposited components. The accumulation of residual stress becomes more pronounced with the increasing size of the components, potentially causing excessive deformation or even cracking. Partitioning is a key method utilized in LDM to mitigate residual stresses and minimize deformation. Figure 1 shows a typical large structural component.
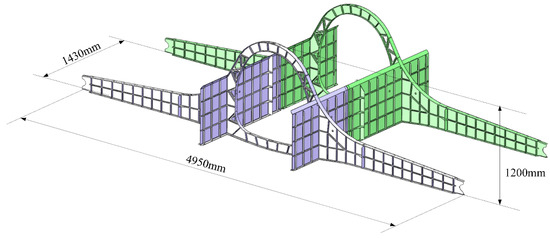
Figure 1.
Typical large-scale metal structure.
With the development of additive manufacturing technology, metal additive manufacturing components entail challenges as large-scale, complex structures regarding configuration topology, structure–function integration, and gradient composite [24]. Traditional partitioning methods face some challenges such as lengthy preparation times for forming process documentation, limited portability across different components, and inadequate quality stability. In order to effectively deposit and manufacture large-scale metal components, a partitioning method based on typical geometric features is proposed in this paper. The typical geometric features were processed as − shape, + shape, T shape, and L shape. The traditional partitioning method and feature partitioning method are illustrated in Figure 2.
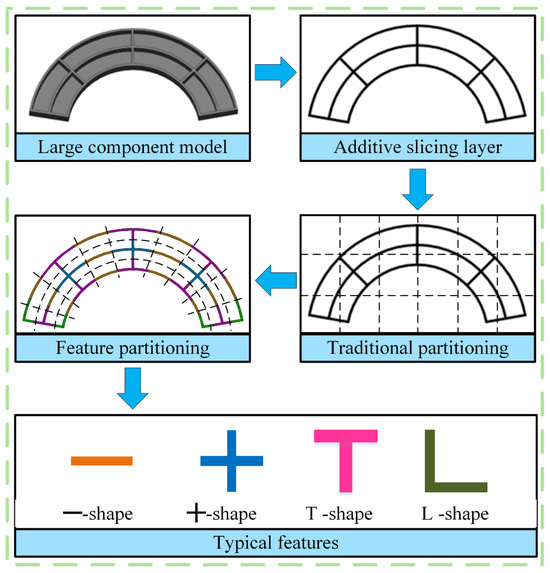
Figure 2.
Typical feature division.
2.2. Finite Element Modeling
To rapidly predict the deformation of these typical feature additive components, ANSYS APDL (2020 R2) finite element software was utilized to establish finite element models for each typical feature partition, as shown in Figure 3. The finite element model employed an 8-node hexahedral SOLID185 element type with dimensions of 1 mm × 1 mm × 1 mm. The short-edge scanning strategy was employed for all element types (as shown in Figure 3), and the process parameters are presented in Table 1.
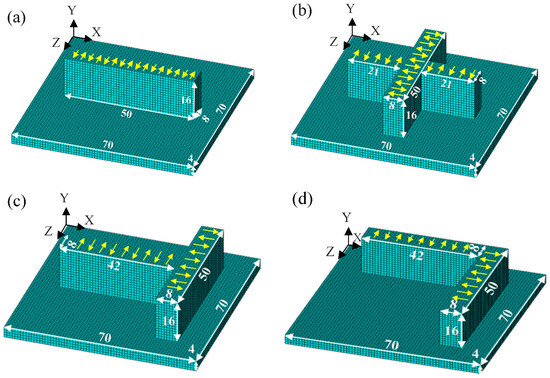
Figure 3.
Feature model mesh size and scanning strategy: (a) − shape, (b) + shape, (c) T shape, (d) L shape.

Table 1.
LDM process parameters.
2.3. Heat Source Model and Material Parameters
Finite element software was employed to establish a finite element model for each feature partition. The thermoelastic–plasticity method was then used to simulate the temperature field, stress field, strain field, and deformation field during LDM. The heat source Q (rm) was implemented using the birth–death element method. The APDL subroutine was utilized to implement the moving heat source Q (r). The heat source model adopted the Gaussian body heat source, as illustrated in Figure 4. The heat source equation [25] is given by Q (r):
where Q (m) represents the maximum energy density at the center of the heat source. A, P, R, and r represent the absorption rate, laser power, effective thermal radius of the laser beam, and radial distance of a surface point in the domain of the heat source axis, respectively.
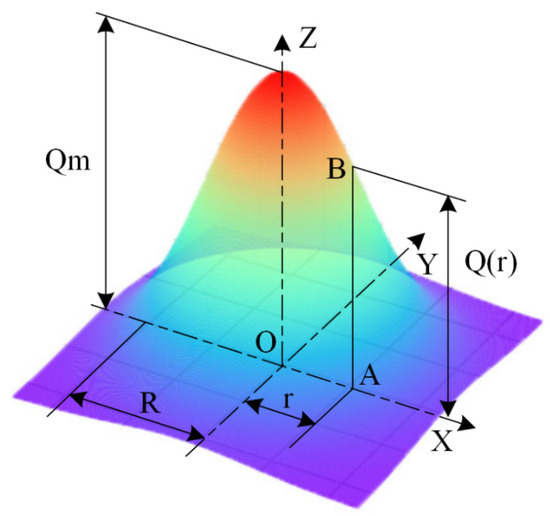
Figure 4.
Gaussian body heat source model.
The thermal analysis was governed by the transient heat conduction equation [26]:
where ρ is the density of the powder, c is the specific heat capacity, t is the time of heat transfer, T is the temperature, λ is the thermal conductivity of the powder, and ϕ is the inner heat source.
The initial condition could be expressed as
The model accounted for the influence of the convection and radiation on the temperature field distribution, and the boundary conditions [27] were expressed as follows:
where T and n are the temperature and normal vector, respectively; hc is the thermal convection coefficient; β is the thermal radiation coefficient; and σ is the Stefan–Boltzmann constant, respectively.
Following the temperature field distribution obtained from the heat conduction simulation, the calculated results were inputted into the mechanical model for stress field analysis. The thermodynamic coupling calculations considered the temperature-dependent Young’s modulus, yield strength, and Poisson’s ratio. The thermophysical and thermodynamic parameters of Ti65 [28] titanium alloy with respect to temperature are presented in Table 2 and Table 3, respectively.
Table 2.
Thermophysical parameters of Ti65 titanium alloy.
Table 3.
Thermodynamic parameters of Ti65 titanium alloy.
3. Inherent Strain Method
3.1. Inherent Strain Correction
The inherent strain method is commonly employed for the rapid prediction of stress and deformation for welded components. During the welding process, welding strain results from the combined effects of thermal strain, plastic strain, and phase strain. Thus, the inherent strain in a welded component is often expressed as the sum of these three components:
where εe, εp, and εT represent the elastic, plastic, and thermal strain components, respectively.
LDM can be considered a multi-track, multi-layer welding process. Therefore, the inherent strain method can be used to predict the deformation of additive components. During the laser deposition, as the heat source moves, the molten pool rapidly cools and solidifies, experiencing significant contraction strains. The elastic strains in each deposited layer are influenced by changing constraint boundaries. Consequently, the original inherent strain theory needs to be modified to enhance the accuracy of deformation prediction for laser-deposited manufactured components. In this study, the intermediate state and steady state were selected to consider the effect of elastic strains that were not fully released during the deposition process due to the evolution of constraint boundaries. The thermoelastic–plastic method was employed to investigate the variation patterns of elastic strains and plastic strains at different moments in the single-pass, double-layer deposition model, as shown in Figure 5. The intermediate state occurred just after the heat source had passed and the compressive strain had reached its maximum value. The steady state was defined as the state when the deposited component was cooled to room temperature. The expression for the corrected inherent strain is given by the following equation:
where t1 represents the intermediate state; t2 represents the steady state; εIn represents the inherent strain; , , and represent the plastic strain, elastic strain, and total strain of the intermediate state, respectively; and represents the elastic strain at the steady state.
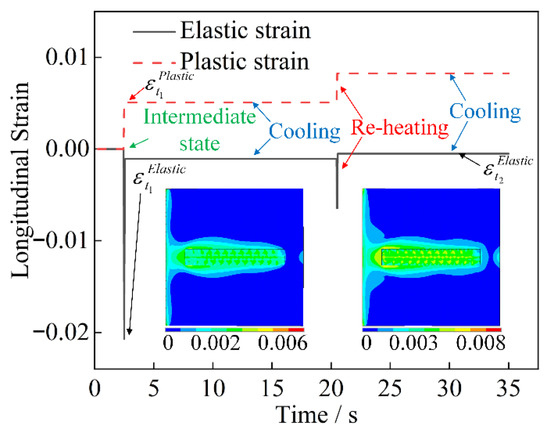
Figure 5.
Distribution of elastic strain and plastic strain during the LDM process.
3.2. The Deformation Prediction Method Based on the Inherent Strain
The thermoelastic–plastic method was employed to simulate the strain field distribution of each feature partition and determine the inherent strain value of the corresponding partition. This inherent strain value was then converted into a material parameter that could be applied to the simulation model. By controlling the temperature difference, material shrinkage in different directions was replicated to simulate the thermal deformation shrinkage process. The one-time thermal analysis enabled rapid deformation prediction. The conversion relationship between the inherent strain and each anisotropic thermal expansion coefficient of the material is represented by the following equation:
where αi represents the equivalent coefficient of thermal expansion, εi denotes the equivalent inherent strain in the ith direction in the Cartesian coordinate system, and ΔT indicates the amount of temperature change (−1 K in this paper).
When predicting the deformation of complex components with multiple feature partitions, the birth–death unit method is utilized to sequentially activate each feature partition of the additive component layer by layer, simulating the cumulative manufacturing process of LDM, obtaining the deformation results of the complex additive components through thermal analysis. Figure 6 illustrates the simulation flow of the LDM inherent strain method.
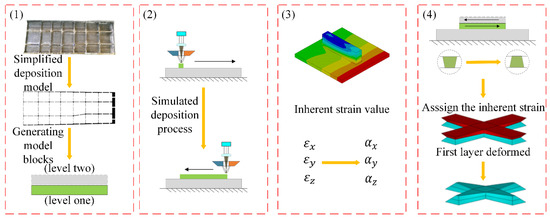
Figure 6.
Deformation prediction schematic based on inherent strain method.
3.3. Inherent Strain Extraction
During the mechanical analysis, there were six strain components. However, when using the inherent strain method to predict deformation, this study disregarded the impact of shear strain components in three directions. This was mainly because the thickness of each deposited layer was significantly smaller than the dimensions of the model in the transverse and longitudinal directions. As a result, the influence of shear strain on the final deformation was negligible. So, it was ignored.
To verify the effect of the extraction method on the inherent strain values, thin-walled feature partition components were developed, as shown in Figure 3a. The total height of the model was 16 mm, with a single deposition layer thickness of 1 mm and 16 deposited layers. Both the substrate and deposition area consisted of Ti65 titanium alloy, with the substrate constrained by unilateral clamping. The thermoelastic–plastic method was employed to simulate the stress distribution, strain distribution, and deformation distribution of the thin-walled feature partition components during the LDM process.
The thermoelastic–plastic calculation provided the temperature distribution, stress distribution, strain distribution, and deformation distribution of the thin-walled feature partition components. Contour diagrams depicting the strain distribution of the thin-walled feature partition components after cooling for 500 s at the end of deposition are displayed in Figure 7. From the strain contour diagram, it can be observed that the strain values were uniformly distributed in the deposition direction after cooling, but they varied across the cross-section. Therefore, it was necessary to investigate the change in strain values on the cross-section of a single layer.
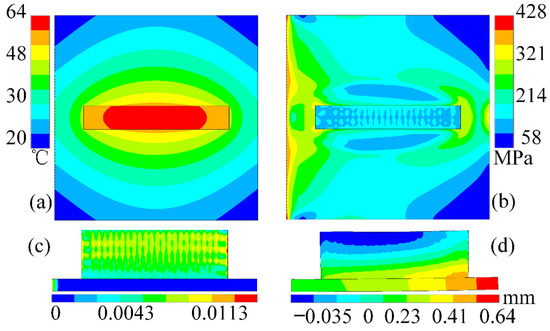
Figure 7.
Resulting distribution of −-shape feature partitions: (a) temperature field, (b) stress field, (c) strain field, (d) deformation field.
The second layer at the end of the deposition was selected to explore the change in strain values on the cross-section of a single layer. The strain distribution contour diagram of the thin-walled feature partition components in the second layer of the LDM process is presented in Figure 8. The contour diagram highlights the directional nature of the strain value distribution. The strain values at the edge of the deposited layer were small. To examine the effect of different extraction paths on the average inherent strain of the deposited layer, three extraction methods (as shown in Figure 9) were employed. The first method involved extracting all nodes along the middle line of the deposition direction and averaging the extracted values as the inherent strain value. The second method extracted the node strains from two horizontally and vertically aligned lines and took the average value as the extracted inherent strain value. The third method involved extracting all the node strains from a single layer and taking the average value as the final strain value. The strain values obtained from the three methods were then added to the model to obtain the final simulation results.
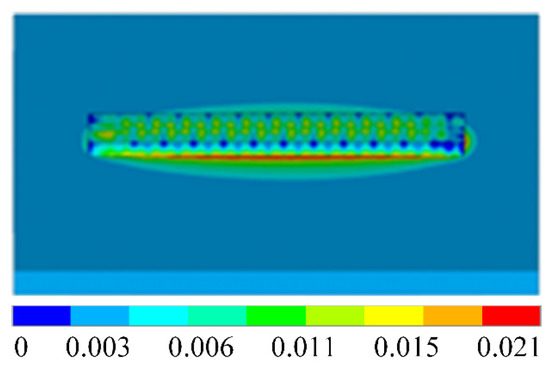
Figure 8.
Cross-sectional strain contour.
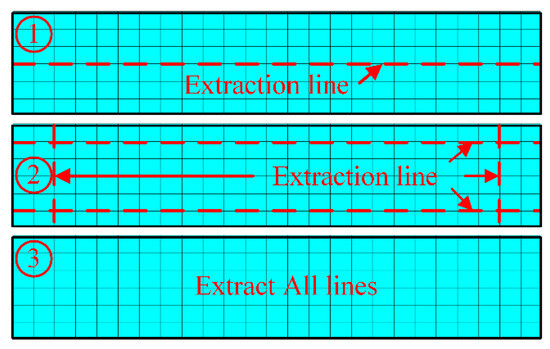
Figure 9.
Strain extraction methods.
According to the three strain extraction methods, the average inherent strain of the sedimentary layer was determined. To assess the impact of different inherent strain values obtained from the extraction paths on the accuracy of deformation prediction, the thermoelastic–plastic method and the inherent strain method were separately employed to predict the deformation of the components in the same model. The predicted results were then compared, and the corresponding comparison curves are presented in Figure 10.
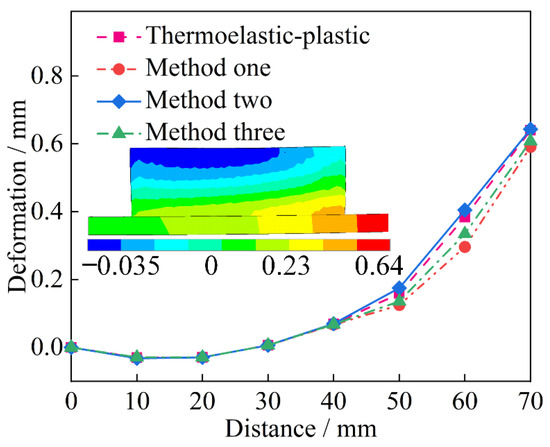
Figure 10.
Deformation curve of the substrate.
The results indicate that, at the constrained end, the deformation predicted by the three extraction methods aligned with the deformation obtained using the traditional method. Conversely, at the free end, the deformation predicted by the second extraction method exhibited a higher level of consistency with the results using the traditional method. The compared results showed a slight deviation. Analyzing the comparison curves of the deformation deviation for different extraction schemes in Figure 11 reveals that the distribution of the strain was directional. The first extraction method overlooked the impact of directionality on the value of the single-layer strain, resulting in significant differences in the deformation prediction results. On the other hand, the third extraction method captured all nodes through the previous cross-sectional strain contour. The effective strain value region was concentrated in the central area, with less coverage in the edge region of thermal accumulation, leading to fewer deformation results. Consequently, the second method (two transverse and two longitudinal paths) proved to be optimum for extracting the inherent strains.
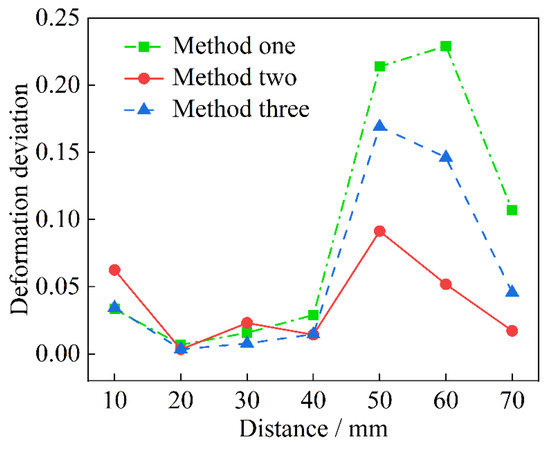
Figure 11.
Deviation curve of the substrate deformation.
4. Method Validation
4.1. Experimental Program
To verify the accuracy of deformation prediction for the additive components based on the inherent strain method, the deformation of different typical feature partitions was simulated using the thermoelastic–plastic method, the experimental method, and the inherent strain method. LDM of each typical feature partition was conducted using LDM-800 additive equipment. Argon was used as a protective gas during the deposition process. Figure 12 displays the experimental equipment and operational status. Ti65 spherical powder with an average particle size of 150 µm was used. During the deposition process, an internal temperature measurement of the substrate was taken using a K-type thermocouple with a diameter of 0.5 mm (indicated as red marked points in Figure 13). After the deposition was completed, a Hexagon coordinate measuring machine, model SF 4.5.4 with an accuracy of 10 µm, measured the deformation at the transverse and longitudinal centerline of the bottom surface of the substrate (indicated as black marked points in Figure 13). The same process parameters described in Section 2.2 were employed in both the experiments and the numerical simulations. During the experiments, the substrate was subject to one-sided clamping constraints.
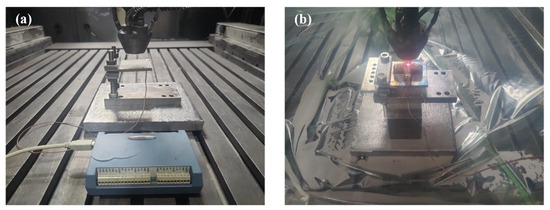
Figure 12.
Experimental system: (a) experimental equipment and (b) experimental environment.
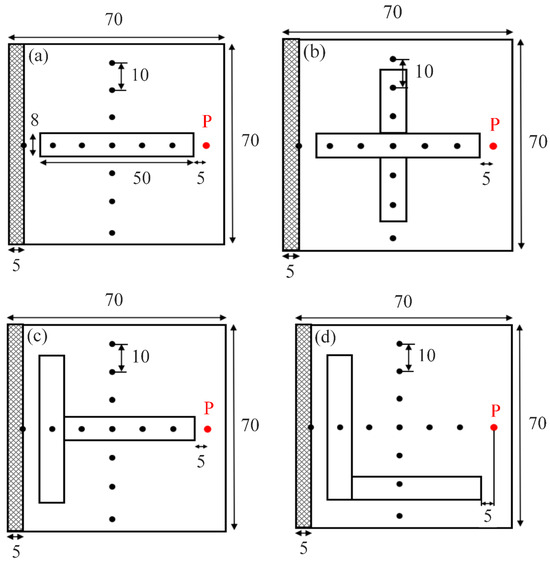
Figure 13.
Temperature and displacement measurement points: (a) − shape, (b) + shape, (c) T shape, (d) L shape.
4.2. Validation of Results
4.2.1. Heat Source Model Validation
This study developed a single-layer deposition model to investigate the morphology of the molten pool during the LDM process through numerical simulation and experimental methods. The melt width and depth of the melt pool obtained using both methods are illustrated in Figure 14. The dimensions of the melt pool morphology obtained from the experiment and simulation matched, indicating the accuracy of the heat source model proposed in this study.
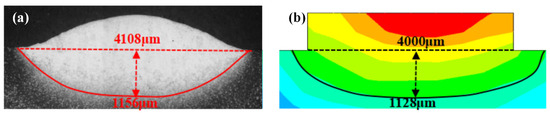
Figure 14.
Melt pool morphology: (a) experimentally obtained melt pool morphology and (b) simulation of the melt pool morphology.
4.2.2. Temperature Field Validation
To verify the accuracy of the finite element analysis method, this study adopted both the thermoelastic–plastic method and the experimental method to obtain the temperature change curve for each typical feature partition. As depicted in the temperature change curves in Figure 15, the temperature change patterns for different feature divisions aligned well with the experimental results. However, during cooling, the simulation temperature dropped faster than the observed temperature due to the use of a room temperature of 20 °C in the simulation process. This temperature difference created a higher temperature gradient, resulting in faster heat dissipation compared to the experimental environment.
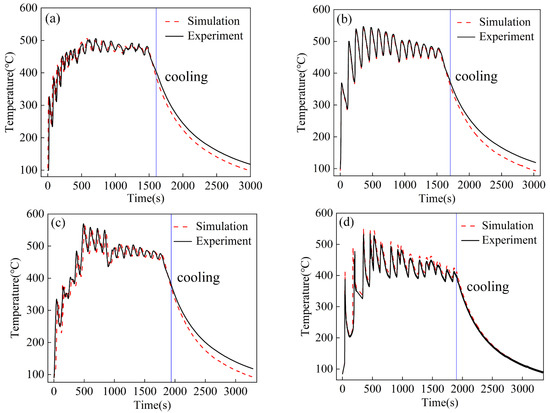
Figure 15.
Comparison of experiment and simulation temperature results for four feature shapes: (a) − shape, (b) + shape, (c) T shape, (d) L shape.
4.2.3. Deformation Results Comparison
The thermoelastic–plastic method, inherent strain method, and experimental method were used to obtain the deformation results for the four thin-walled feature partitions. After 500 s of cooling at the end of the deposition, the contour diagram in Figure 16 shows the deformation field results of the four thin-walled feature partitions. The deformation trend of the four feature partitions was the same as the deformation contour diagram. The deformation of the four distinct shapes was more consistent with the experimental results. The substrate deformation comparison curve in Figure 17 shows that the deformation predicted by the inherent strain method was slightly greater than that predicted by the traditional method. This was because the inherent strain method did not consider the impact of the scanning strategy, which can result in slightly greater local distortion in the deposition area compared to what traditional methods predict. However, both simulation methods accurately predicted the distortion of the substrate and were in good agreement with the experimental results. This indicated that the inherent strain method accurately predicted the deformation of the additive components made by laser deposition.
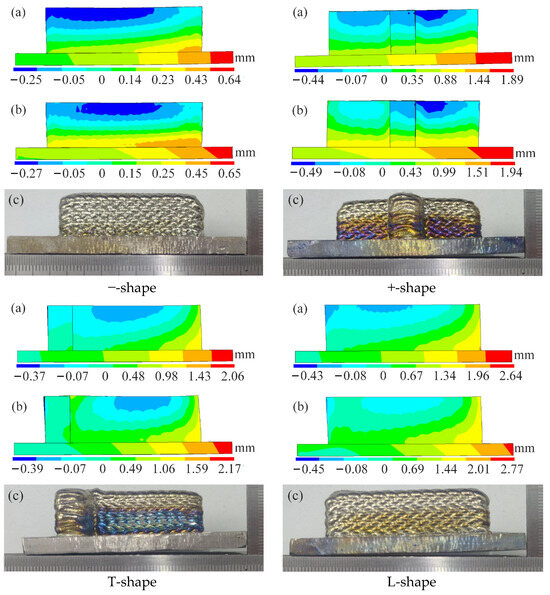
Figure 16.
Comparison of four feature deformation contours: (a) thermoelastic–plastic method, (b) inherent strain method, (c) experimental measurement.
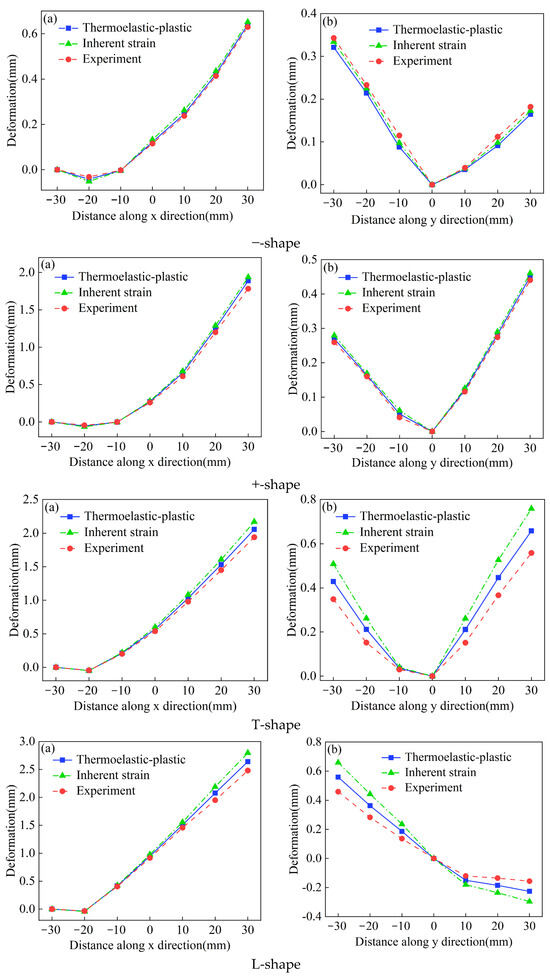
Figure 17.
Comparison of deformation curves of four feature substrates: (a) X direction and (b) Y direction.
4.2.4. Stress Results Comparison
The thermoelastic–plastic and inherent strain methods were used to obtain the stress fields of the four thin-walled feature partitions. After 500 s of cooling at the end of the deposition, the resultant contour diagrams of the stress fields of the four thin-walled feature partitions are shown in Figure 18. It can be observed from the stress contour diagram that the stress distribution trends of the four features were the same, and the magnitude of the equivalent stresses was also the same. The maximum stresses appeared in the connection area between the substrate and the deposition layer, and the stresses in the connection area predicted by the inherent strain method were slightly higher than those predicted by the conventional thermoelastic–plastic method. This was mainly because the effect of the scanning strategy on stresses was not considered.
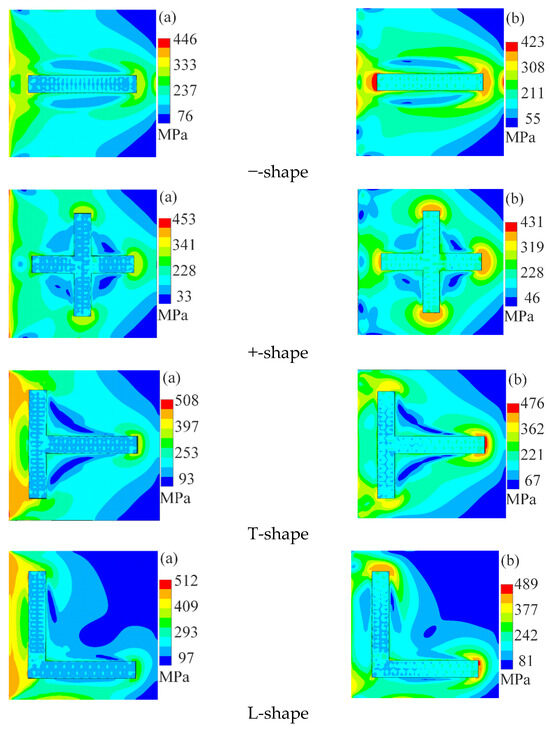
Figure 18.
Comparison of four feature stress contours: (a) thermoelastic–plastic method and (b) inherent strain method.
4.2.5. Efficiency Comparison
To compare the computational efficiency of the thermoelastic–plasticity method with that of the inherent strain method, the simulation time for the four feature shapes is plotted in Figure 19. The inherent strain method could improve the computational efficiency of predicting the deformation of additive components by up to 20 times compared to the traditional thermoelastic–plasticity method, meeting the demand for the rapid prediction of the deformation of large additive components.
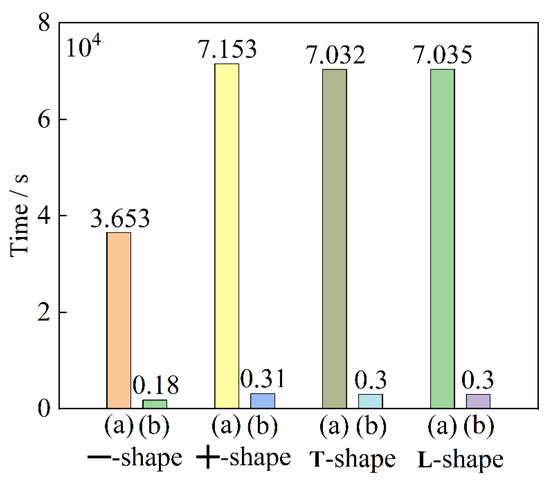
Figure 19.
Comparison of simulation times between the traditional method and the inherent strain method: (a) thermoelastic–plastic method and (b) inherent strain method.
5. Analysis of Impact Factors
5.1. Mesh Size
To study the effect of mesh size on the strain value and computational efficiency of the additive component, a −-shaped, thin-walled, finite element model was established, as shown in Figure 20. Different mesh sizes of 0.5 mm × 0.5 mm × 0.5 mm, 1 mm × 1 mm × 1 mm, and 2 mm × 2 mm × 1 mm were used, and the thermoelastic–plasticity method was employed to study the stress, deformation, and computational efficiency of thin-walled components with different mesh sizes.
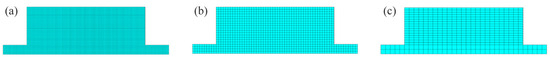
Figure 20.
Mesh sizes: (a) 0.5 mm × 0.5 mm × 0.5 mm, (b) 1 mm × 1 mm × 1 mm, (c) 2 mm × 2 mm × 1 mm.
The thermoelastic–plastic method obtained the stress and deformation fields of the 16-layer, −-shaped, thin-walled feature partitions with different mesh sizes. After 500 s of cooling at the end of the deposition, the deformation field is shown in Figure 21, and the stress field is shown in Figure 22. From the contour diagrams, it can be observed that the deformation and stress distributions had very small differences among the three grid sizes, and the smaller the grid size, the more uniform the resultant contour diagrams. Therefore, the feature partition inherent strain extraction process could be numerically simulated using a 2 mm × 2 mm × 1 mm finite element model to improve computational efficiency.
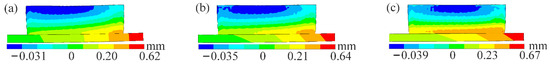
Figure 21.
Deformation contour for different mesh sizes: (a) 0.5 mm × 0.5 mm × 0.5 mm, (b) 1 mm × 1 mm × 1 mm, (c) 2 mm × 2 mm × 1 mm.
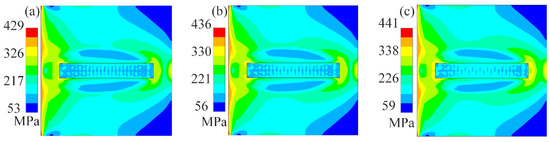
Figure 22.
Stress contour for different mesh sizes: (a) 0.5 mm × 0.5 mm × 0.5 mm, (b) 1 mm × 1 mm × 1 mm, (c) 2 mm × 2 mm × 1 mm.
5.2. Equivalence Layer
In the simulation of the LDM inherent strain method, multiple deposition layers from the actual LDM process were often combined into a single layer and activated simultaneously to enhance the calculation efficiency. However, thermal cycling in the deposition direction affected the inherent strain of deposition layers at different heights in the manufacturing of large and complex components, which contained several deposition layers. To investigate the variation relationship between inherent strain and deposited layer thickness, this study employed the thermoelastic–plastic method to calculate and obtain the strain distribution pattern of a 16-layer, −-shaped, thin-walled feature partition. The strain contour diagram of the −-shaped, thin-walled feature partition after 500 s of cooling at the end of deposition is depicted in Figure 23.
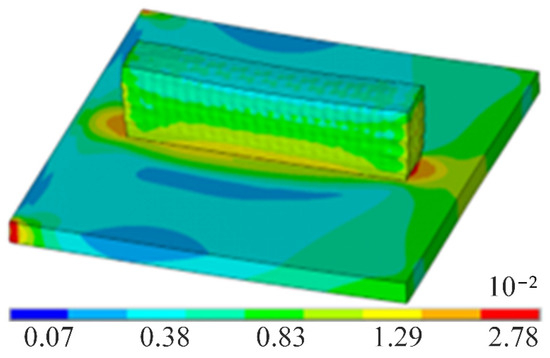
Figure 23.
Strain contour in the deposition direction.
To predict the deformation of additive components using the inherent strain method, appropriate inherent strains needed to be applied to different deposition layers. While multiple deposition layers were typically consolidated into one layer to enhance computational efficiency, utilizing the average inherent strain could compromise the accuracy of the deformation prediction. Therefore, to improve the prediction accuracy of the inherent strain method, distinct inherent strain values were assigned to each layer to obtain more precise simulation results. Taking the 16-layer, −-shaped, thin-walled feature as an example, the average inherent strain values for each deposition layer were extracted, and the corresponding variation curves are plotted in Figure 24. It is evident that the strain values of the first four layers tended to first increase and then decrease, while the subsequent layers exhibited a tendency to stabilize. Hence, in the division of equivalent value layers, it was advisable to combine the first four layers to calculate the cumulative strain value and, similarly, to combine the last twelve layers. Accurate deformation prediction and improved computational efficiency could be ensured with this method.
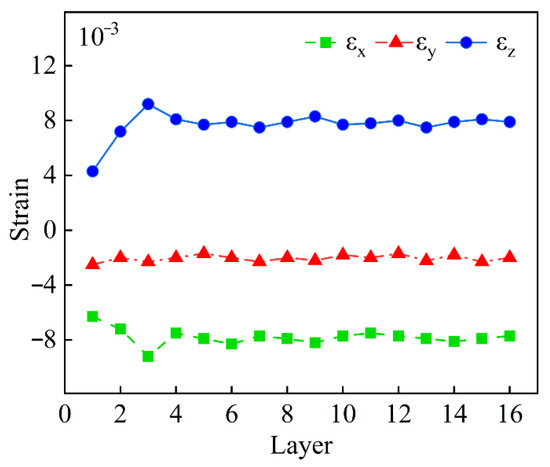
Figure 24.
Trend of strain values in different layers.
To examine the influence of the multi-layer equivalent imposition method on deformation prediction accuracy, multi-layer identical superposition and layer-by-layer superposition are compared in this manuscript. The results of the deformation contour comparison for a 16-layer, −-shaped, thin-walled feature are shown in Figure 25. The deformation patterns obtained from both methods were found to be identical. These findings indicated that the multilayer equivalent application method did not impact the accuracy of deformation prediction. Therefore, a combination of the layer-by-layer application and multilayer equal application could be employed when predicting the deformation of additive components based on the inherent strain method.
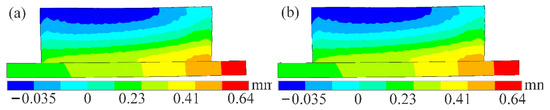
Figure 25.
Comparison of the results of different adding methods: (a) direct addition and (b) layer-by-layer addition.
To investigate the effect of temperature on strain values, the strain value of the center point of the second layer was extracted, and its corresponding temperature variation is illustrated in Figure 26. It can be observed that the strain value tended to stabilize when the temperature was below 1200 °C. Considering the inherent strain change curve (as shown in Figure 25), it is evident that during the deposition of the first four layers, each layer underwent significant changes of the inherent strain value. Therefore, the layer-by-layer method was utilized to predict deformation by applying the corresponding inherent strain consecutively. As the deposition process progressed, the deposited components reached thermal equilibrium, with the inherent strain value of each layer tending to be the same. To improve computational efficiency, layers with the same inherent strain value were merged into an equivalent layer, enabling the rapid prediction of deformation through simultaneous activation.
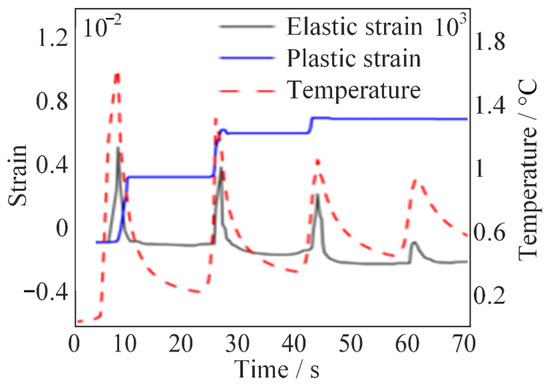
Figure 26.
Trend of strain value with temperature during the deposition process.
5.3. Dimensional Effects
To examine the impact of partition size on the average inherent strain of feature partitions, this study established a feature partition model, as shown in Figure 27, by keeping the constant value of the parameters W1, W2, and L2 and altering the value of the parameter L1. The length of a specific wall of the +-shaped feature, L1, was set to 30 mm, 40 mm, 50 mm, 60 mm, and 70 mm, respectively.
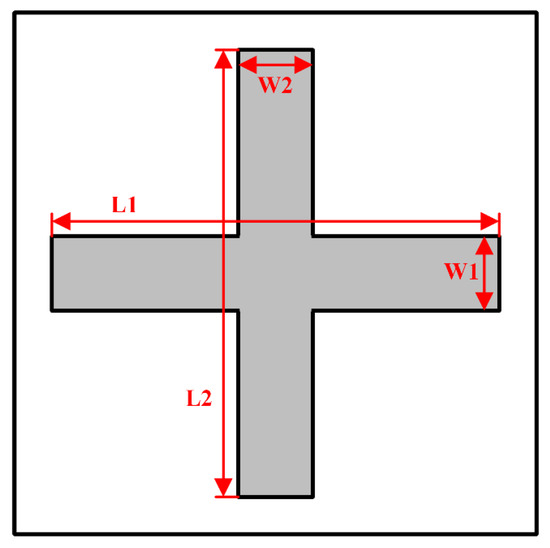
Figure 27.
Feature dimension schematic.
The thermoelastic–plastic method was utilized to determine the temperature, stress, strain, and deformation of +-shaped, thin-walled feature partitions with varying L1 lengths. After 500 s of cooling at the end of the deposition, the resultant contour diagrams of the +-shaped, thin-walled feature partitions with an L1 length of 60 mm are presented in Figure 28. The contour diagrams depicting the distribution of strains in the +-shaped, thin-walled feature partitions of other sizes are illustrated in Figure 29.
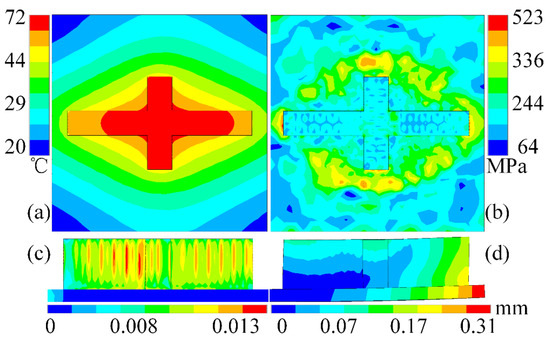
Figure 28.
Resulting contour for L1 length of 60 mm: (a) temperature field, (b) stress field, (c) strain field, (d) deformation field.
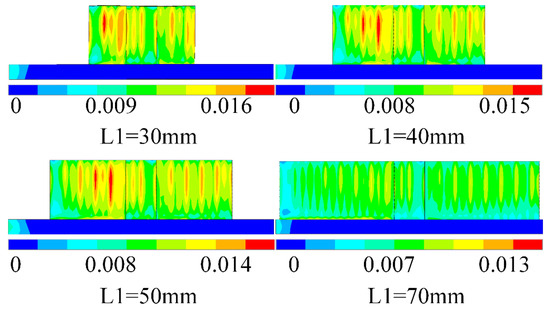
Figure 29.
Strain distribution contours with different lengths of L1.
The inherent strain values in the X, Y, and Z directions of the +-shaped, thin-walled feature partitions with different L1 lengths were obtained using the strain extraction method. The strain values of the first four layers were extracted individually, while the last twelve layers were combined and extracted. The curve depicting the variation of strain values with respect to L1 length is shown in Figure 30.
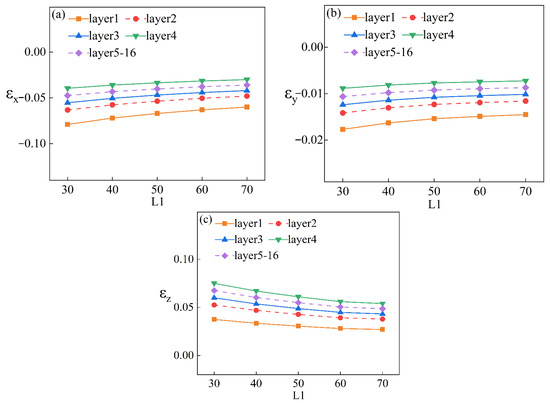
Figure 30.
Variation curves of strain values with L1 length for each layer: (a) X direction, (b) Y direction, (c) Z direction.
The strain curve demonstrates that in the short-edge deposition along the X direction, the trend of strain values was similar for each layer. The X direction strain value and Y direction strain value exhibited contraction strain, while the Z direction experienced tensile strain. The magnitude of the X-direction strain value was significantly larger than that of the Y-direction strain value. Moreover, the total strain value across all three directions decreased as the L1 length increased and, as the distance increased, the strain value tended to stabilize.
To explore the effect of L2 size on strain value, W1, W2, and L1 remained unchanged while L2 was altered. The wall lengths of L2 of the +-shaped features were set as 30 mm, 40 mm, 50 mm, 60 mm, and 70 mm, respectively. Through thermoelastic–plastic method calculations, the temperature, stress, strain, and deformation fields of the +-shaped, thin-walled feature partitions with different L2 lengths were obtained. Contour diagrams illustrating the resultant distribution of the +-shaped, thin-walled feature partitions with an L2 length of 60 mm after 500 s of cooling at the end of deposition are provided in Figure 31. The strain distribution contour diagrams of the +-shaped, thin-walled feature partitions with other sizes are shown in Figure 32.
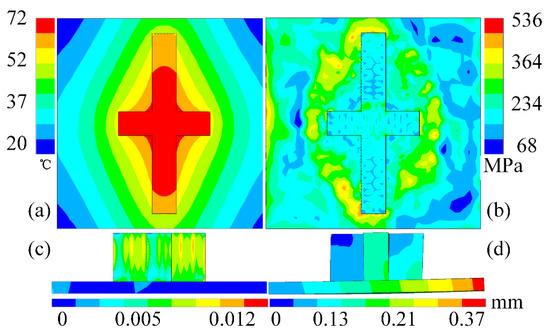
Figure 31.
Resulting contour for L2 length of 60 mm: (a) temperature field, (b) stress field, (c) strain field, (d) deformation field.
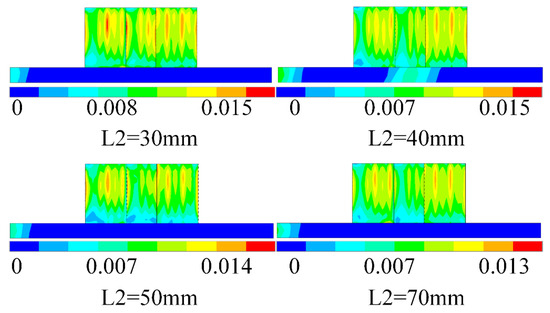
Figure 32.
Strain distribution contour for each size of L2.
The inherent strain values in the X, Y, and Z directions of the +-shaped, thin-walled feature partitions with different L2 lengths were extracted using the strain extraction method. The strain values of the first four layers were extracted separately, while the last twelve layers were combined and extracted to obtain the strain value variation curve with respect to L2 length, as shown in Figure 33.
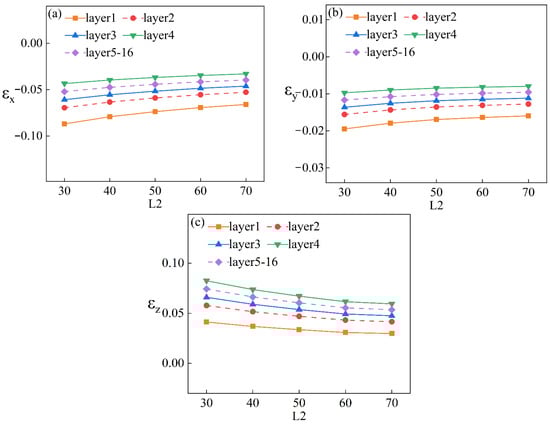
Figure 33.
Variation curves of strain values with L2 length for each layer; (a) X direction, (b) Y direction, (c) Z direction.
The strain curves indicate that during short-edge deposition along the X direction, the trend of the strain value in each layer was similar. The X and Y directions exhibited contraction strain, while the Z direction exhibited tensile strain. Moreover, the absolute value of the X direction strain was much larger than that of the Y direction strain. Additionally, the total value of the strain for all three directions decreased with increasing L2 length and, with greater distance, the strain value tended to stabilize.
L1, L2, and W2 were kept constant while only W1 was varied to investigate the impact of W1 size on strain values. The width of a wall of the +-shaped feature, W1, was set at 8 mm, 10 mm, 12 mm, 14 mm, and 16 mm, respectively. Using the thermoelastic–plastic method, the temperature, stress, strain, and deformation fields of the +-shaped, thin-walled feature partitions with different W1 widths were calculated. After 500 s of cooling at the end of the deposition, the resulting contour diagrams of the +-shaped, thin-walled feature partitions with a width W1 of 14 mm are displayed in Figure 34. The strain distribution contour diagrams of the +-shaped, thin-walled feature partitions with other sizes are presented in Figure 35.
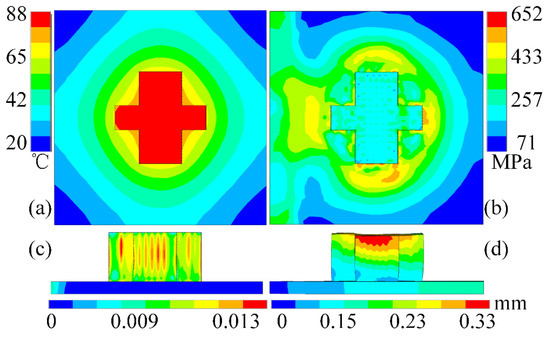
Figure 34.
Resulting contour for W1 length of 14 mm: (a) temperature field, (b) stress field, (c) strain field, (d) deformation field.
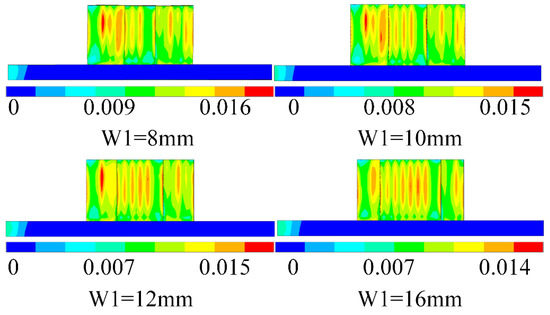
Figure 35.
Strain distribution contour for each dimension of W1.
The inherent strain values in the X, Y, and Z directions of the +-shaped, thin-walled feature partitions with different W1 widths were obtained through the previously mentioned strain extraction method. The strain values of the first four layers were extracted individually, while the last twelve layers were combined and extracted to generate the strain value variation curve with respect to W1 width, as illustrated in Figure 36.
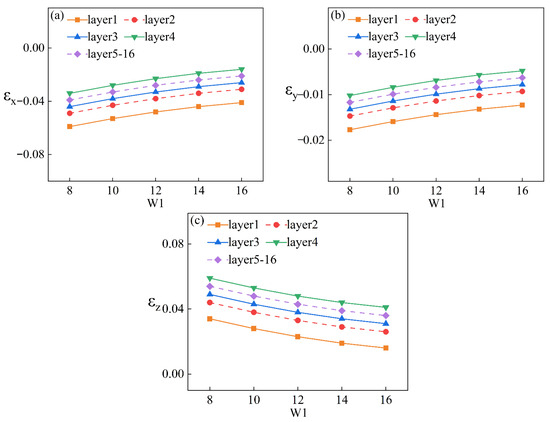
Figure 36.
Variation curves of strain values with W1 width for each layer: (a) X direction, (b) Y direction, (c) Z direction.
Analysis of the strain curve reveals that during short-edge deposition along the X direction, the trend of the strain value in each layer was similar. The X and Y directions exhibited contraction strain, while the Z direction demonstrated tensile strain. Moreover, the absolute value of the strain value in the X direction was significantly larger than that in the Y direction. Overall, the total strain value in all three directions decreased with increasing W1 width, and, with further increases in width, the strain value tended to stabilize.
Similarly, L1, L2, and W1 remained constant, while W2 was varied to explore the influence of W2 size on strain values. The width W2 of a wall of the +-shaped feature was set at 8 mm, 10 mm, 12 mm, 14 mm, and 16 mm, respectively. By utilizing the thermoelastic–plastic method, the temperature, stress, strain, and deformation fields of the +-shaped, thin-walled feature partitions with different W2 widths were calculated. The resultant contour diagrams of the +-shaped, thin-walled feature partitions with a width W2 of 14 mm after 500 s of cooling at the end of deposition are illustrated in Figure 37. The strain distribution contour diagrams of the +-shaped, thin-walled feature partitions with other sizes are shown in Figure 38.

Figure 37.
Resulting contour for W2 length of 14 mm: (a) temperature field, (b) stress field, (c) strain field, (d) deformation field.
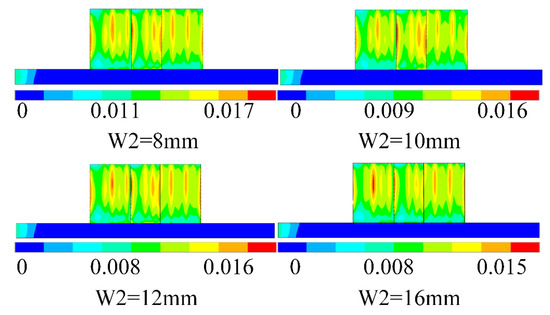
Figure 38.
Strain distribution contour for each dimension of W2.
The inherent strain values in the X, Y, and Z directions of the +-shaped, thin-walled feature partitions with different W2 widths were obtained using the strain extraction method mentioned above. The strain values of the first four layers were extracted individually, while the last twelve layers were combined and extracted to generate the strain value variation curve with respect to W2 width, as depicted in Figure 39.
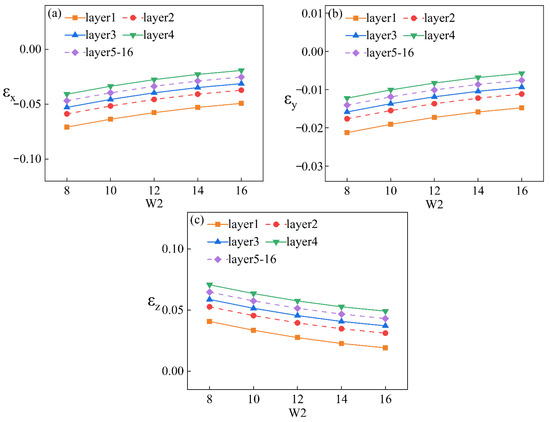
Figure 39.
Variation curves of strain values with W2 width for each layer: (a) X direction, (b) Y direction, (c) Z direction.
The strain curves demonstrate that during short-edge deposition along the X direction, the trend of the strain value in each layer was similar. The X and Y directions exhibited contraction strain, while the Z direction demonstrated tensile strain. Additionally, the absolute value of the strain value in the X direction was significantly larger than that in the Y direction. Overall, the total strain value in all three directions decreased with increasing W2 width, and, with further increases in width, the strain value tended to stabilize.
5.4. Characterization angle Impact Study
In addition to differences in partition sizes, there were variations in feature angles among different components. To investigate the effect of feature angle on the average inherent strain of feature partitions, this study established a feature partition model as depicted in Figure 40. The feature angle α of the + shape was set to 37°, 63°, 90°, 117°, and 143°, respectively.
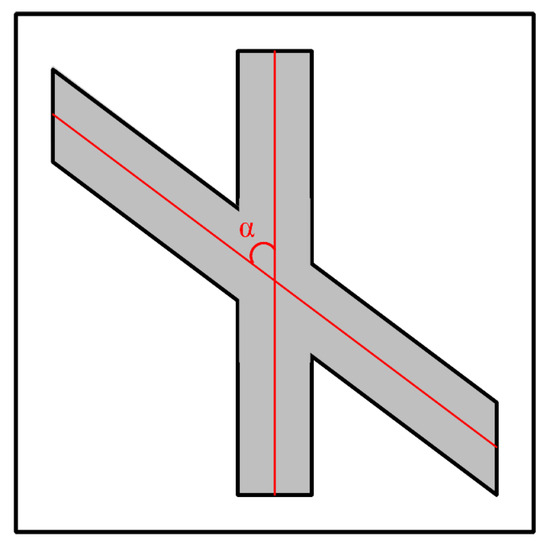
Figure 40.
Feature angle dimension schematic.
Using the thermoelastic–plastic method, calculations were conducted to obtain the temperature, stress, strain, and deformation of the +-shaped, thin-walled feature partition with different feature angles. After 500 s of cooling at the end of the deposition, the resultant contour diagram of the +-shaped, thin-walled feature partition for a feature angle α of 63° is presented in Figure 41. The strain distribution contour diagrams of the +-shaped, thin-walled feature partitions with other sizes are displayed in Figure 42.
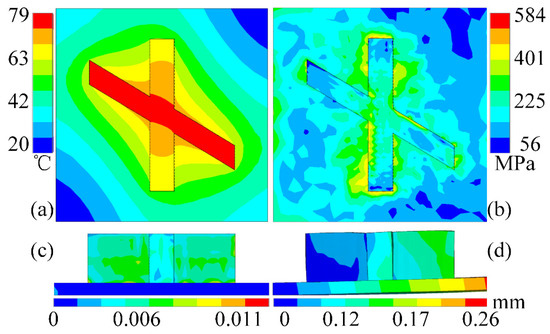
Figure 41.
Resulting contour for α angle of 63°: (a) temperature field, (b) stress field, (c) strain field, (d) deformation field.
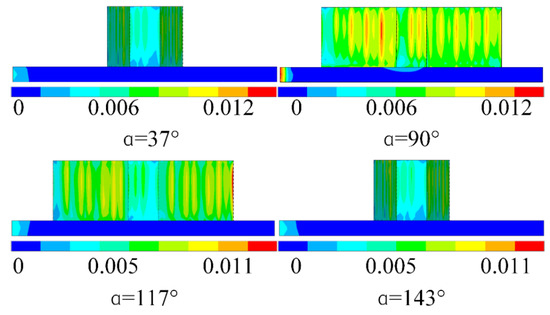
Figure 42.
Feature angle strain distribution contour.
The inherent strain values in the X, Y, and Z directions of the +-shaped, thin-walled feature partitions with different feature angles were obtained using the strain extraction method. The strain values of the first four layers were extracted individually, while the last twelve layers were combined and extracted to plot the strain value change curve with respect to the feature angle, as illustrated in Figure 43.
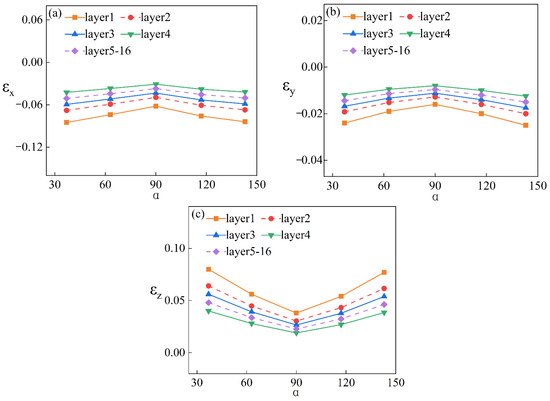
Figure 43.
Variation curves of strain values with α angle for each layer: (a) X direction, (b) Y direction, (c) Z direction.
Analysis of the strain curve reveals that the trend of strain values in each layer was similar: the X and Y directions exhibited contraction strain, while the Z direction demonstrated tensile strain. As the angle increased, the absolute values of the strain values in all three directions decreased and then increased.
The study presented in this manuscript allowed for the rapid prediction of deformation in large components using an inherent strain method based on feature partitioning. However, the method in this manuscript did not consider the effect of the scanning strategy on the results; thus, the results obtained were slightly larger than the actual results. In addition, this paper only discusses the effect of length, width, and angle on strain values and does not consider the deformation prediction of curved components. Further research is needed on the deformation prediction of curved components.
6. Deformation Prediction for Large and Complex Frame Beam Components
To demonstrate the advantages of feature partitioning and the inherent strain method in predicting deformation for large additive components manufactured through laser deposition, titanium frame beams with dimensions of 500 mm × 500 mm × 12 mm were investigated in this study. The finite element model of the titanium alloy frame beam is shown in Figure 44. The inherent strain method and the traditional thermoelastic–plastic method were employed to simulate the stress and deformation of the component during the LDM process. The feature partitioning of the typical frame beam is shown in Figure 45. The numerical simulation adopted the same method and material parameters as outlined in Section 2.2; the mesh size was set at 2 mm × 2 mm × 1 mm, and a one-sided fixed constraint was imposed during the simulation.
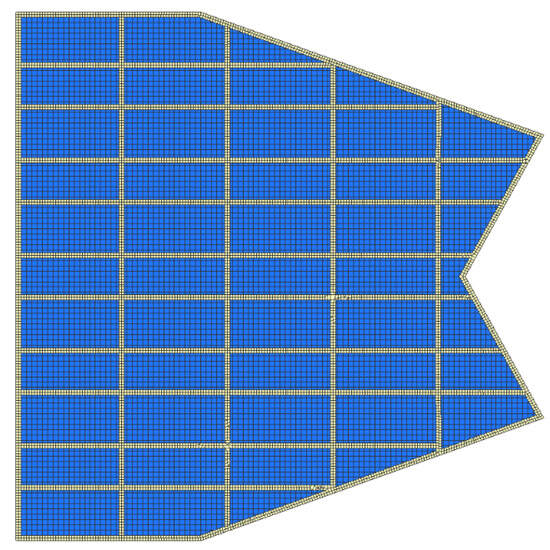
Figure 44.
Finite element model of typical frame beam.
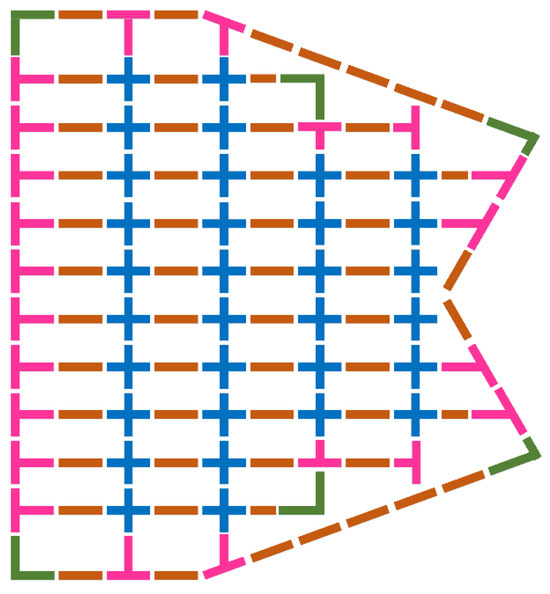
Figure 45.
Feature partitioning of typical frame beam.
The stress field and deformation field of the titanium alloy frame beam were obtained using both the inherent strain method and the thermoelastic–plastic method. The resultant contour diagrams of the titanium alloy frame beam after 500 s of cooling at the end of the deposition are depicted in Figure 46 and Figure 47. The stress contour diagrams indicate that both methods predicted the same distribution pattern of residual stress for the component, including the region of maximum stress occurrence and the magnitude level of equivalent stress.
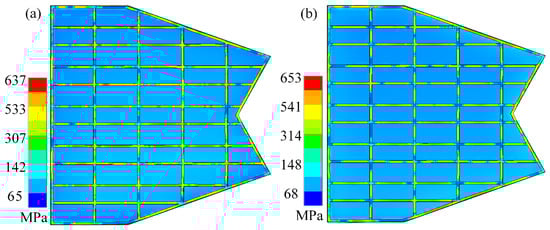
Figure 46.
Comparison of stress contour diagrams of titanium frame beams: (a) thermoelastic–plastic method and (b) inherent strain method.
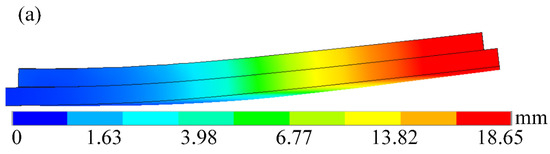
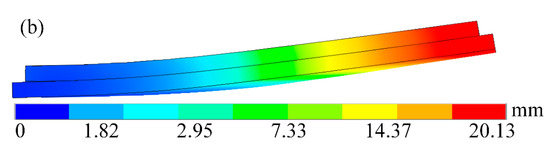
Figure 47.
Comparison of titanium alloy frame beam deformation contour: (a) thermoelastic–plastic method and (b) inherent strain method.
From Figure 47 and Figure 48, it is evident that the inherent strain method accurately predicted the deformation of the titanium alloy frame beam, with a maximum deformation error of 7.94%. In terms of computational efficiency, the inherent strain method required only 23.22 h of computation time, whereas the traditional method necessitated 632.78 h. The inherent strain method based on feature partitioning significantly enhances deformation prediction efficiency. It provides a new method for rapidly predicting the deformation of large additive components.
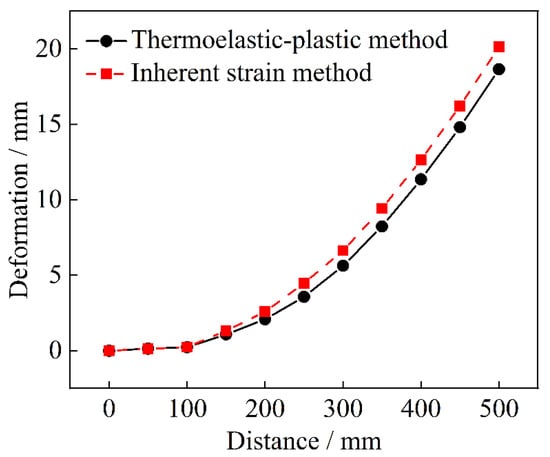
Figure 48.
Substrate deformation curves for different prediction methods.
7. Conclusions
This manuscript proposed a rapid deformation prediction method based on feature partitioning and the inherent strain method. For large-scale, complex metal components, a feature partitioning method was established based on typical geometric features, including the − shape, + shape, T shape, and L shape. This method facilitated the portability of additive manufacturing partitioning process files. Considering the layer-by-layer stacking and shaping characteristics of LDM, the traditional inherent strain method was adapted. By studying the influence of different strain extraction methods on inherent strain, it was determined that the optimal extraction methods were two horizontal and two vertical methods. The accuracy of the proposed method was verified through validation experiments. Additionally, this study investigated the impact of factors such as mesh size, equivalent value layer, and feature size on the inherent strain value of the feature partition. The results demonstrate that mesh size has a minimal effect on inherent strain, with larger mesh sizes significantly improving the computational efficiency of the strain field. Furthermore, during the LDM process, the average inherent strain of the first four layers varied significantly, while subsequent layers showed less variation and tended towards constancy. Therefore, to efficiently predict deformation, the inherent strain was applied layer by layer for the first four layers and equivalently for the remaining layers. Investigation of the effect of feature size on inherent strain reveals that inherent strain values in the x, y, and z directions all increased with feature length and feature width. As the feature angle increased, the absolute values of the inherent strain values in all three directions decreased and then increased. Finally, the deformation prediction of large-scale, complex metal components was conducted using this method and the traditional thermoelastic–plastic method. The results demonstrate that the maximum deformation positions predicted by the different methods were the same. The deformation values were 18.65 mm and 20.13 mm, respectively. The deformation deviation was only 7.94%. The deformation prediction by the method proposed in this paper only took 23.22 h, whereas the traditional thermoelastic–plastic method required 632.78 h. The computational efficiency was improved by 27.25 times. The research results provide a novel method to predict the deformation of large-scale and complex metal components.
Author Contributions
B.L.: Conceptualization, Funding acquisition, Methodology, Software, Supervision, Writing—review and editing. E.G.: Conceptualization, Data curation, Methodology, Software, Validation, Writing—original draft. J.Y.: Resources, Formal analysis, Investigation, Supervision. X.L.: Resources, Formal analysis, Project administration, Investigation. G.Y.: Funding acquisition, Methodology, Supervision, Writing—review and editing. Q.L.: Data curation, Software, Validation, Writing—review and editing. All authors have read and agreed to the published version of the manuscript.
Funding
This work was supported by the National Natural Science Foundation of China (52105386), the Open Fund for National Defense Key Laboratory (SHSYS202203), the Aviation Science Foundation Program (2023M049054001), the Department of Education of Liaoning Province (LJKZ0198), and the National Key Research and Development Program of China (grant nos. 2022YFB4602202 and 2022YFE0122600).
Data Availability Statement
Data sharing is not applicable to this article as no new data were created or analyzed in this study.
Acknowledgments
The author would like to acknowledge the editor and reviewers for their insightful comments, which have improved the quality of this publication. All authors have consented to the acknowledgement.
Conflicts of Interest
Author Jun Yin and Xiaodan Li were employed by the company Shenyang Aircraft Corporation. The remaining authors declare that the research was conducted in the absence of any commercial or financial relationships that could be construed as a potential conflict of interest. The Shenyang Aircraft Corporation had no role in the design of the study; in the collection, analyses, or interpretation of data; in the writing of the manuscript, or in the decision to publish the results.
References
- Hartmann, S.; Murua, O.; Arrizubieta, J.I.; Lamikiz, A.; Mayr, P. Digital Twin of the Laser-DED Process Based on a Multiscale Approach. Simul. Model. Pract. Theory 2024, 132, 102881. [Google Scholar] [CrossRef]
- Armstrong, M.; Mehrabi, H.; Naveed, N. An Overview of Modern Metal Additive Manufacturing Technology. J. Manuf. Processes 2022, 84, 1001–1029. [Google Scholar] [CrossRef]
- Mirazimzadeh, S.E.; Mohajernia, B.; Pazireh, S.; Urbanic, J.; Jianu, O. Investigation of Residual Stresses of Multi-Layer Multi-Track Components Built by Directed Energy Deposition: Experimental, Numerical, and Time-Series Machine-Learning Studies. Int. J. Adv. Manuf. Technol. 2024, 130, 329–351. [Google Scholar] [CrossRef]
- Farias, F.W.C.; dos Santos, T.J.G.; Oliveira, J.P. Directed Energy Deposition + Mechanical Interlayer Deformation Additive Manufacturing: A State-of-the-Art Literature Review. Int. J. Adv. Manuf. Technol. 2024, 131, 999–1038. [Google Scholar] [CrossRef]
- Wei, H.L.; Liu, F.Q.; Wei, L.; Liu, T.T.; Liao, W.H. Multiscale and Multiphysics Explorations of the Transient Deposition Processes and Additive Characteristics during Laser 3D Printing. J. Mater. Sci. Technol. 2021, 77, 196–208. [Google Scholar] [CrossRef]
- Strantza, M.; Ganeriwala, R.K.; Clausen, B.; Phan, T.Q.; Levine, L.E.; Pagan, D.; King, W.E.; Hodge, N.E.; Brown, D.W. Coupled Experimental and Computational Study of Residual Stresses in Additively Manufactured Ti-6Al-4V Components. Mater. Lett. 2018, 231, 221–224. [Google Scholar] [CrossRef]
- Mukherjee, T.; Zhang, W.; DebRoy, T. An Improved Prediction of Residual Stresses and Distortion in Additive Manufacturing. Comput. Mater. Sci. 2017, 126, 360–372. [Google Scholar] [CrossRef]
- Barile, C.; Carone, S.; Casavola, C.; Pappalettera, G. Implementation of Gaussian Process Regression to Strain Data in Residual Stress Measurements by Hole Drilling. Measurement 2023, 211, 112590. [Google Scholar] [CrossRef]
- Shen, C.; Ma, Y.; Reid, M.; Pan, Z.; Hua, X.; Cuiuri, D.; Paradowska, A.; Wang, L.; Li, H. Neutron Diffraction Residual Stress Determinations in Titanium Aluminide Component Fabricated Using the Twin Wire-Arc Additive Manufacturing. J. Manuf. Processes 2022, 74, 141–150. [Google Scholar] [CrossRef]
- Zhou, S.; Wu, H.; Li, X.; Li, B.; Wang, Y.; Guo, X.; Yang, G. Control of Residual Stress in Inter-Layer Hammering Hybrid Arc-Based Directed Energy Deposition Manufacturing of Cross-Structure Based on Finite Element Method. Mater. Des. 2024, 238, 112721. [Google Scholar] [CrossRef]
- Zhou, S.; Wu, H.; Li, B.; Guo, X.; Yang, G. Modelling and Researching the Evolution of Stress during Arc-Directed Energy Deposition (ADED) Hybrid Inter-Layer Hammering. Virtual Phys. Prototyp. 2024, 19, e2319435. [Google Scholar] [CrossRef]
- Zhou, S.; Zhang, J.; Yang, G.; Wang, Y.; Li, B.; An, D.; Zheng, J.; Wei, W. Microstructure Evolution and Fracture Behavior of Ti–6Al–4V Fabricated by WAAM-LDM Additive Manufacturing. J. Mater. Res. Technol. 2024, 28, 347–362. [Google Scholar] [CrossRef]
- Denlinger, E.R.; Irwin, J.; Michaleris, P. Thermomechanical Modeling of Additive Manufacturing Large Parts. J. Manuf. Sci. Eng. 2014, 136, 061007. [Google Scholar] [CrossRef]
- Lundbäck, A.; Lindgren, L.-E. Modelling of Metal Deposition. Finite Elem. Anal. Des. 2011, 47, 1169–1177. [Google Scholar] [CrossRef]
- Polyzos, E.; Pulju, H.; Mäckel, P.; Hinderdael, M.; Ertveldt, J.; Van Hemelrijck, D.; Pyl, L. Measuring and Predicting the Effects of Residual Stresses from Full-Field Data in Laser-Directed Energy Deposition. Materials 2023, 16, 1444. [Google Scholar] [CrossRef]
- Dong, W.; Jimenez, X.A.; To, A.C. Temperature-Dependent Modified Inherent Strain Method for Predicting Residual Stress and Distortion of Ti6Al4V Walls Manufactured by Wire-Arc Directed Energy Deposition. Addit. Manuf. 2023, 62, 103386. [Google Scholar] [CrossRef]
- Yuan, M.G.; Ueda, Y. Prediction of Residual Stresses in Welded T- and I-Joints Using Inherent Strains. J. Eng. Mater. Technol. 1996, 118, 229–234. [Google Scholar] [CrossRef]
- Deng, D.; Murakawa, H.; Liang, W. Numerical Simulation of Welding Distortion in Large Structures. Comput. Methods Appl. Mech. Eng. 2007, 196, 4613–4627. [Google Scholar] [CrossRef]
- Liang, X.; Chen, Q.; Cheng, L.; Hayduke, D.; To, A.C. Modified Inherent Strain Method for Efficient Prediction of Residual Deformation in Direct Metal Laser Sintered Components. Comput. Mech. 2019, 64, 1719–1733. [Google Scholar] [CrossRef]
- Liang, X.; Cheng, L.; Chen, Q.; Yang, Q.; To, A.C. A Modified Method for Estimating Inherent Strains from Detailed Process Simulation for Fast Residual Distortion Prediction of Single-Walled Structures Fabricated by Directed Energy Deposition. Addit. Manuf. 2018, 23, 471–486. [Google Scholar] [CrossRef]
- Liang, X.; Dong, W.; Hinnebusch, S.; Chen, Q.; Tran, H.T.; Lemon, J.; Cheng, L.; Zhou, Z.; Hayduke, D.; To, A.C. Inherent Strain Homogenization for Fast Residual Deformation Simulation of Thin-Walled Lattice Support Structures Built by Laser Powder Bed Fusion Additive Manufacturing. Addit. Manuf. 2020, 32, 101091. [Google Scholar] [CrossRef]
- Chen, Q.; Liang, X.; Hayduke, D.; Liu, J.; Cheng, L.; Oskin, J.; Whitmore, R.; To, A.C. An Inherent Strain Based Multiscale Modeling Framework for Simulating Part-Scale Residual Deformation for Direct Metal Laser Sintering. Addit. Manuf. 2019, 28, 406–418. [Google Scholar] [CrossRef]
- Tran, H.T.; Liang, X.; To, A.C. Efficient Prediction of Cracking at Solid-Lattice Support Interface during Laser Powder Bed Fusion via Global-Local J-Integral Analysis Based on Modified Inherent Strain Method and Lattice Support Homogenization. Addit. Manuf. 2020, 36, 101590. [Google Scholar] [CrossRef]
- Costello, S.C.A.; Cunningham, C.R.; Xu, F.; Shokrani, A.; Dhokia, V.; Newman, S.T. The State-of-the-Art of Wire Arc Directed Energy Deposition (WA-DED) as an Additive Manufacturing Process for Large Metallic Component Manufacture. Int. J. Comput. Integr. Manuf. 2023, 36, 469–510. [Google Scholar] [CrossRef]
- Yang, Q.; Zhang, P.; Cheng, L.; Min, Z.; Chyu, M.; To, A.C. Finite Element Modeling and Validation of Thermomechanical Behavior of Ti-6Al-4V in Directed Energy Deposition Additive Manufacturing. Addit. Manuf. 2016, 12, 169–177. [Google Scholar] [CrossRef]
- Foroozmehr, A.; Badrossamay, M.; Foroozmehr, E.; Golabi, S. Finite Element Simulation of Selective Laser Melting Process Considering Optical Penetration Depth of Laser in Powder Bed. Mater. Des. 2016, 89, 255–263. [Google Scholar] [CrossRef]
- Cao, Y.; Lin, X.; Kang, N.; Ma, L.; Wei, L.; Zheng, M.; Yu, J.; Peng, D.; Huang, W. A Novel High-Efficient Finite Element Analysis Method of Powder Bed Fusion Additive Manufacturing. Addit. Manuf. 2021, 46, 102187. [Google Scholar] [CrossRef]
- Yue, K.; Liu, J.; Zhang, H.; Yu, H.; Song, Y.; Hu, Q.; Wang, Q.; Yang, R. Precipitates and Alloying Elements Distribution in near α Titanium Alloy Ti65. J. Mater. Sci. Technol. 2020, 36, 91–96. [Google Scholar] [CrossRef]
Disclaimer/Publisher’s Note: The statements, opinions and data contained in all publications are solely those of the individual author(s) and contributor(s) and not of MDPI and/or the editor(s). MDPI and/or the editor(s) disclaim responsibility for any injury to people or property resulting from any ideas, methods, instructions or products referred to in the content. |
© 2024 by the authors. Licensee MDPI, Basel, Switzerland. This article is an open access article distributed under the terms and conditions of the Creative Commons Attribution (CC BY) license (https://creativecommons.org/licenses/by/4.0/).