Abstract
A presence of tumor zones within biological tissues can be defined during the analysis of the skin surface temperature. This research is devoted to mathematical simulation of the time-dependent bio-heat transfer in tissues under a tumor influence. The one-dimensional partial differential equation of the Pennes model has been used for description of bio-heat transfer within the biological tissue with five layers, namely, epidermis, papillary dermis, reticular dermis, subcutaneous adipose tissue, and a muscle layer. The formulated boundary-value problem has been solved using the developed in-house computational code based on the finite difference schemes. The developed numerical algorithm has been verified using analytical and numerical solutions of other authors for the simpler test problem. As a result of this study, the temperature distributions have been obtained for the tissue in the presence of tumor zones in different layers of the skin. The influence of five layers of skin on the temperature distribution has been investigated, and the dependence for the skin surface temperature on the tumor zone location has been obtained. The obtained outcomes illustrate the effectiveness of this technique of cancer diagnosis and identify the optimal parameters for its application. Thus, this work represents an important step in the development of cancer diagnosis methods using thermography. The results obtained can be used to improve the accuracy of diagnosis and develop new treatment methods.
MSC:
80A19
1. Introduction
Nowadays, cancer is a leading cause of death in the world; it was the reason for about 10 million deaths in 2020. Therefore, a development of different techniques for early diagnosis of cancer is very important. The present paper deals with an application of computational thermography to define a location of tumor zones within the tissues.
The mathematical study of the thermal interaction process between the vascular network and biological tissues dates back to the model of the Pennes bio-heat equation, which was proposed in 1948 by Harry H. Pennes, who was a scientist at the College of Physicians and Surgeons of Columbia University [1]. This equation was the first quantitative relationship that describes the heat transport in human tissues and includes the influence of blood motion on tissue thermal nature on a continuous basis. The Pennes approach was originally developed to describe the heat transport in the human forearm, but owing to its simplicity, it has found applications in different biological research papers. Thus, Deng and Liu [2] obtained an analytical solution of the Pennes model using Green’s functions. Some analytical solutions of the bio-heat transport tasks with spatial or transient warming on the skin surface or within the biological units in a closed region have been obtained. Patil and Maniyeri [3] have developed 1D, 2D, and 3D computational approaches to analyze the bio-thermal transport problems based on the existing analytical solution using the finite difference method and examined the effects of size, localization, and multiple cysts on the surface temperature of the breast. He et al. [4] have developed a solution scheme for a three-dimensional transient bio-heat transfer model based on the implicit variable-direction finite difference method to obtain the temperature profiles for irregular tissue geometries. Kumar and Srivastava [5] have developed an analytical solution of the bio-thermal transport equation with dual-phase delay based on the finite integral transformation. Shih et al. [6] have obtained an analytical solution formed on the Laplace transform technique and initial temperature field has been studied. Ng and Chua [7,8] have defined the numerical solutions of the Pennes model employing the finite difference and finite element techniques to analyze the skin surface condition.
Among all types of skin cancer, melanoma rapidly metastasizes, spreading to soft tissues such as lungs and liver and causing the most deaths [9,10]. As a result, it is important to define and describe the condition of melanoma. Chen et al. [11] have identified the relationship between the thermal characteristics of a tumor and the surface temperature of the skin using dynamic thermography and a deep learning model. The used technique for the inverse bio-thermal conduction problem determines the overall thermal properties of the tumor. A computational tissue approach with various layers, such as epidermis, dermis, hypodermis, muscle tissue, and tumor, calculates surface temperatures with different thermal properties of the tumor. In addition, the metabolic thermal source and blood perfusion strength have been considered as functions of temperature using the van Hoff effect.
Most studies are related to solving the inverse problems, but since inverse problems are mathematically ill-posed, they require special approximation techniques.
Gonzalez-Hernandez et al. [12] have proposed a methodology using a digital breast model for a specific patient to detect and localize malignant tumors in the breast. Partridge and Wrobel [13] have applied the dual reciprocity technique in conjunction with a genetic algorithm to determine the length and position of a tumor using surface temperature. Bhowmik and Repaka [14] have evaluated the growth characteristics and thermal properties of melanoma using the heat response of the skin surface with a genetic algorithm to develop an efficient non-invasive method for characterizing the subsurface features of skin cancer. Das et al. have evaluated the position, length, and blood perfusion in 1D and 2D breast approaches employing the direct search technique [15], genetic approach [16], and curve fitting method [17].
This brief literature analysis shows the necessity to study the bio-heat transport in biological tissues under an influence of tumor zones. Moreover, a development of a passive diagnosis of tumor presence using the skin surface temperature is very important for early diagnosis of cancer. The aim of this research is a computational analysis of bio-heat transfer in tissues under an influence of five skin layers in the presence of tumor zones. Effects of tumor size and location have been studied. In this research the skin surface temperature in dependence on the tumor zone size and location has been examined in detail. The novelty of this research is defined by more detailed analysis of temperature behavior within the tissues under an influence of five skin layers with character thermal properties. Moreover, for the first time, an application of mathematical simulation allowed obtaining an interesting and useful map, illustrating a dependence of the skin surface temperature on the position and size of the tumor zone.
2. Mathematical Model and Numerical Technique
Bio-heat transport in biological tissues (see Figure 1) can be described using the Pennes bio-heat transfer equation [1], taking into account the effects of bio-thermal diffusion, blood perfusion, and volumetric thermal generation owing to metabolism. This control equation in the one-dimensional case can be formulated as follows:
where ρ is density, c is heat capacity, k is heat conductivity, T is the temperature, t is time, ωb is the blood perfusion rate, Ta is constant baseline physiological temperature of the arterial blood prescribed as 37 °C, Qm is the volumetric thermal; production strength owing to metabolism, and m is the number of the skin layers, namely, epidermis (m = 1), papillary dermis (m = 2), reticular dermis (m = 3), subcutaneous adipose tissue (m = 4), muscle layer (m = 5), and tumor zone (m = 0).
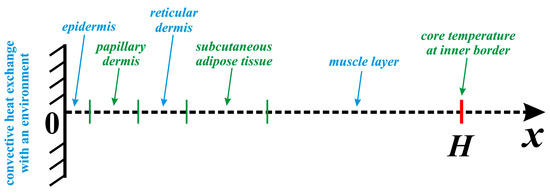
Figure 1.
Considered biological system.
The volumetric thermal production strength owing to metabolism and the blood perfusion rate can be described as functions of temperature as follows:
for the skin layers qm = qb = 2.0, while for the tumor zones qm = qb = 1.1 [11].
The considered domain of interest is the biological tissue with five levels shown in Figure 1. At the external border (skin surface), for x = 0, one can find a convective heat exchange with an environment taking into account Newtonian cooling condition, while for the inner border (core zone), for x = H, one can find a constant temperature.
Initial and boundary conditions have been formulated, taking into account the considered physical model under an interaction with ambient medium at x = 0 and inner core at x = H:
where h is the heat transfer coefficient at outer border, Te is the outside temperature, and km and km+1 are the thermal conductivities of various layers. The thermophysical properties of the considered media are shown in Table 1.

Table 1.
Geometric and thermal properties of media [11].
The formulated boundary-value problem, consisting of the partial differential governing Equation (1) and initial and boundary conditions (2), has been worked out by the finite difference schemes with central differences for the bio-thermal diffusion term and implicit Euler approximation for the time derivative [18]. The obtained set of linear equations has been worked out using the Thomas technique. The schematic of the problem, including the computational domain and boundary conditions, is shown in Figure 2.
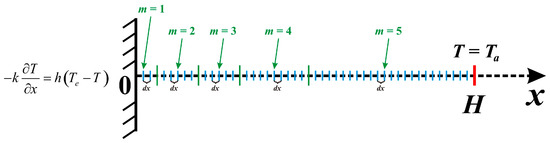
Figure 2.
Schematic of the problem with mesh and boundary conditions.
The discretization form of the governing equation was considered as follows:
where dt is the time step and dx is the spatial mesh step.
It should be noted that the non-linear terms in Equation (4) have been discretized using the temperature from the previous time level. Such an approach allows excluding the iteration process and reducing the computational time. Taking into account these used difference schemes, the accuracy of the discretization is .
An approximation of the boundary conditions has been performed using the difference schemes of the second order of accuracy. Thus, for boundary condition of the third kind at x = 0 (see Equation (3)) the following discretization has been applied:
where is the temperature at the skin surface, is the temperature at the first node within the tissue at the distance of one spatial mesh step from the skin surface, and is the temperature at the second node within the tissue at the distance of two spatial mesh steps from the skin surface.
It should be noted that the dependence between and for definition of the initial sweep parameters in the Thomas algorithm has been obtained using Equation (4) for i = 1.
Boundary conditions of the fourth kind (see Equation (3)) have been used for the definition of sweep parameters at the interface between various layers using the difference schemes of the second order of accuracy. For example, the following discretization scheme has been used:
where is the number of the interface node between layers m and m + 1. Temperatures and can be found using the correlation with the defined sweep parameters for nodes and , while for definition of the sweep parameters at , the correlation between temperatures and can be found using Equation (4) for .
The described numerical technique has been validated using the mesh sensitivity analysis for dx = 10−7 m, 10−6 m, and 10−5 m. Figure 3 demonstrates the temperature profiles for different spatial mesh steps, where the grid step of dx = 10−6 m has been used for further analysis.
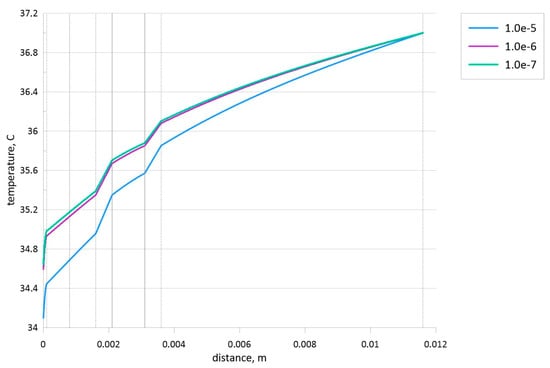
Figure 3.
Effect of mesh parameters when the tumor zone with a size of 1 mm is located in the central part of subcutaneous adipose tissue.
Moreover, the developed in-house numerical algorithm has been validated employing the computational and analytical solutions for the following steady-state boundary-value problem [2,3]. The steady Pennes bio-heat transfer Equation (7) with Robin boundary condition (8) and Dirichlet boundary condition (9) has been solved using the developed computational code:
Figure 4 shows a comparison of the temperature profiles obtained using the developed computational code and analytical solution [2] for this mentioned boundary-value problem.
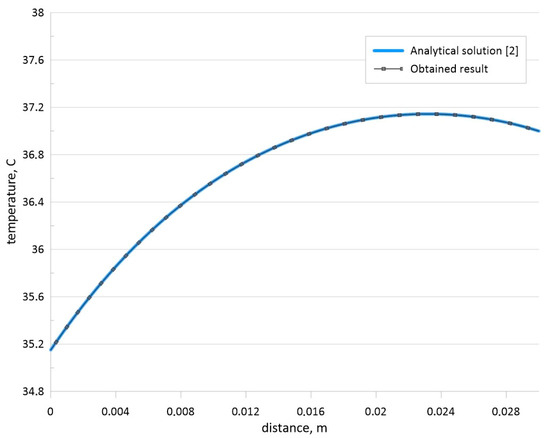
Figure 4.
Comparison of temperature profiles for the steady-state problem [2].
The obtained results shown in Figure 4 illustrate that the developed code can be used for the solution of the considered steady-state problems. Moreover, the unsteady problem for the Pennes bio-heat transfer equation has been solved analytically in [2] and numerically in [3]. Therefore, a comparison for the unsteady problem has been also performed. Time-dependent temperature profiles have been compared with the analytical solution [2] and numerical data of other authors [3] for H = 0.03 m, Ta = 37 °C, ρb = 1000 kg/m3, cb = 4200 J/(kg·K), k = 0.5 W/(m·K), ωb = 0.0005, Q = 3380 W/m3, h = 100 W/(m2·K), and Te = 25 °C. Figure 5 demonstrates comparison of temperature profiles for developed numerical code with analytical data [2] and numerical data [3] for various time moments. This comparison illustrates a good agreement and the developed computational code has been used for numerical simulation of the formulated boundary-value problem shown in Equations (1)–(3) for Figure 1.
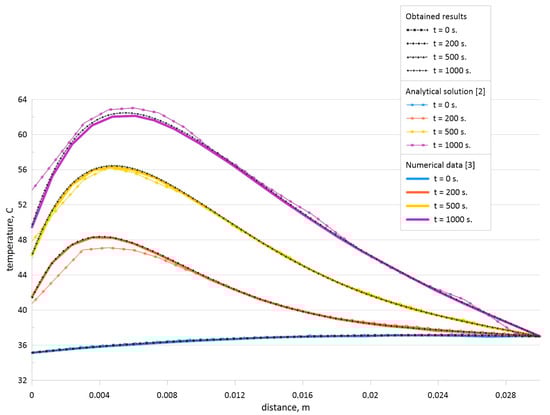
Figure 5.
Comparison of temperature profiles for the model problem [2,3].
3. Results and Discussion
Computations have been performed for different tumor zone locations and various sizes of this insertion in the case of H = 11.6 mm, h = 100 W/(m2⋅K), Te = 20 °C and T0 = 37 °C. This study is devoted to the analysis of temperature distributions within the tissue in the case of the tumor zone influence.
Figure 6 shows temperature profiles for different time moments within the biological tissue in the case of healthy tissue (blue lines) and when the tumor zone with a size of 1 mm is located in the central part (black lines) of the fourth skin zone (subcutaneous adipose tissue). Vertical dashed lines in Figure 6 illustrate the borders of each zone (epidermis, papillary dermis, reticular dermis, subcutaneous adipose tissue, and muscle layer), while vertical solid lines illustrate the borders of the tumor zone within the subcutaneous adipose tissue. The horizontal axis in Figure 6 characterizes axis x from Figure 1, and for x = 0, we have the skin surface where the Newtonian cooling condition is used with the environmental temperature, Te = 20 °C. Therefore, one can find a reduction of the skin surface temperature with time regardless of the presence or absence of the tumor zone. Temperature within the tissue reduces with time from the skin surface up to core (H = 12 mm) and the breaks of the temperature profiles occur at the interfaces between different layers of the skin when we have essential difference in the thermal conductivity (see Table 1). The final time moment of 1800 s characterizes a reaching of the steady state when we do not have changes of the temperature profile with time. It is worth noting that an addition of tumor zone in the fourth level of the skin leads to less intensive temperature reduction within the biological tissue. Such nature can be explained by high volumetric thermal generation flux due to metabolism within the tumor zone compared to the skin levels. Therefore, temperature within this zone is high in comparison with healthy tissue. Moreover, due to differences between the thermal conductivities of subcutaneous adipose tissue and tumor zone, one can find a presence of temperature profile breaks at the tumor zone borders. As a result, an appearance of the tumor zone inside the subcutaneous adipose tissue leads to less intensive cooling of the skin surface.
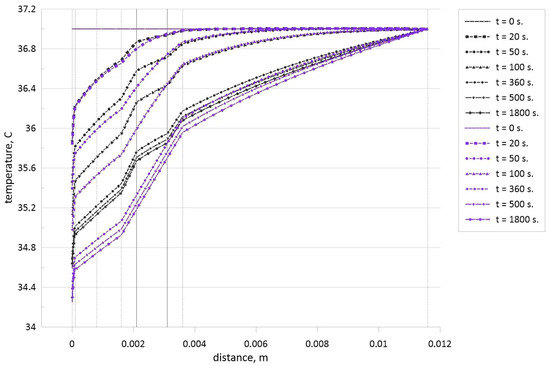
Figure 6.
Temperature profiles for different time moments in the case of healthy tissue (blue lines) and when the tumor zone with a size of 1 mm is located in central part of subcutaneous adipose tissue (black lines).
Figure 7 shows the temperature profiles inside the biological tissue with time for the healthy tissue (blue lines) and when the tumor zone with a size of 5 mm is located in the central part (black lines) of the fifth skin zone (muscle layer). Taking into account small differences in thermal conductivities of the muscle layer and tumor zone (see Table 1), there are no temperature profile breaks at the borders of the tumor zones. For the steady state, a presence of tumor zone also characterizes the non-essential temperature reduction at the skin surface compared to the healthy tissue. It is interesting to note that up to t = 100 s, there are not differences in the skin surface temperature, while for t = 100 s, one can find differences in temperature within the muscle layer where the tumor zone is located, but due to the cooling from the outside, these differences vanish to the skin surface. Further time growth illustrates less essential skin surface temperature reduction due to the interaction between the wave of high temperature from the tumor zone and the wave of low temperature from the skin surface. Comparing Figure 6 and Figure 7, it is possible to highlight that a growth of the distance between the tumor zone and skin surface leads to a reduction of the temperature difference between the case of healthy tissue and tissue with tumor cells.
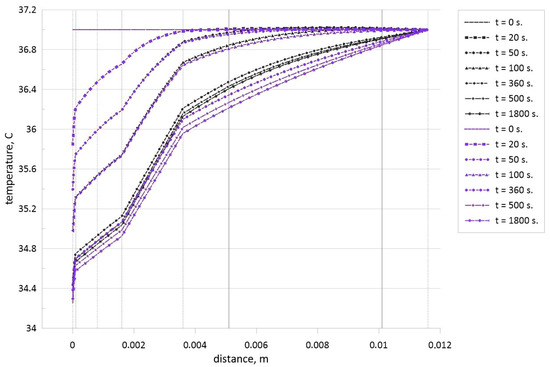
Figure 7.
Temperature profiles for different time moments in the case of healthy tissue (blue lines) and when the tumor zone with a size of 5 mm is located in central part of muscle layer (black lines).
Figure 8, Figure 9, Figure 10 and Figure 11 demonstrate temperature profiles within the biological tissue for different time moments when tumor zone with a size of 0.45 mm is located in skin level 2—papillary dermis (see Figure 8), in skin level 3—reticular dermis (see Figure 9), in skin level 4—subcutaneous adipose tissue (see Figure 10), and in skin level 5—muscle level (see Figure 11).
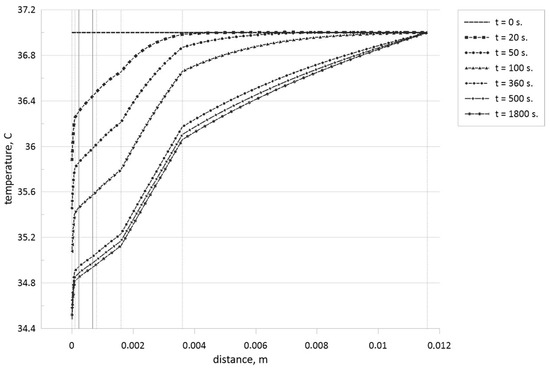
Figure 8.
Temperature profiles for different time moments when the tumor zone with a size of 0.45 mm is located in the central part of the papillary dermis.
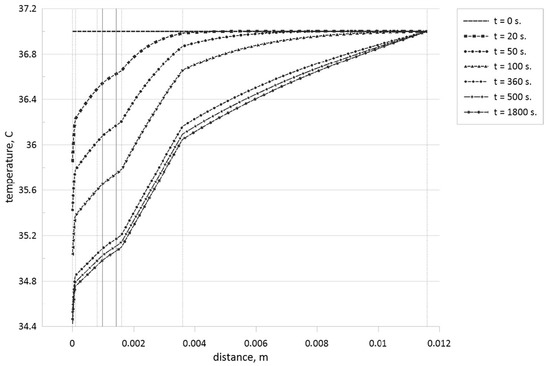
Figure 9.
Temperature profiles for different time moments when the tumor zone with a size of 0.45 mm is located in the central part of the reticular dermis.
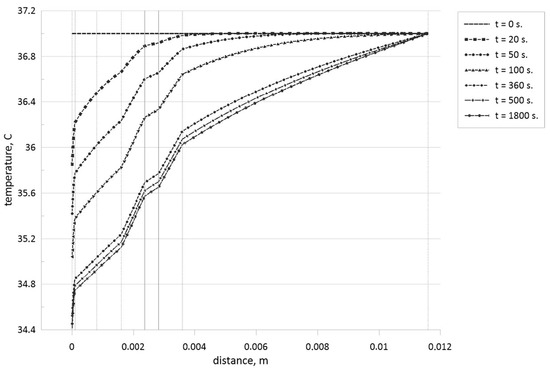
Figure 10.
Temperature profiles for different time moments when the tumor zone with a size of 0.45 mm is located in the central part of the subcutaneous adipose tissue.
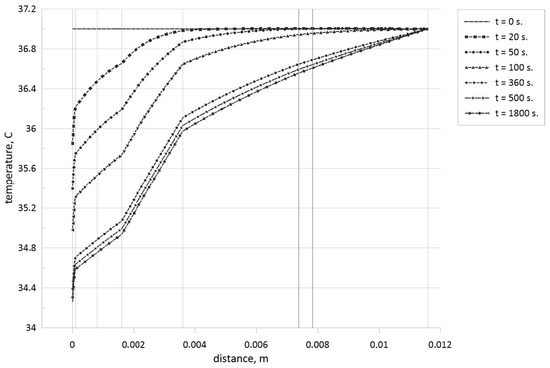
Figure 11.
Temperature profiles for different time moments when the tumor zone with a size of 0.45 mm is located in the central part of the muscle level.
Analyzing these temperature profiles for an effect of the tumor zone location on temperature profiles, it is possible to conclude that a rise of the tumor zone depth leads to more essential cooling of the skin surface due to a displacement of more essential volumetric heat generation form the skin surface deep into tissue core. Moreover, taking into account Table 1, we can highlight that more essential differences in thermal conductivities between tumor cells and skin levels can be found only for subcutaneous adipose tissue, and in Figure 10, one can find appropriate temperature profile breaks at the tumor zone borders.
The performed numerical analysis allows obtaining the global map of the tumor zone size and location effects on the skin surface temperature. Figure 12 illustrates the skin surface temperature for various tumor zone sizes and different locations compared to the healthy tissue case. Huge black dots reflect a location of tumor zone center, while small dots around the huge one illustrate borders of the tumor zone. Three dots, namely, a large one and two small ones, show the temperature at the skin surface. Analyzing this figure, one can conclude that an increase in the tumor zone size leads to less intensive cooling of the skin surface and skin surface temperature increases compared to the healthy tissue (large dot at zero depth). Growth of the tumor zone depth for a constant size leads to the skin surface temperature diminution. Moreover, for the muscle layer, with the appearance of a large tumor zone, that is, up to the size of the muscle layer, the skin surface temperature will be less than this temperature in the case of a small tumor zone placed in the subcutaneous adipose tissue.
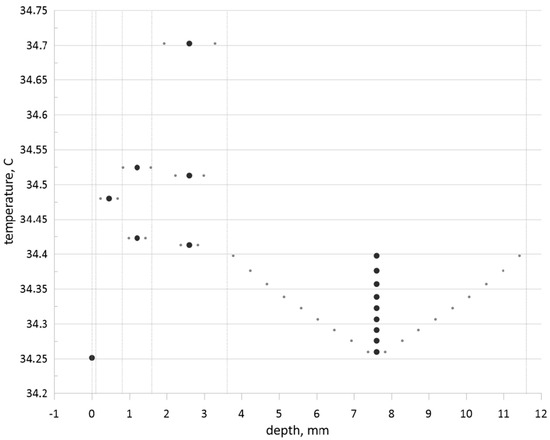
Figure 12.
Skin surface temperature depends on the central location of the tumor zone within an appropriate skin level and tumor zone size.
4. Conclusions
Investigation of temperature profiles in the biological tissue under an influence of the tumor cells has been performed using the Pennes mathematical model with appropriate initial and boundary conditions. An in-house numerical algorithm has been developed for the present research to analyze an influence of tumor location and tumor size. Employing the numerical results, we can highlight that:
- −
- A rise of the tumor zone size leads to less intensive cooling of the skin surface and skin surface temperature increases compared to the healthy tissue;
- −
- An increase in the tumor zone depth for a constant tumor zone size leads to a skin surface temperature reduction. As a result, in this case, the difference between the skin surface temperatures for healthy tissue and tissue with pathology is decreased.
Taking into account these mentioned results, it is possible to create the electronic system that allows defining a location of the tumor cells within the tissue using the temperature difference between the healthy state and pathology state.
Author Contributions
Conceptualization, M.A.S.; methodology, M.A.S.; formal analysis, D.V.A. and M.A.S.; investigation, D.V.A. and M.A.S.; writing—original draft preparation, D.V.A. and M.A.S.; writing—review and editing, D.V.A. and M.A.S.; supervision, M.A.S. All authors have read and agreed to the published version of the manuscript.
Funding
This research received no external funding.
Data Availability Statement
The original contributions presented in the study are included in the article, further inquiries can be directed to the corresponding author.
Conflicts of Interest
The authors declare no conflicts of interest.
References
- Pennes, H.H. Analysis of tissue and arterial blood temperatures in the resting human forearm. J. Appl. Physiol. 1948, 1, 93–122. [Google Scholar] [CrossRef] [PubMed]
- Deng, Z.S.; Liu, J. Analytical study on bio heat transfer problems with spatial or transient heating on skin surface or inside biological bodies. J. Biomech. Eng. 2002, 124, 638–649. [Google Scholar] [CrossRef] [PubMed]
- Patil, H.M.; Maniyeri, R. Finite difference method based analysis of bio-heat transfer in human breast cyst. Therm. Sci. Eng. Prog. 2019, 10, 42–47. [Google Scholar] [CrossRef]
- He, Z.Z.; Xue, X.; Liu, J. An effective finite difference method for simulation of bio heat transfer in irregular tissues. J. Heat Transf. 2013, 135, 071003. [Google Scholar]
- Kumar, S.; Srivastava, A. Finite integral transform-based analytical solutions of dual phase lag bio-heat transfer equation. Appl. Math. Model. 2017, 52, 378–403. [Google Scholar] [CrossRef]
- Shih, T.C.; Yuan, P.; Lin, W.L.; Kou, H.S. Analytical analysis of the Pennes bio heat transfer equation with sinusoidal heat flux condition on skin surface. Med. Eng. Phys. 2007, 29, 946–953. [Google Scholar] [CrossRef] [PubMed]
- Ng, E.Y.K.; Chua, L.T. Comparison of one- and two-dimensional programmes for predicting the state of skin burns. Burns 2002, 28, 27–34. [Google Scholar] [CrossRef] [PubMed]
- Liu, E.H.; Saidel, G.M.; Harasaki, H. Model analysis of tissue responses to transient and chronic heating. Ann. Biomed. Eng. 2003, 31, 1007–1014. [Google Scholar] [CrossRef] [PubMed]
- Psaty, E.L.; Halpern, A.C. Current and emerging technologies in melanoma diagnosis: The state of the art. Clin. Dermatol. 2009, 27, 35–45. [Google Scholar] [CrossRef] [PubMed]
- Greene, F.L.; Compton, C.C.; Fritz, A.G.; Shah, J.P.; Winchester, D.P. Melanoma of the Skin; AJCC Cancer Staging Atlas Part V; Springer: New York, NY, USA, 2006. [Google Scholar]
- Chen, H.; Wang, K.; Du, Z.; Liu, W.; Liu, Z. Predicting the thermophysical properties of skin tumor based on the surface temperature and deep learning. Int. J. Heat Mass Transf. 2021, 180, 121804. [Google Scholar] [CrossRef]
- Gonzalez-Hernandez, J.; Recinella, A.N.; Kandlikar, S.G.; Dabydeen, D.; Medeiros, L.; Phatak, P. An inverse heat transfer approach for patient-specific breast cancer detection and tumor localization using surface thermal images in the prone position. Infrared Phys. Technol. 2020, 105, 103202. [Google Scholar] [CrossRef]
- Partridge, P.W.; Wrobel, L.C. An inverse geometry problem for the localisation of skin tumours by thermal analysis. Eng. Anal. Bound. Elem. 2007, 31, 803–811. [Google Scholar] [CrossRef]
- Bhowmik, A.; Repaka, R. Estimation of growth features and thermophysical properties of melanoma within 3-D human skin using genetic algorithm and simulated annealing. Int. J. Heat Mass Transf. 2016, 98, 81–95. [Google Scholar] [CrossRef]
- Das, K.; Singh, R.; Mishra, S.C. Numerical analysis for determination of the presence of a tumor and estimation of its size and location in a tissue. J. Therm. Biol. 2013, 38, 32–40. [Google Scholar] [CrossRef] [PubMed]
- Das, K.; Mishra, S.C. Estimation of tumor characteristics in a breast tissue with known skin surface temperature. J. Therm. Biol. 2013, 38, 311–317. [Google Scholar] [CrossRef]
- Das, K.; Mishra, S.C. Non-invasive estimation of size and location of a tumor in a human breast using a curve fitting technique. Int. Commun. Heat Mass Transf. 2014, 56, 63–70. [Google Scholar] [CrossRef]
- Shenoy, A.; Sheremet, M.; Pop, I. Convective Flow and Heat Transfer from Wavy Surfaces: Viscous Fluids, Porous Media and Nanofluids; CRC Press: Boca Raton, FL, USA, 2016. [Google Scholar]
Disclaimer/Publisher’s Note: The statements, opinions and data contained in all publications are solely those of the individual author(s) and contributor(s) and not of MDPI and/or the editor(s). MDPI and/or the editor(s) disclaim responsibility for any injury to people or property resulting from any ideas, methods, instructions or products referred to in the content. |
© 2024 by the authors. Licensee MDPI, Basel, Switzerland. This article is an open access article distributed under the terms and conditions of the Creative Commons Attribution (CC BY) license (https://creativecommons.org/licenses/by/4.0/).