Article

Optimal Decisions on Greenness, Carbon Emission Reductions, and Flexibility for Imperfect Production with Partial Outsourcing

1
Department of Industrial & Data Engineering, Hongik University, Wausan-ro 94, Mapo-Gu, Seoul 04066, Republic of Korea
2
College of Business Administration, Hongik University, Wausan-ro 94, Mapo-Gu, Seoul 04066, Republic of Korea
*
Author to whom correspondence should be addressed.
Mathematics 2024, 12(5), 654; https://doi.org/10.3390/math12050654
Submission received: 23 January 2024 / Revised: 13 February 2024 / Accepted: 21 February 2024 / Published: 23 February 2024

Abstract

:
Global emphasis on sustainable development is widespread, with industries playing a pivotal role in advancing global sustainability within the business and retail sectors. Consumer awareness of environmental concerns, such as pollution, prompts a focus on product biodegradability and eco-friendliness. Consequently, customers are drawn to products with higher green credentials. This study delves into the effectiveness of green attributes in retail industries, exploring the optimization of profit through a variable production rate and variable unit production cost, considering the selling price and the demand dependent on the product’s green level. In the long run, production systems may shift to an “out-of-control” state, resulting in the random production of imperfect items that must be remanufactured to maintain the industry’s positive brand image. To mitigate the impact of defective items, the industry opts to partially outsource a percentage of items, preventing shortages. However, this complex retailing system generates a significant amount of carbon emissions. This study introduces investments aimed at reducing carbon emissions to address this issue. In contrast with the existing literature, a green-level-dependent unit raw material cost is considered here for variable unit production cost. Ultimately, this study seeks to maximize the overall system’s profit by optimizing the selling price, order quantity, production rate, green level, and carbon emission reduction investments. The classical optimization technique is utilized to obtain analytic optimum results for the decision variables and total profit. Special cases and sensitivity analyses illustrate the real-world applicability and impact of green levels. Numerical findings indicate that considering the product’s green-level-dependent demand and unit production rate is 22.44 % more beneficial than nongreen products, partial outsourcing provides a 1.28 % advantage, and flexibility in the production rate yields a 69.60 % benefit over traditional systems without green elements. Additionally, technological investments to reduce carbon emissions result in a notable reduction of up to 4.53 % .

1. Introduction

Environmental consciousness has become a prominent focus for researchers in recent times [1]. Researchers are consistently directing their efforts toward the development of innovative technologies and strategies to enhance greenness of the environment. This concern is not limited to researchers alone; the general public is also increasingly mindful of environmental issues. Consequently, consumers express a preference for greener (biodegradable) products, even when priced higher, indicating a growing awareness of environmental considerations [2]. Consumer choices are progressively influenced by the eco-friendliness and greenness of products. Companies striving to contribute to environmental well-being may experience increased product sales, as environmentally conscious consumers tend to support such businesses. This trend signifies a developing awareness of environmental concerns and a willingness to endorse businesses aligned with economic values. Recognizing customers’ inclination towards green products, production industries are focusing on increasing the production of environmentally friendly items. Therefore, the green level (GL) of a product significantly impacts product demand. The influence of the selling price on the product is inevitable for supply chain management. Companies may choose to charge a premium for environmentally conscious products based on perceived consumer value [2]. Previous research has discussed the inversely proportional relationship between selling price and customer demand [3], emphasizing the crucial role of a product’s selling price and GL in determining demand within a supply chain system. Integrating eco-friendly elements into products can increase the selling price and attract environmentally conscious customers. Thus, researchers must determine the optimal selling price and GL for products to maximize the profit of the entire system.
Furthermore, due to an intelligent system incorporating flexible production and reworking processes, a significant amount of carbon is produced during the initiation of the process, which involves handling both flawless and defective items. Additionally, carbon emissions occur when products are outsourced [4]. Consequently, the industry must prioritize the reduction of carbon emissions for a green environment. In this research, we integrated technological investments aimed at mitigating carbon emissions.
On the other hand, production systems cannot operate flawlessly for an extended period, leading to the generation of defective items during the out-of-control state of the production process [5]. The generation of defective items is random in reality and poses harm to the production industry, as these items cannot be sold in the market. Defective generation can result in shortages, impacting the overall system’s profit. To address this shortage situation, a percentage of the total demand is outsourced to maintain the company’s brand image [6]. Outsourcing involves contracting external vendors for manufacturing components, goods, or services, providing cost savings, improved efficiency, and specialized knowledge utilization. However, balancing the benefits of outsourcing with potential risks, such as loss of control and dependency on external partners, is crucial for a successful outsourcing strategy [7]. In this study, partial outsourcing is considered to maximize profit. Moreover, the defective product not only results in shortages but also poses a threat to sustainable development due to the generation of waste. A considerable quantity of raw materials is squandered alongside these faulty items [8]. Therefore, to curb the wastage of raw materials, the optimal solution for industries is to rework the defective items. Reworking serves to manage raw material waste and contributes to improving the overall system’s profitability.
Flexibility emerges as a key factor in maximizing profit in the business sector. Product demand is variable and flexible due to various realistic issues, making a fixed production rate risky for production industries [9]. Fixed production rates can lead to shortages during high demand or excessive waste during low demand, resulting in losses for the industry. Thus, a flexible production rate helps optimize profit [10]. The variable production rate (VPR) allows adjustments based on demand fluctuations or operational considerations, helping companies adapt to market changes, avoid excess inventory, and work more efficiently. Implementing VPR requires sophisticated production planning and control systems, utilizing technology such as analytics and real-time monitoring for data-driven strategies to quickly modify output rates and optimize resource usage [11]. Considering the impact of the product’s GL on demand, this study incorporates the unit production cost (UPC) influenced by the GL alongside development and tool/die costs. Based on the discussion above, the research gaps are as follows.

1.1. Research Gap

  • The literature has explored the impact of green investments on increasing demand [12,13,14]. Selling-price-dependent demand is a well-documented concept in existing research [3,15,16]. However, the literature addressing both selling price and GL as variables influencing demand remains scarce.
  • Several researchers have developed imperfect production models involving manufacturing and remanufacturing in the same cycle [8,17]. Nevertheless, the existing literature does not yet consider manufacturing–remanufacturing in the same cycle, along with partial outsourcing and technology investment to reduce carbon emissions under VPRs.
  • The literature has extensively discussed flexibility in the production process through VPR with variable UPC, where UPC is influenced by raw material cost, development cost, and tool/die cost [11,18,19]. However, to the best of the authors’ knowledge, the existing literature has not yet explored GL-dependent raw material costs for variable UPC.
We design an imperfect manufacturing–reworking system that prioritizes an eco-friendly production process. Profit maximization strategies, such as outsourcing and various investments, ensure economic benefit. Environmental greenness is addressed through GL-dependent demand and UPC influenced by carbon emission reduction technology, while social sustainability is achieved through labor engagement in manufacturing, reworking, and outsourcing. The model’s applicability and profitability are enhanced by considering selling-price- and GL-dependent market demand. The flexible production rate optimizes overall system profit, where UPC is influenced by the product’s GL, development cost, and tool/die cost. Technological investments not only reduce carbon emissions but also contribute to cost reduction, supporting the growth of economy and environmental greenness.

1.2. Contribution

Based on the above research gaps and discussion, the contributions of this study can be outlined as follows:
  • An imperfect manufacturing–reworking system is designed in this study under the consideration of flexibility in the production process with the effect of technological investment to reduce the effect of carbon emissions.
  • A product’s green-level-dependent unit production cost is considered in this study to enhance the biodegradability of the product.
  • An imperfect production process is formulated in this study where demand is dependent on the selling price and GL of the product and the generation rate of defective items is random. A percentage of demand is outsourced to fulfill the demand and to overcome the shortages.

1.3. Orientation of the Manuscript

The rest of the manuscript is structured with eight different sections. In Section 2, the background of this study along with a review of the existing literature is presented. The problem statement of this study along with assumptions is illustrated in Section 3. Different cost components and the mathematical form of the profit function are elaborated, and a closed-form analytic solution with global optimality conditions is described in Section 4. An analytic classical optimization technique is utilized to obtained the result for this model, which is described as the solution methodology in Section 5. To prove the applicability of this study in reality, some numerical examples with different cases are presented in Section 6. A sensitivity analysis for the key parameters is performed in Section 7. The theoretical and practical implementation of this study is discussed as managerial insights in Section 8. The major findings of this study are described as conclusions in Section 9, and lastly, limitations and future extensions of this study are described in Section 10.

2. Previous Studies

The illustration of the existing literature along with the literature gaps are discussed in this section. The novelty of this section compared to the existing literature is summarized in Table 1.

2.1. Imperfect Production with Outsourcing

Imperfect production indicates that items may be manufactured with slight deviations from the desired standard. Different reasons, such as machinery imperfections, human errors, and changes in material quality, can make the production process imperfect. Imperfect production permits slight differences in the products, in contrast to perfect production, which strives for uniformity in every product [20]. Sana [20] considered a classical economic manufacturing quantity (EMQ) model with imperfect generation of the product. He tries to increase the reliability of the product and optimize the cost of the system under constant demand. Similarly, an imperfect production inventory system under an optimum ordering policy was proposed by Pal et al. [21]. They considered a discount policy for the imperfect product with less quality compared to the good product. However, they ignored the concept of reworking within the same production cycle. However, those imperfections create a shortage situation. This shortage can be managed by backordering [15]. Pal et al. [15] developed an imperfect EMQ model under the consideration of partial backordering, which can make the system profitable. All those studies considered a fixed defective rate, whereas in reality, the generation of defective items is random [8]. Dey et al. [8] considered five different distributed random defective rates for their imperfect production model. They considered an assembled item for their study and proved that cost was minimized when the defective rate follows a reciprocal distribution.
Table 1. Novelty of this study based on the existing literature.
Author(s)OutsourcingDemand
Rate
Depend
Defective
Item
Production
Rate
ReworkInvestment
Murmu et al. [3]NASPNAConstantNAPreservation
Kaur et al. [7]ConstantRandomNAFlexibleNANA
Sarkar et al. [18]NAConstantYesFlexibleYesSetup
Sarkar et al. [22]NAConstantYesFlexibleYesGT
Mishra et al. [23]NAConstantNAConstantNAGT
Mashud et al. [24]NAConstantYesConstantYesNA
Das et al. [25]NAConstantNAConstantNANA
Heydar et al. [26]NAConstantYesFlexibleYesGT
Giri et al. [27]NASPNAConstantNAGT
Dey and Seok [28]NAServiceRandomConstantNAInspection
Bachar et al. [29]VariableSPYesConstantYesNA
Lin et al. [30]ConstantConstantYesConstantYesNA
Ma et al. [31]NASPNAFlexibleNANA
Alfares et al. [32]NCSPNAFlexibleNANA
Sarkar et al. [33]NCSPYesFlexibleYesInspection
This studyVariableSP and GLYesFlexibleYesGT
SP: selling price.
To avoid the waste of raw materials, those imperfect items need to be reworked to make them perfect. Sarkar et al. [33] developed a smart manufacturing–remanufacturing imperfect model, where manufacturing and remanufacturing are performed within the same production cycle. They considered a smart automated inspection strategy to identify the imperfection perfectly. Those imperfect items may create a bad impact on the company by creating a shortage. Therefore, how much buffer is required to control this situation was calculated by Sana [34]. He considered the buffer stock during preventive maintenance. However, imperfect items may be generated all over the cycle [35]. Sepehri and Gholamian [35] considered an imperfect production inventory model with shortages but without reworking. However, this shortage problem can be solved by partial outsourcing [29]. Partial product outsourcing is when specific parts of the manufacturing process are delegated to outside suppliers while the company retains control over other elements. This strategy allows businesses to capitalize on external expertise, cost efficiencies, and flexibility while still maintaining oversight and management of critical elements [36]. Naghshineh and Carvalho [36] proposed a literature survey for the additive manufacturing technology adoption for supply chain resilience and proved that outsourcing is cost-effective for manufacturing industries. Companies sometimes choose to partially outsource certain parts of the production process when those parts are not the most important or require special skills that other companies can perform better. This could include outsourcing the manufacturing of specific components, assembly processes, or even certain services like logistics or customer support [37]. Friedrich et al. [37] developed an additive manufacturing process under the consideration of outsourcing but ignored the concept of variable demand and reworking. Partial outsourcing offers the benefits of cost savings, gaining access to specialized expertise and resources, and the flexibility to adapt to market changes more readily. However, it can be difficult to coordinate activities between teams inside and outside the company, make sure everything is high-quality, and manage risks when relying on outside partners [38]. Xie et al. [38] considered a government subsidy policy for outsourcing. They calculated the outsourcing price equilibrium under the Nash bargaining game. However, they considered a fixed demand and perfect production process for their study. Successful partial outsourcing needs a good plan, clear communication, and strong contracts to make sure everyone knows what to do and what to expect. In general, it is a complex business plan that tries to use outside skills while still staying in charge of important parts of making and delivering the product [39]. Deng and Xu [39] investigated the effect of discount and fixed investment for manufacturing. However, they were unaware of the imperfect production or reworking. Lin et al. [30] proposed a remanufacturing model under consideration of outsourcing. They considered a manufacturing and remanufacturing system. However, they avoided the concept of carbon emissions reduction or flexibility in the production process.
Several studies were conducted in the literature on imperfect production processes with faulty generation and reworking, and some studies were also conducted by considering the concept of outsourcing. However, an imperfect process with random defective generation and manufacturing–reworking in the same cycle under partial outsourcing to control shortages are rare in the literature. Most of the existing studies were developed under consideration of constant demand and production rate. Thus, an imperfect EMQ model with variable demand and production rates under random defective rates and partial outsourcing is developed in this study to fill this research gap.

2.2. Green Level (GL)- and Selling-Price-Dependent Demand

Predicting proper demand in inventory management of the production or supply chain system is very crucial to making several major decisions. Initially, the researcher considered a fixed demand for the production or supply chain model to avoid complexity [40]. However, in real situations, demand from the customers cannot be always fixed. The demand for a particular product is influenced by several real factors such as the selling price of the product, the quality of the product, the service level of the company, advertisement, and many more. Therefore, researchers continuously develop different studies considering those factors depending on realistic demand. The selling price is very crucial for determining the demand for the product [16]. They considered a deteriorating item for their study and optimized the selling price of the product and lot size. In a similar direction, an inventory model was proposed by [41]. Agi and Soni [41] considered that demand depends on the stock level and selling price of the product. They also optimized lot size and selling price with optimum profit. Not only the selling price but also the product’s quality plays a significant part in determining the demand for the product [42]. Jabarzare and Rasti-Barzoki [42] developed a dual-channel supply chain system under the consideration of selling price and quality of the product-dependent demand and optimizing the profit. Similarly, Dey et al. [43] considered an imperfect production process with remanufacturing, where demand depends on the selling price and the quality of the product. They considered a machine-based inspection strategy to identify the defective items. However, all those studies neglected the effect of the GL of the product. Nowadays, every sector is concerned about the green environment and tries to reduce the pollution of the environment. In this century, the GL of the product plays a major role in determining the demand for the product [27]. Customers prefer more environmentally friendly products. Wang and Song [44] developed a dual-channel supply chain under the consideration of green investment and sales efforts dependent on uncertain demand. A green supply chain system that balances price and green quality was proposed by Heydari et al. [26]. They proved that customers have become more aware of the environment and prefer green products. Recently, Paul et al. [45] developed an inventory system by considering the GL of the product. They considered a carbon taxation policy to reduce carbon emissions. Malleeswaran and Uthayakumar [46] proposed a sustainable supply chain for single manufacturer multi-retailer by considering an investment to increase the GL of the product. They considered reworking for their study under ordering cost reduction. Furthermore, more people want to buy products that are good for the environment. Despite the higher production costs, this is creating new prospects for businesses. Companies that prioritize greenness contribute to environmental protection and build a positive public image. Companies must find a balance between being eco-conscious and remaining competitive in the market, as stated by Punj et al. [47]. A supply chain model for deteriorating items under a hybrid pricing strategy was proposed by Khanlarzade and Farughi [48]. They considered a Boundedly rational decision-making system through Stackelberg game policy.
Many of the existing studies deal with investment to enhance the GL of products. However, as per the authors’ judgment and knowledge, GL and selling in price-dependent imperfect flexible systems under consideration of outsourcing and reworking are still not considered by the existing literature. Thus, this gap is filled by the current study.

2.3. Green Level (GL)-Dependent Variable Production Rate (VPR)

In traditional manufacturing systems, a constant production rate is considered with fixed production costs [20]. However, in reality, it is not always profitable to consider a fixed production rate. With uncertain market demand, the production rates need to be flexible. A fixed production rate may be harmful to industry. A fixed rate of production may increase the waste when the demand for the product is low or increase the shortage cost during high product demand. Thus, flexible production systems are always helpful in optimizing profit and making an economically sustainable production process [49]. Min and Chung [50] proposed a distribution model by optimizing shipment size. They considered the concept of carbon emissions reduction in their study. However, the concept of green-level-dependent demand was ignored by them. AlDurgam et al. [51] proposed a single vendor and single manufacturer integrated model under the consideration of a VPR. In their model, they considered random demand and proved a flexible production rate can help to minimize the cost and lead time. Similarly, [10] considered a smart supply chain system under a VPR, where demand varies with the advertisement investment. They suggested that a VPR can help to control the lead time and backorder rate. A hybrid production system with a controllable production rate was formulated by Kim and Kim [52]. Kim and Kim [52] considered a make-to-order stock-dependent VPR. Sarkar et al. [18] developed a multistage complex production system with VPRs and remanufacturing. They conclude that VPRs can reduce the makespan and generation of defective items within a production process. Recently, Bachar et al. [29] proposed an imperfect production system with reworking and partial outsourcing. They considered a flexible production rate for their system and proved that flexibility can help optimize the profit of the production process.
Along with the VPR, the UPC also varies. Generally, the UPC is calculated by summing raw material cost, development cost, and tool/die cost, where development cost is inversely proportional to the production rate and tool/die cost is directly proportional to the production rate [22]. However, the production cost of a product can be influenced by various factors. Implementing eco-friendly practices like using renewable energy or sustainable materials in production may initially incur higher costs due to investing in new technology and higher costs for sustainable materials [53]. Over time, these actions can lead to cost savings and environmental benefits. The overall cost of production is determined by the size of the company, the nature of the business, and the eco-friendly practices implemented. GL-dependent production costs cover a range of environmentally friendly practices that can affect the total cost of making a product [54]. Using sustainable materials and energy-efficient processes and reducing waste might cost more at the beginning. However, when companies get bigger and technology gets better, they can use fewer resources and save money on waste disposal in the long run. Government rewards, improvements in eco-friendly technologies, and changes in regulations can affect how much it costs to produce sustainable products. Therefore, it is important to have a plan that looks at both short-term and long-term benefits when trying to make production more sustainable [31]. Ma et al. [31] proposed a dynamic supply chain system under Stackelberg game policy. They considered an emissions tax and a variable production rate for their study. However, a product’s green-level-dependent material cost to calculate unit production cost for an imperfect production system with outsourcing is still a research direction with many questions, which is filled by this study.
Thus, a GL-dependent UPC is very crucial for production industries. In contrast with the literature, a GL-dependent raw material cost is considered in this study. That is, per the authors’ knowledge, till now in the existing literature, the UPC depends only on the production rate, but in this study, the first-time GL- and production-rate-dependent unit production rate are calculated where the raw material cost depends on the GL of the product.

2.4. Carbon Emissions Reduction and Green Products

Reducing carbon emissions and taking care of our planet is important to stop climate change and keep our planet healthy. In order to achieve significant advancements, companies and individuals must adopt environmentally conscious practices, utilize sustainable energy sources, and conserve energy. Governments play a vital role in establishing and implementing policies to preserve the environment. The use of new technology also supports the development of cleaner options for the environment. The whole world needs to work together to reduce the effects of carbon emissions and make a better future for our planet. In industries, carbon is emitted randomly during manufacturing, remanufacturing, transportation, and several operations during the whole process [55]. Das and Roy [56] proposed an integrated facility location and transportation problem under different carbon reduction polices. In a similar direction, Das et al. [57] presented a multiobjective transportation-location problem under different carbon polices. A sustainable production inventory system with controllable carbon emissions was proposed by Mishra et al. [58]. Mishra et al. [58] considered carbon tax and cap along with a green technology investment to control carbon emissions. However, they were unaware of the emission transfer strategies to reduce carbon emissions. Thus, a low-carbon supply chain by considering emission transfer strategies and the lag time of the emission reduction was constructed by Sun et al. [59]. They proved that the lag time of the emission reduction helps to transfer the carbon emission level of the manufacturer. However, they neglected the concept of a carbon trading policy to reduce the carbon emissions from the industries. In 2013, China implemented an emission trading system (ETS) to reduce carbon and build a green future for the earth [60]. Zhang et al. [60] proved that the ETS can help reduce carbon emissions by 24.2 % and increase the economy by 13.6 % . However, rapid development in the industrial sector increases carbon emissions, which are harmful to the environment [61]. An et al. [61] suggested fixing the carbon price at a certain level, and this carbon emission reduction policy should implemented in all industries instead of only in developed areas. However, by investing in green technology, carbon emissions can be reduced for an inventory system under backorder consideration, as stated by Mishra et al. [23]. Similarly, Mashud et al. [24] proposed an inventory system for the green-warehouse farms under controllable CO2 emissions. They considered a noninstantaneous deteriorating item for their study. However, they avoided the concept of digitalization in the industry to control emissions. Yang et al. [62] proposed an approach for digital city construction under the effect of carbon emissions reduction. However, they neglected the concept of carbon policies and reworking. Considering a reworking and multicredit period, a model was formulated by [63]. Dey et al. [63] considered three different types of carbon emission reduction policies for their model and proved that a limited carbon regulation policy was the best policy to reduce carbon emissions. Das et al. [25] analyzed a mixed-integer non-linear multi-objective model under two-fold uncertainty. They demonstrated the impact of carbon emissions constraints; however, they ignored the concepts of outsourcing and a flexible production rate. Utama et al. [64] proposed a production–inventory model with fuel consumption under quality degradation. They considered the demand as having a stochastic nature for food industry.
All those studies care about carbon emissions reduction through different approaches; however, as per the basic definition of sustainability, a system is called sustainable when three basic pillars (economic, environment, social) can be simultaneously developed [65]. Most of the studies considered only the environmental benefit of reducing carbon emissions. However, considering the three pillars, economic, environmental, and social, of sustainability in a model is very rare in the literature. In this study, profit optimization ensures economic benefits; the adaptation of partial outsourcing concept and the identification of defective items increase the labor, which ensures social benefits; and green products, GL-dependent demand and production rate, reworking, and investment in technology to reduce carbon emissions ensure the environmental benefits. Thus, the three basic pillars of sustainability are held in this study. Furthermore, a smart production system with reworking and partial outsourcing under the consideration of GL- and price-dependent demand is still not formulated in the literature. Thus, a pioneer study established in this article proposes a sustainable production system with reduced carbon emissions and optimized profit.

3. Problem Statement, and Assumptions

The used assumptions along with a description of the proposed model are described in this section.

3.1. Problem Statement

A smart retailing system under the consideration of the green effect and carbon emission reduction investment is discussed in this study. The market demand for the product is a very crucial factor for business industries. Thus, the selling price and the product’s GL-dependent variable demand are considered in this study to make it realistic. Owing to variable demand, a GL-dependent UPC and VPR are considered here to make the model intelligent. In an out-of-control state, the production process may produce imperfect items randomly. In this study, we considered four different types of distribution for the generation rate of defective items. These defective generations may create a shortage situation, and the brand image of the company may be affected. Owing to imperfection in the production process, a percentage of products are outsourced to avoid shortages and keep the image of the company clean. The defective items are reworked within the same production cycle to fill the demand of the next cycle. This complex system emits a huge amount of carbon. Thus, to reduce carbon emissions, an investment is introduced in technology. Finally, total system profit is maximized based on the decision variables. Numerical findings conclude that the effect of the GL of the product and flexibility in the production rate under partial outsourcing comprise one of the best retailing strategies.

3.2. Assumptions

The following assumptions are considered to develop this model.
  • A flexible production system for single items with reworking is considered in this study. Owing to several factors such as machinery problems and the tardiness of labor, defective items are generated randomly. Repairable faulty items are reworked with some additional cost to make them perfect-quality items [8].
  • In this global supply chain system, certain percentages of optimal lot size quantity are outsourced to avoid a shortage situation. It is considered that ρ ( 0 < ρ < 1 ) percentage of the total quantity is outsourced. In other words, ρ = 0 indicates that all amounts are produced by the manufacturer, and ρ = 1 indicates all order quantities are outsourced with no amount produced by the manufacturer. Thus, in this study, we considered partial outsourcing to achieve optimum profit [29].
  • In this study, demand for the products depends on the selling price and GL of the product. Therefore, the demand for the product is D g = ξ 1 ξ 2 S g + ξ 3 G ξ 4 .
  • A VPR with variable UPC for this study is considered to make the study realistic and profitable. UPC depends on the GL of the product, i.e., GL and UPC are directly proportional. Therefore, the UPC is calculated by considering raw metrical cost, which depends on the GL of the product, development, and tool/die cost as C ( P g , G ) = ( γ 1 G 2 2 + γ 2 P g + γ 3 P g ) [22].
  • A huge amount of carbon is emitted during the setup of the production process, manufacturing, remanufacturing, outsourcing, and holding the perfect and reworked item. Thus, keeping green environment in mind, some investments are considered to reduce carbon emissions. The investment function is C ( I g ) = m ( 1 e v I g ) , and v is the efficiency of technology. Theoretically, investment tends to zero when I g = 0 and tends to m when I g [63].

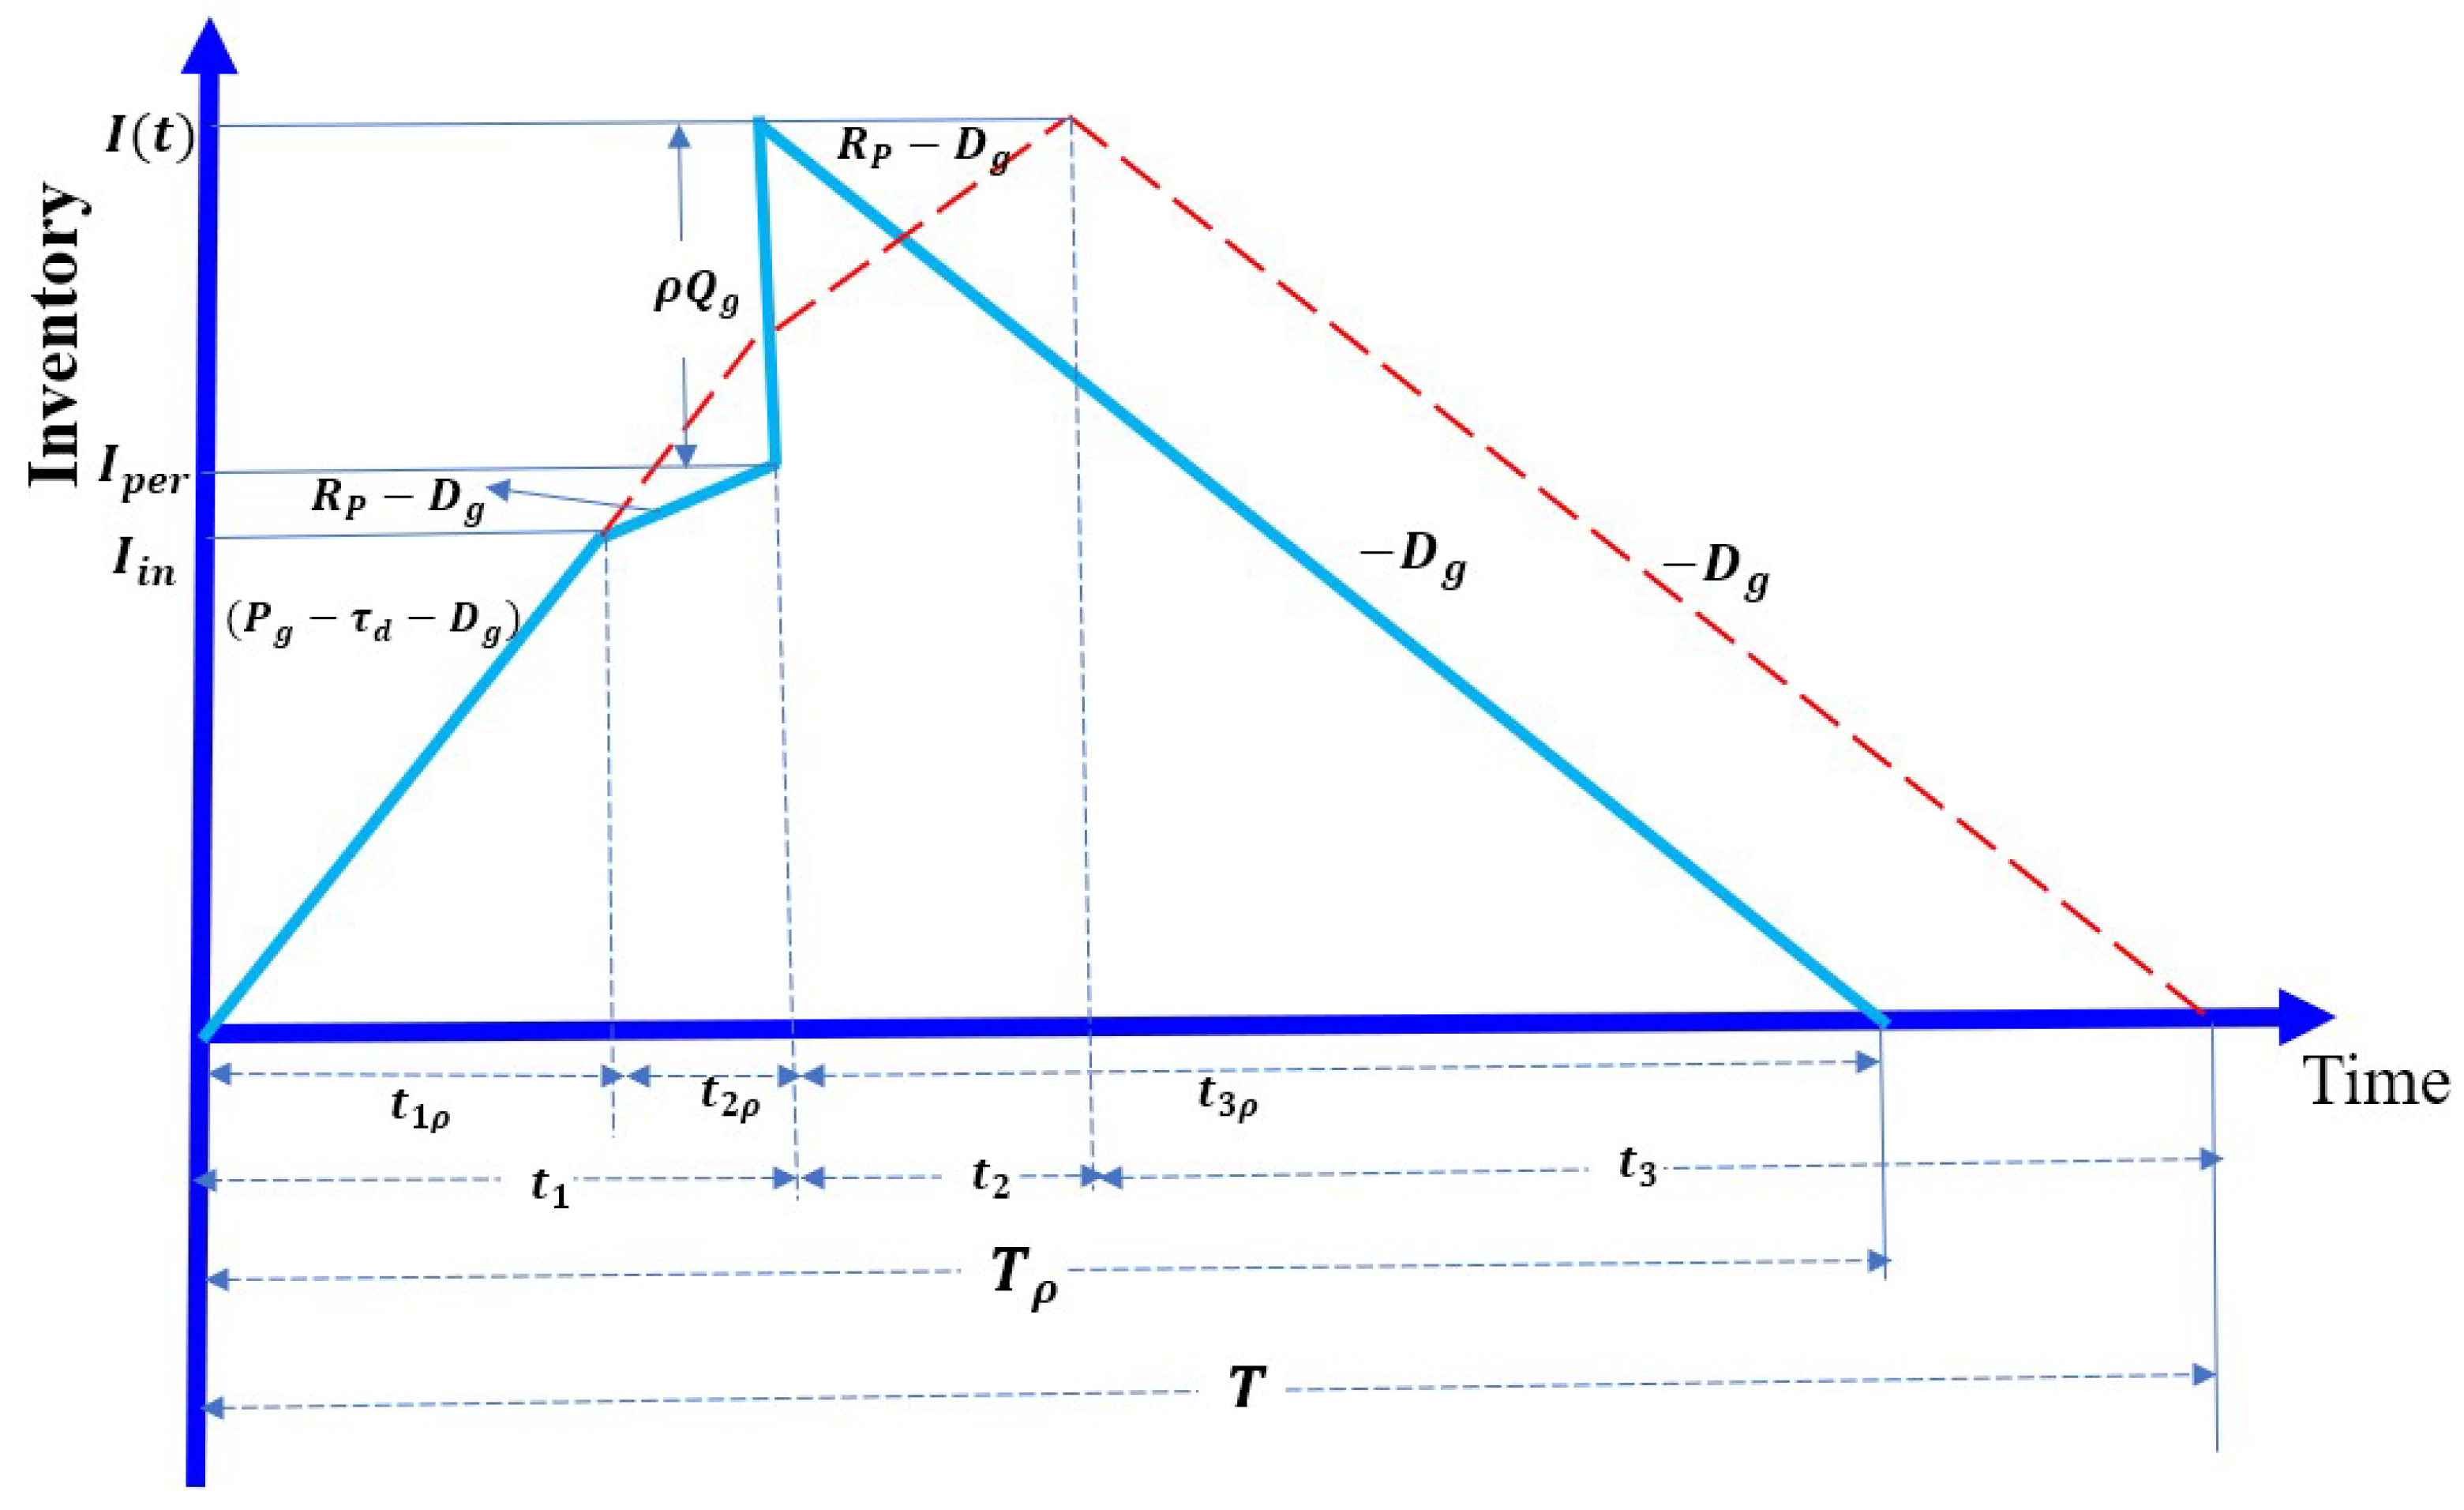
4. Imperfect Production Model with Partial Outsourcing

The production starts at T = 0 and in time t 1 ρ produces perfect and imperfect items (Figure 1). In this study, it was considered that defective items are generated at a random rate τ . Therefore, the level of perfect-quality inventory for the in-house production system is I i n = ( P g τ d D g ) t 1 ρ .
After time t 1 ρ , reworking of the defective items is started at a rate R p , and reworking is performed within time t 2 ρ . Therefore, the inventory level after t 2 ρ is the sum of I i n and the reworked item remaining on hand, i.e., I p e r = I i n + ( R P D g ) t 2 ρ .
Owing to imperfections in the production process, the manufacturer outsources a ρ ( 0 < ρ < 1 ) portion of the total ordered quantity to avoid a shortage situation. It is considered that all outsourced items are of perfect quality. Therefore, ρ = 1 indicates all items are outsourced, and ρ = 0 indicates no item is outsourced, that is, all items are produced by the manufacturer. In Figure 1, the dotted line indicates that ρ = 0 , i.e., no item is outsourced. If the ρ portion of the total quantity is outsourced, then the total inventory is given by I = I p e r + ρ Q g . These items deplete at a demand rate D g within time t 3 ρ , i.e., I = I p e r + ρ Q g = D g t 3 ρ . As per Figure 1, t 1 ρ is the pure production time, which can be obtained as t 1 ρ = I i n ( P g τ d D g ) = ( 1 ρ ) Q g P g . τ is the portion of repairable imperfect items, and the reworking time t 2 ρ can be calculated as t 2 ρ = τ ( 1 ρ ) Q g R P . Therefore, production downtime t 3 ρ can be formulated as t 3 ρ = I D g = I p e r + ρ Q g D g .
Therefore, the total cycle time under consideration of partial outsourcing can be calculated by summing production time, reworking time, and production downtime (only demand is there), which is mathematically presented as
T p = t 1 ρ + t 2 ρ + t 3 ρ = Q g D g .
Similarly, the repairable faulty items that were generated in time t 1 ρ can be calculated as
τ d t 1 ρ = τ P g t 1 ρ = τ ( 1 ρ ) Q g .

4.1. Green Level (GL)-Dependent Unit Production Cost (UPC)

Owing to demand uncertainty, a flexible production rate is considered in this study for optimizing the profit. The GL of the product helps to improve the demand as well as the total profit of the system. Therefore, the UPC is influenced by the GL of the product. In this study, UPC is calculated by summing raw material cost, development cost, and tool/die cost, where raw material cost is directly proportional with the GL of the product, and development cost, tool/die costs inversely and directly proportional with the production rate. Thus, UPC C ( P g , G ) is the function of GL and production rate, which can be expressed as
C ( P g , G ) = ( γ 1 G 2 2 + γ 2 P g + γ 3 P g ) ( 1 ρ ) Q g .

4.2. Setup Cost for Flexible Production System

A proper setup is required to run a business smoothly. A smart system is considered in this study with a flexible production rate and reworking. Thus, for setting up the flexible production system, the fixed setup cost is K. Therefore, the total setup cost per cycle can be obtained by dividing the fixed setup cost by the cycle time:
K D g Q g .

4.3. Holding Cost for Perfect and Defective Products

Holding cost is one of the basic and important costs for inventory or production models. Products are held until all products are finished due to demand, i.e., for this study, products are stored up to time t 3 ρ . Thus, during time t 1 ρ , the holding cost is calculated for all perfect and imperfect produced items. In time t 2 ρ , perfect, imperfect, and reworked items are produced and kept until all items are finished due to demand. Therefore, the holding cost for the entire cycle is
h ( I i n + τ d t 1 ρ ) t 1 ρ 2 + ( I i n + I p e r ) t 2 ρ 2 + I t 3 ρ 2 .

4.4. Reworking Cost

Due to different unavoidable situations, the process may be shifted to an out-of-control process and produce imperfect items randomly. It is considered that τ percentage of total products are defective. To control waste, those imperfect items need to be reworked. Thus, total reworkable items are τ [ ( 1 ρ ) Q g ] , which are reworked with unit reworking cost C R . Therefore, the total reworking cost of the defective items is mathematically presented as
D g C R τ [ ( 1 ρ ) Q g ] Q g .

4.5. Holding Cost of the Reworked Products

In time t 2 ρ , reworking of the defective items is performed. Therefore, the holding cost for those reworkable items can be calculated by calculating the total generated defective items in time t 1 ρ , which is E [ τ ] t 1 ρ . Those defective items are kept for the time t 2 ρ . Now, if h 1 is the unit holding cost for those defective items, then the holding cost of the reworked products is
h 1 τ d t 1 ρ t 2 ρ 2 .

4.6. Fixed Outsourcing Cost

A percentage of the total batch size is outsourced to overcome shortages. In this study, a fixed cost J ρ is considered for the outsourced items. Since ρ percentage of products are outsourced, thus, this will affect the setup cost of the production system. Thus, a negative scaling parameter ϕ ( 1 ϕ 0 ) is linked with the fixed outsourcing cost. Thus, mathematically fixed outsourcing costs can be calculated as
J ρ = ( 1 + ϕ ) K .

4.7. Variable Outsourcing Cost

A variable cost for outsourcing is incorporated in this study, which is lined up with the production rate. It is obvious that variable outsourcing cost is higher than the UPC. A scaling parameter μ ( μ 0 ) is considered to set the scale for the variable outsourcing cost, which implies the variable outsourcing cost is higher than the in-house production cost. If W ρ is the per-unit variable outsourcing cost, then the total variable outsourcing cost can be calculated as
W ρ ( ρ Q g ) = ( 1 + μ ) ρ Q g C ( P g , G ) .

4.8. Carbon Emissions Cost

Carbon emission and related costs due to the setup of the process and outsourcing: If K c amount of carbon is emitted for the setup of the process and C c is the carbon tax, then the carbon emission cost for setup is
( K c + ( 1 + ϕ ) K c ) C c = ( 2 + ϕ ) K c C c ,
Carbon emission and related costs due to production and reworking: If C p c and C R c amounts of carbon are emitted for the manufacturing and reworking processes and C c is the carbon tax, then the carbon emission cost for manufacturing and remanufacturing is
( C R c τ + C p c ) [ ( 1 ρ ) Q g ] C c ,
Carbon emission and related costs due to holding perfect and remanufactured products: If h c and h 1 c amount of carbon is emitted for holding perfect and remanufactured items and C c is the carbon tax, then the carbon emission cost for holding is
h 1 c τ d t 1 ρ 2 ( t 2 ρ ) + h c I i n + τ d t 1 ρ 2 ( t 1 ρ ) + I i n + I p e r 2 ( t 2 ρ ) + I 2 ( t 3 ρ ) C c .

4.9. Investment in Carbon Emission Reduction Technology

To reduce the carbon emission, some investment is incorporated in this study. As per assumption 5, the total investment for carbon emission reduction can be formulated as
m ( 1 e v I g ) + I g .
Therefore, the total carbon emission cost with investment can be written as
[ ( 2 + ϕ ) K c + ( C R c x + C p c ) [ ( 1 ρ ) Q g ] + h 1 c τ d t 1 ρ 2 ( t 2 ρ ) + h c [ I i n + τ d t 1 ρ 2 ( t 1 ρ ) + I i n + I p e r 2 ( t 2 ρ ) + I 2 ( t 3 ρ ) ] ] C c ( 1 m ( 1 e v I g ) ) + I g .
In this study, demand is considered as selling-price-dependent. Therefore, one can calculate the revenue by multiplying unit selling price and demand, i.e., the revenue of the system is S g D g . Now, the expected total profit of the system T E P ( P g , Q g , S g , G , I g ) can be calculated by subtracting the expected total cost from the revenue, which can be expressed by the following expression:
T E P ( P g , Q g , S g , G , I g ) = Revenue E [ T C U ( P g , Q g , S g , G , I g ) ] = S g ( ξ 1 ξ 2 S g + ξ 3 G ξ 4 ) [ ξ 1 ξ 2 S g + ξ 3 G ξ 4 Q g [ K + Q g γ 1 G 2 2 + γ 2 P g + γ 3 P g ( 1 ρ ) + K ( 1 + ϕ ) + Q g ρ ( 1 + μ ) γ 1 G 2 2 + γ 2 P g + γ 3 P g + Q g ( 1 ρ ) ζ C R + h 1 ζ 2 Q g 2 ( 1 ρ ) 2 2 R P + h ζ ( 1 ρ ) 2 Q g 2 2 P g + Q g 2 h 2 ρ ζ ( 1 ρ ) ( D g R P ) R P 1 D g ( 1 ρ ) P g + ( 1 ρ ) ( P g ( 1 ζ ) D g ) D g + ( ( 2 + ϕ ) K c + ( C R c ζ + C p c ) [ ( 1 ρ ) Q g ] + h 1 c ζ 2 Q g 2 ( 1 ρ ) 2 2 R P + h c ζ ( 1 ρ ) 2 Q g 2 2 P g + Q g 2 h c 2 ρ ζ ( 1 ρ ) ( D g R P ) R P 1 D g ( 1 ρ ) P g + ( 1 ρ ) ( P g ( 1 ζ ) D g ) P g D g ) C c ( 1 m ( 1 e v I g ) ) ] + I g ] ,
where E [ τ ] = ζ .

5. Solution Methodology

A closed-form solution is obtained for the complex, highly nonlinear Equation (11). To obtain a closed-form solution to this nonlinear problem, the most popular classical optimization technique is utilized. As per the necessary condition of the classical optimization, the analytic value of the decision variables is obtained by taking the first-order partial derivative of Equation (11) with respect to S g , Q g , P g , G, and I g . Therefore, optimal analytic values, i.e., S g * , Q g * , P g * , G * , and I g * , can be calculated by the following expression:
Q g * = 2 ( 2 + ϕ ) ( K + K c Ω 4 ) Ω 6 ,
P g * = Ω 5 γ 3 Q g ( 1 + μ ρ ) ,
I g * = 1 v l n m v C c D g Ω 2 Q g ,
S g * = Ω 8 R P P g ξ 2 ( 2 R P P g + Q g ξ 2 ( h + h c Ω 4 ) ( 1 ρ ) 2 ζ ) ,
f ( G * ) = γ 1 ( 1 + μ ρ ) D g ξ 3 ξ 4 ( S g Ω 7 Ω 9 ) 1 ξ 4 2 .
The detailed calculations are provided in Appendix A.
To prove the sufficient condition for the optimality, one needs to show the principal minors of the following Hessian matrix are negative-definite.
2 T E P ( . ) Q g 2 2 T E P ( . ) P g Q g 2 T E P ( . ) S g Q g 2 T E P ( . ) G Q g 2 T E P ( . ) I g Q g 2 T E P ( . ) Q g P g 2 T E P ( . ) P g 2 2 T E P ( . ) S g P g 2 T E P ( . ) G P g 2 T E P ( . ) I g P g 2 T E P ( . ) Q g S g 2 T E P ( . ) P g S g 2 T E P ( . ) S g 2 2 T E P ( . ) S g G 2 T E P ( . ) S g I g 2 T E P ( . ) Q g G 2 T E P ( . ) P g G 2 T E P ( . ) S g G 2 T E P ( . ) G 2 2 T E P ( . ) G I g 2 T E P ( . ) Q g I g 2 T E P ( . ) P g I g 2 T E P ( . ) S g I g 2 T E P ( . ) G I g 2 T E P ( . ) I g 2 .
Due to the highly complex nonlinear equations, the values of the principal minors at the optimum value of the decision variables are calculated numerically in the next section.

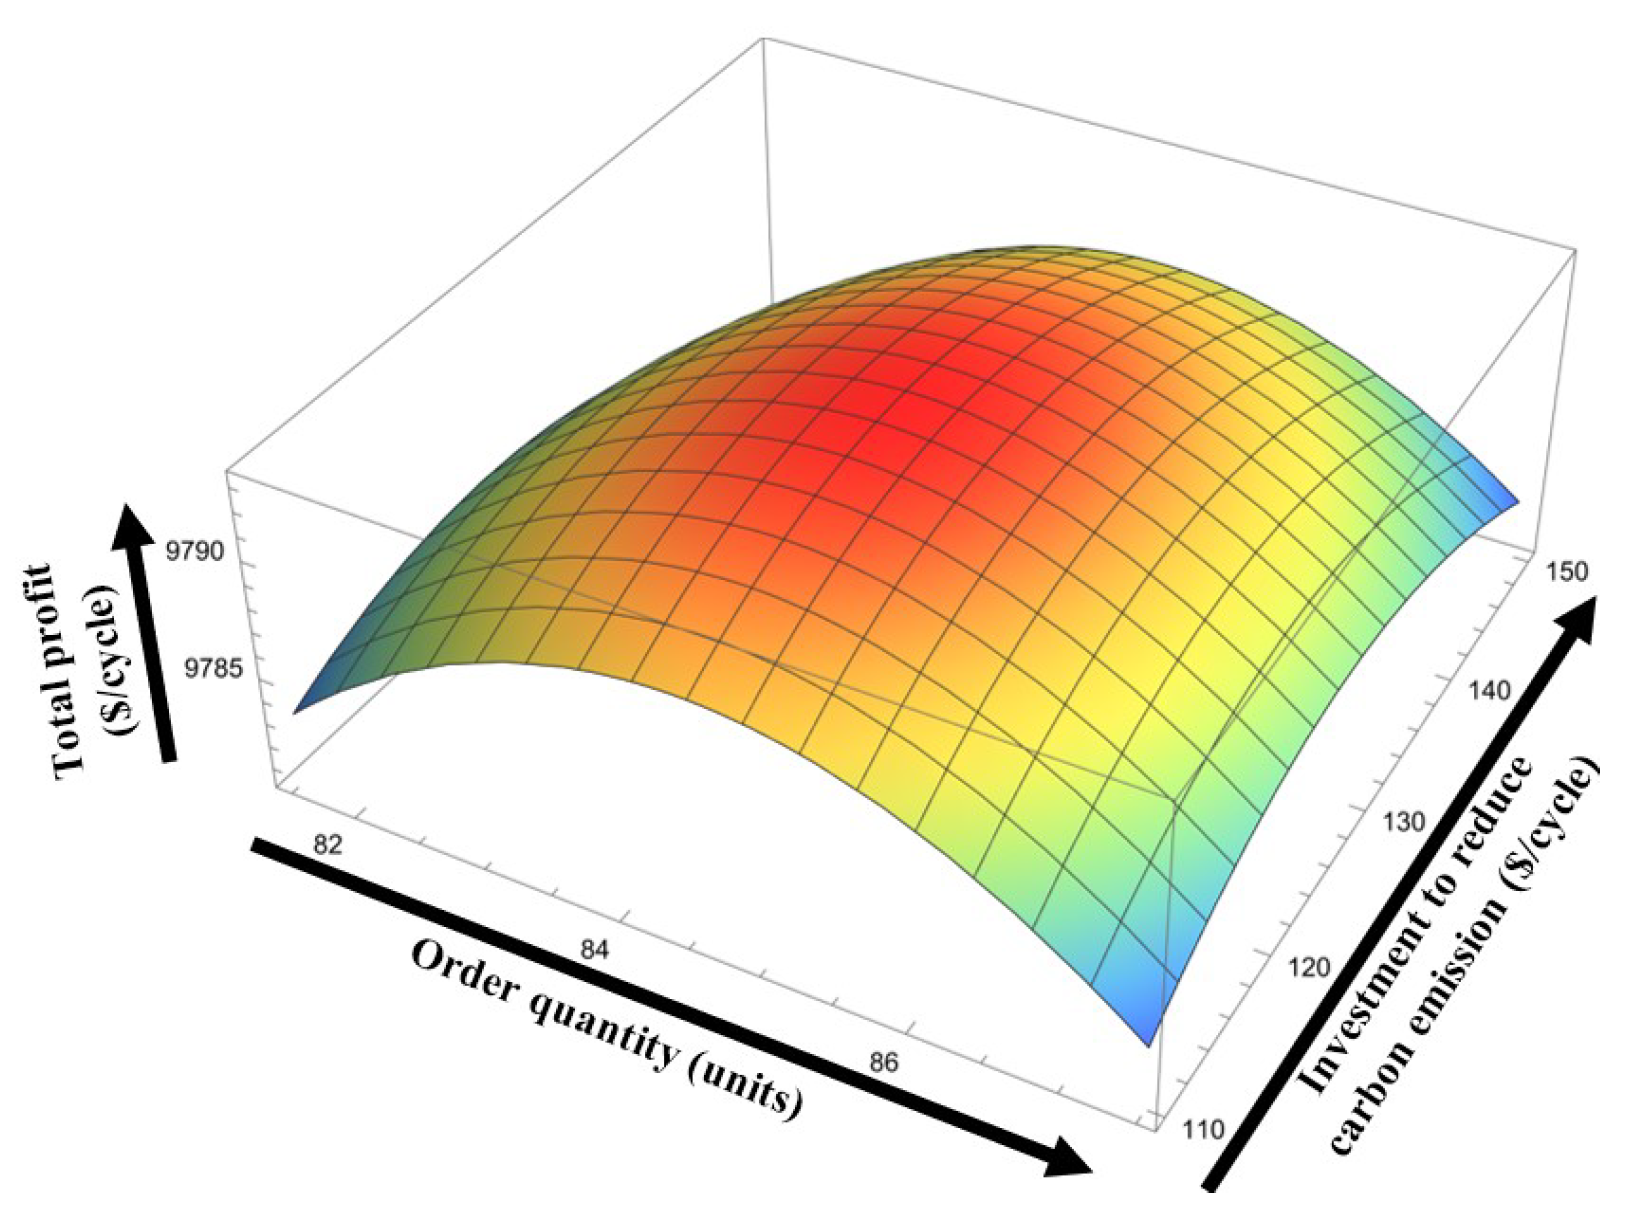
6. Numerical Experiment

To validate the findings of this study and to show the applicability of this study in reality, some numerical examples and special cases are presented in this section. The effectiveness of greenness, outsourcing, and flexibility in the production process are discussed in this section through some numerical values. The parametric values for different parameters are taken from the models of Bachar et al. [29] and Dey et al. [63] at there best fit. We used Mathematica 11.0 with Windows 11, 16 GB of RAM, and 512 GB of SSD to find the optimum value of decision variables.
The defective generation rate is random. Therefore, we considered four different types of distribution (chi-square distribution, uniform distribution, triangular distribution, and reciprocal distribution) and calculated the profit for those distributions. The formula to calculate the defective rates for different distributions can be obtained in the Dey et al. [8] model. The optimum results under partial outsourcing and different special cases are provided in the following sections.

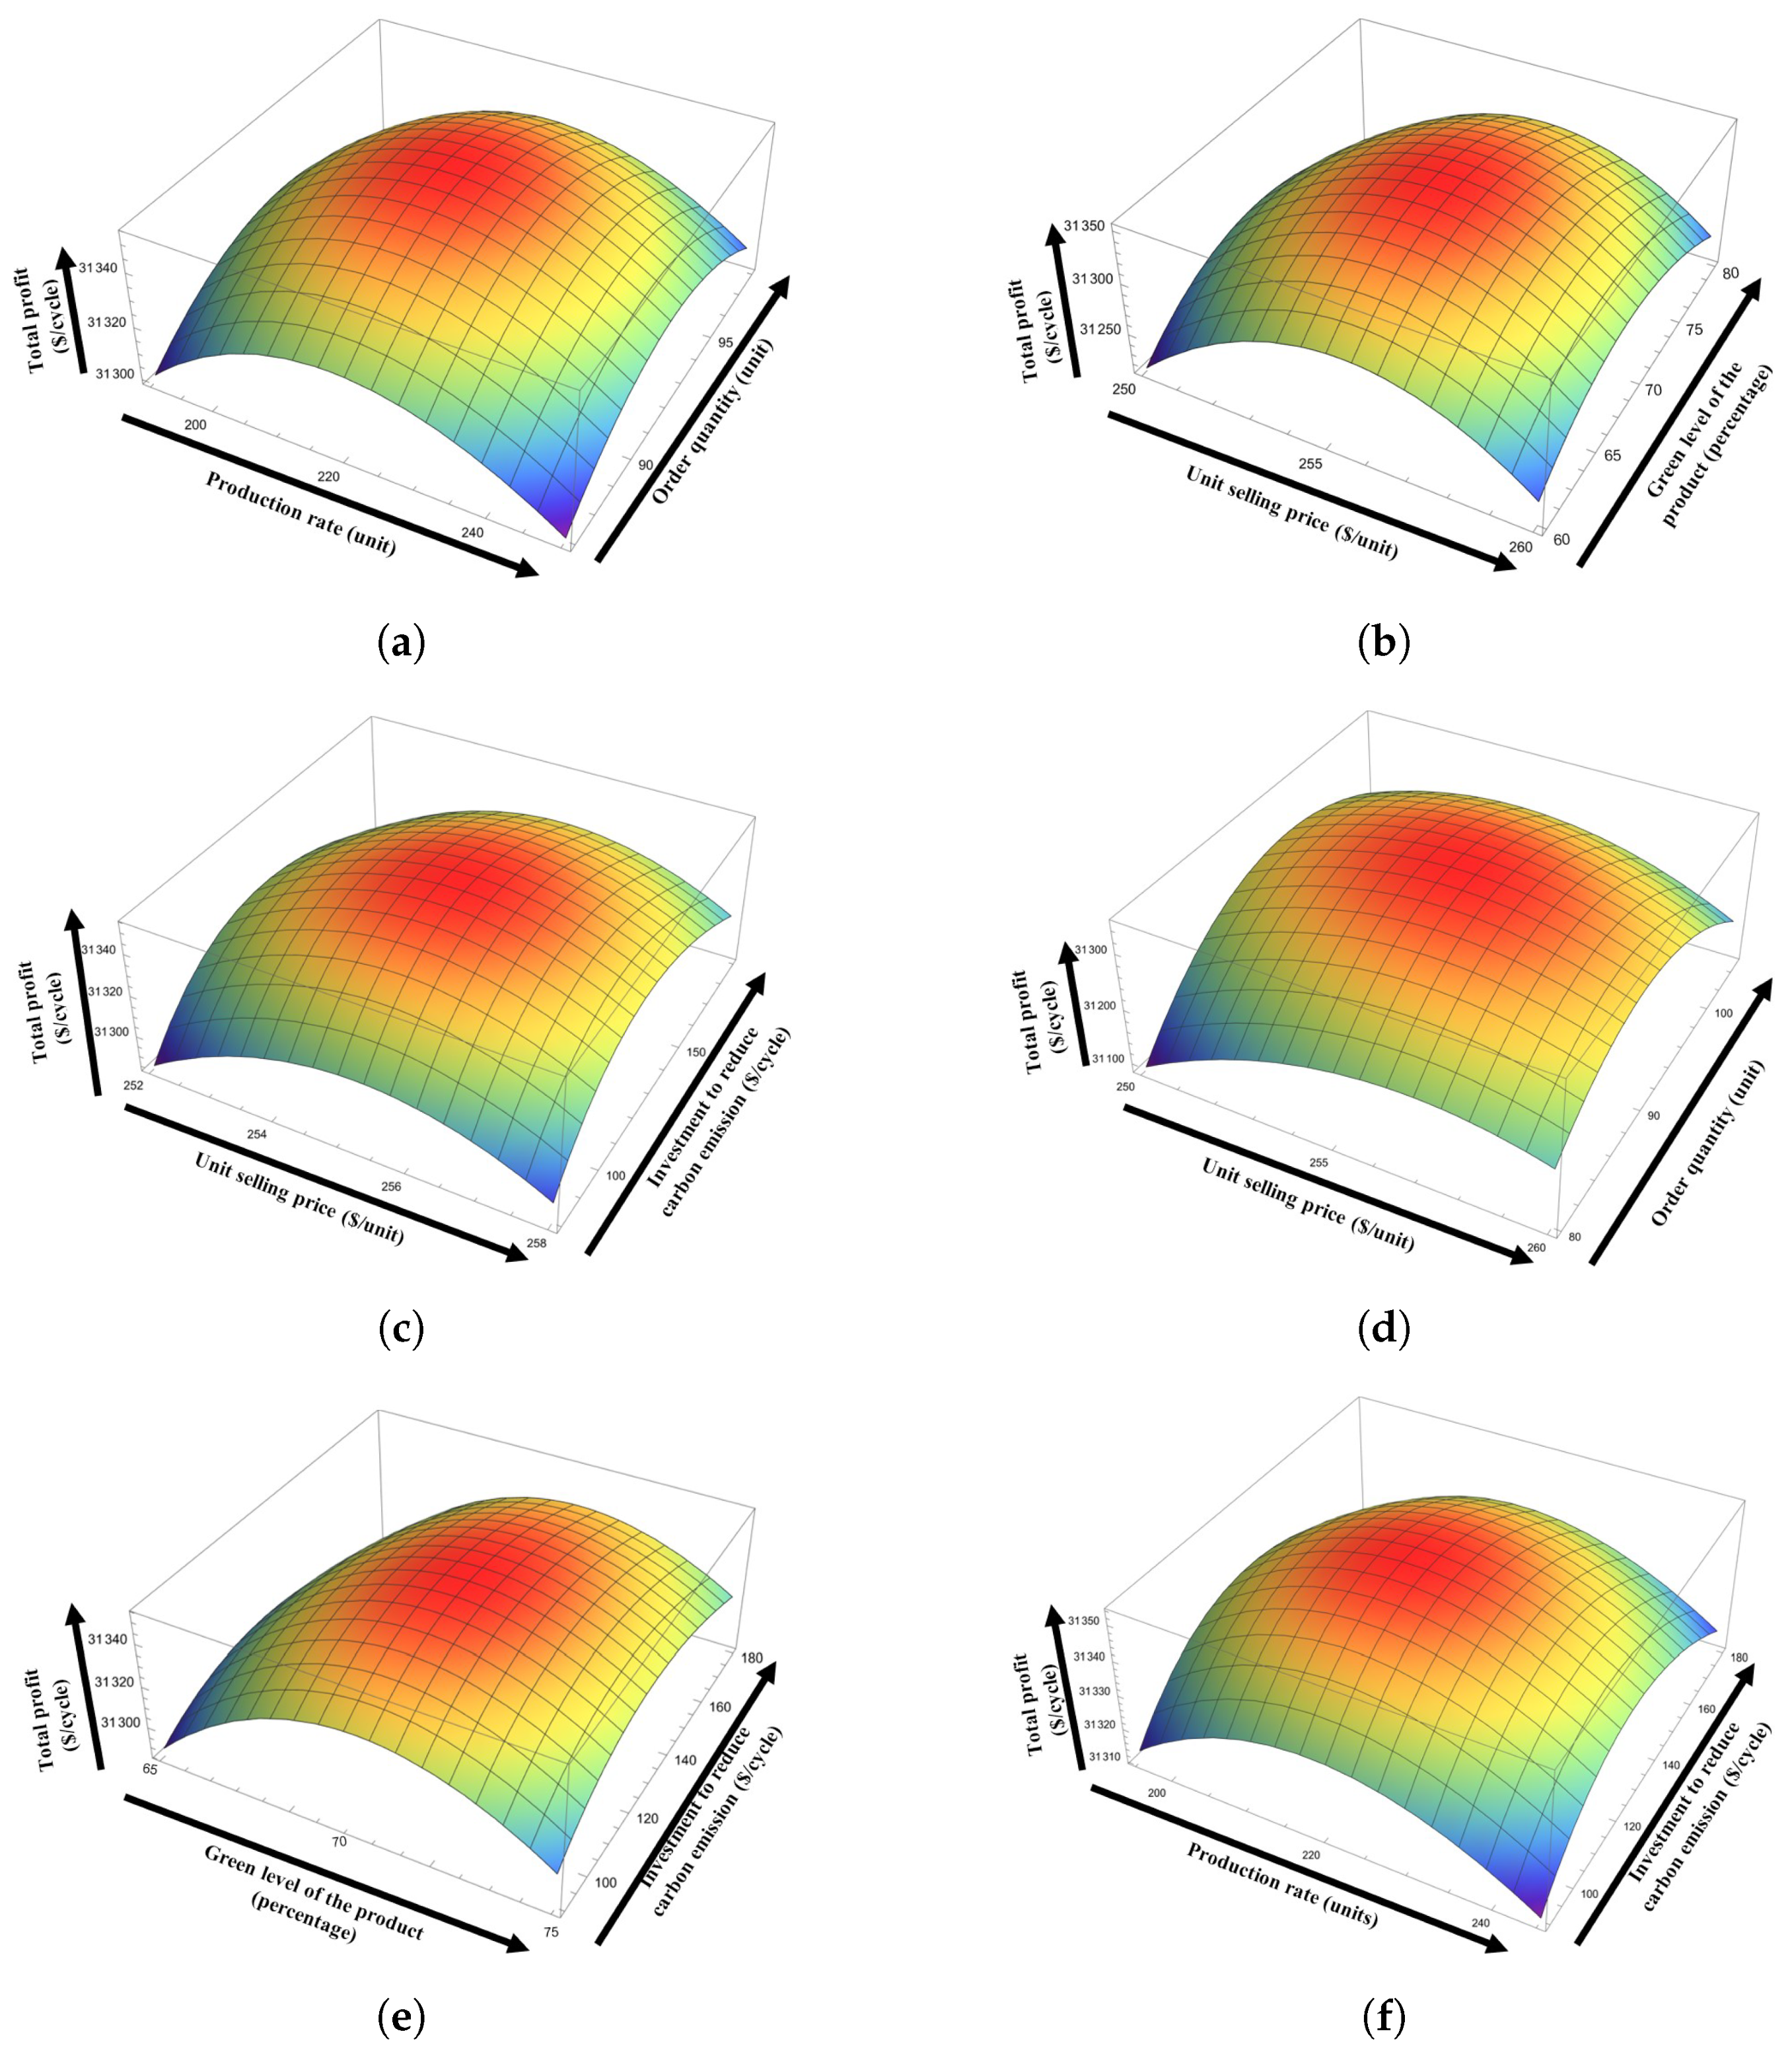
6.1. Numerical Analysis under Partial Outsourcing for Different Distributed Defective Rates

In this section, we discuss the optimum results for this study under partial outsourcing and different distributed random defective rates. The values of the parameters are related to the parameters of fixed outsourcing ( ϕ ) = 0.3 , variable outsourcing ( μ ) = 0.3 , material cost ( γ 1 ) = 460, development cost ( γ 2 ) = 920, and tool/die cost ( γ 3 ) = 0.02 , where holding cost for the reworkable items ( h 1 ) = USD 8 /unit/unit time, holding cost for perfect quality items ( h ) = USD 5 /unit/unit time, reworking rate ( R P ) = 95 units/unit time, setup cost ( K ) = USD 1000 per setup, reworking cost ( C R ) = USD 45 per unit, fixed market demand ( ξ 1 ) = 1100 units, scaling parameter related to price sensitivity ( ξ 2 ) = 3, scaling parameter related to GL of the product ( ξ 3 ) = 3, shape parameter related to GL of the product ( ξ 4 ) = 1.1 , outsourcing percentage ( ρ ) = 0.05 , carbon emitted due to setup of the process ( K c ) = 30 kg/setup, carbon emitted due to manufacturing ( C P c ) = 25 kg/cycle, carbon emitted due to remanufacturing ( C R c ) = 15 kg/cycle, carbon emitted due to holding of the perfect items ( h c ) = 2 kg/cycle, carbon emitted to hold imperfect items ( ( h 1 c ) ) = 3 kg/cycle, carbon tax ( C c ) = USD 3 per kg per cycle, carbon reduction technology efficiency ( m ) = 0.02 , and carbon emission reduction fraction ( v ) = 0.1 . The values of the parameters for the calculation of random defective rates are 0.035 for chi-square distribution, ( 0.03 , 0.07 ) for uniform distribution, ( 0.03 , 0.04 , 0.06 ) for triangular distribution, and ( 0.03 , 0.07 ) for reciprocal distribution.
By using the above parametric values, the profits of the production system under partial outsourcing are presented in Table 2. Since the generation rate of the defective item is random, thus, here we find the optimal values when the defective rate follows any one of the following distributions: chi-square, uniform, triangular, and reciprocal. From Table 2, it is clear that chi-square-distributed defective rates provide a more profitable result, which is USD 31 , 353.90 per cycle. The optimum profits for the other distributed defective rates are USD 31 , 018.00 , USD 31 , 108.80 , and USD 31 , 078.40 per cycle for uniform, triangular, and reciprocal distributed defective rates, respectively. It is also found that the optimum production rate is 220 units per time cycle, the optimum order quantity is near 92 units, the optimum GL is 70 % , the optimum selling price is USD 255 per unit, and investment for carbon emission reduction is USD 131 per cycle. However, those optimum values are a little bit changed for the triangular-distributed defective rates. Figure 2 is provided to show the concavity of the profit function with respect to different decision variables when the defective rate follows a chi-square distribution.
The values of the principal minors for the H 55 Hessian matrix at the optimum value of the decision variables are | H 11 | = 1.5465 < 0 , | H 22 | = 0.0987 > 0 , | H 33 | = 0.56969 < 0 , | H 44 | = 4849.85 > 0 , and | H 55 | = 367.353 < 0 . Since all principal minors are alternate in sign, i.e., the profit function is negative definite at the optimal values of the decision variable. Therefore, the obtained profit is globally maximum for the optimum values of the decision variables.

6.2. Special Cases

It is found from Table 2 that the chi-square-distributed defective rate provided more profitable results; thus, in this section, we provide several special cases under the consideration of the chi-square-distributed defective rate. The optimum values for different special cases are presented in Table 3.

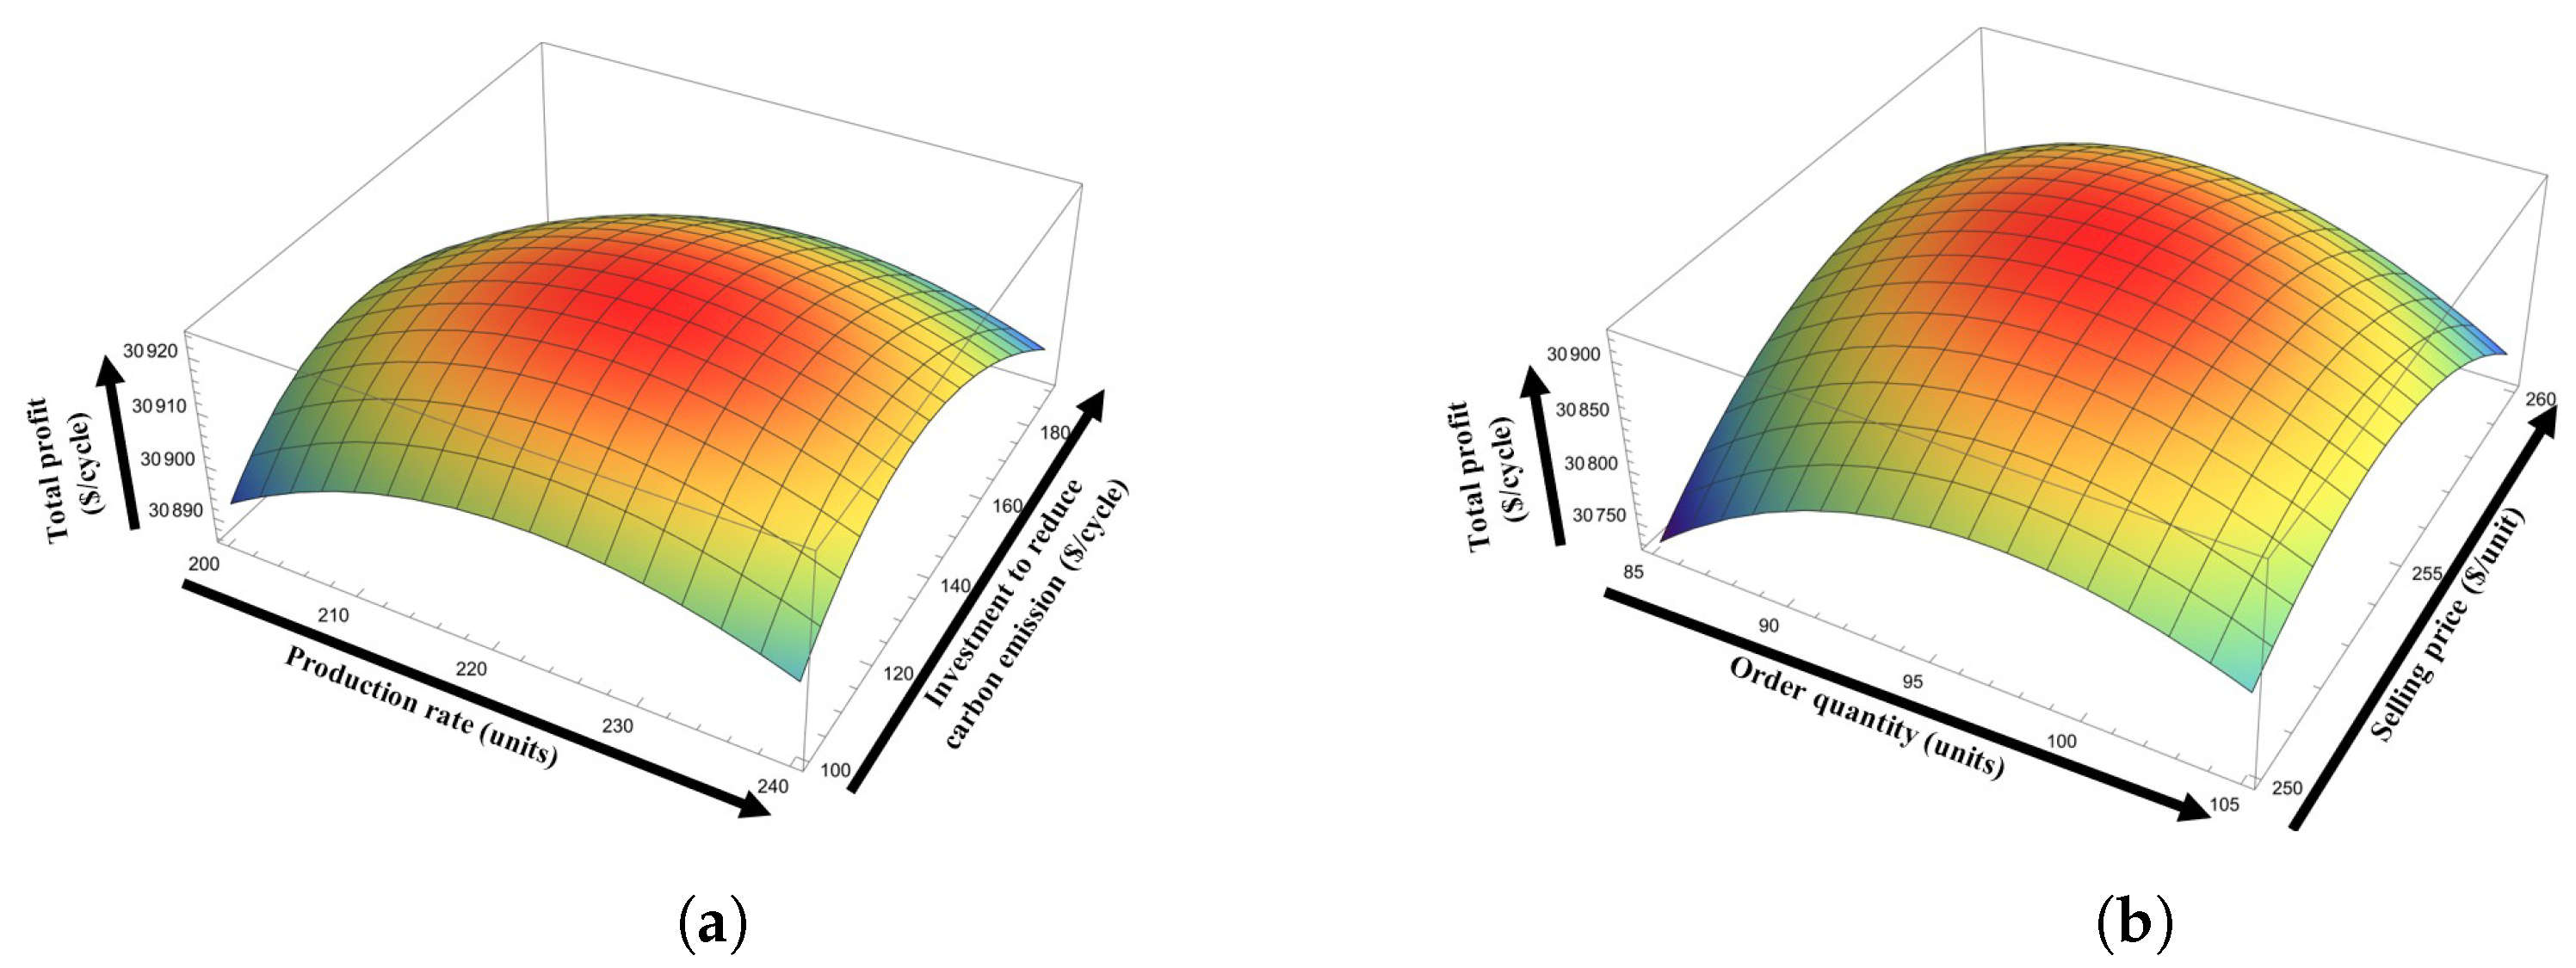
6.2.1. Results without Considering Outsourcing

In this special case, we found the optimum values under the consideration of total in-house production. In other words, no item was outsourced, all items were produced by the manufacturer itself since outsourcing costs are comparatively higher than the UPC. However, due to imperfect systems, defective items are generated randomly, which harms profit optimization. We put ρ = 0 , i.e., no item was outsourced, in the profit Equation (11), and with the help of the computer tool Mathematica 11.0, we obtained the result without considering outsourcing, which is presented in Table 3. The optimum profit without outsourcing is USD 30 , 924.00 per cycle with an optimum production rate of 222 units, and optimum order quantity of 94 units; optimum GL of the product is 70 % , optimum selling price is USD 255.25 per unit, and investment to reduce carbon emissions is USD 134.87 per cycle. Figure 3 is provided to show the concavity of the function without outsourcing graphically with respect to decision variables.

6.2.2. Results without Considering Investment for Carbon Emission Reduction

Carbon emission reduction for the production industry through some investment in technology is another contribution of this study. Investment in the reduction of carbon emissions makes the system environmentally sustainable. From Table 3, it is clear that investment in technology to reduce carbon emissions helps to increase the profit of the entire manufacturing system. The profit without investment in the technology to reduce carbon emission is USD 29 , 951.90 , which is lower than the original profit. In this case, the optimum production rate is 218 units, the optimum ordered quantity is 98 units, and the GL of the product is 68 % , which is less than the other cases. The optimum selling price is USD 251.58 per unit. Figure 4 is provided to show the concavity of the function without investment graphically concerning decision variables.

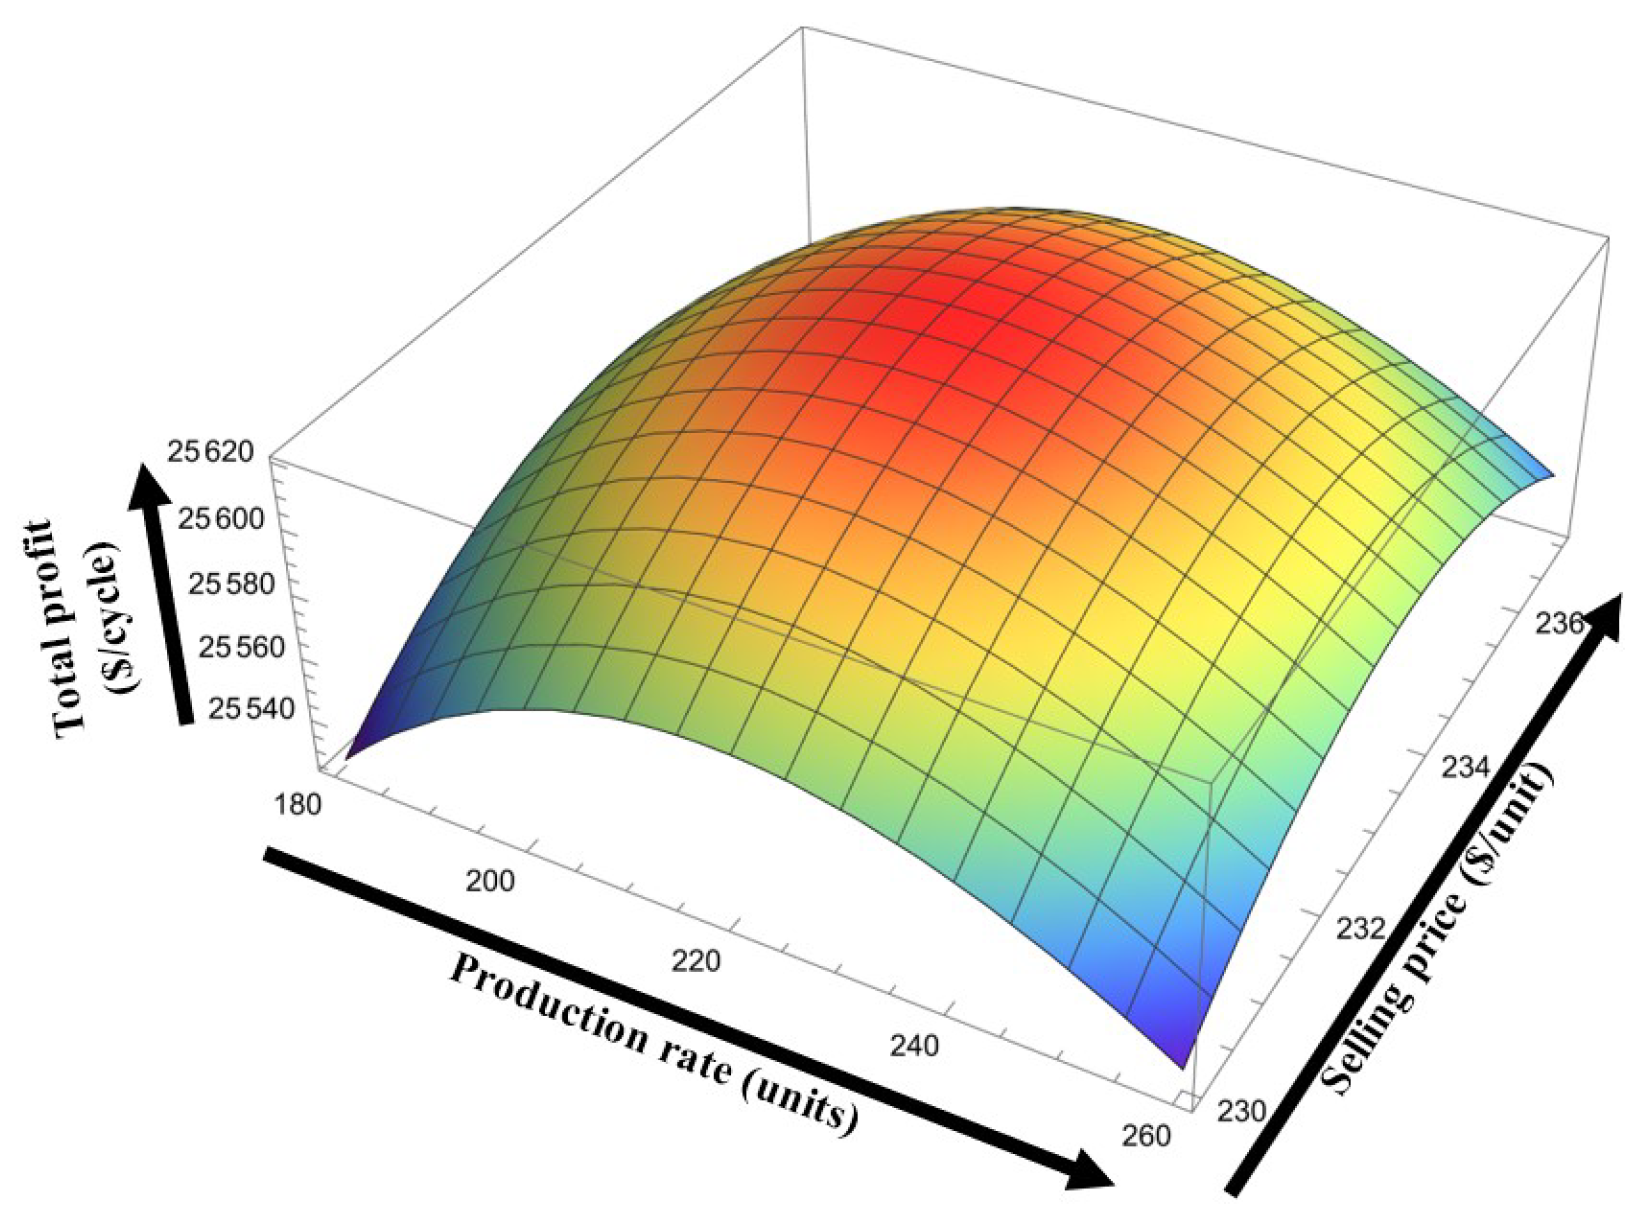
6.2.3. Results without Considering Green Level (GL)-Dependent Demand and Production Cost

The GL of the product is very crucial for production industries. In this study, GL-dependent demand and unit production rate are considered. Now, to show the effect of GL-dependent demand, we set ξ 3 = 0 and considered a fixed raw material cost for the unit production rate; the optimum profit is found in Table 3. In this case, the total profit is USD 25 , 619.70 per cycle time, whereas the optimum production rate is 217 units per time cycle, the optimum order quantity is 88 units, the selling price is USD 233.83 per unit, and the investment is USD 129.22 per cycle. Even though the selling price is cheaper compared to other cases due to not considering the GL of the product, the total profit is diminished. Figure 5 is provided to show the concavity of the function without GL-dependent demand and UPC graphically concerning decision variables.

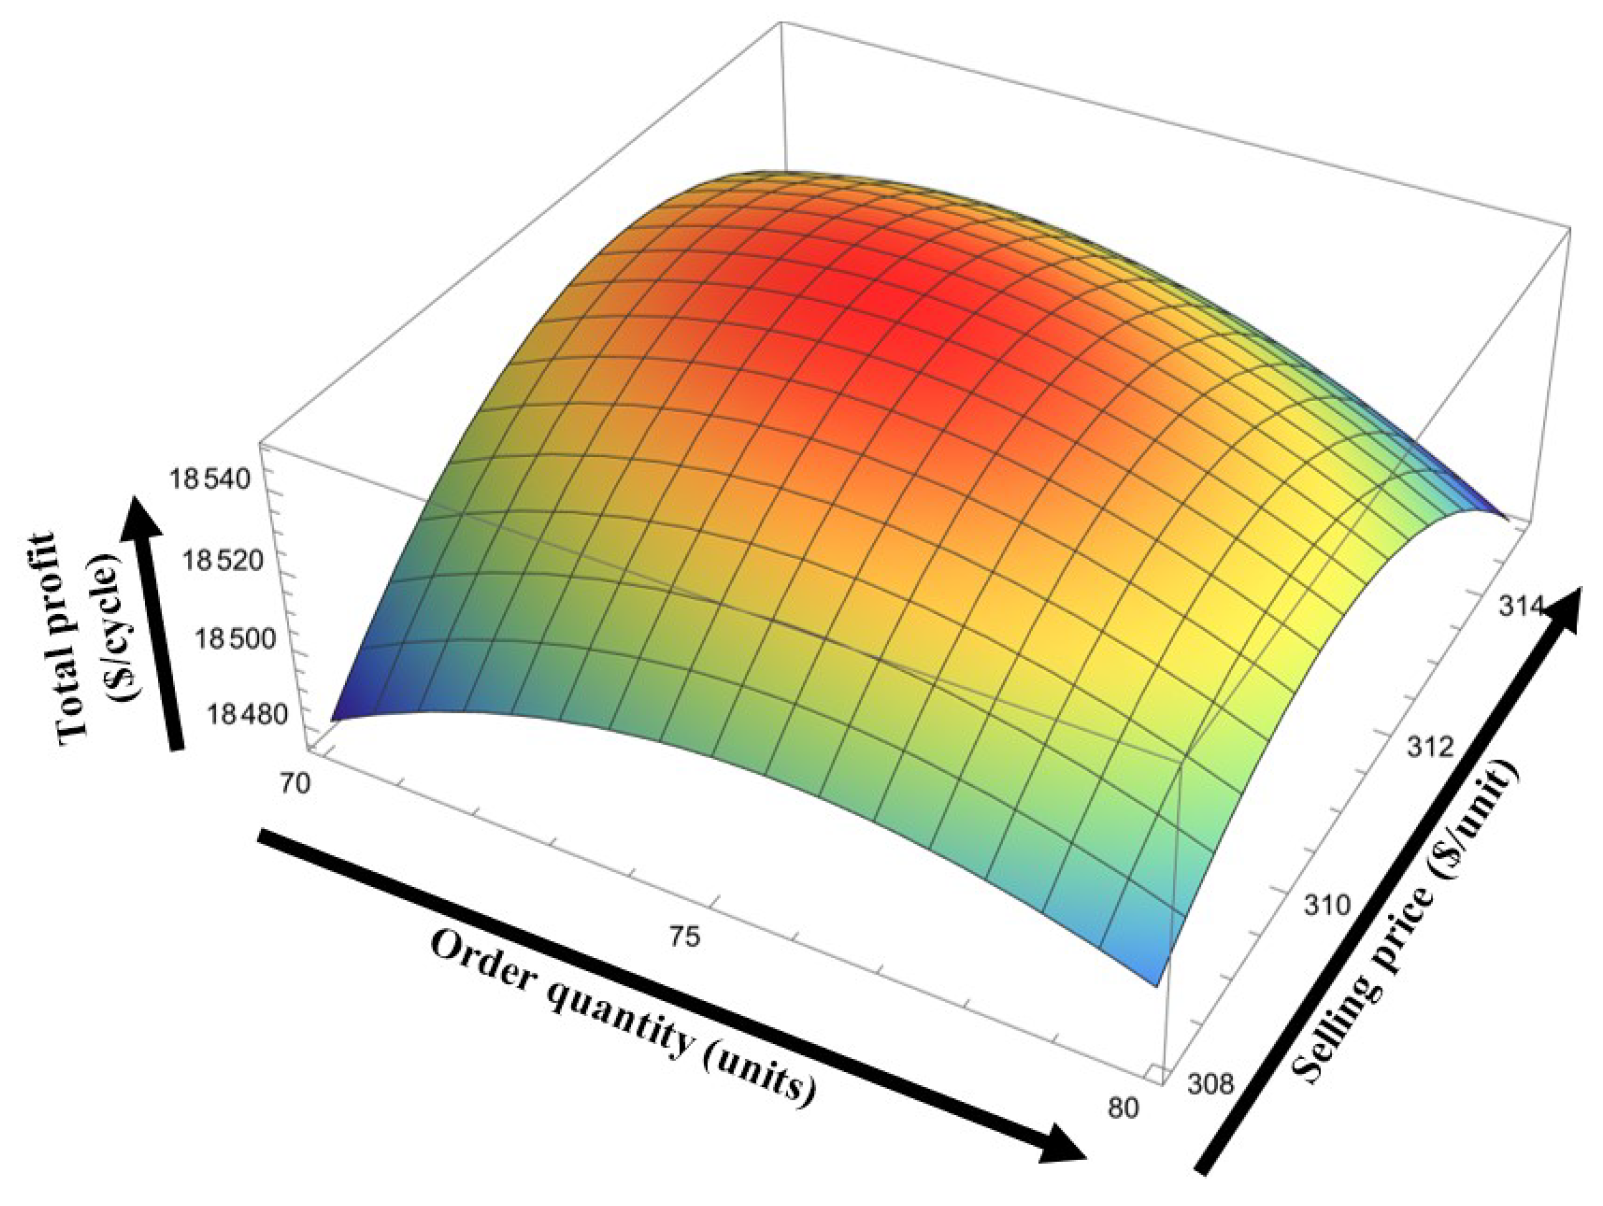
6.2.4. Results under Fixed Production Rate

Flexibility of the production system helps to optimize the profit of production industries. Instead of flexibility in the production rate, if one considers a fixed amount for the production rate, then profit will be diminished. If we consider a fixed production rate, i.e., P g = 250 units, then the total profit of the production system is USD 18 , 544.60 per time cycle, which is less compared to the other cases. In this case, the optimum order quantity is 73 units, the optimum GL of the product is 69 % , the optimum selling price of the product is USD 311.80 per unit, and the investment is USD 120.22 per cycle. Due to the fixed production rate, the unit price of the product increases, which creates a negative impact on the demand for the product. Figure 6 is provided to show the concavity of the function for fixed production rate concerning decision variables.

6.2.5. Results under Fixed Demand and Production Rate

Demand variability and production rate flexibility help to increase the profit of business industries. Due to fluctuation in the demand for a particular product, constant demand is harmful to optimizing the profit of these industries. Now, if we consider a fixed demand of D g = 470 units and a fixed selling price of USD 250 per unit, then the total profit of the system is USD 9793.41 per time cycle (see Table 3). The optimum value of the order quantity and investment is 84 units and USD 126.82 per cycle, respectively. Figure 7 is provided to show the concavity of the function for fixed demand and fixed production rate concerning decision variables.

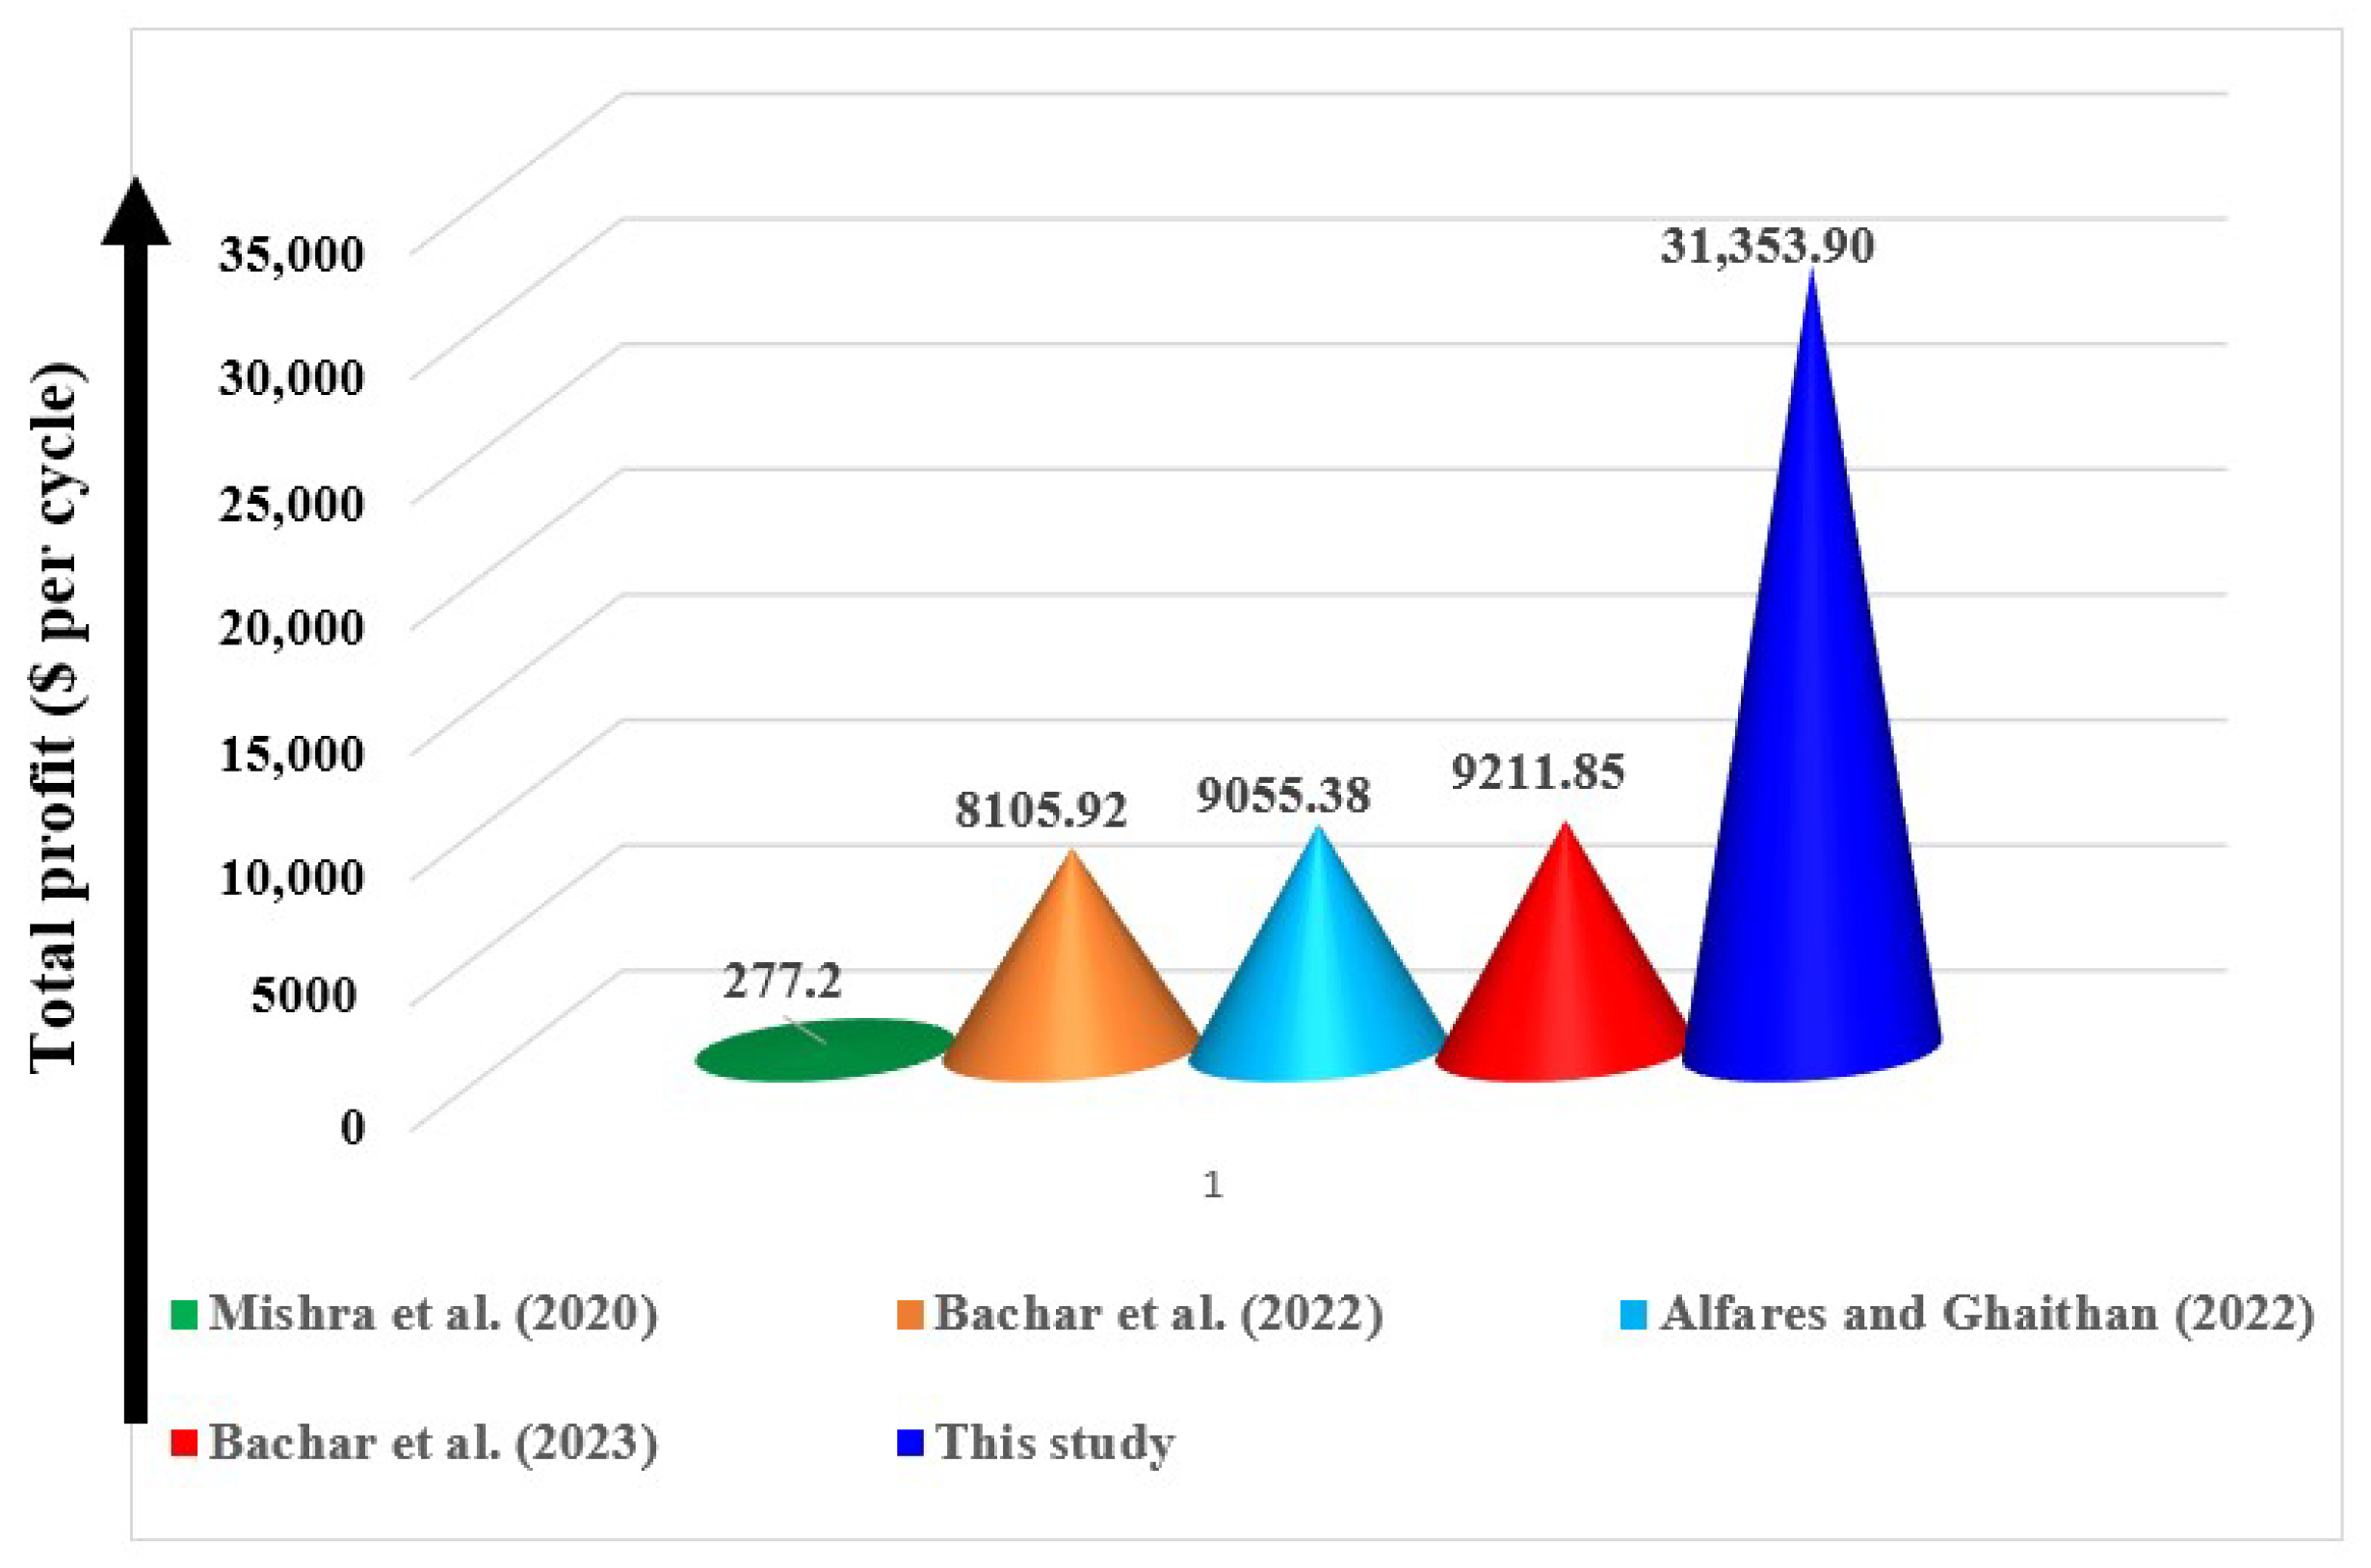
6.2.6. Discussions and Comparisons

From the above special cases, one can conclude that partial outsourcing and the GL of the product play a major role in determining the optimum profit under the consideration of imperfect production, where the generation rate of defective items is random and rework can be undertaken within the same production cycle. From the examples of the special cases, one can find that consideration of outsourcing policy helps to increase profit up to 1.40 % per production cycle for the industry. It is also clear that the GL-dependent demand and UPC help to optimize the profit by up to 22.38 % , whereas investment in technology to reduce carbon emission increases the profit by up to 7.02 % and reduces carbon emission by up to 700 kg per production cycle, which helps to enhance environmental greenness. On the other hand, consideration of VPR makes the system smart and helps to increase the profit up to 40.85 % , and consideration of demand variability and production variability helps to reduce 68.76 % of the cost for the business industries. Thus, the application of the product’s GL- and price-dependent demand with partial product outsourcing, VPR, and investment in technology to reduce carbon emissions makes a sustainable production process with optimized profit.
This model may converge with some previous studies if one ignores some concepts. A graphical representation based on the profit from previous studies is presented in Figure 8.
From Figure 8, it is clear that due to several realistic assumptions, the present study provides more profit compared to the existing literature. The following observations can be made from Figure 8:
  • By considering green technology investment, a production–inventory system was formulated by Mishra et al. [58]. However, they ignored the concept of variable demand and flexibility in the production rate. Moreover, they considered shortage instead of partial outsourcing.
  • In a similar direction, a production–inventory model by considering reworking, partial outsourcing, and price-dependent variable demand was proposed by Bachar et al. [17]. The profit for their system was USD 8105.92 per cycle. However, they ignored the concept of GL for the demand variability and did not consider the investment to reduce carbon emissions. By considering the GL of the product and carbon emission reduction investment, the present study provides about 74 % higher profit. Thus, the GL of the product is very crucial nowadays for retailing industries.
  • Alfares and Ghaithan [32] developed a production–inventory system under production-rate, demand, and cost variability. However, in their model, they do not consider the concept of partial outsourcing, reworking, or investment to reduce carbon emissions and the GL of the product. The profit for their system was USD 9055.38 per cycle. However, due to consideration of partial outsourcing, GL of the product, and investment to reduce carbon emissions, the present study provides better profit.
  • This study converges with the Bachar et al. [29] model if one ignores the GL of the product and investment to reduce carbon emission. The profit for the Bachar et al. [29] model was USD 9211.85 per cycle under the consideration of VPR, price-dependent demand, and partial outsourcing. However, GL-dependent UPC and investment to reduce carbon emissions help to gain more profit for this current study.
Therefore, consideration of an imperfect system with reworking, partial outsourcing, investment in technology to reduce carbon emissions, VPR, selling price, and GL-dependent demand make the present study more economically, environmentally, and socially sustainable.

7. Sensitivity Analysis

In this section, a sensitivity analysis of the parameters is discussed. By changing a single parameter at a time within the range ± 50 % while the remaining parameters are fixed, a sensitivity analysis is performed. The percentage change in the total profit with respect to a parameter is calculated by the formula change in profit original profit × 100 % to show the sensitivity of the parameter.

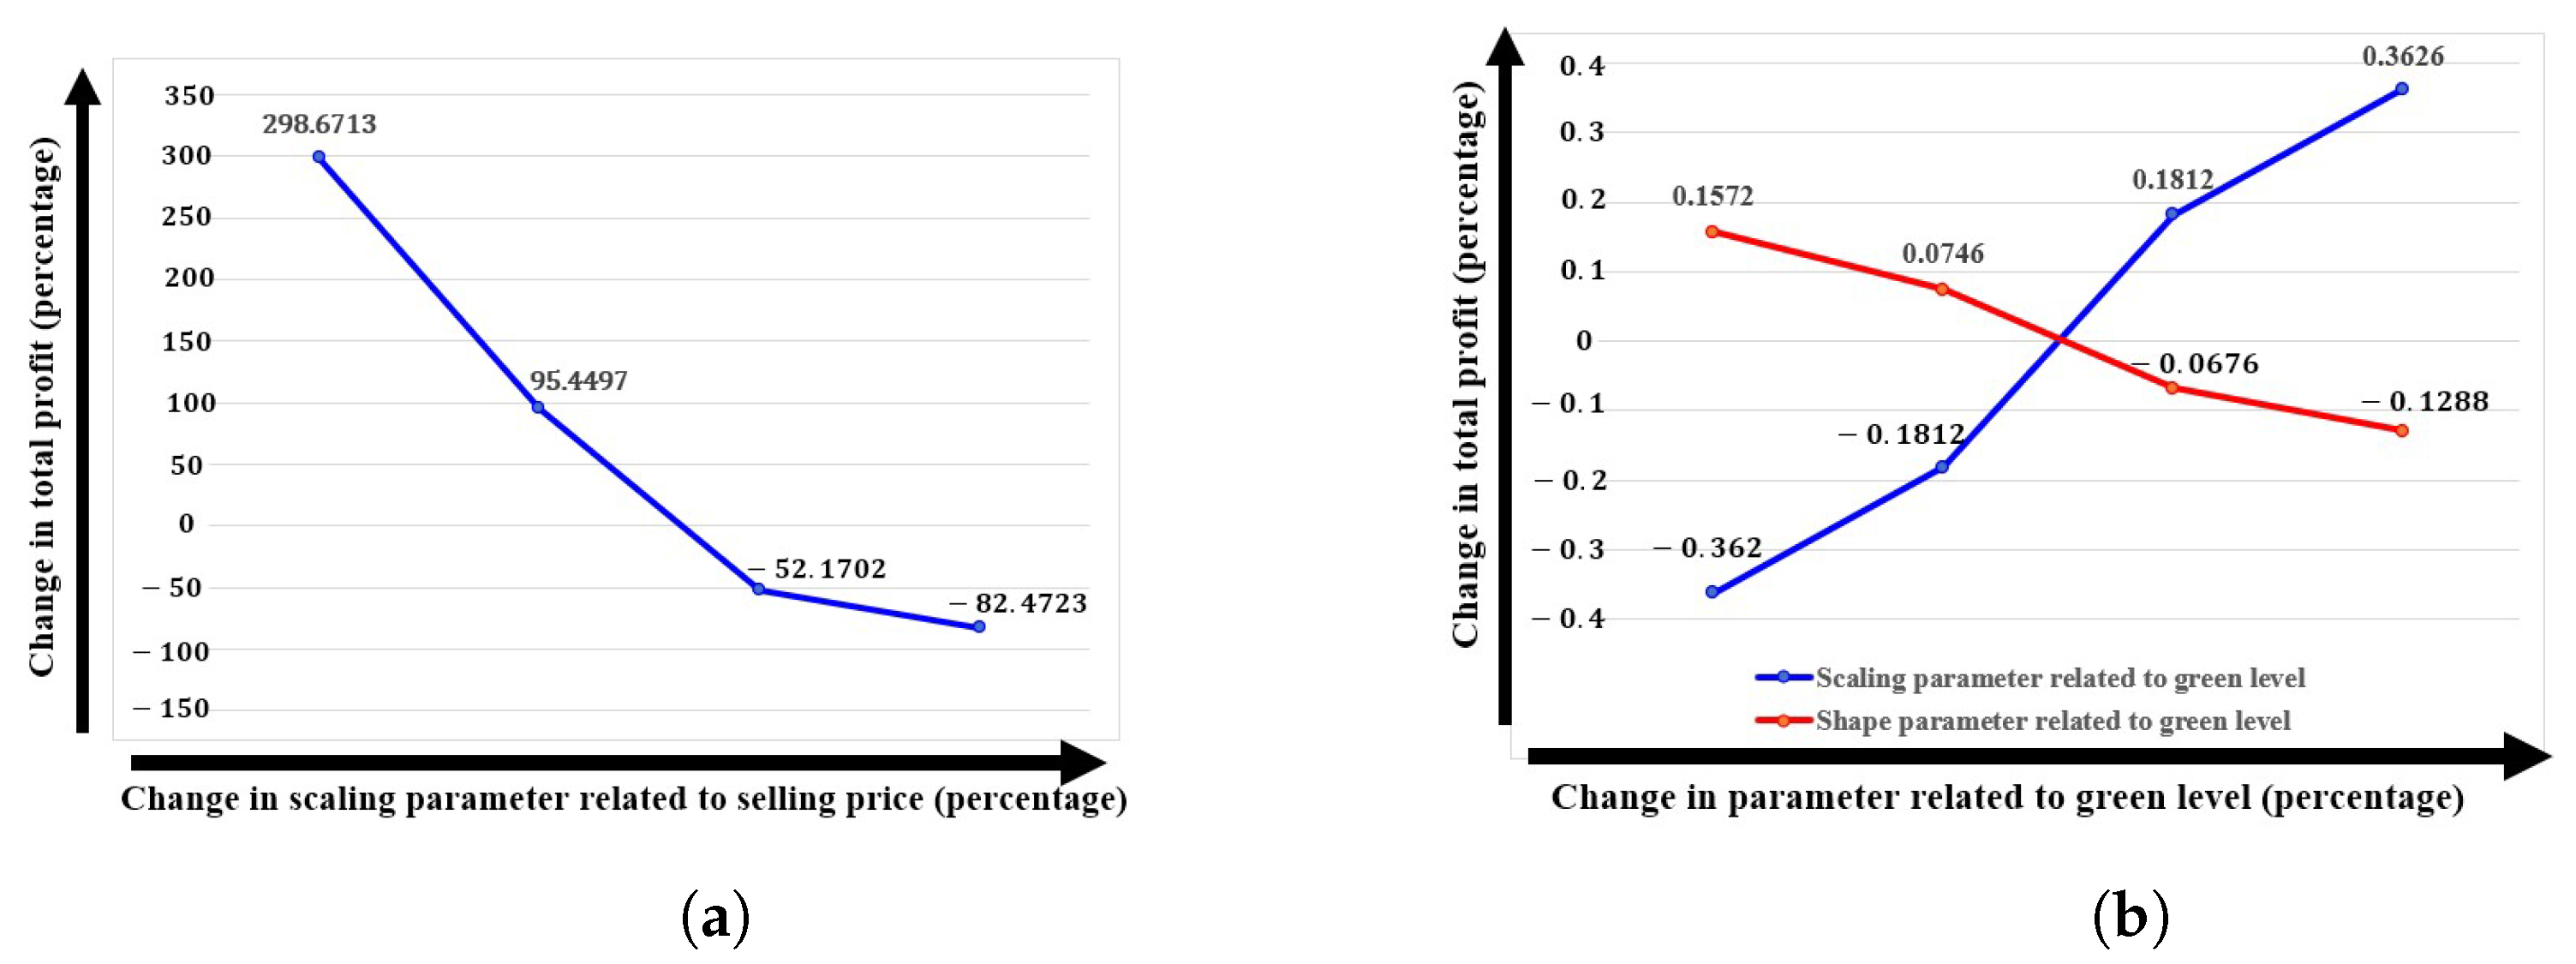
7.1. Sensitivity of Parameters Related to Demand

For retailing and supply chain systems, the role of the demand is very important. In this study, we considered a selling price and product’s GL-dependent variable market demand. Making decisions on the product’s demand is a very important and crucial task for industry managers. Managers can make a proper decision for the market demand. The managers can make the right decision about the selling price and GL of the product to maximize the profit for their industries. It is obvious the increment in demand helps to generate more revenue; in other words, the profit of the business sector will be enhanced. Thus, increment or decrement in demand is very crucial for business industries. From the sensitivity analysis, it was found that a 25 % reduction in base demand reduces the profit up to 77 % , whereas a 25 % increment in base demand helps to increase the profit by 119 % , and a 50 % increment helps to increase profit up to 279 % .
The scaling parameter related to the selling price is very sensitive. In traditional retailing, an increment in the unit selling price reduces the product’s demand and profit. Figure 9 shows that a 50 % reduction in the selling-price-related scaling parameter helps to increase total profit up to 298 % , whereas a 50 % increment reduces the profit by 82 % . The parameter related to the GL is less sensitive, and 25 % and 50 % increments in the scaling parameter related to the GL increase total profit by 0.18 % and 0.36 % , respectively, whereas 25 % and 50 % reductions in the scaling parameter related to GL reduce total profit by 0.18 % and 0.36 % , respectively. On the other hand, an increment in the shape parameter related to the GL is harmful to profit optimization. The profit will reduce by 0.06 % and 0.13 % when the shape parameter related to the GL increases by 25 % and 50 % , respectively. Consequently, 25 % and 50 % reductions in shape parameters increase the profit up to 0.07 % and 0.16 % , respectively.

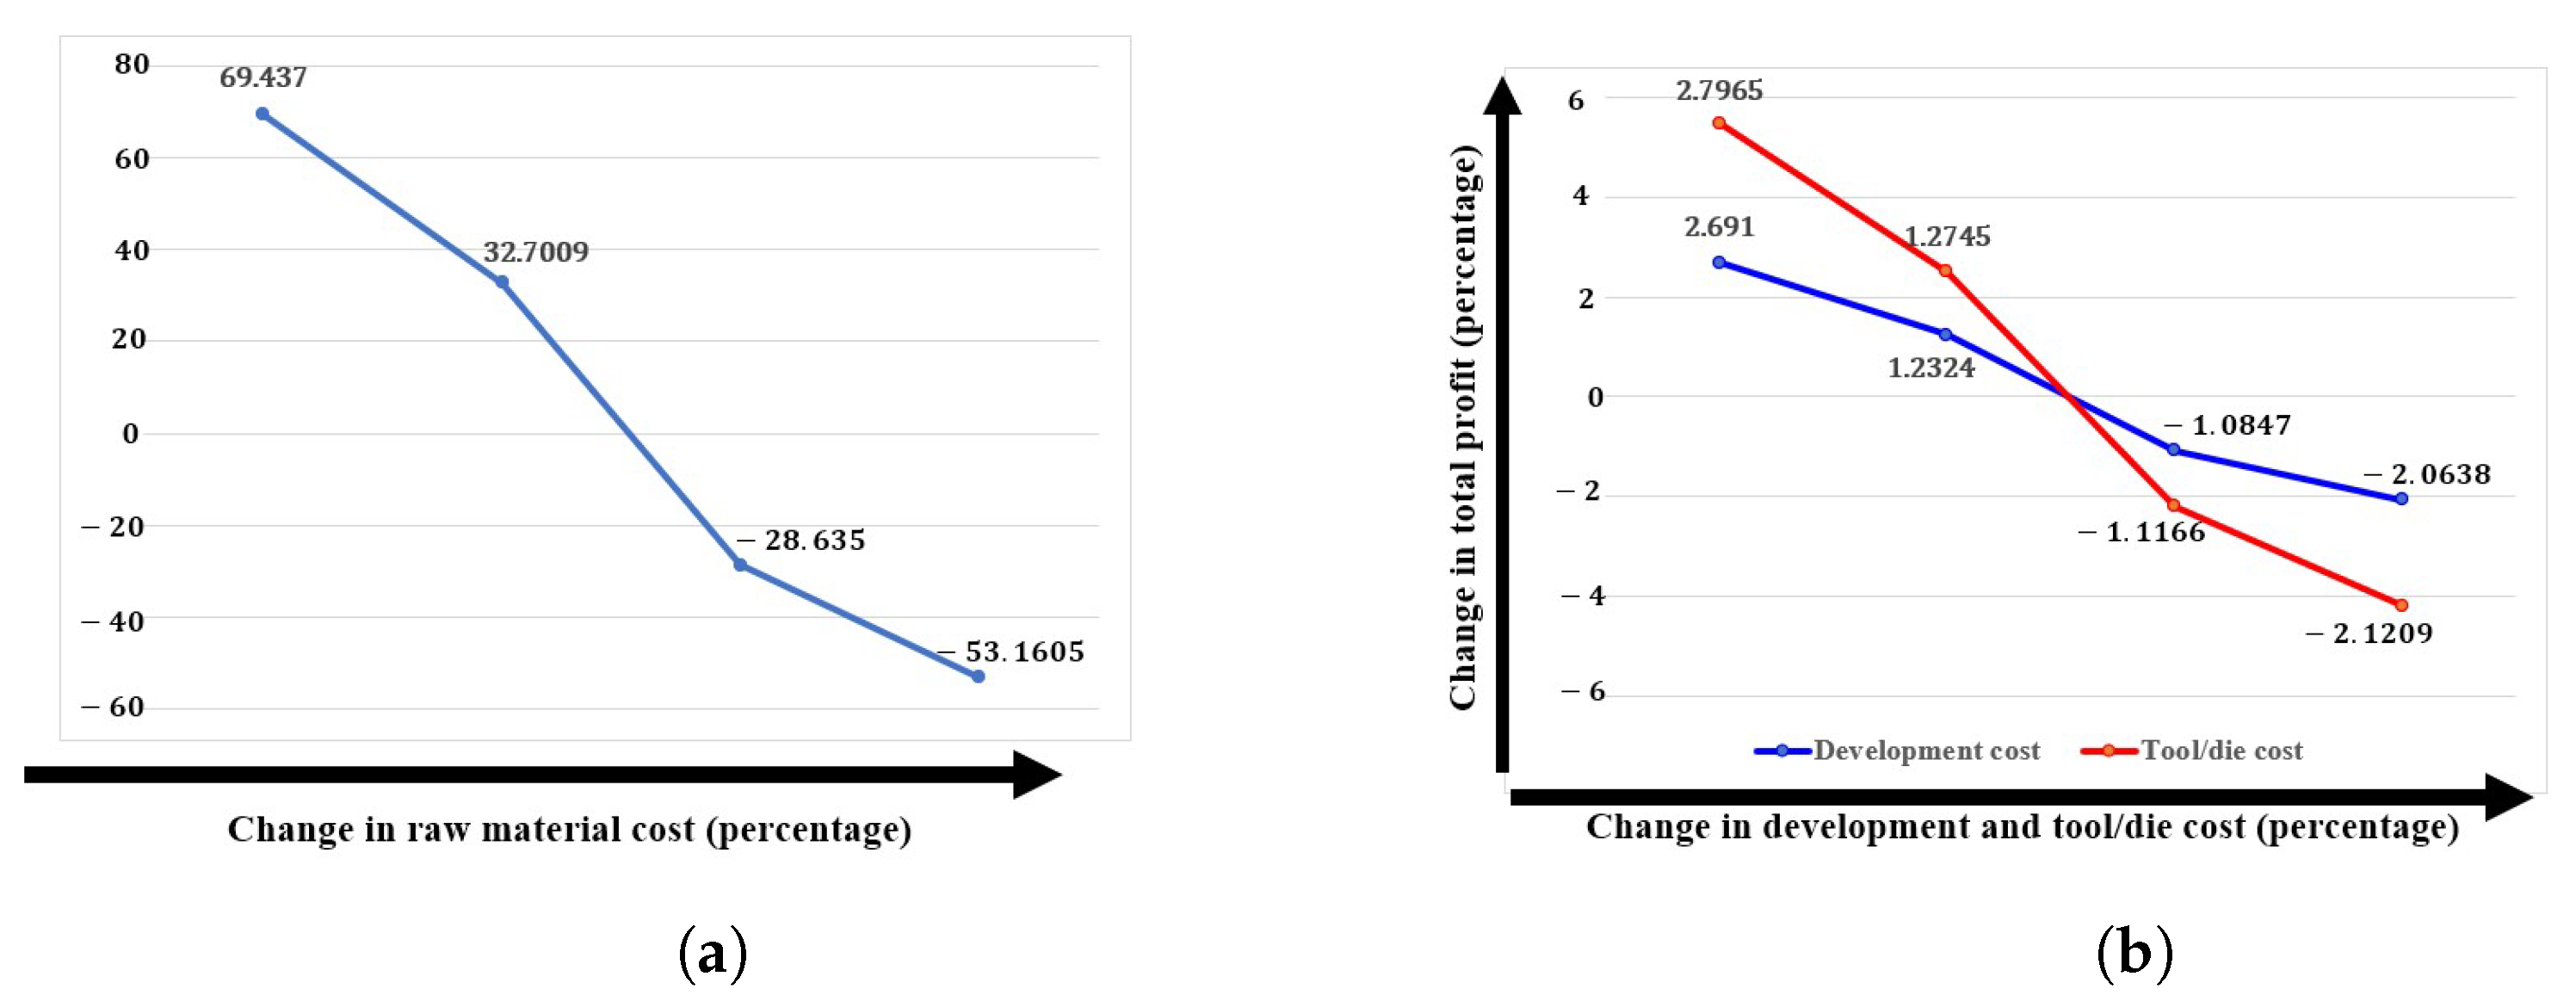
7.2. Sensitivity of Parameters Related to Unit Production Cost (UPC)

The importance of the unit production or manufacturing cost for business industries is unavoidable. In this study, GL-dependent UPC is considered. Flexibility in the production process is another key parameter for profit optimization. In traditional systems, a fixed number of products are produced all the time, which may create a huge amount of waste or create shortages based on low or high demand. Thus, proper prediction of the production rate is a very important task for industry managers. The raw material is one of the most important parameters for the production house. Thus, an increment in raw material costs is harmful to these industries. From Figure 10, one can find that 25 % and 50 % increments in raw material cost reduce the profit by 28 % and 53 % . Conversely, a 25 % and 50 % reduction in raw material cost increases the profit by 32 % and 69 % , respectively. On the other hand, reduction in the development and tool/die costs is beneficial for industries. The profit will increase by 2.69 % , 2.80 % , 1.23 % , and 1.27 % if one reduces development and tool/die costs by 50 % and 25 % , respectively. Similarly, if one increases the development and tool/die cost by 25 % and 50 % , then the total profit will reduce by 1.08 % , 1.12 % , 2.06 % , and 2.12 % , respectively (see Figure 10).

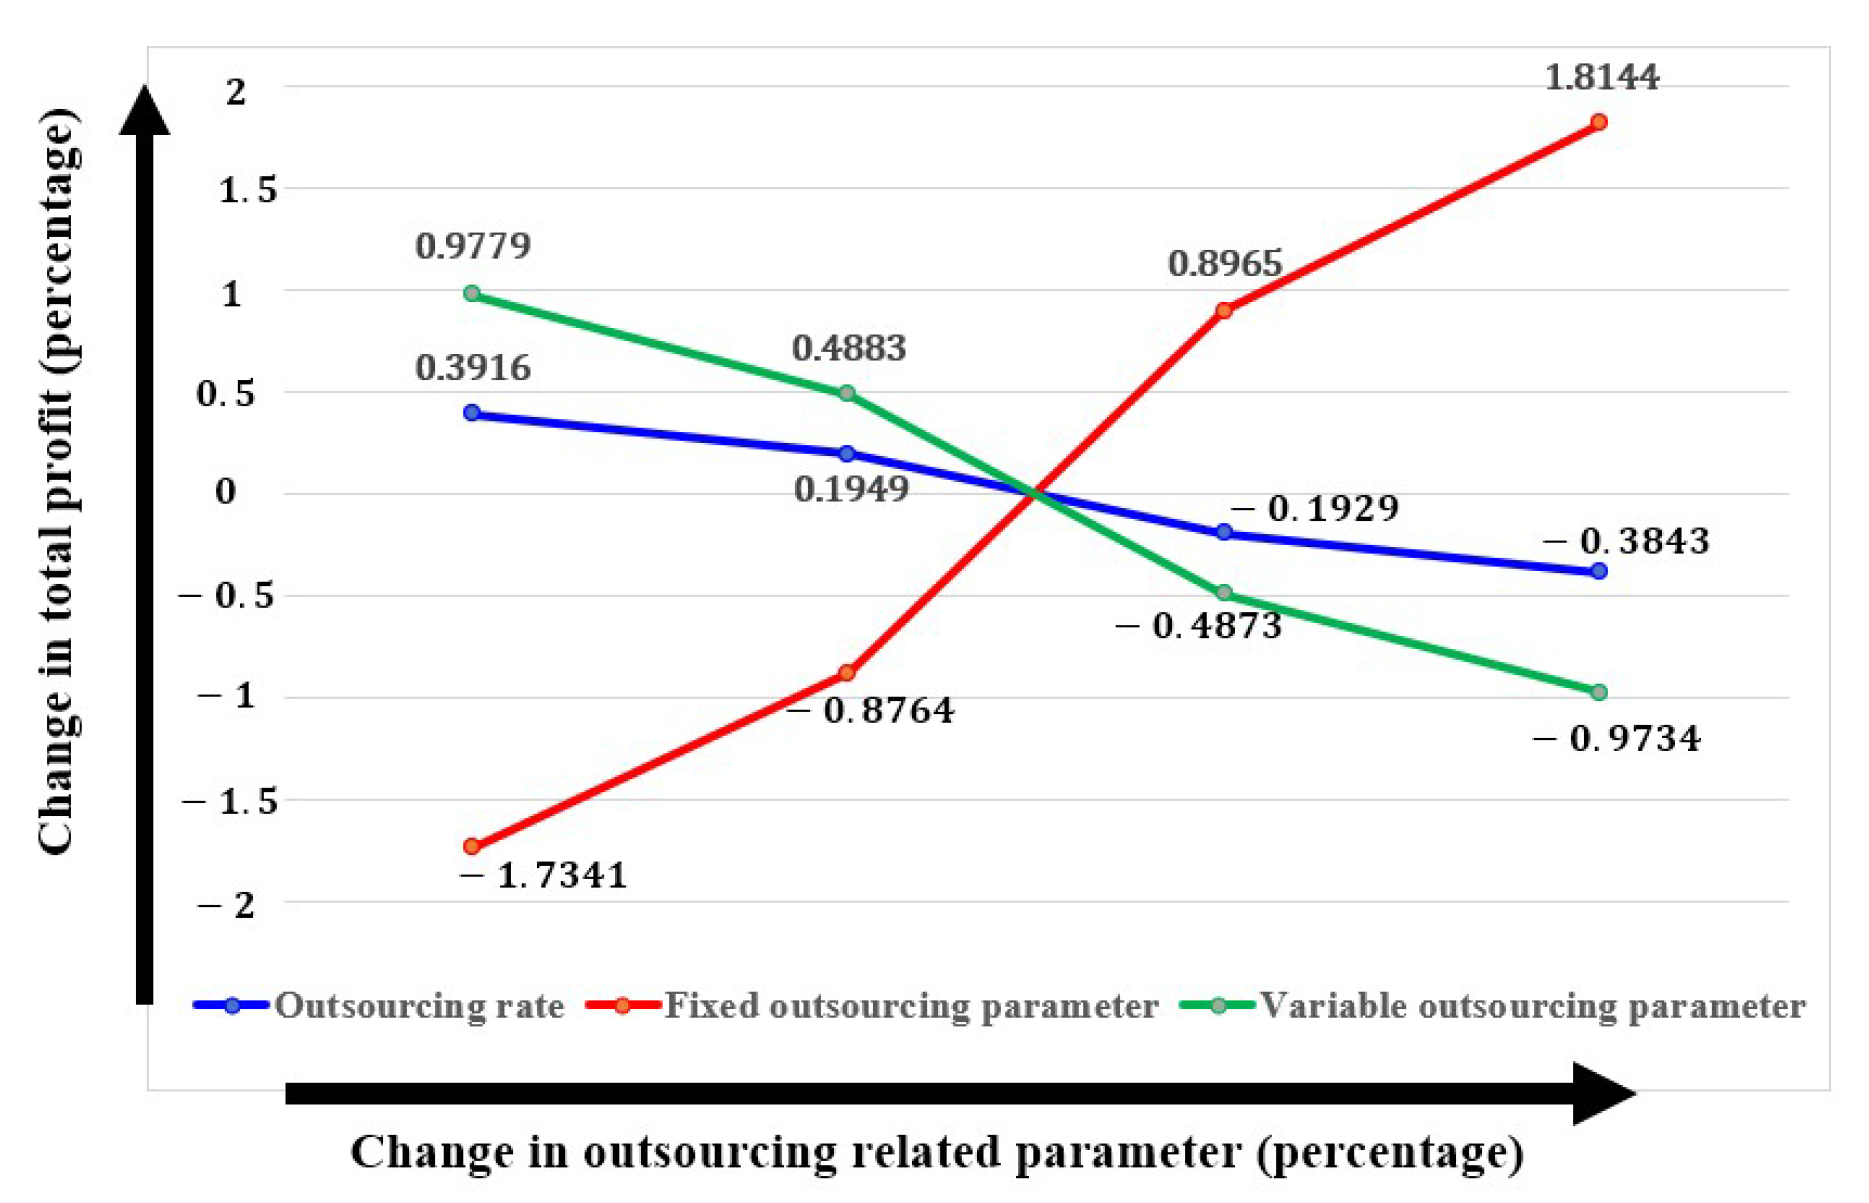
7.3. Sensitivity of the Parameters Related to Outsourcing on Total Profit

Outsourcing is another important contribution to this study. Outsourcing allows companies to be flexible in how they manage their resources. When demand changes or problems come up in the system, companies can easily change the resources they outsource to meet their needs. This ability to change is an important advantage for managers. It helps companies react quickly to changes in the market without having to pay for permanent staff. However, being a successful manager depends on choosing the right vendors and having strong communication. Finding trustworthy outsourcing partners who can handle the challenges of a flawed production system is very important. Setting up clear rules and goals for how work should be performed and how it will be measured can help make sure that the work being performed by an outside company matches the goals of the main business. From Figure 11, one can conclude that the parameter related to fixed outsourcing cost is a bit more sensitive compared to the variable outsourcing cost parameter. Reduction in fixed outsourcing reduces profit. A 25 % and 50 % increment in the parameter related to fixed outsourcing cost increases the total profit by 0.89 % and 1.81 % , respectively. Conversely, 25 % and 50 % reductions in the parameter related to fixed outsourcing costs reduce the total profit by 0.88 % and 1.73 % , respectively. On the other hand, a 25 % and 50 % increment in the parameter related to variable outsourcing cost reduces total profit by 0.48 % and 0.97 % , respectively. Conversely, 25 % and 50 % reductions in the parameter related to fixed outsourcing costs increases total profit by 0.49 % and 0.98 % , respectively.
The rate of percentage of outsourcing is a bit sensitive in profit optimization. Since outsourcing costs are a bit high compared to in-house production, thus, reduction in the percentages of the outsourcing amount will be beneficial for industries. A 25 % and 50 % reduction in the outsourcing amount percentage will help to increase the profit by 0.19 % and 0.39 % . Consequently, a 25 % and 50 % increment in the outsourcing amount percentage will reduce the profit by 0.19 % and 0.38 % , respectively (see Figure 11).

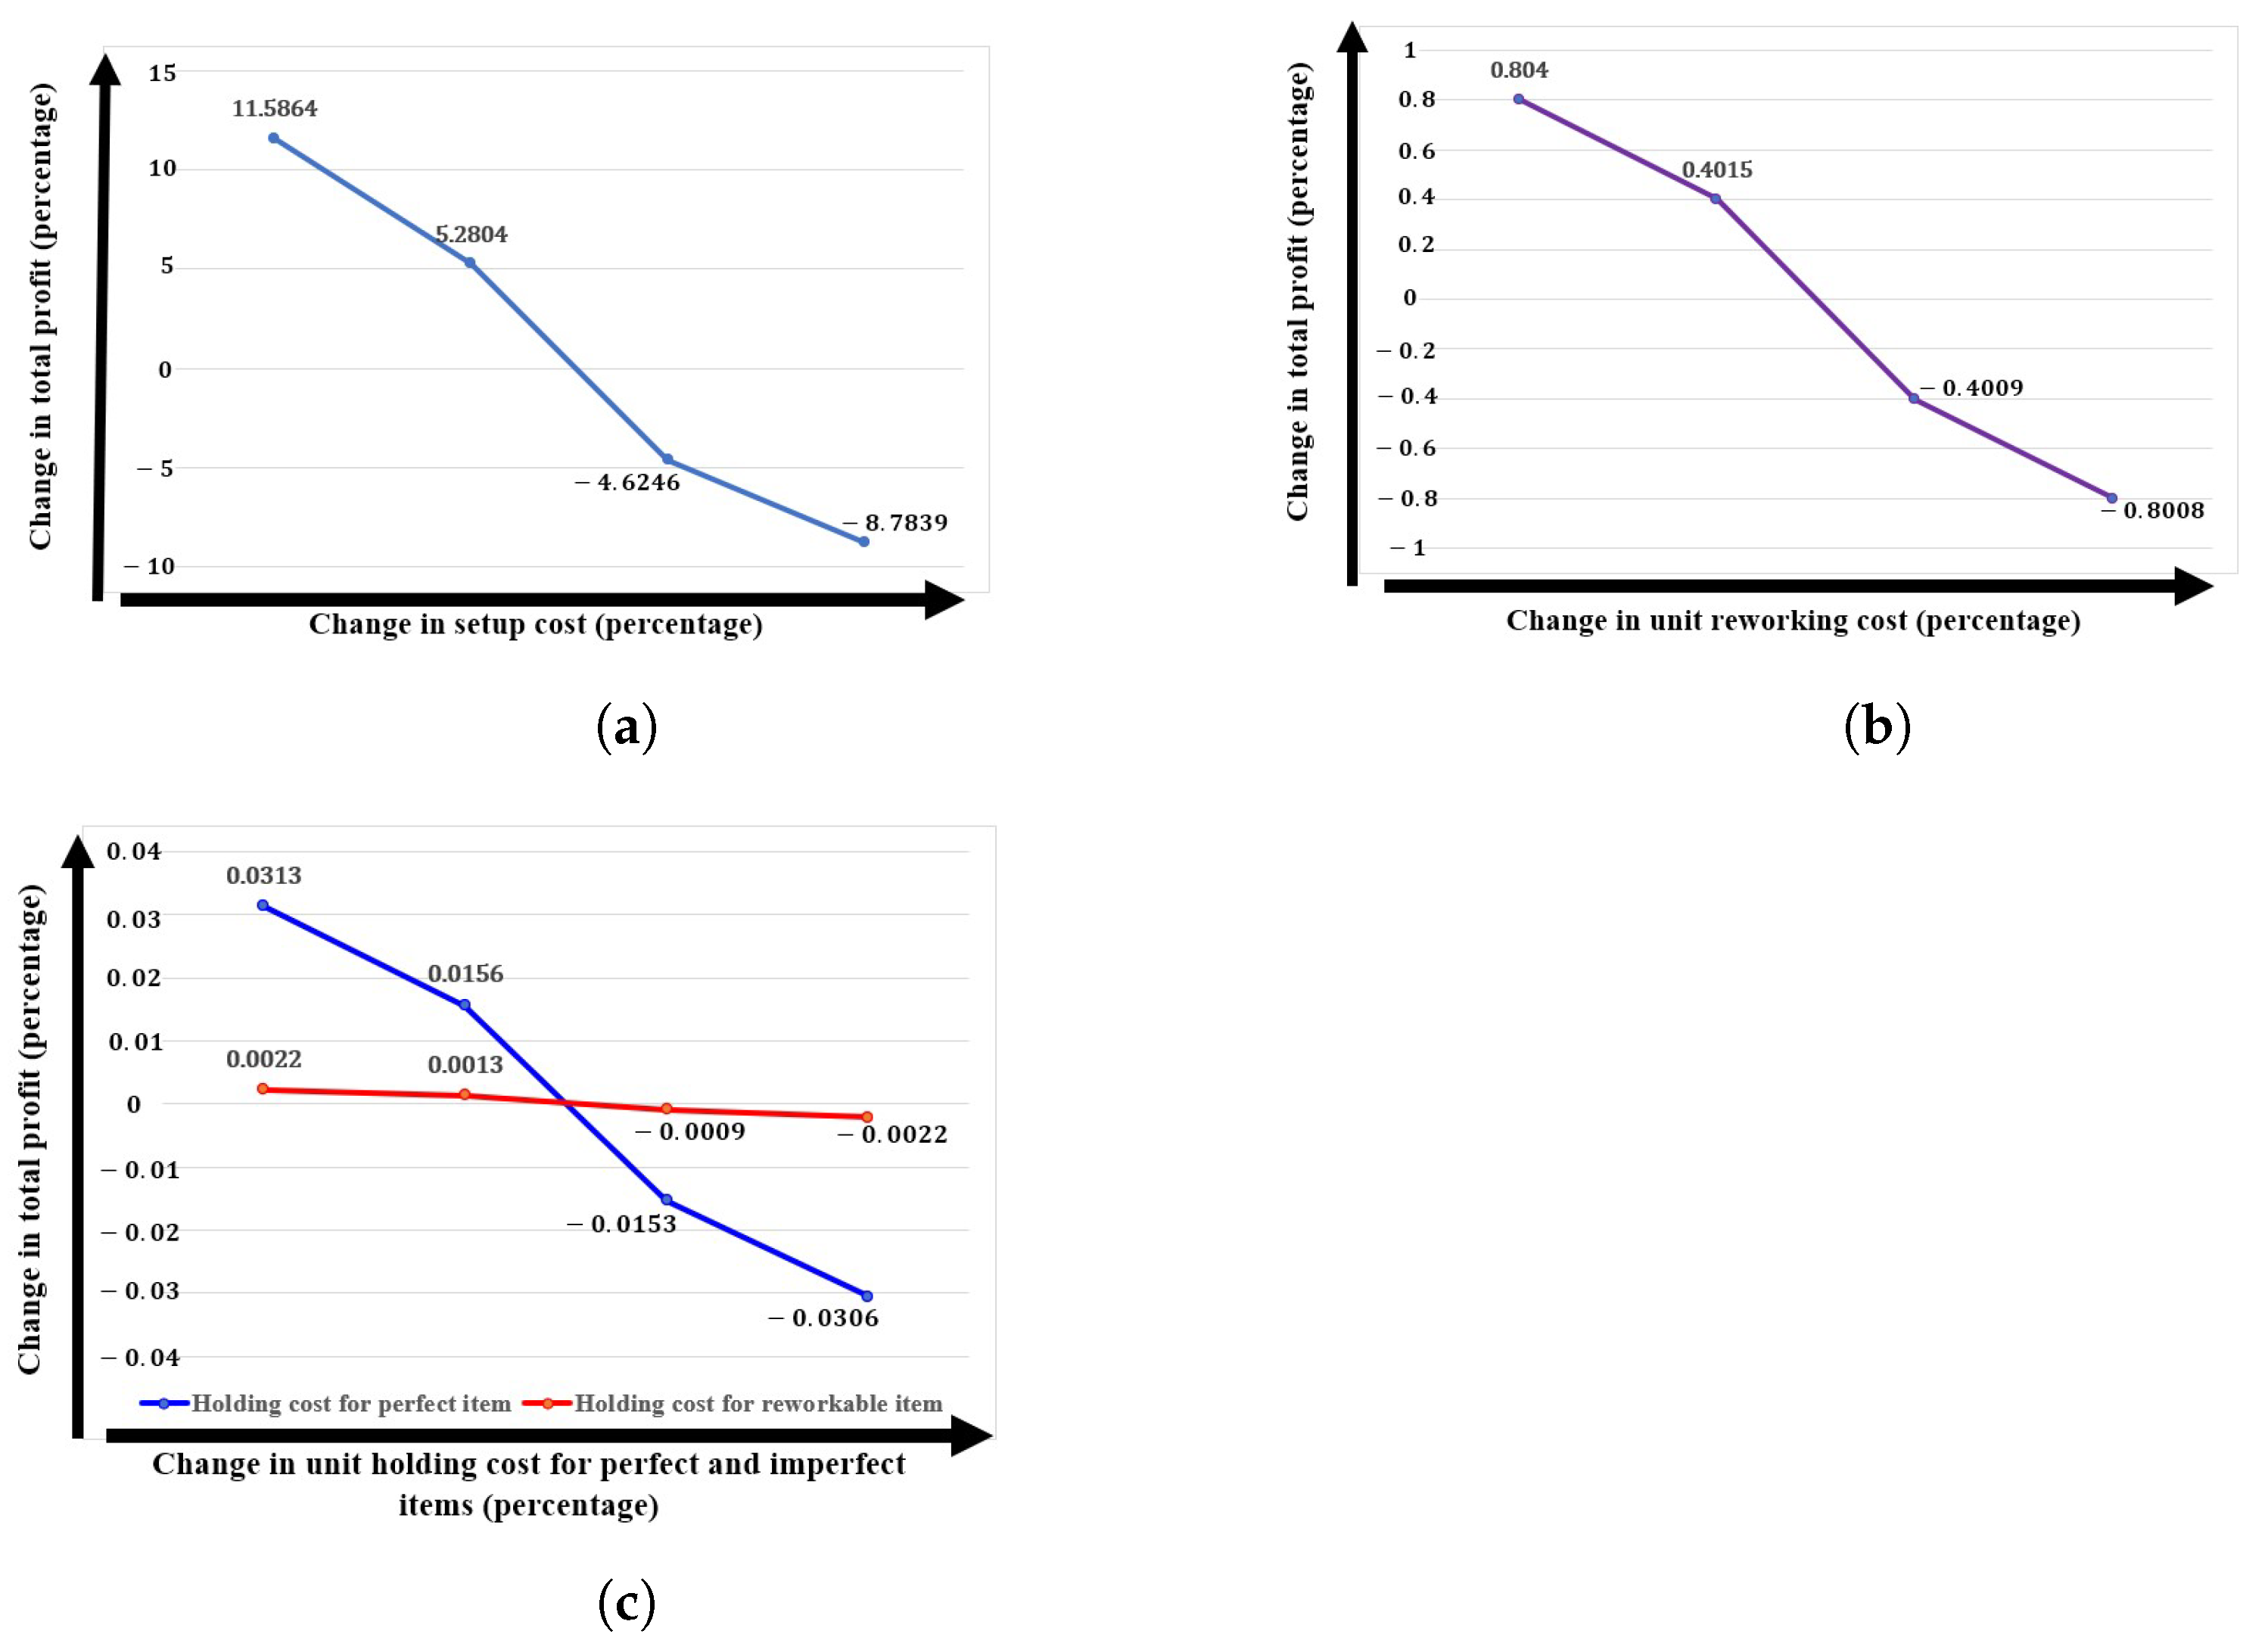
7.4. Sensitivity of Cost Parameters on Total Cost

Unit costs are a bit sensitive in profit optimization for this complex system. From Figure 12, it is clear that setup cost is more sensitive compared to other costs. An increment in setup cost is harmful to profit optimization. A 25 % and 50 % increment in the setup cost will reduce the profit by 4.62 % and 8.78 % , respectively. Conversely, a reduction in setup costs is beneficial for the industries. The industry will gain 5.28 % and 11.59 % more profit if they reduce setup costs by 25 % and 50 % , respectively.
The rest of the unit costs are less sensitive in profit optimization (see Figure 12).

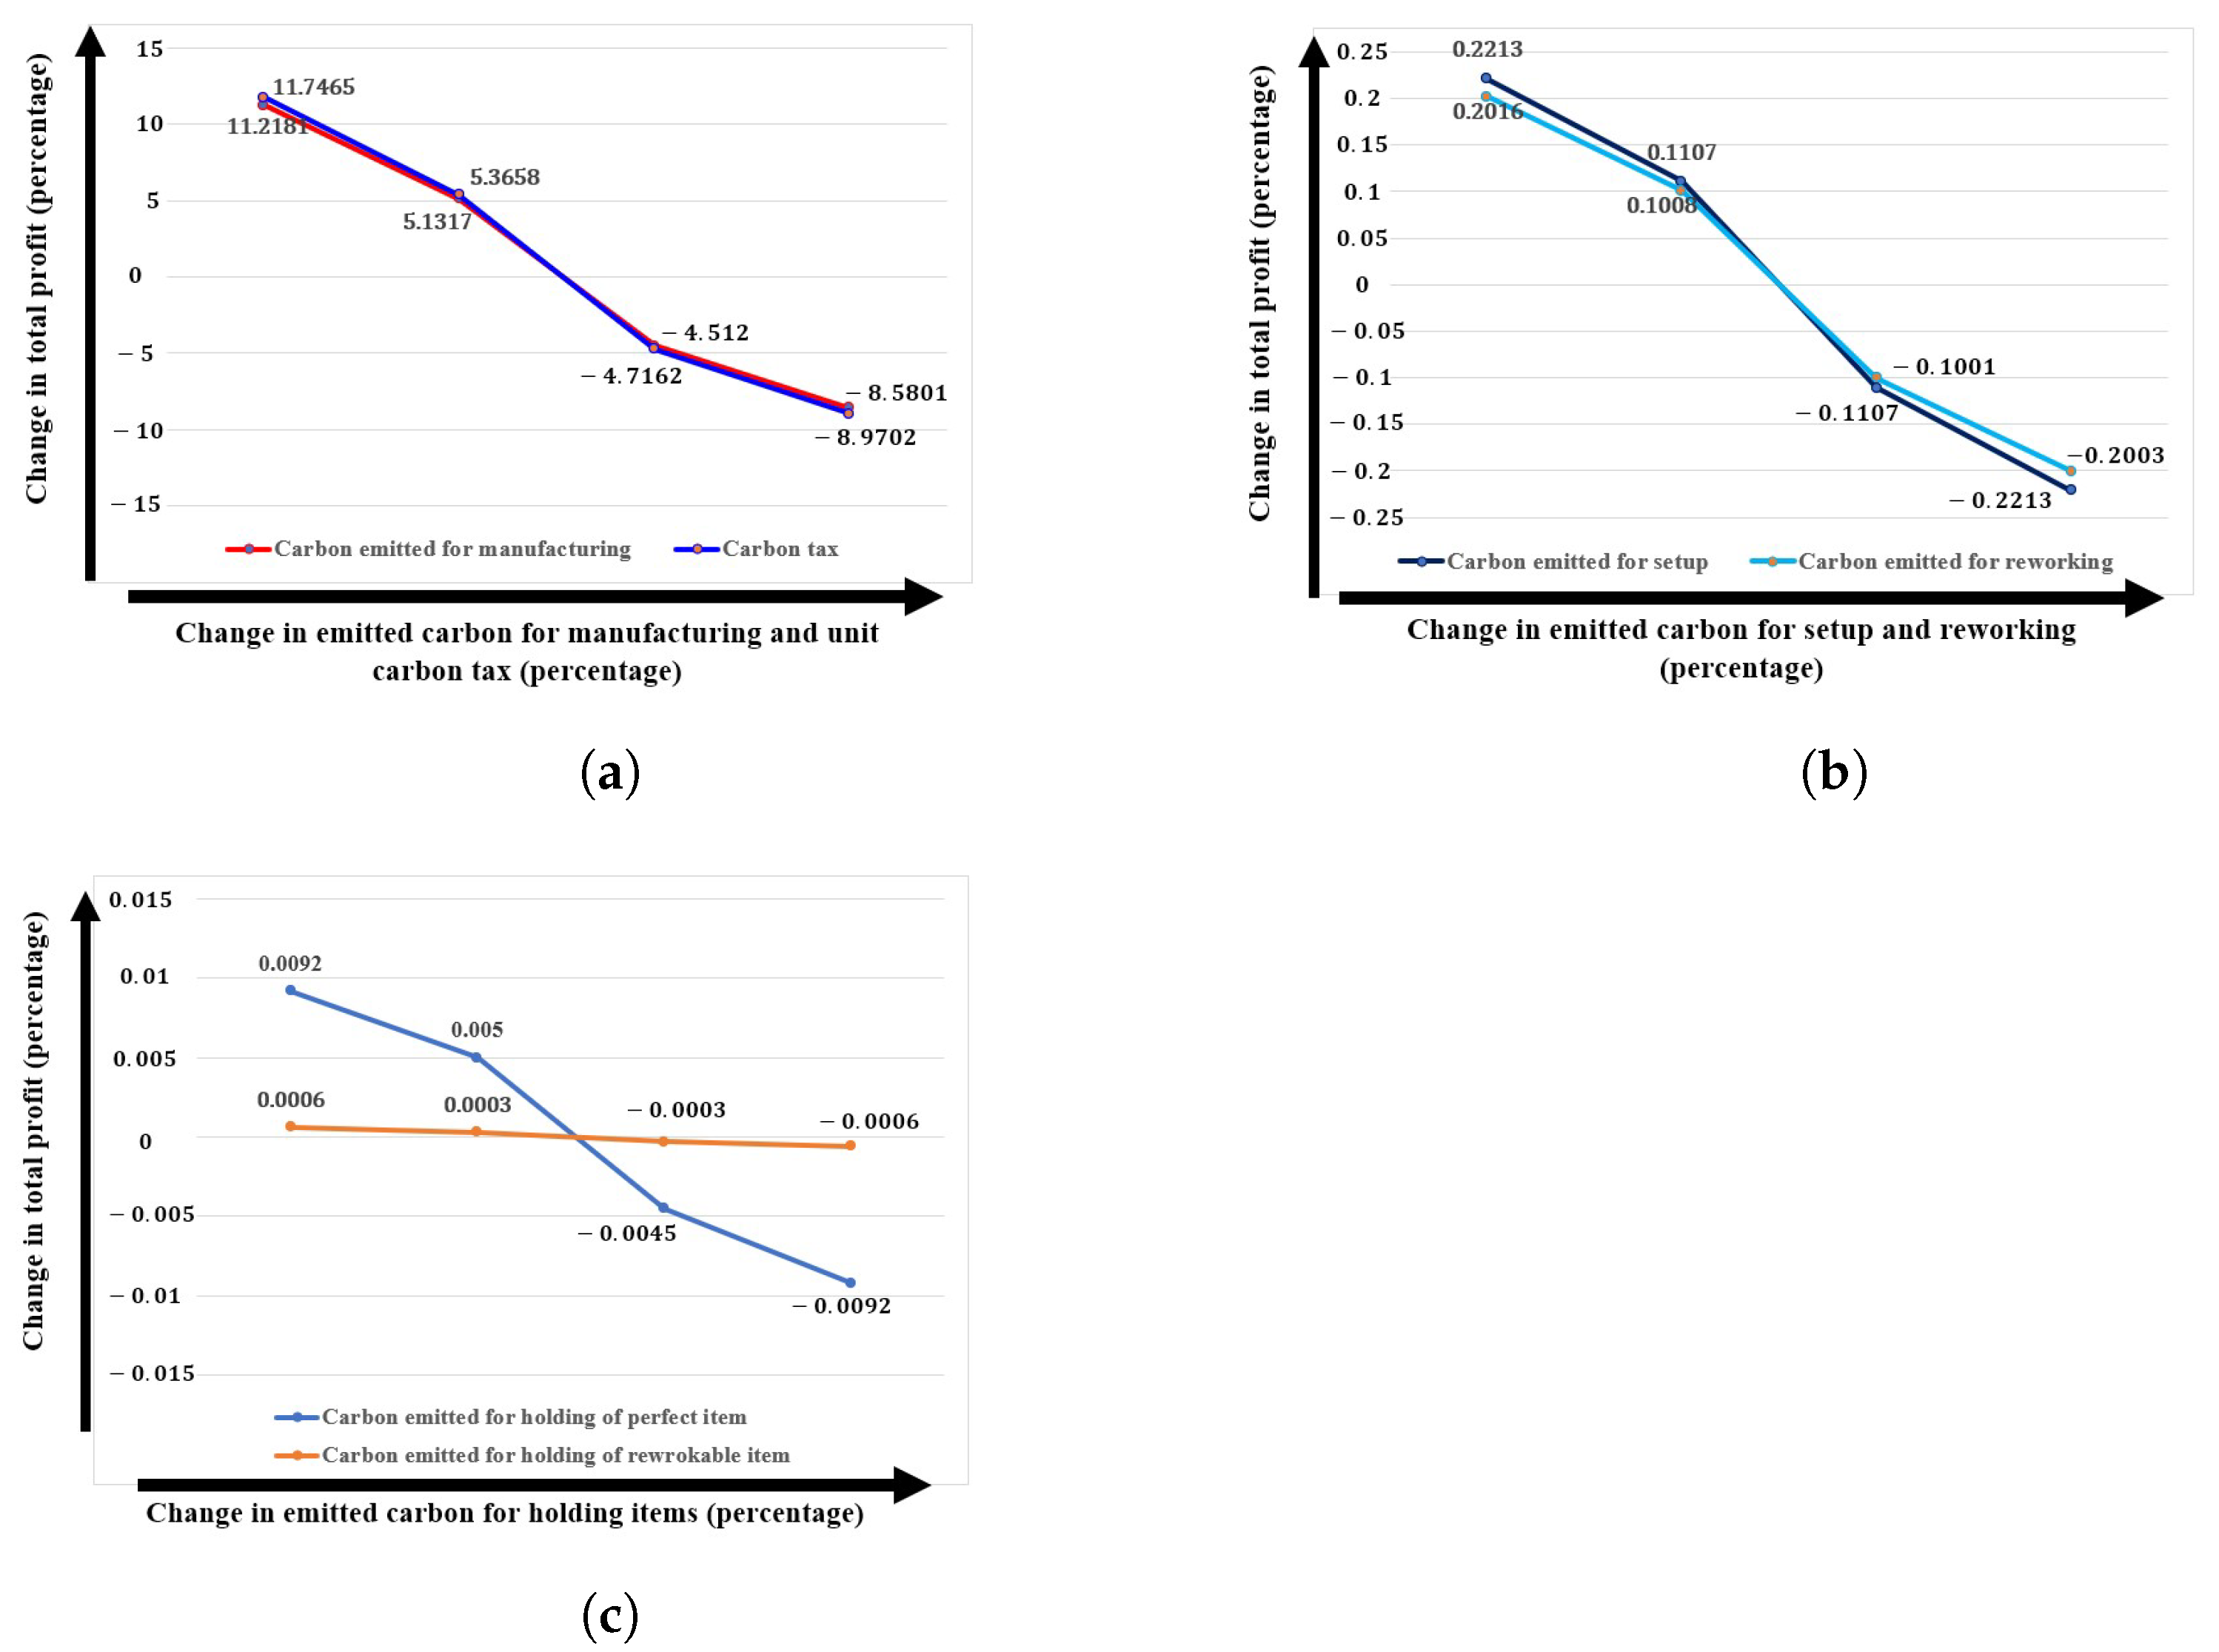
7.5. Sensitivity for the Carbon Emission-Related Parameters on Total Cost

Nowadays, the effect of carbon emissions is very crucial for production industries. Thus, in this study, an investment is introduced in technological growth to reduce carbon emissions. Emitted carbon during manufacturing plays a critical role in profit optimization. Reduction in carbon emission during the manufacturing process will help to increase the profit of the system. From Figure 13, one can claim that the amount of carbon during manufacturing and carbon tax are two significant factors for profit optimization. If the amount of carbon emissions can be reduced up to 50 % , then the industry can earn 11 % more profit. Similarly, if the amount of emitted carbon increases by 50 % , then the industry will face an 8.58 % loss.
Similarly, the carbon tax amount is also quite sensitive. An increment in the unit carbon tax is harmful to these industries. Conversely, a reduction in the unit carbon tax is beneficial for production industries. Similarly, the amount of carbon emission during the setup process, remanufacturing, and holding is a bit sensitive for profit optimization. Reduction in the amount of emitted carbon is always beneficial for the production industries (see Figure 13).

8. Managerial Insights

A complex manufacturing system is presented in this study along with realistic assumptions. The managers of retail and production industries can make several crucial decisions for their industry from the present study.
Making decisions on the product’s demand is a very important and crucial task for industry managers. From the findings of this study, managers can make a proper decision for the market demand. The managers can make the right decision about the selling price and GL of the product to maximize the profit for their industries.
Managers can also enhance their performance by outsourcing in an imperfect production system, which enables companies to focus on their strengths. Outside companies with special skills and technologies can deal with problems in the system better. This way of assigning tasks can save money because companies can use the advantages of doing things on a larger scale and getting help from outsourcing partners. Moreover, outsourcing allows companies to be flexible in how they manage their resources. When demand changes or problems come up in the system, companies can easily change the resources they outsource to meet their needs. This ability to change is an important advantage for managers. It helps companies react quickly to changes in the market without having to pay for permanent staff. However, being a successful manager depends on choosing the right vendors and having strong communication. Finding trustworthy outsourcing partners who can handle the challenges of a flawed production system is very important. Setting up clear rules and goals for how work should be performed and how it will be measured can help make sure that the work being performed by an outside company matches the goals of the main business. Managers can find a proper strategic approach in this study to perform successful outsourcing in an imperfect production system.
Flexibility in the production process is another key parameter for profit optimization. In traditional systems, a fixed number of products are produced all the time, which may create a huge amount of waste or create shortages based on low or high demand. Thus, proper prediction of the production rate is a very important task for industry managers. From the findings of the present study, managers can make the right decision for the production rate.
Nowadays, carbon emission reduction is another major concern for industry managers. How much investment in the technology is appropriate to reduce carbon emissions and optimize profit is also a very crucial decision. A huge amount of investment may lead to a huge cost, and the industry will face losses. However, with the findings of the present study, managers can make the right decision on the investment in technology to reduce carbon emissions and optimize the profit for the industry.
Thus, several major decisions can be made by managers in these industries to achieve a long-term, smooth, sustainable business process.

9. Conclusions

This study introduced a smart retailing strategy within a complex production process, exploring the effectiveness of the product’s GL and outsourcing under various factors like demand, production rate variability, investment, and reworking. The occurrence of imperfections during the out-of-control state follows a random distribution, prompting reworking within the same cycle to minimize waste and raw material usage. Considering environmental concerns, the model incorporates the product’s selling price and GL dependence. Outsourcing a percentage of the quantity was implemented to prevent shortages, resulting in a 1.40 % higher profit. Managers can enhance their performance by outsourcing in an imperfect production system, which enables companies to focus on their strengths. To address the significant carbon emissions from the complex system, an investment in technology was made, reducing 700 kg of carbon per cycle and contributing to environmental cleanliness. Managers can find a proper strategic approach in this study to perform successful outsourcing in an imperfect production system. This study demonstrated that GL-dependent UPC and demand led to a 22.38 % profit increase for business industries. Additionally, a flexible production rate proved to be 40.85 % more beneficial than a traditional fixed production rate. In conclusion, reworking, partial outsourcing, investment in carbon emission reduction technology, VPR, selling price, and GL-dependent demand contribute to the economic, environmental, and social sustainability of this study.

10. Limitations and Future Extension

However, this study has limitations, including fixed setup costs and consideration of a single product type. Another limitation is the focus on a single manufacturing and reworking stage. To expand this study, one could explore a multi-item assembled product with a multi-stage production system (Kugele and Sarkar [1]). Additionally, the consideration of a fixed type of product inspection cost within the setup cost is another limitation, and further research could incorporate intelligent automated inspection technology for precise defect detection (Dey et al. [43]). Given the complexity of the production system, budget constraints were not considered in this study, but future research could explore the impact of budget constraints on the extension of this study (Dey et al. [8]). One can extend this study by considering different carbon emission regulation policies to regulate the carbon emissions from the manufacturing industries (Das et al. [57]). In the future, someone may consider different service strategies provided to the consumer based on payment by the manufacturer to extend this study (Dey and Seok [28]). Instead of a single channel, one can consider different channels such as offline, online, an order online–pickup from store concept, and customization policy to extend the present study in the direction of digital marketing (Chauhan et al. [66]).

Author Contributions

Conceptualization, B.K.D., H.S., and K.C.; methodology, B.K.D. and H.S.; software, B.K.D.; validation, B.K.D., H.S., and K.C.; formal analysis, H.S. and K.C.; investigation, H.S. and K.C.; resources, H.S. and K.C.; data curation, B.K.D., H.S., and K.C.; writing—original draft preparation, B.K.D.; writing—review and editing, B.K.D., H.S., and K.C.; visualization, B.K.D. and H.S.; supervision, H.S. and K.C.; project administration, K.C.; funding acquisition, K.C. All authors have read and agreed to the published version of the manuscript.

Funding

This work was supported by the Ministry of Education of the Republic of Korea and the National Research Foundation of Korea (NRF-2022S1A5A2A01038553).

Data Availability Statement

Data are contained within the article.

Conflicts of Interest

The authors declare that they have no known competing financial interests or personal relationships that could have appeared to influence the work reported in this paper.

Notations & Abbreviations

The following Notations and abbreviations are used in this manuscript:
DecisionVariables
P g rate of production for perfect and imperfect items (unit/cycle)
Glevel of greenness of the product (percentages)
Q g production lot size (units/cycle)
I g investment related to the carbon emission reduction technology (USD/cycle)
S g unit selling price of products (USD/unit)
Parameters
ξ 1 initial market demand of the product (unit)
ξ 2 price-sensitive scaling parameter related to demand
ξ 3 GL-sensitive scaling parameter related to demand
ξ 4 GL-sensitive shape parameter related to demand
D g market demand of green product, D g ( S g , G ) = ξ 1 ξ 2 S g + ξ 3 G ξ 4
γ 1 raw material cost for the green product (USD/ unit)
γ 2 product development cost, which is inversely proportional to the
production rate (USD/unit)
γ 3 cost related to tool/die, which is directly proportional to the production rate
C ( P g , G )             unit cost for production, which depends on GL and production rate (USD/unit)
Hinventory level of the perfect product with the outsourced product (unit)
I i n inventory level for the perfect quality product (unit)
I p e r inventory level for reworking the defective product (unit)
ρ portion of outsourced items ( 0 < ρ < 1 )
Ksetup cost (in-house) (USD/setup)
t 1 ρ time in which products are produced, ρ = 0 (year)
J ρ constant cost for outsourcing (USD/unit)
W ρ variable outsourcing cost per unit (USD/unit)
K c amount of carbon emitted due to the setup of the complex process (kg/setup)
ϕ connecting variable between setup cost and constant outsourcing cost,
where J p = ( 1 + ϕ ) K , 1 ϕ 0
μ connecting variable between UPC and variable outsourcing cost, where
W ρ = ( 1 + μ ) C ( P ) and μ 0
hunit cost to hold the perfect item (USD/unit/unit time)
h c amount of emitted carbon due to holding perfect products per unit
per unit time (kg/unit/unit time)
τ portion of the randomly generated repairable product (percentages)
τ d randomly generated defective items, τ d = P g τ (unit)
E [ τ ] expected value of randomly generated repairable product
t 2 ρ time to rework the defective items, when ρ = 0 (year)
R P rate of reworking of defective items (units/unit time)
C R per-unit cost for reworking (USD/unit)
C R c amount of emitted carbon from the reworking process (kg/unit)
h 1 unit cost to hold reworked product per unit time (USD/unit/unit time)
h 1 c amount of emitted carbon due to holding reworked products per unit
per unit time (kg/unit/unit time)
C c                  carbon tax per kg per cycle (USD/kg/cycle)
mcarbon reduction technology efficiency
vcarbon emission reduction fraction
t 3 ρ time duration when only demand is there without production under ρ = 0 (year)
T ρ replenishment cycle time (time unit)
Tcycle time if ρ = 0 (year)
T C total operating cost per cycle (USD/year)
T E P total expected profit (USD/cycle)
Abbreviations
GLGreen level
GTGreen technology
VPRVariable production rate
UPCUnit production cost
NANot applicable

Appendix A. Calculation of First-Ordered Derivatives

Taking the partial derivatives of the profit function (11), one can obtain
T E P Q g = 2 ( 2 + ϕ ) ( K + K c Ω 4 ) Ω 6 Q g 2 , T E P P g = γ 3 Q g ( 1 + μ ρ ) P g 2 Ω 5 , T E P I g = m v C c D g Ω 2 Q g e v I g , T E P S g = ξ 2 ( 2 R P P g + Q g ξ 2 ( h + h c Ω 4 ) ( 1 ρ ) 2 ζ ) S g ω 8 R P P g T E P G = ξ 3 ξ 4 G ( ξ 4 2 ) ( S g Ω 7 Ω 9 ) γ 1 ( 1 + μ ρ ) D g where , Ω 1 = ρ ζ ( 1 ρ ) ( D g R P ) R P 1 D g ( 1 ρ ) P g + ( 1 ρ ) ( P g ( 1 ζ ) D g ) P g D g , Ω 2 = ( 2 + ϕ ) K c + ( C R c ζ + C p c ) [ ( 1 ρ ) Q g ] + h 1 c ζ 2 Q g 2 ( 1 ρ ) 2 2 R P + h c ζ ( 1 ρ ) 2 Q g 2 2 P g + Q g 2 h c Ω 1 2 Ω 3 = ρ ( 1 ρ ) ζ ( D g R P ) R P , Ω 4 = m C c 1 ( 1 e v I g ) , Ω 5 = γ 2 Q g ( 1 + μ ρ ) + Q g 2 ( 1 ρ ) 2 ζ ( 1 ρ ) ( h + h c ) + Ω 3 ( h + h c Ω 4 ) + Ω 3 Ω 6 = ( h + h c Ω 4 ) Ω 1 + ( 1 ρ ) 2 ζ P g + ( 1 ρ ) 2 ζ 2 ( h 1 + h 1 c Ω 4 ) R P Ω 7 = ( 2 + ϕ ) ( K + Ω 4 K c ) Q g + ( C R + C R c Ω 4 ) ( 1 ρ ) ζ + Q g ( 1 ρ ) 2 ζ 2 ( h + h c Ω 4 ) 2 P g + Q g ( 1 ρ ) 2 ζ 2 ( h 1 + h 1 c Ω 4 ) 2 R P + ( 1 + μ ρ ) C ( P g , G ) + ( 1 ρ ) C P c Ω 4 Q g ( 1 ( 1 ρ ) ( 1 ζ ) ) ( 1 ρ ) ζ ( h + h c Ω 4 ) 2 R P Ω 8 = ξ 1 + ξ 2 Ω 7 + ξ 3 G ξ 4 + Q g ξ 2 ζ ( 1 ρ ) 2 ( h + h c Ω 4 ) ( ξ 1 + ξ 3 G ξ 4 ) R P P G , Ω 9 = Q g ( 1 ρ ) 2 ζ D g ( h + Ω 4 h c ) 2 P g R P

References

  1. Kugele, A.S.H.; Sarkar, B. Reducing carbon emissions of a multi-stage smart production for biofuel towards sustainable development. Alex. Eng. J. 2023, 70, 93–113. [Google Scholar] [CrossRef]
  2. Gomes, S.; Lopes, J.M.; Nogueira, S. Willingness to pay more for green products: A critical challenge for Gen Z. J. Clean. Prod. 2023, 390, 136092. [Google Scholar] [CrossRef]
  3. Murmu, V.; Kumar, D.; Jha, A.K. Quality and selling price dependent sustainable perishable inventory policy: Lessons from Covid-19 pandemic. Oper. Manag. Res. 2023, 16, 408–432. [Google Scholar] [CrossRef]
  4. Sahadevan, V.K.; Mishra, U. A green manufacturer–retailer circular economic production model with carbon emissions and waste control. Environ. Dev. Sustain. 2023, 1–40, in press. [Google Scholar] [CrossRef]
  5. Mahato, F.; Mahato, C.; Mahata, G.C. Sustainable optimal production policies for an imperfect production system with trade credit under different carbon emission regulations. Environ. Dev. Sustain. 2023, 25, 10073–10099. [Google Scholar] [CrossRef]
  6. Li, H.; Chen, H.; Chai, J.; Shi, V. Private label sourcing for an e-tailer with agency selling and service provision. Eur. J. Oper. Res. 2023, 305, 114–127. [Google Scholar] [CrossRef]
  7. Kaur, H.; Singh, S.P.; Majumdar, A. Modelling joint outsourcing and offshoring decisions. Int. J. Prod. Res. 2019, 57, 4278–4309. [Google Scholar] [CrossRef]
  8. Dey, B.K.; Sarkar, B.; Seok, H. Cost-effective smart autonomation policy for a hybrid manufacturing-remanufacturing. Comput. Ind. Eng. 2021, 162, 107758. [Google Scholar] [CrossRef]
  9. Shah, N.H.; Rabari, K.; Patel, E. Greening efforts and deteriorating inventory policies for price-sensitive stock-dependent demand. Int. J. Syst. Sci. Oper. Logist. 2023, 10, 2022808. [Google Scholar] [CrossRef]
  10. Dey, B.K.; Bhuniya, S.; Sarkar, B. Involvement of controllable lead time and variable demand for a smart manufacturing system under a supply chain management. Expert Syst. Appl. 2021, 184, 115464. [Google Scholar] [CrossRef]
  11. Glock, C.H.; Grosse, E.H. The impact of controllable production rates on the performance of inventory systems: A systematic review of the literature. Eur. J. Oper. Res. 2021, 288, 703–720. [Google Scholar] [CrossRef]
  12. Sarkar, B.; Guchhait, R. Ramification of information asymmetry on a green supply chain management with the cap-trade, service, and vendor-managed inventory strategies. Electron. Commer. Res. Appl. 2023, 60, 101274. [Google Scholar] [CrossRef]
  13. Liu, Y.; Xu, L.; Sun, H.; Chen, B.; Wang, L. Optimization of carbon performance evaluation and its application to strategy decision for investment of green technology innovation. J. Environ. Manag. 2023, 325, 116593. [Google Scholar] [CrossRef] [PubMed]
  14. Fang, Z. Assessing the impact of renewable energy investment, green technology innovation, and industrialization on sustainable development: A case study of China. Renew. Energy 2023, 205, 772–782. [Google Scholar] [CrossRef]
  15. Pal, B.; Adhikari, S. Price-sensitive imperfect production inventory model with exponential partial backlogging. Int. J. Syst. Sci. Oper. Logist. 2019, 6, 27–41. [Google Scholar] [CrossRef]
  16. Feng, L.; Chan, Y.L.; Cárdenas-Barrón, L.E. Pricing and lot-sizing polices for perishable goods when the demand depends on selling price, displayed stocks, and expiration date. Int. J. Prod. Econ. 2017, 185, 11–20. [Google Scholar] [CrossRef]
  17. Bachar, R.K.; Bhuniya, S.; Ghosh, S.K.; Sarkar, B. Sustainable green production model considering variable demand, partial outsourcing, and rework. AIMS Environ. Sci. 2022, 9, 325–353. [Google Scholar] [CrossRef]
  18. Sarkar, M.; Park, K.S. Reduction of makespan through flexible production and remanufacturing to maintain the multi-stage automated complex production system. Comput. Ind. Eng. 2023, 177, 108993. [Google Scholar] [CrossRef]
  19. Ruidas, S.; Seikh, M.R.; Nayak, P.K. An EPQ model with stock and selling price dependent demand and variable production rate in interval environment. Int. J. Syst. Assur. Eng. Manag. 2020, 11, 385–399. [Google Scholar] [CrossRef]
  20. Sana, S.S. A production–inventory model in an imperfect production process. Eur. J. Oper. Res. 2010, 200, 451–464. [Google Scholar] [CrossRef]
  21. Pal, B.; Sana, S.S.; Chaudhuri, K. Joint pricing and ordering policy for two echelon imperfect production inventory model with two cycles. Int. J. Prod. Econ. 2014, 155, 229–238. [Google Scholar] [CrossRef]
  22. Sarkar, B.; Bhuniya, S. A sustainable flexible manufacturing–remanufacturing model with improved service and green investment under variable demand. Expert Syst. Appl. 2022, 202, 117154. [Google Scholar] [CrossRef]
  23. Mishra, U.; Wu, J.Z.; Sarkar, B. Optimum sustainable inventory management with backorder and deterioration under controllable carbon emissions. J. Clean. Prod. 2021, 279, 123699. [Google Scholar] [CrossRef]
  24. Mashud, A.H.M.; Pervin, M.; Mishra, U.; Daryanto, Y.; Tseng, M.L.; Lim, M.K. A sustainable inventory model with controllable carbon emissions in green-warehouse farms. J. Clean. Prod. 2021, 298, 126777. [Google Scholar] [CrossRef]
  25. Das, S.K.; Vincent, F.Y.; Roy, S.K.; Weber, G.W. Location–allocation problem for green efficient two-stage vehicle-based logistics system: A type-2 neutrosophic multi-objective modeling approach. Expert Syst. Appl. 2024, 238, 122174. [Google Scholar] [CrossRef]
  26. Heydari, J.; Govindan, K.; Basiri, Z. Balancing price and green quality in presence of consumer environmental awareness: A green supply chain coordination approach. Int. J. Prod. Res. 2021, 59, 1957–1975. [Google Scholar] [CrossRef]
  27. Giri, B.; Mondal, C.; Maiti, T. Analysing a closed-loop supply chain with selling price, warranty period and green sensitive consumer demand under revenue sharing contract. J. Clean. Prod. 2018, 190, 822–837. [Google Scholar] [CrossRef]
  28. Dey, B.K.; Seok, H. Intelligent inventory management with autonomation and service strategy. J. Intell. Manuf. 2024, 35, 307–330. [Google Scholar] [CrossRef]
  29. Bachar, R.K.; Bhuniya, S.; Ghosh, S.K.; AlArjani, A.; Attia, E.; Uddin, M.S.; Sarkar, B. Product outsourcing policy for a sustainable flexible manufacturing system with reworking and green investment. Math. Biosci. Eng. 2023, 20, 1376–1401. [Google Scholar] [CrossRef]
  30. Lin, J.; Naim, M.M.; Tang, O. In-house or outsourcing? The impact of remanufacturing strategies on the dynamics of component remanufacturing systems under lifecycle demand and returns. Eur. J. Oper. Res. 2024, in press. [Google Scholar] [CrossRef]
  31. Ma, S.; Zhang, L.L.; Cai, X. Optimizing joint technology selection, production planning and pricing decisions under emission tax: A Stackelberg game model and nested genetic algorithm. Expert Syst. Appl. 2024, 238, 122085. [Google Scholar] [CrossRef]
  32. Alfares, H.K.; Ghaithan, A.M. A generalized production-inventory model with variable production, demand, and cost rates. Arab. J. Sci. Eng. 2022, 47, 3963–3978. [Google Scholar] [CrossRef]
  33. Sarkar, B.; Dey, B.K.; Sarkar, M.; Kim, S.J. A smart production system with an autonomation technology and dual channel retailing. Comput. Ind. Eng. 2022, 173, 108607. [Google Scholar] [CrossRef]
  34. Sana, S.S. Optimum buffer stock during preventive maintenance in an imperfect production system. Math. Methods Appl. Sci. 2022, 45, 8928–8939. [Google Scholar] [CrossRef]
  35. Sepehri, A.; Gholamian, M.R. A green inventory model with imperfect items considering inspection process and quality improvement under different shortages scenarios. Environ. Dev. Sustain. 2023, 25, 3269–3297. [Google Scholar] [CrossRef]
  36. Naghshineh, B.; Carvalho, H. The implications of additive manufacturing technology adoption for supply chain resilience: A systematic search and review. Int. J. Prod. Econ. 2022, 247, 108387. [Google Scholar] [CrossRef]
  37. Friedrich, A.; Lange, A.; Elbert, R. Make-or-buy decisions for industrial additive manufacturing. J. Bus. Logist. 2022, 43, 623–653. [Google Scholar] [CrossRef]
  38. Xie, L.; Liu, Y.; Han, H.; Qiu, C.M. Outsourcing or reshoring? A manufacturer’s sourcing strategy in the presence of government subsidy. Eur. J. Oper. Res. 2023, 308, 131–149. [Google Scholar] [CrossRef]
  39. Deng, S.; Xu, J. Manufacturing and procurement outsourcing strategies of competing original equipment manufacturers. Eur. J. Oper. Res. 2023, 308, 884–896. [Google Scholar] [CrossRef]
  40. Cárdenas-Barrón, L.E.; Chung, K.J.; Treviño-Garza, G. Celebrating a century of the economic order quantity model in honor of Ford Whitman Harris. Int. J. Prod. Econ. 2014, 155, 1–7. [Google Scholar] [CrossRef]
  41. Agi, M.A.; Soni, H.N. Joint pricing and inventory decisions for perishable products with age-, stock-, and price-dependent demand rate. J. Oper. Res. Soc. 2020, 71, 85–99. [Google Scholar] [CrossRef]
  42. Jabarzare, N.; Rasti-Barzoki, M. A game theoretic approach for pricing and determining quality level through coordination contracts in a dual-channel supply chain including manufacturer and packaging company. Int. J. Prod. Econ. 2020, 221, 107480. [Google Scholar] [CrossRef]
  43. Dey, B.K.; Pareek, S.; Tayyab, M.; Sarkar, B. Autonomation policy to control work-in-process inventory in a smart production system. Int. J. Prod. Res. 2021, 59, 1258–1280. [Google Scholar] [CrossRef]
  44. Wang, L.; Song, Q. Pricing policies for dual-channel supply chain with green investment and sales effort under uncertain demand. Math. Comput. Simul. 2020, 171, 79–93. [Google Scholar] [CrossRef]
  45. Paul, A.; Pervin, M.; Roy, S.K.; Maculan, N.; Weber, G.W. A green inventory model with the effect of carbon taxation. Ann. Oper. Res. 2022, 309, 233–248. [Google Scholar] [CrossRef]
  46. Malleeswaran, B.; Uthayakumar, R. A single-manufacturer multi-retailer sustainable reworking model for green and environmental sensitive demand under discrete ordering cost reduction. J. Manag. Anal. 2023, 10, 109–128. [Google Scholar] [CrossRef]
  47. Punj, N.; Ahmi, A.; Tanwar, A.; Rahim, S.A. Mapping the field of green manufacturing: A bibliometric review of the literature and research frontiers. J. Clean. Prod. 2023, 423, 138729. [Google Scholar] [CrossRef]
  48. Khanlarzade, N.; Farughi, H. Modeling the Stackelberg game with a boundedly rational follower in deterioration supply chain-based interaction with the leader’s hybrid pricing strategy. Expert Syst. Appl. 2024, 237, 121302. [Google Scholar] [CrossRef]
  49. Ayed, S.; Sofiene, D.; Nidhal, R. Joint optimisation of maintenance and production policies considering random demand and variable production rate. Int. J. Prod. Res. 2012, 50, 6870–6885. [Google Scholar] [CrossRef]
  50. Min, D.; Chung, K. A joint optimal decision on shipment size and carbon reduction under direct shipment and peddling distribution strategies. Sustainability 2017, 9, 2061. [Google Scholar] [CrossRef]
  51. AlDurgam, M.; Adegbola, K.; Glock, C.H. A single-vendor single-manufacturer integrated inventory model with stochastic demand and variable production rate. Int. J. Prod. Econ. 2017, 191, 335–350. [Google Scholar] [CrossRef]
  52. Kim, H.; Kim, E. A hybrid manufacturing system with demand for intermediate goods and controllable make-to-stock production rate. Eur. J. Oper. Res. 2022, 303, 1244–1257. [Google Scholar] [CrossRef]
  53. Zhu, J.; Lu, Y.; Song, Z.; Shao, X.; Yue, X.G. The choice of green manufacturing modes under carbon tax and carbon quota. J. Clean. Prod. 2023, 384, 135336. [Google Scholar] [CrossRef]
  54. Barman, A.; De, P.K.; Chakraborty, A.K.; Lim, C.P.; Das, R. Optimal pricing policy in a three-layer dual-channel supply chain under government subsidy in green manufacturing. Math. Comput. Simul. 2023, 204, 401–429. [Google Scholar] [CrossRef]
  55. Sinha, R.K.; Chaturvedi, N.D. A review on carbon emission reduction in industries and planning emission limits. Renew. Sustain. Energy Rev. 2019, 114, 109304. [Google Scholar] [CrossRef]
  56. Das, S.K.; Roy, S.K. Effect of variable carbon emission in a multi-objective transportation-p-facility location problem under neutrosophic environment. Comput. Ind. Eng. 2019, 132, 311–324. [Google Scholar] [CrossRef]
  57. Das, S.K.; Roy, S.K.; Weber, G.W. Application of type-2 fuzzy logic to a multiobjective green solid transportation–location problem with dwell time under carbon tax, cap, and offset policy: Fuzzy versus nonfuzzy techniques. IEEE Trans. Fuzzy Syst. 2020, 28, 2711–2725. [Google Scholar] [CrossRef]
  58. Mishra, U.; Wu, J.Z.; Sarkar, B. A sustainable production-inventory model for a controllable carbon emissions rate under shortages. J. Clean. Prod. 2020, 256, 120268. [Google Scholar] [CrossRef]
  59. Sun, L.; Cao, X.; Alharthi, M.; Zhang, J.; Taghizadeh-Hesary, F.; Mohsin, M. Carbon emission transfer strategies in supply chain with lag time of emission reduction technologies and low-carbon preference of consumers. J. Clean. Prod. 2020, 264, 121664. [Google Scholar] [CrossRef]
  60. Zhang, W.; Li, J.; Li, G.; Guo, S. Emission reduction effect and carbon market efficiency of carbon emissions trading policy in China. Energy 2020, 196, 117117. [Google Scholar] [CrossRef]
  61. An, Y.; Zhou, D.; Yu, J.; Shi, X.; Wang, Q. Carbon emission reduction characteristics for China’s manufacturing firms: Implications for formulating carbon policies. J. Environ. Manag. 2021, 284, 112055. [Google Scholar] [CrossRef]
  62. Yang, Z.; Gao, W.; Han, Q.; Qi, L.; Cui, Y.; Chen, Y. Digitalization and carbon emissions: How does digital city construction affect china’s carbon emission reduction? Sustain. Cities Soc. 2022, 87, 104201. [Google Scholar] [CrossRef]
  63. Dey, B.K.; Datta, A.; Sarkar, B. Effectiveness of carbon policies and multi-period delay in payments in a global supply chain under remanufacturing consideration. J. Clean. Prod. 2023, 402, 136539. [Google Scholar] [CrossRef]
  64. Utama, D.M.; Santoso, I.; Hendrawan, Y.; Dania, W.A.P. A sustainable production-inventory model with CO2 emission, electricity and fuel consumption under quality degradation and stochastic demand: A case study in the agri-food industry. Environ. Dev. Sustain. 2024, 1–40, in press. [Google Scholar] [CrossRef]
  65. Seok, H.; Nof, S.Y.; Filip, F.G. Sustainability decision support system based on collaborative control theory. Annu. Rev. Control 2012, 36, 85–100. [Google Scholar] [CrossRef]
  66. Chauhan, R.; Majumder, A.; Kumar, V. The impact of adopting customization policy and sustainability for improving consumer service in a dual-channel retailing. J. Retail. Consum. Serv. 2023, 75, 103504. [Google Scholar] [CrossRef]
Figure 1. Graphical representation of the inventory for imperfect production systems with partial outsourcing (solid line) versus inventory behavior for imperfect systems without outsourcing (dotted line) (Bachar et al. [29]).
Mathematics 12 00654 g001
Figure 2. Concavity of the profit function with respect to decision variables under chi-square-distributed defective rate. (a) Concavity of the profit function for production rate and quantity. (b) Concavity of the profit function for selling price and green level (GL) of the product. (c) Concavity of the profit function for selling price and investment in technology to reduce carbon emission. (d) Concavity of the profit function for selling price and order quantity. (e) Concavity of the profit function for investment in technology to reduce carbon emission and green level (GL) of the product. (f) Concavity of the profit function for production rate and investment in technology to reduce carbon emission.
Mathematics 12 00654 g002
Figure 3. Concavity of the profit function without outsourcing. (a) Concavity of profit function without outsourcing with respect to production rate and investment. (b) Concavity of profit function without outsourcing with respect to quantity and selling price.
Mathematics 12 00654 g003
Figure 4. Concavity of profit function without investment with respect to production rate and quantity.
Mathematics 12 00654 g004
Figure 5. Concavity of profit function without consideration of green level (GL) of the product with respect to production rate and selling price.
Mathematics 12 00654 g005
Figure 6. Concavity of profit function for fixed production rate with respect to quantity and selling price.
Mathematics 12 00654 g006
Figure 7. Concavity of profit function for constant demand and production rate with respect to quantity and investment.
Mathematics 12 00654 g007
Figure 8. Profit comparison with Mishra et al. [58], Bachar et al. [17], Alfares and Ghaithan [32], and Bachar et al. [29] models.
Mathematics 12 00654 g008
Figure 9. Effect of parameters on total profit related to demand. (a) Effect of scaling parameter related to selling price. (b) Effect of scaling and shape parameter related to green level (GL).
Mathematics 12 00654 g009
Figure 10. Effect of parameters on total profit related to unit production cost (UPC). (a) Effect of raw material cost on total profit. (b) Effect of development cost and tool/die cost on total profit.
Mathematics 12 00654 g010
Figure 11. Effect of parameters related to outsourcing on total profit.
Mathematics 12 00654 g011
Figure 12. Effect of cost parameters on total profit. (a) Effect of setup cost on total profit. (b) Effect of unit reworking cost on total profit. (c) Effect of unit holding cost on total profit.
Mathematics 12 00654 g012
Figure 13. Effect of parameters related to carbon emissions on total profit. (a) Effect of emitted carbon for manufacturing and carbon tax on total profit. (b) Effect of emitted carbon due to setup and reworking on total profit. (c) Effect of emitted carbon due to holding of items on total profit.
Mathematics 12 00654 g013
Table 2. Optimum result under partial outsourcing for different distributed defective rates.
Defective Rate
Follows
Chi-Square
Distribution
Uniform
Distribution
Triangular
Distribution
Reciprocal
Distribution
Production rate (units)217.81220.50219.91219.97
Order quantity (units)92.8292.03101.5992.18
Green level (GL) (percentages)70%70%69%70%
Selling price (USD per unit)255.24255.78254.72255.68
Carbon emission reduction investment (USD per cycle)131.32131.36135.99131.35
Total profit (USD)31,353.9031,018.0031,108.8031,078.40
Table 3. Optimum result for different special cases under chi-square-distributed defective rates.
Different
Cases
Without
Outsourcing
Without
Investment
Without Green
Level
Fixed
Production
Rate
Fixed Demand
and
Production
Rate
Production rate (units)222.02218.12217.10
Order quantity (units)94.7498.7588.9473.9684.55
Green level (GL) (percentages)70%68%69%
Selling price (USD per unit)255.25251.58233.83311.80
Carbon emission reduction investment (USD per cycle)134.87129.22120.22126.82
Total profit (USD)30,924.0029,951.9025,619.7018,544.609793.41
Disclaimer/Publisher’s Note: The statements, opinions and data contained in all publications are solely those of the individual author(s) and contributor(s) and not of MDPI and/or the editor(s). MDPI and/or the editor(s) disclaim responsibility for any injury to people or property resulting from any ideas, methods, instructions or products referred to in the content.

