Abstract
Imbalanced class data are commonly observed in pattern analysis, machine learning, and various real-world applications. Conventional approaches often resort to resampling techniques in order to address the imbalance, which inevitably alter the original data distribution. This paper proposes a novel classification method that leverages optimal transport for handling imbalanced data. Specifically, we establish a transport plan between training and testing data without modifying the original data distribution, drawing upon the principles of optimal transport theory. Additionally, we introduce a non-convex interclass regularization term to establish connections between testing samples and training samples with the same class labels. This regularization term forms the basis of a regularized discrete optimal transport model, which is employed to address imbalanced classification scenarios. Subsequently, in line with the concept of maximum minimization, a maximum minimization algorithm is introduced for regularized discrete optimal transport. Subsequent experiments on 17 Keel datasets with varying levels of imbalance demonstrate the superior performance of the proposed approach compared to 11 other widely used techniques for class-imbalanced classification. Additionally, the application of the proposed approach to water quality evaluation confirms its effectiveness.
Keywords:
imbalanced data; classification; optimal transport; majorization–minimization; regularization term MSC:
68T09
1. Introduction
Currently, there are numerous datasets that contain imbalanced numbers of samples across different classes [1], referred to as class-imbalanced datasets. The task of classifying these types of datasets is known as class-imbalanced classification. For example, in the context of water quality assessment [2], the data related to water quality tend to remain relatively stable over a short period of time. This results in one category, known as the majority class, having significantly more samples than the other categories, referred to as the minority class. Typically, the samples in the minority class represent instances of polluted water or water that does not meet the required standards. Misclassifying a sample from the minority class as belonging to the majority class can have serious consequences or lead to significant damage in terms of water pollution control. Recently, class-imbalanced classification has garnered considerable attention in various applications, such as feature selection [3,4,5], fault diagnosis [6,7], continuous supervising tasks [1], face recognition [8], cancer detection [9], and anomalous event detection [10].
In recent studies, imbalanced classification problems have been a focus of research, with a particular emphasis on two main areas: dataset manipulation and enhancements to classification methodologies. In terms of data manipulation, class representation is often adjusted using undersampling or oversampling techniques [11]. Undersampling methods aim to improve classification accuracy for minority class samples by reducing the number of majority class samples. For example, Oquab et al. [12] applied random undersampling to of the ImageNet dataset in order to train a convolutional neural network (CNN) for object detection. While random undersampling can expedite training time, it may lead to loss of valuable information from majority class samples, ultimately limiting classifier performance. As a result, researchers have explored heuristic undersampling methods. Lin et al. [13] proposed a novel undersampling approach utilizing clustering techniques to replace original data with cluster centers. While this method preserves important information from the majority class, it may disrupt the dataset distribution. In response, Ng et al. [14] introduced an undersampling technique based on diversified sensitivity, which selects a balanced sample set using a stochastic sensitivity measure to maintain the distribution of the training dataset as accurately as possible.
In contrast to undersampling methods, oversampling methods are simpler and aim to balance sample numbers by rotating or randomly duplicating minority class samples. However, there is a higher risk of overfitting. Recently, Chawla et al. [15] introduced a new oversampling method to address this issue. Zhu et al. [16] proposed an oversampling method that introduces selection weights to increase the number of samples. Abdi et al. [17] developed a new oversampling method inspired by the Mahalanobis distance to reduce overlap between different class regions. Douzas et al. [18] presented a method that combines a synthetic minority oversampling technique (SMOTE) and k-means clustering to avoid the impact of noise and effectively address class imbalance.
Although oversampling methods can effectively balance data, they often rely on local information to increase sample size, neglecting the overall distribution of the dataset. Consequently, many of these methods do not ensure consistency with the original data. To address this issue, Das et al. [19] introduced a new method based on Gibbs sampling and the joint probability distribution of data that effectively generates new samples for the minority class. Some studies [20,21] suggest that imbalanced classification problems can be mitigated by incorporating additional features extracted from the data. Recent advancements in generation methods offer new approaches to tackle imbalanced classification. For example, Liu et al. [22] proposed an oversampling method based on fuzzy theory and information decomposition. Razavi et al. [23] utilized the expectation maximization method to estimate and update missing values, successfully generating datasets for diagnosing bearing defects. By leveraging generative adversarial networks, Douzas et al. [24] developed an approach to predict the distribution of true data and generate minority class samples. Huang et al. [8] demonstrated the efficacy of representation learning in classifying imbalanced data through numerous experiments.
While the aforementioned existing approaches, such as [22,24], aim to balance the training data, they inadvertently alter the distribution of the original data. Specifically, undersampling methods may result in the loss of valuable information, whereas oversampling methods can lead to increased training time due to the greater number of training samples [25,26].
In terms of enhancements to classification methodologies, researchers have introduced several enhanced algorithms, such as AdaBoost [27] and its variations (i.e., AdaC2.M1 [28], PIBoost [29], and SAMME [30]), as well as the enhanced HDDT algorithms [31] (namely HDDTecoc, HDDTova, and MCHDDT), imECOC, and its improved versions [32] (imECOC+OVA and imECOC+sparse). Sun et al. [28] utilized a genetic algorithm to identify the optimal cost setup for each class, and subsequently developed a cost-sensitive boosting algorithm to enhance the classification performance of imbalanced data involving multiple classes. Hoens et al. [31] investigated the issue of multi-class imbalance within decision trees and devised a novel multi-class splitting criterion. Antonio and Baumela [29] employed a vectorial codification to represent class labels and a multi-class exponential loss function to assess classifier responses, and then introduced a multi-class adaptation of AdaBoost with binary weak-learners. Liu et al. [32] proposed the imECOC method, which operates on dichotomies to address both between-class and within-class imbalances. Despite the notable improvements achieved by these approaches, they still exhibit a tendency to favor the majority class and overlook the minority class.
Optimal transport (OT) models are effective in modeling probability distributions using geometric methods, allowing for the analysis of original data without changing their distribution. They have become a popular tool for data analysis [33,34,35]. In particular, Courty et al. [33] introduced a novel OT model with a regularization term to address domain adaptation issues. In this paper, we aim to propose a new approach using OT for imbalanced classification problems.
This study is centered on introducing a novel general approach to imbalanced classification, without focusing on equalizing sample sizes. The main contributions of this work can be observed in the following aspects.
- (1)
- To maintain the integrity of the original data distribution, a suitable non-convex regularization term is formulated, followed by the development of a non-convex regularized optimal transport model for addressing class-imbalanced classification.
- (2)
- Subsequently, in line with the concept of maximizing–minimizing, a maximum minimization optimal transport algorithm is introduced (Section 3.2).
- (3)
- Experiments carried out on 17 Keel datasets with varying levels of class imbalance demonstrate that our method surpasses 11 other commonly used techniques for class-imbalanced classification by a significant margin. Moreover, the application of our proposed approach in water quality evaluation showcases its superior performance (Section 4).
The advantages of the proposed approach are as follows.
- (1)
- In contrast to data manipulation techniques involving data resampling, our approach does not alter the original data distribution. Instead, we establish the probability distributions of the training set and testing set using the Dirac measure. Subsequently, we formulate class-imbalanced classification as an optimal transport model with a non-convex regularization term. As a result, our proposed method maintains the integrity of the initial data distribution and mitigates certain limitations of data resampling techniques, including information loss in undersampling methods and overfitting in oversampling methods.
- (2)
- Unlike ensemble learning methods, the proposed approach does not require the selection of the number of classifiers, thus reducing time costs.
This paper is structured as follows. Section 2 provides an overview of optimal transport. Section 3 outlines the development of a regularization term for class-imbalanced classification, leading to the proposal of a regularized optimal transport model. An algorithm utilizing maximum minimization is then presented. In Section 4, the evaluation measures for class-imbalanced data classification are discussed, demonstrating the effectiveness of the proposed method on various class-imbalanced datasets from Keel datasets and its application in water quality evaluation. Finally, Section 5 presents the conclusions.
2. Preliminary on Optimal Transport
Let and be two probability measures in , and be the respective domains, and be the cost function. The original formulation of Monge’s OT problem is to find an optimal map that pushes a distribution onto another distribution and minimizes the cost:
where # is the push forward operator. The maps satisfying the constraints in (1) are called transport maps.
The Kantorovich formulation being a convex relaxation of the Monge problem is as follows:
where is a set consisting of all joint probability distributions coupling with . The plans satisfying the constraints in (2) are called transport plans.
Since problem (2) is convex, the solution always exists. If the solution of problem (1) exists, then the relationship between and is where represents identity mapping.
Let be the training set, be the testing set, and the measures and be discrete. We consider the discrete optimal transport, i.e.,
where is a Dirac measure at . Note that the optimal transport map of the Monge problem corresponding to the above discrete measures does not exist in general.
In order to prevent misuse of symbols, we additionally define as the collection of probability distributions between two discrete distributions, namely,
The discrete Kantorovich formulation of optimal transport can be described as
where matrix , , is the Frobenius inner product of matrices.
Generally, when
the discrete optimal transport (DOT) model is as follows:
3. Class-Imbalanced Classification Based on Regularized Discrete Optimal Transport
3.1. Regularized Optimal Transport Model
Given the significance of training sample labels in supervised learning classification tasks, a regularization term has been devised to maintain the integrity of label information within the training data.
where is the norm with power of q, is the set of line indexes representing the element of class c, and is the vector consisting of coefficients of the jth column of γ with respect to class c. In this paper, we choose ; that is, we should handle with the following regularized optimal transport (ROT):
In the ROT model (7), the interclass regularization term ensures that samples from Y are transported to samples with the same class labels in X. This enables the classification of all samples in Y based on the labels of the transported samples.
3.2. Algorithm for ROT
Since the non-convex nature of problem (7) poses a challenge, the traditional method known as majorization–minimization (MM) [35] can be utilized to tackle this issue.
Noticing that the function is concave, it is difficult to maximize the regularization term directly. However, we can maximize with a linear approximation; that is, for a fixed , we have
where,
is the component of matrix Q, and small helps to avoid numerical instabilities.
As we know, the MM algorithm can converge with a small iteration number. Thus, the following Algorithm 1 is designed to solve problem (7).
| Algorithm 1: Majorization–minimization for regularized optimal transport (MMROT). |
 |
4. Experiments
4.1. Evaluation Measures
To evaluate the performance of classifiers for imbalance data reasonably, researchers put forward a series of new measures, such as true positive (TP), true negative (TN), false positive (FP), and false negative (FN). In the classification, the positive class is often treated as the minority class, and recall (Rec), specificity (Spec), precision (Pre), geometric mean (GM), and F1-measure (F1M) are often used as the evaluation measures, which are defined as follows:
where , , .
4.2. Experiments with Keel Datasets
Small and imbalanced datasets are a common occurrence in many data mining problems [36,37]. Therefore, the experiments were conducted on small and imbalanced datasets obtained from two types of Keel datasets, which can be accessed for download from https://sci2s.ugr.es/keel/imbalanced.php (accessed on 18 August 2020). The imbalance ratio (IR) is defined as the ratio of the number of samples in the majority class to that in the minority class. The two types of Keel datasets have different IRs, with values both greater and smaller than 9. Due to the small sample size of the minority class, all datasets were subjected to a 5-fold cross-validation during the testing phase.
The objective of this study is to introduce a novel classification approach at the methodology level, instead of concentrating on dataset balancing. As such, the MMROT method is compared with 11 other approaches that have been enhanced in terms of classification methodology (https://github.com/chongshengzhang/Multi_Imbalance, accessed on 21 March 2019), including the traditional support vector machine (SVM) [38], AdaBoost [27], and three improved AdaBoost algorithms (i.e., AdaC2.M1 [28], PIBoost [29], and SAMME [30]), three improved HDDT algorithms [31] (i.e., HDDTecoc, HDDTova, and MCHDDT), imECOC, and two improved imECOC algorithms [32] (i.e., imECOC + OVA and imECOC + sparse). Next, the experiments are designed as follows.
- (1)
- Experiments on the datasets with IRs smaller than 9.
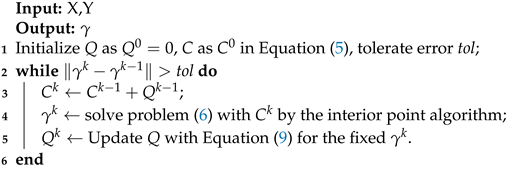
The details of these datasets, including the dataset names, imbalance ratios, and other related descriptions, are listed in Table 1. Noting that 0 appears in the confusion matrices of some datasets, it leads to the undetermined value in the calculation of the classification accuracy. So, we replace with 0 when showing the results. Table 2 and Table 3 show the classification results with datasets ecoli-0_vs_1 and glass-0-1-2-3_vs_4-5-6, respectively. Figure 1 show the values of different evaluation measures (Pre, Rec, F1M, and GM) with different methods, which illustrates that the proposed method outperforms other methods across all datasets with an IR < 9.

Table 1.
Description of training data whose IRs are smaller than 9.
Table 2.
Classification results on dataset ecoli-0_vs_1.
Table 3.
Classification results on dataset glass-0-1-2-3_vs_4-5-6.
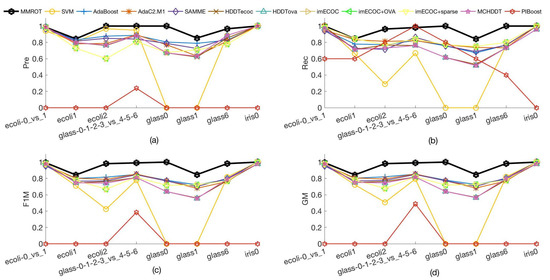
Figure 1.
(a) Values of Pre on different datasets with IR < 9. (b) Values of Rec on different datasets with IR < 9. (c) Values of F1M on different datasets with IR < 9. (d) Values of GM on different datasets with IR < 9.
Statistical Analysis: To statistically confirm the effectiveness of the proposed approach in comparison to other methods, we conduct robust statistical analyses in accordance with previous research [39]. Firstly, we utilize the Shapiro–Wilk normality test to assess the distribution of the data. If the data meet the assumptions of normality, we proceed with a parametric t-test; otherwise, a nonparametric Wilcoxon rank sum test is employed. Both tests are conducted to test the null hypothesis that there is no significant difference in the classification results obtained from different methods. We establish a significance level of to determine the rejection of the null hypothesis. The results of all pairwise comparison p-values are presented in Table 4. Remarkably, for the F1M and GM indicators, all p-values are below 0.05, leading us to reject the null hypothesis and conclude that our proposed approach significantly outperforms alternative methods. Notice that the classification results are the same for all imECOC approaches, so only one column is shown in Table 4.
Table 4.
p-values for comparison of MMROT against the other model-based approaches on datasets with IR < 9.
- (2)
- Experiments on the datasets with IRs bigger than 9.
The details of these datasets are listed in Table 5. The experiment results tested on dataset yeast-2_vs_4 with the same 12 approaches are shown in Table 6, and we can find that MMROT achieves the best performance among these methods.
Table 5.
Description of training data whose IRs are bigger than 9.
Table 6.
Classification results on dataset yeast-2_vs_4.
The visualization of classification results on different methods for different datasets is provided in Figure 2 so as to make a further analysis of the performance. From Figure 2, we can deduce that, for all the datasets, the results obtained with MMROT outperform those other 11 approaches. Figure 2 also shows that the ability of MMROT is better at addressing the classifications on datasets whose IRs are bigger than 9.
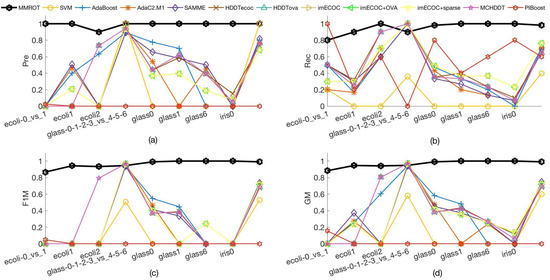
Figure 2.
(a) Values of Pre on different datasets with IR > 9. (b) Values of Rec on different datasets with IR > 9. (c) Values of F1M on different datasets with IR > 9. (d) Values of GM on different datasets with IR > 9.
Statistical Analysis:Table 7 shows the p-values of pairwise comparisons for datasets with IR > 9. It is worth mentioning that, for the F1M and GM indicators, all p-values are less than 0.05, indicating that our proposed method significantly outperforms other approaches.
Table 7.
p-values for comparison of MMROT against the other model-based approaches on datasets with IR > 9.
4.3. Assessment of the Water Quality of Fuyang River in Handan
In the following, we will evaluate the effectiveness of MMROT in comparison to 11 other approaches for assessing the water quality of Fuyang River in Handan.
The experiment results tested on Fuyang River with the 12 methods are presented in Table 8. It can be found that MMROT achieves the best on measures Rec and GM compared with the other 11 methods. In Figure 3, the visualization of the performance of different methods on measures Pre, Rec, and GM using 10-fold cross-validation in the testing process is displayed, respectively.
Table 8.
Classification results on Fuyang River.
Figure 3.
(a) Values of Pre on Fuyang River dataset. (b) Values of Rec on Fuyang River dataset. (c) Values of GM on Fuyang River dataset.
As the water quality data are extremely imbalanced, especially as there is only one sample belonging to Grade I, it leads to the result that this sample cannot appear in both the training set and the testing set. Therefore, it is very easy to misclassify this sample, such that the denominator of F1M is 0, resulting in the values of F1M in the ten methods are noneffective, so we do not provide it here.
From the visualization of Figure 3, we can find that, in comparison with the other 11 methods, the performance of MMROT on measures Rec and GM performs the best, and Pre performs better than the other methods except for the SVM. These results show that MMROT is strongly effective in the application of water quality evaluation.
5. Conclusions
To address class-imbalanced classification, we have developed an optimal transport model with a non-convex regularization term. This model is implemented with an algorithm based on MM, yielding favorable results across datasets with varying imbalance ratios and in the assessment of water quality in Fuyang River, Handan. We have taken into account the impact of imbalanced data when calculating the maximum linear approximation for the non-convex regularization term, enhancing the robustness of the constructed MMROT. Our results demonstrate that MMROT is capable of meeting practical requirements for class-imbalanced classification, as evidenced by experiments on small datasets and water quality assessment. As the accumulation of large-scale datasets continues, particularly in industrial production settings, the performance of MMROT on such datasets and potential enhancements will be explored in future research.
Author Contributions
Conceptualization, J.C. and L.M.; methodology, J.C. and L.M.; software, J.W.; validation, J.C., J.W. and L.M.; data curation, J.W.; writing—original draft, J.C.; writing—review and editing, J.C., J.W. and L.M.; visualization, J.W. and L.M.; supervision, J.C.; project administration, J.C. and L.M.; funding acquisition, J.C. and L.M. All authors have read and agreed to the published version of the manuscript.
Funding
This work was funded by the National Science Foundation of China (62006068), Hebei Natural Science Foundation (A2021402008), Natural Science Foundation of Scientific Research Project of Higher Education in Hebei Province (ZD2020185, QN2020188), and 333 Talent Supported Project of Hebei Province (C20221026).
Data Availability Statement
The data presented in this study can be available via the email of the corresponding author.
Conflicts of Interest
The authors declare no conflicts of interest.
References
- Khan, S.H.; Hayat, M.; Bennamoun, M.; Togneri, R.; Sohel, F.A. A discriminative representation of convolutional features for indoor scene recognition. IEEE Trans. Image Process. 2016, 25, 3372–3383. [Google Scholar] [CrossRef]
- Chen, J.Q.; Hu, Q.H.; Xue, X.P.; Ha, M.H.; Ma, L.T.; Zhang, X.C.; Yu, Z.P. Possibility measure based fuzzy support function machine for set based fuzzy classifications. Inf. Sci. 2019, 483, 192–205. [Google Scholar] [CrossRef]
- Li, W.; Zhai, S.; Xu, W.; Pedrycz, W.; Qian, Y.; Ding, W.; Zhan, T. Feature selection approach based on improved fuzzy C-means with principle of refined justifiable granularity. IEEE Trans. Fuzzy Syst. 2023, 31, 2112–2126. [Google Scholar] [CrossRef]
- Li, W.; Zhou, H.; Xu, W.; Wang, X.; Pedrycz, W. Interval dominance-based feature selection for interval-valued ordered data. IEEE Trans. Neural Netw. Learn. Syst. 2022, 34, 6898–6912. [Google Scholar] [CrossRef] [PubMed]
- Li, W.; Deng, C.; Pedrycz, W.; Castillo, O.; Zhang, C.; Zhan, T. Double-quantitative feature selection approach for multi-granularity ordered decision systems. IEEE Trans. Artif. Intell. 2023, 1–12. [Google Scholar] [CrossRef]
- Martin-Diaz, I.; Morinigo-Sotelo, D.; Duque-Perez, O.; Romero-Troncoso, R.D.J. Early fault detection in induction motors using AdaBoost with imbalanced small data and optimized sampling. IEEE Trans. Ind. Appl. 2017, 53, 3066–3075. [Google Scholar] [CrossRef]
- Shokrollahi, M.R.; Mousavi, A.K. Simultaneous fault detection and robust control for a dynamic observer-based switched time delay systems with car roll dynamic application. Int. J. Gen. Syst. 2023, 1–25. [Google Scholar] [CrossRef]
- Huang, C.; Li, Y.; Chen, C.L.; Tang, X. Deep imbalanced learning for face recognition and attribute prediction. IEEE Trans. Pattern Anal. Mach. Intell. 2020, 42, 2781–2794. [Google Scholar] [CrossRef]
- Yuan, X.; Xie, L.; Abouelenien, M. A regularized ensemble framework of deep learning for cancer detection from multi-class, imbalanced training data. Pattern Recognit. 2018, 77, 160–172. [Google Scholar] [CrossRef]
- Wu, P.; Liu, J.; Shen, F. A deep one-class neural network for anomalous event detection in complex scenes. IEEE Trans. Neural Netw. Learn. Syst. 2020, 31, 2609–2622. [Google Scholar] [CrossRef]
- Li, L.; He, H.; Li, J. Entropy-based sampling approaches for multi-class imbalanced problems. IEEE Trans. Knowl. Data Eng. 2020, 32, 2159–2170. [Google Scholar] [CrossRef]
- Oquab, M.; Bottou, L.; Laptev, I.; Sivic, J. Learning and transferring mid-level image representations using convolutional neural networks. In Proceedings of the 2014 IEEE Conference on Computer Vision and Pattern Recognition, Columbus, OH, USA, 23–28 June 2014; pp. 1717–1724. [Google Scholar]
- Lin, W.; Tsai, C.; Hu, Y.; Jhang, J. Clustering-based undersampling in class-imbalanced data. Inf. Sci. 2017, 409–410, 17–26. [Google Scholar] [CrossRef]
- Ng, W.; Hu, J.; Yeung, D.S.; Yin, S.; Roli, F. Diversified sensitivity-based undersampling for imbalance classification problems. IEEE Trans. Cybern. 2015, 45, 2402–2412. [Google Scholar] [CrossRef] [PubMed]
- Chawla, N.V.; Bowyer, K.W.; Hall, L.O.; Kegelmeyer, W.P. SMOTE: Synthetic minority over-sampling technique. J. Artif. Intell. Res. 2002, 16, 321–357. [Google Scholar] [CrossRef]
- Zhu, T.; Lin, Y.; Liu, Y. Synthetic minority oversampling technique for multiclass imbalance problems. Pattern Recognit. 2017, 72, 327–340. [Google Scholar] [CrossRef]
- Abdi, L.; Hashemi, S. To combat multi-class imbalanced problems by means of over-sampling techniques. IEEE Trans. Knowl. Data Eng. 2016, 28, 238–251. [Google Scholar] [CrossRef]
- Douzas, G.; Bacao, F.; Last, F. Improving imbalanced learning through a heuristic oversampling method based on k-means and SMOTE. Inf. Sci. 2018, 465, 1–20. [Google Scholar] [CrossRef]
- Das, B.; Krishnan, N.C.; Cook, D.J. RACOG and wRACOG: Two probabilistic oversampling techniques. IEEE Trans. Knowl. Data Eng. 2015, 27, 222–234. [Google Scholar] [CrossRef]
- Gore, R.; Diallo, S.Y.; Padilla, J.B.E. Assessing cyber-incidents using machine learning. Int. J. Inf. Comput. Secur. 2018, 10, 341–360. [Google Scholar] [CrossRef]
- Chen, Y.; Pedrycz, W.; Wang, J.; Zhang, C.; Yang, J. A new oversampling method based on triangulation of sample space. IEEE Trans. Syst. Man Cybern.-Syst. 2024, 54, 774–786. [Google Scholar] [CrossRef]
- Liu, S.; Zhang, J.; Yang, X.; Zhou, W. Fuzzy-based information decomposition for incomplete and imbalanced data learning. IEEE Trans. Fuzzy Syst. 2017, 25, 1476–1490. [Google Scholar] [CrossRef]
- Razavi-Far, R.; Farajzadeh-Zanjani, M.; Saif, M. An integrated class-imbalance learning scheme for diagnosing bearing defects in induction motors. IEEE Trans. Ind. Inform. 2017, 13, 2758–2769. [Google Scholar] [CrossRef]
- Douzas, G.; Bacao, F. Effective data generation for imbalanced learning using conditional generative adversarial networks. Expert Syst. Appl. 2018, 91, 464–471. [Google Scholar] [CrossRef]
- Zhong, W.; Raahemi, B.; Liu, J. Classifying peer-to-peer applications using imbalanced concept-adapting very fast decision tree on IP data stream. Peer-to-Peer Netw. Appl. 2013, 6, 233–246. [Google Scholar] [CrossRef]
- Chen, K.; Gong, S.; Xiang, T.; Loy, C.C. Cumulative attribute space for age and crowd density estimation. In Proceedings of the 2013 IEEE Conference on Computer Vision and Pattern Recognition, Portland, OR, USA, 23–28 June 2013; pp. 2467–2474. [Google Scholar]
- Freund, Y.; Schapire, R.E. A desicion-theoretic generalization of on-line learning and an application to boosting. In II European Conference on Computational Learning Theory; Springer: Berlin/Heidelberg, Germany, 2014; pp. 119–139. [Google Scholar]
- Sun, Y.; Kamel, M.S.; Wang, Y. Boosting for learning multiple classes with imbalanced class distribution. In Proceedings of the IEEE 6th International Conference on Data Mining, Hong Kong, China, 18–22 December 2006; pp. 592–602. [Google Scholar]
- Antonio, F.B.; Baumela, L. Multi-class boosting with asymmetric binary weak-learners. Pattern Recognit. 2014, 47, 2080–2090. [Google Scholar]
- Zhu, J.; Arbor, A.; Hastie, T. Multi-class AdaBoost. Stat. Interface 2009, 2, 349–360. [Google Scholar]
- Hoens, T.R.; Qian, Q.; Chawla, N.V.; Zhou, Z.H. Building decision trees for the multi-class imbalance problem. In Proceedings of the Pacific-Asia Conference on Advances in Knowledge Discovery and Data Mining, Kuala Lumpur, Malaysia, 29 May–1 June 2012; pp. 122–134. [Google Scholar]
- Liu, X.Y.; Li, Q.Q.; Zhou, Z.H. Learning imbalanced multi-class data with optimal dichotomy weights. In Proceedings of the IEEE 13th International Conference on Data Mining, Dallas, TX, USA, 7–10 December 2013; pp. 478–487. [Google Scholar]
- Courty, N.; Flamary, R.; Tuia, D.; Rakotomamonjy, A. Optimal transport for domain adaptation. IEEE Trans. Pattern Anal. Mach. Intell. 2017, 39, 1853–1865. [Google Scholar] [CrossRef] [PubMed]
- Zhen, Z.; Wang, M.; Nehorai, A. Optimal transport in reproducing kernel Hilbert spaces: Theory and applications. IEEE Trans. Pattern Anal. Mach. Intell. 2020, 42, 1741–1754. [Google Scholar]
- Nicolas, C.; Rémi, F.; Devis, T. Domain adaptation with regularized optimal transport. In Proceedings of the European Conference on Machine Learning and Principles and Practice of Knowledge Discovery in Databases, Nancy, France, 15–19 September 2014; pp. 274–289. [Google Scholar]
- Par, O.; Sezer, E.; Sever, H. Small and unbalanced data set problem in classification. In Proceedings of the 2019 27th Signal Processing and Communications Applications Conference, Sivas, Turkey, 24–26 April 2019; pp. 1–4. [Google Scholar]
- Plesovskaya, E.; Ivanov, S. An empirical analysis of KDE-based generative models on small datasets. Procedia Comput. Sci. 2021, 193, 442–452. [Google Scholar] [CrossRef]
- Cortes, C.; Vapnik, V.N. Support-vector networks. Mach. Learn. 1995, 20, 273–297. [Google Scholar] [CrossRef]
- Bej, S.; Davtyan, N.; Wolfien, M.; Nassar, M.; Wolkenhauer, O. LoRAS: An oversampling approach for imbalanced datasets. Mach. Lang. 2021, 110, 279–301. [Google Scholar] [CrossRef]
Disclaimer/Publisher’s Note: The statements, opinions and data contained in all publications are solely those of the individual author(s) and contributor(s) and not of MDPI and/or the editor(s). MDPI and/or the editor(s) disclaim responsibility for any injury to people or property resulting from any ideas, methods, instructions or products referred to in the content. |
© 2024 by the authors. Licensee MDPI, Basel, Switzerland. This article is an open access article distributed under the terms and conditions of the Creative Commons Attribution (CC BY) license (https://creativecommons.org/licenses/by/4.0/).