1. Introduction
Cloud computing is a crucial element of modern infrastructure, providing accessible computing resources and power. It encompasses various service models, including on-site cloud services where owners are responsible for setting up all processes from the networking level to the application stack. Infrastructure-as-a-service (IaaS) allows for the use of actual computing resources through system-level virtualization. This model grants users control over the virtual cloud infrastructure, including virtual processors, memory (RAM), network, and storage. It allows them to manage both infrastructure and software, along with additional tools. Platform-as-a-service (PaaS) addresses the operating system, middleware, and runtime, eliminating the need for users to manage these components and allowing them to focus on managing their data and applications. Software-as-a-service (SaaS) offers fully managed cloud-based applications by service providers.
Virtual machines (VMs) emulate physical computers and can vary in power and resources, aiding in efficient resource management in cloud services. However, the dynamic nature of the cloud environment presents challenges such as load balancing and hardware maintenance. A critical issue in this regard is VM placement, which is particularly significant in data centers. It involves VM migration strategies for better energy consumption, resource allocation, load balancing, and reduced ecological impact. VM migration addresses challenges such as uneven computing power distribution, quality of service (QoS) requirements, server load, resource exhaustion, and underutilization.
The VM migration across servers in a cloud computing system is a critical aspect of managing modern cloud infrastructure. This topic has been addressed in many recent research papers. For a review of these works, please refer to
Section 2. This paper focuses on a queuing model for analyzing VM migration across servers in a cloud computing system. Building upon the VM migration mechanism outlined in [
1], we adapt the resource utilization approach for migration to a task processing perspective. This allows us also to consider the stochastic nature of resource utilization in the form of random arrivals of tasks and random duration for task processing.
The main contributions of our study are as follows:
We present a comprehensive review of the nuances involved in VM migration across servers within cloud computing infrastructures. This includes an exploration of diverse VM migration types, methodologies for determining server load states, strategies for selecting VMs for migration, optimal timing for VM transfers, and criteria for choosing the target server. A synopsis of recent papers on VM migration is also provided.
We formalize a model for VM migration that encompasses both resource utilization and task processing aspects. We introduce a queuing model for the task processing scenario, addressing the stochastic nature of task arrivals at VMs. This model applies to configurations involving two servers and three VMs.
Through numerical analysis, we quantify several performance indicators: the probability of blocking a task, the average number of tasks processed by VMs, and the average number of tasks handled by servers. The effects of task arrival rates and the average task duration on these indicators were scrutinized.
The rest of the paper is organized as follows.
Section 2 provides an overview of related work in the field of VM migration.
Section 3 details the model formalization in terms of resource utilization based on [
1].
Section 4 presents the queuing model in terms of task processing and some metrics of interest. In
Section 5, we present illustrative numerical results for these metrics, analyzing the impact of the arrival rate of tasks on servers and their average duration. The conclusions are drawn in the final
Section 6.
2. Virtual Machine Migration in Cloud Computing
In this section, we review the various aspects of VM migration, including types of migration such as live and offline, definitions of overloaded and underloaded servers, and the selection process for migrating a VM. The importance of choosing the appropriate moment and server for successful migration is also discussed, along with a brief overview of recent research in this area.
2.1. Types of VM Migration
VM migration is the process of transferring a VM from one server to another [
2]. This involves moving the VM’s memory, disk storage, and network connections. There are two primary types of migration: static and dynamic. Static migration relies on prior knowledge of workload patterns and entails solving the VM placement problem for all VMs and available hosts. Conversely, dynamic migration permits the relocation of VMs after their initial allocation. This process necessitates continuous monitoring to detect resource contention and potential service disruption. Dynamic migration is facilitated by dynamic resource allocation, a sophisticated approach capable of managing unpredictable workloads [
3]. Dynamic migration can be subdivided into periodic and real-time migration. Periodic migration can be scheduled manually or triggered by system state changes, such as the addition or removal of a server [
4].
Furthermore, VM migration can be categorized as either offline or online (live) [
5]. Offline migration requires halting or shutting down the VM before transfer to another host, potentially causing service interruptions and adversely affecting user experience and service level agreements (SLAs) [
6]. In contrast, live migration allows the VM to remain operational during transfer, preserving access to its RAM, storage, and network states. Live migration strives to minimize downtime and total migration time while ensuring QoS and service availability [
7]. Depending on the sequence in which memory pages are transferred from the source to the destination host, live migration can be further classified as pre-copy or post-copy [
8].
Live migration offers various advantages over offline migration. One notable benefit is the ability to rapidly scale data centers without disrupting the quality of service (QoS) [
9]. Pre-copy live migration is generally faster than post-copy because it continuously transfers memory pages from the source machine without interruption [
10]. Alternatively, post-copy migration initially sends only a minimal set of memory pages and transfers additional pages upon request from the destination server [
11].
Pre-copy live migration consists of six distinct phases as delineated in [
12]. The first phase involves selecting a VM for migration and choosing a new host for it. The second phase, reservation, requires confirmation from the target host that it can accommodate the migration. In the third phase, iterative pre-copy, the entire RAM of the VM is copied to the new host. The fourth phase, stop-and-copy, entails shutting down the original VM and migrating its central processing unit (CPU) state. During the fifth phase, commitment, the new host confirms successful migration and checks for any tampering. The final phase, activation, takes place if there is no tampering detected, allowing full activation of the VM on the new host. Following this, the source VM is decommissioned from the old server.
The post-copy approach follows similar steps to pre-copy but differs in the RAM transfer phase. Instead, post-copy involves handling page faults at the end of the migration process. If a page fault is identified by the source machine during this step, the migration process is paused to address the issue [
11].
2.2. Overloaded and Underloaded Servers
VM migration encompasses two tasks: firstly, determining the optimal placement for a new VM within the data center, and secondly, optimizing the current allocation of VMs. This emphasizes that VM migration comprises two critical components: (i) identifying overloaded and underloaded servers in the data center, and (ii) selecting VMs for migration. Thus, the process of migrating VMs across servers is intricately linked to the servers’ state in the data center [
1,
13]. It is advisable to initiate migration when there are any overloaded or underloaded servers. Overloaded servers lead to higher energy consumption rates, while underloaded servers result in inefficiencies in data center utilization and energy wastage [
14].
The definition of overloaded and underloaded servers typically relies on predefined workload value thresholds. These thresholds can be set statically or dynamically, with both methods being prevalent. In static threshold algorithms, the threshold values are constant throughout the migration process [
15]. Reactive controllers detect any excess resource usage on a server based on these threshold values [
3]. If system resource utilization surpasses the set threshold, the server is considered overutilized, triggering a migration algorithm.
Conversely, dynamic threshold algorithms adjust threshold values over time according to the overall workload [
16]. Here, a server is deemed overloaded if its resource usage (e.g., CPU, RAM, network bandwidth) reaches its capacity and exceeds the upper threshold value [
1,
13,
17]. Hosting an overloaded server can degrade QoS for applications running on it. An underloaded server, by contrast, falls below the lower threshold, indicating suboptimal utilization.
2.3. Selection of VM for Migration
To effectively manage dynamic VM migration, it is essential to identify instances of utilization imbalance for both current and future periods. This involves prioritizing servers with excessive utilization for VM offloading while considering alternative policies for underloaded servers. VM migration is triggered when a server’s state threatens resource degradation, potentially leading to service disruption. For example, an overloaded server can cause resource contention and affect service performance. In contrast, an underloaded server may lead to inefficient resource use but it poses minimal risk to service continuity. Hence, overutilization is the primary impetus for initiating rebalancing procedures [
1,
13].
Beyond resource utilization thresholds, other factors must be considered when selecting a VM for migration from a server. The migration time increases linearly with the VM’s RAM size, making smaller RAM sizes preferable [
1]. CPU utilization can also serve as a criterion for VM selection, with lower utilization rates being more desirable [
18]. This method, known as the highest potential growth policy, enables server utilization to rise without accruing future migration overhead [
10,
19].
A dynamic VM consolidation strategy includes information from users of services hosted in the data center. As shown in [
6], incorporating user-provided information such as the release time—indicating when a VM is no longer required for its services—improves data center energy efficiency. This demonstrates the advantages of using user information in consolidation algorithms.
2.4. Timing for VM Migration
Load balancing of VMs across servers can be triggered by various factors [
20]. One such factor is the violation of the system’s state, such as overutilization or underutilization of a server. Another trigger is the placement of a new VM. The process of initiating load balancing algorithms can be sender- or receiver-initiated [
20]. These algorithms are based on definitions of overloaded and underloaded servers [
21]. Sender-initiated algorithms transfer the load from overloaded servers to underloaded ones, whereas receiver-initiated algorithms distribute the load from all underloaded servers to reduce the overall number of active servers. However, the receiver-initiated method may cause overhead for the servers accepting the load from underloaded servers.
Load balancing methods can also be classified into static and dynamic types [
20,
22,
23]. Static load balancing methods, initiated by the system’s state, can be implemented with round-robin (RR) or weighted round-robin (WRR) algorithms. These algorithms are triggered according to a schedule. In RR, VMs are distributed across servers based on their order of appearance in the system. WRR considers the characteristics of VMs during the distribution process by assigning weights to each VM. However, this method can be more time-consuming than simple RR. Opportunistic load balancing, a branch stemming from static load balancing methods [
24], does not consider the current workload of the node and assigns VMs to all available servers in a free order. Other types include min–max and max–min algorithms, based on the completion time of tasks.
Dynamic load balancing requires continuous monitoring of the infrastructure and can be implemented with random sampling and throttled methods. During random sampling, the mapping between requests and resources occurs randomly, while the throttled method assigns resources based on their current load by using load metrics to assign VMs to servers according to their indexes [
25]. In contrast, the least-connections method selects a server with the fewest number of VMs and plans a new migration to that server [
26].
The most commonly used type of migration is pre-copy live migration, where the VM state is migrated while the original VM is still running [
2]. However, in cases where modified memory pages are encountered, the changes are not immediately reflected and must be copied again later [
12]. If there is a significant number of changes and the process of transferring modified pages exceeds a certain number of attempts, these pages will be skipped [
27]. Consequently, the migration time becomes unpredictable and may even fail if there are a high number of frequently written pages on the VM [
28].
Stop-and-copy is a hybrid approach where the VM is briefly suspended, and only specific memory pages, such as those frequently accessed by the VM, are transferred [
12]. This approach helps reduce downtime by limiting the number of transfers. On the other hand, post-copy live migration initially transfers only the data necessary for the VM to start at the destination. The remaining memory pages are then sent in one step after the VM has started. While this approach allows for predictable migration times, it also has drawbacks such as longer migration times and a higher likelihood of network transfer errors.
2.5. Selection of Destination Server for VM Migration
The selection of the most appropriate server for a given VM is a crucial step in optimizing data center performance. This decision depends on the desired objective function, which may vary according to the optimization problem at hand. A primary objective in data center optimization is to reduce the total number of active servers and minimize energy consumption [
29]. In some instances, the focus might be solely on minimizing energy consumption, with the chosen server having the lowest energy usage in the data center [
30].
Heuristic algorithms are frequently used to find feasible solutions for the NP-hard VM placement problem. Many of these algorithms are based on bio-inspired, population-based meta-heuristics [
31,
32]. For instance, particle swarm optimization uses four key components—initial position, velocity, weight, and fitness function—to determine its effectiveness. Other approaches may aim to minimize migration time and cost, and optimize global QoS [
33], or focus on resource allocation and server consolidation within the data center [
15].
The threshold-free method is an alternative for determining server status. This approach eschews static threshold values and instead identifies heavily loaded servers based on current usage metrics, such as CPU and RAM parameters. Migration occurs only if predicted values exceed the threshold at both present and future times. A key advantage of threshold-free algorithms is their time efficiency [
6]. However, some algorithms may also consider not only the improvement of server utilization but also its performance degradation rates post-migration [
4], thereby maintaining QoS for users while optimizing resource utilization.
AI-based methods can control system performance by managing resource usage rates [
34]. Another strategy involves using linear regression to predict future CPU consumption on the server and make preemptive migration decisions to avoid SLA violations [
35]. These methods are highly accurate as they utilize various AI techniques or combinations thereof. Nonetheless, they may have drawbacks such as high costs and extensive computing power requirements. The Markov decision process, optimized with reinforcement learning (RL), is another technique applied in this context [
36]. Additionally, deep learning can be combined with RL to explore data characteristics and learn scheduling strategies, or it can be applied directly to the VM placement problem [
37]. Markov chains have also been used for this purpose [
18].
2.6. Service Rate Degradation in VM Migration
In the era of cloud computing, the dynamic nature of VM migration between servers plays a crucial role in effectively managing workloads. As the number of VMs operating within a cloud increases, the contention for shared resources, such as CPU cores or memory, can lead to a degradation in the service rates of individual tasks or processes. The paper [
38] aims to derive an approximation for the stationary probability distribution of the number of customers in the phases using the asymptotic analysis method under the condition of increasing service time. Subsequently, [
39] provided a mathematical model and analytical framework for understanding the impact of service rate degradation in cloud nodes, with a specific focus on queuing systems with two phases of service.
Effectively managing VM migration is critical to ensuring high-speed service in server environments. By implementing intelligent resource allocation, proactive resource reservation, data pre-fetching, migration throttling, and efficient migration decision-making, one can optimize VM migration processes and improve service speed.
2.7. Summary of Recent Selected Works on VM Migration
In this overview, we consolidate findings from selected papers investigating diverse migration techniques designed to address server overload. The summarized works are presented in
Table 1, focusing predominantly on virtual machine (VM) migration strategies. The primary emphasis of these strategies is the minimization of CPU utilization, particularly relevant in the context of overloaded servers characterized by elevated CPU usage.
The migration process involves transferring Virtual Machines (VMs) from overloaded servers to those with lower resource utilization. This methodology aims to achieve a reduction in energy consumption within data centers. Numerous studies employ the criterion of high power consumption to define an overloaded server [
32,
40,
41]. The research primarily underscores the imperative of optimizing energy consumption in environments housing multiple servers that operate continuously, resulting in substantial energy consumption. Furthermore, a substantial portion of researchers characterizes overloaded servers based on elevated CPU utilization [
42,
43], overall resource consumption at the individual server level [
44], and across an entire cluster [
45].
Table 1.
Summary of recent selected works on virtual machine migration.
Table 1.
Summary of recent selected works on virtual machine migration.
| Ref. | Overloaded Server | Selection of VM for Migration | Selection of Destination Server for VM Migration | General Objective Function |
|---|
| [32] | Server with high power consumption | VM placement based on resource utilization and fault probability | Server, such that total power consumption with newly migrated VMs does not exceed the threshold | Glowworm swarm optimization |
| [40] | Server with high power consumption | VM less suited to server’s capacity | Server with low resource usage efficiency | Optimization of resource usage and minimization of resource wastage |
| [42] | Server with high CPU utilization | VM with the lowest allocated RAM | Server offering minimal energy consumption and migration time | Minimization of VM migrations and energy consumption |
| [43] | Server with high CPU utilization | VM with the lowest CPU utilization | Server meeting VM resource requirements and optimizing energy consumption | Minimization of energy consumption and number of VM migrations |
| [44] | Server with high CPU, RAM, and bandwidth utilization | VM selected based on utilization and lowest migration delay | Server with the highest available capacity and lowest power consumption | Load balancing across servers, minimization of power consumption, maximization of system performance |
| [46] | Server with CPU utilization higher than the average absolute deviation of other CPU values | VM with the smallest RAM and lowest migration delay | Under-utilized server with CPU utilization below median absolute deviation of past CPU values | Minimization of total energy consumption, number of VM migrations, percentage of SLA violations |
| [47] | Overloaded server determined by a greedy algorithm | VM with the lowest migration delay and cost | Target server determined by a greedy algorithm | Minimization of average VM migration delay |
| [48] | Server with high CPU utilization based on historical data | VM with the highest traffic | Server with most remaining resources | Minimization of energy consumption and maximization of QoS |
| [45] | Cluster of servers with high CPU utilization | VM with high-energy consumption and SLA violations | Cluster with low CPU utilization | Minimization of VM migrations and energy consumption |
| [41] | Server with high power consumption | VM with high migration costs selected | Server with minimal power increase post-migration | Optimization of consolidation score of metrics |
| [49] | Server with the most imbalanced power consumption | VM with the highest power consumption | A server that will not become over-utilized post-migration | Minimization of energy consumption |
| Our paper | Server exceeding the task threshold upon a new task acceptance | VM responsible for server overload | Another server or without migration | Minimization of number of tasks |
The majority of the summarized papers outlined in
Table 1 predominantly focus on identifying overloaded servers through high resource and energy utilization, primarily relying on large-scale data processing of consumption rates. In contrast, we propose an approach that emphasizes queuing theory and the advantages it offers to decision-making processes. It enables us to capture and model the stochastic nature of requests, considering the unpredictability of user interactions and system demands. This nuanced perspective enhances our decision-making framework, allowing for a server management strategy that accommodates the dynamic and unpredictable patterns inherent in real-world usage scenarios.
3. Model Formalization in Terms of Resource Utilization
In this section, we present the model formalization with respect to resource utilization. We describe the criteria for identifying overloaded servers and discuss the selection process for servers targeted for future VM migration.
3.1. General Assumptions
Consider a cloud computing system that delivers IT infrastructure via a range of computing resources. There are servers on which VMs are running, utilizing resources. Each s-server maintains a minimum volume of an r-resource when no VMs are running. The threshold for the maximum volume of the r-resource that can be occupied by the s-server is denoted by .
Let
represent the set of VMs running on the
s-server at time
t, and let
denote the volume of the
r-resource occupied by
v-VM at time
t. The total volume of the
r-resource occupied by all VMs on the
s-server at time
t is given by
and the utilization of the
r-resource on the
s-server at time
t can be defined as
These parameters, along with others for model formalization in terms of resource utilization and queuing model parameters regarding task processing, are summarized in
Table 2.
3.2. Modeling the Overloaded Server
The main challenge for cloud service providers is maintaining the QoS levels defined by the SLA. Typically, servers in a data center fall into two categories of edge cases: underloaded and overloaded. Overloaded servers pose the most significant threat to the stability of services running in the data center. Overutilization of available resources can result in the immediate failure of the running services. Therefore, detecting host overutilization is necessary. However, this problem remains challenging in a dynamic consolidation environment.
We consider the
s-server to be overloaded at time
t if the following inequality holds for all resources
:
Then, the server is considered overloaded at future times
if for all
and for all resources, the following inequality occurs:
Consequently, the set of overloaded servers is defined as follows:
3.3. Criteria for Server Selection in VM Migration
The procedure for unloading a server is performed iteratively according to two main migration principles. Firstly, the most utilized resource should be prioritized. Secondly, the VM selection policy should aim to minimize the impact of the migrated VM on the “new” server. Thus, the resource with the highest utilization level is defined by the following equation:
Then, we calculate the squared deviation of its resource usage coefficient from the recommended threshold
:
Finally, the selected VM should satisfy the following equation:
where
is the memory occupied by
v-VM at time
t.
The “new” server for the selected VM must not be overloaded at time
t, and it must not become overloaded after the migration procedure. Therefore, any of the following servers would satisfy the aforementioned requirements:
4. Queuing Model in Terms of Task Processing
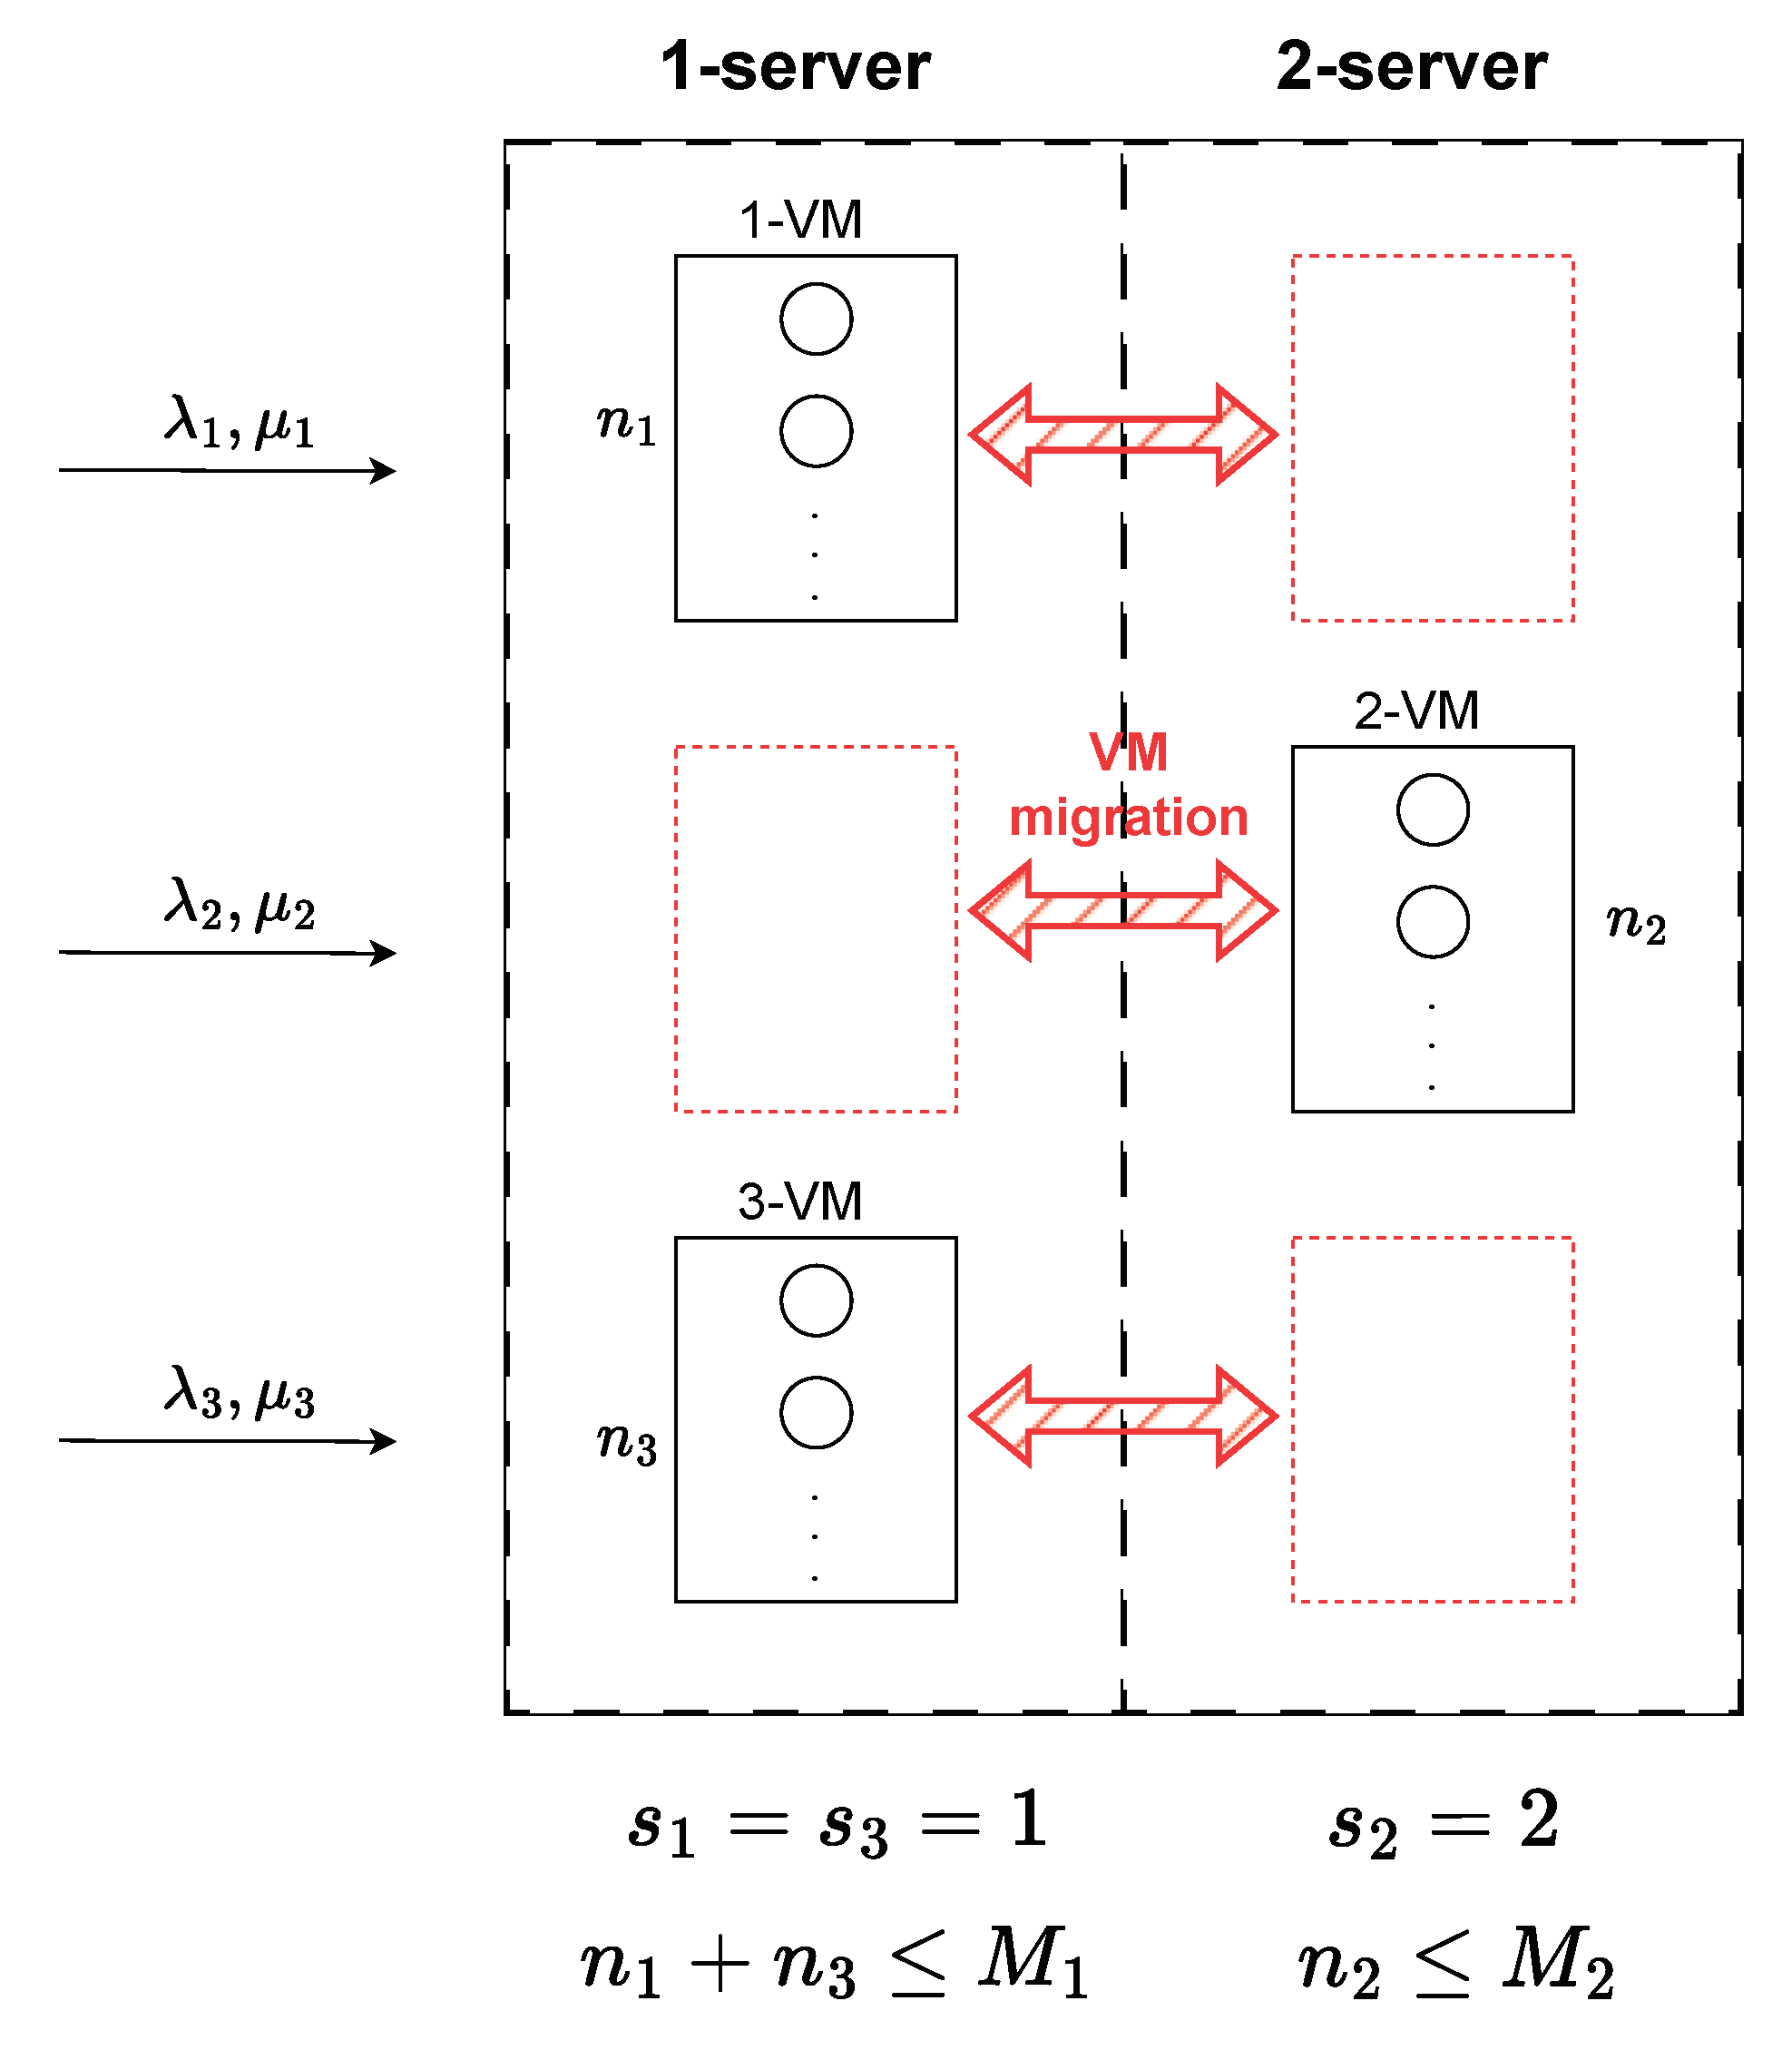
In this section, we present the queuing model in terms of task processing that represents features of the VM migration procedure described in the previous section.
4.1. General Assumptions
We shift our focus from resource occupation and utilization on servers to the number of tasks being processed by servers. We assume that tasks from users arrive according to a Poisson process with parameter
to be processed by a
v-VM. The processing time for a task follows an exponential distribution with an average of
. We consider only one type of resource, denoted as
. In
Table 3, we present the mapping between the parameters used in the two models, some of which will be described in the subsequent subsection.
Figure 1 illustrates a schematic of the corresponding queuing system.
4.2. Continuous-Time Markov Chain
We describe the system dynamics using a continuous-time Markov chain (CTMC)
with states
, where
represents the number of tasks being processed by all VMs, and
indicates the server assignment for each VM. The set of CTMC states is defined as follows:
For the scenario with two servers and three VMs, the set of states is:
The possible distributions of VMs across servers are as follows:
;
;
;
;
;
;
;
.
The principle of VM migration from one server to another upon task arrival is illustrated in
Figure 2. As depicted, the system must first have sufficient space; that is, available resources on a server. If at least one server has available resources and is not overloaded, then the task will be processed.
4.3. Transition Rates between CTMC States
In
Table 4, the transition rates of the CTMC are presented along with their descriptions. The stationary probability distribution
is computed using balance equations. Vector
is the unit vector with a 1 in the
place.
4.4. Metrics of Interest
We are interested in the following metrics:
The blocking probability of a task:
The average number of tasks being processed by
v-VM:
The average number of tasks being processed on the
s-server:
5. Numerical Results
In this section, we turn our attention to SaaS and present a numerical example to evaluate the system under two distinct scenarios.
5.1. Considered Scenarios
The domain of cloud gaming is experiencing a surge in popularity, offering users the ability to stream and engage in video games from remote servers, eliminating the need for advanced gaming hardware. This innovation grants gamers seamless access to a diverse portfolio of games on various devices, potentially diminishing hardware expenses and enhancing overall accessibility. Our investigation delves into the realm of game streaming services.
In our paper, we examined the case of SaaS, which allows users to access and use software over the Internet without the need to install, configure, and run the application on physical media. We considered streaming services in the gaming segment due to the growing trend towards cloud gaming. The same principle applies here: SaaS enables players to access a wide range of online games across devices. There are many examples of model applications, such as all Google services: users just need to create a Google account to gain full access to services; applications for designers like “Figma”, which allows multiple people to work together on one project in real-time with all files stored in the cloud; and CRM systems (customer relationship management), for example, “Insightly”—an online CRM and project management software for small and medium businesses, or “Salesforce”, a platform that performs broad CRM functions, such as lead management, opportunity management, and customer support.
We examine the effects of task arrival rates and average task duration on performance metrics such as blocking probability, the mean number of tasks in the process by v-VM, and the average task count on the s-server. For our system analysis, we define and . The numerical analysis concentrates on exploring the relationships between task arrival rates at servers and their processing rates ( and , respectively).
Two scenarios are contemplated. The first scenario illustrates the consequences of varying task arrival rates, with parameter adjustments made to demonstrate their influence on system performance. The second scenario evaluates the impact of changes in the average task duration by altering the parameter ratios.
5.2. Impact of Task Arrival Rate
In the initial case, scenario 1A, the parameter is highly variable, reflecting the potential for rapid fluctuations in the number of active users within gaming services. We assume a uniform arrival rate for tasks across all VMs, setting , with an average task processing time of 1 h.
Our first point of analysis is the blocking probability. We consider a scenario where the maximum number of concurrent tasks across all VMs on both servers ranges from 25–30. As depicted in
Figure 3a, the probability of blocking requests escalates with an increasing influx of tasks. Initially, there is negligible growth along the X-axis, but subsequently, the probability peaks at
. Regarding the average number of tasks per VM and server (
Figure 3b,c), we observe a linear increase in both cases.
Scenario 1B examines variations in incoming task rates by introducing a k-parameter as a multiplier. The resulting rates are defined as , , and , with k ranging from . In this case, we fix and , corresponding to a processing time of 30 min.
Figure 4a reveals an intriguing outcome: despite an uptick in incoming traffic, the blocking probability remains constant across different capacities
M. We commence with an examination of the average number of tasks per VM (
Figure 4b), noting disparities among the VMs. Moreover, 1-VM and 2-VM exhibit similar trends, likely due to the operation of the migration algorithm. Initially, 3-VM accommodates most tasks before redistribution occurs. At
, all three lines intersect, showing the same average number of tasks. The average number of tasks on 1 and 2 servers is the same due to the equal number of maximum allowed number of tasks processed on the servers (
Figure 4c).
5.3. Impact of Task’s Average Duration
In the second scenario, labeled 2A, we maintain a constant task arrival rate at tasks per hour to assess the influence of the variation of the average task duration on system performance metrics. The service rates, denoted by , are uniformly adjusted across all VMs and span from 1/6 to 4, indicative of the rate at which tasks are processed.
Figure 5a illustrates the blocking probability as a function of the service rates
. The graph exhibits a distinct inverse correlation: an increase in service rate corresponds to a reduction in blocking probability for all system capacities (
M values between 25 and 30). Notably, the lines representing various
M values cluster tightly, suggesting that the influence of service rate on blocking probability is consistent regardless of system capacity.
In
Figure 5b, the average number of tasks managed by each VM is depicted. As anticipated, there is a downward trend, indicating that a higher service rate results in a lower average number of concurrent tasks. Similarly,
Figure 5c displays the average task count per server. Echoing the trend observed for VMs, the graph demonstrates that servers process fewer tasks on average as service rates improve. This outcome confirms the expected impact of increased service rates, where tasks are completed more expeditiously, leading to a reduced average number of tasks within the system.
Collectively, these results emphasize the critical role of service rates in optimizing the performance of virtualized server environments. Enhanced task processing speeds (higher values) contribute to lower blocking probabilities and reduced numbers of tasks in both VMs and servers, underscoring the advantages of refining task processing times within such infrastructures.
In scenario 2B, we investigate how the system responds when the average task duration is modulated by a scaling factor k, resulting in variable service rates among VMs. We establish a baseline service rate h, equivalent to 5 min per task, with VM-specific service rates defined as , , and . The scaling factor k is varied from 0.1 to 10, providing a comprehensive range of service rate differentials for analysis.
Figure 6a depicts a marked decrease in the blocking probability as the scaling factor
k is incremented. This trend persists irrespective of the VM capacity, ranging
M from 25 to 30, indicating that a faster processing rate enhances the system’s capacity to manage incoming tasks, thereby diminishing the potential for task blocking.
In
Figure 6b, the average task count per VM is presented. Moreover, 1-VM, benefiting from the fastest service rate due to the
coefficient, exhibits a pronounced reduction in task numbers. Conversely, 2-VM and 3-VM experience a more gradual decline, reflecting their lower service rates. With the increase of
k, the average task counts across all VMs tend to equalize, signifying a transition toward uniform load distribution as discrepancies in task processing times across VMs decrease.
Figure 6c portrays the average task count across both servers. In alignment with the VM data, a significant drop in task numbers is observed as
k is elevated. The server connected to 1-VM, which boasts the highest service rate, initially presents a more rapid decline that eventually levels off. The 2-server exhibits a similar, albeit less pronounced, downward trajectory, mirroring the influence of the scaling factor on task processing duration and the associated service rate.
This analysis underscores the pivotal influence of task processing duration on resource allocation and overall system throughput. By manipulating service rates via the k parameter, we can emulate the outcomes of implementing task prioritization and resource optimization strategies within a virtual setting. The study reveals that dynamically modulating service rates in response to fluctuating workload conditions can lead to substantial enhancements in system performance.
5.4. Discussion
The management of cloud computing resources involves working with system and user-defined parameters. The cloud focuses on adjusting the system-defined parameters to meet user requests. In our analysis, parameters and represent the parameters that can be modified by the cloud provider. Conversely, and reflect user behavior and cannot be managed. One immediate effect of changing the values of and is on the energy efficiency of the data center. A higher number of and would result in increased energy costs; therefore, we aim to optimize the maximum number of tasks allowed to be processed on the VMs. To analyze the proposed model, we considered various service schemes, varying the maximum allowed number of tasks, arrival rate, and processing rate. We examined four cases: (i) there is an equal arrival rate from all users, (ii) the arrival rate changes proportionally among users while the total arrival rate remains constant, (iii) there is an equal processing rate at a constant arrival rate, (iv) the processing rate scales proportionally at a constant arrival rate.
By introducing different limits on the blocking probability, we can determine the optimal number of
M. From
Figure 3a, we can maintain a blocking probability of
and
for values of
. Increasing
M to 30 would allow us to provide services at an arrival rate of
. In
Figure 5a, the lines for different
M values are located closely enough. Additionally, the average number of tasks on the server for
is 10. This suggests that the number of active servers can be reduced in this case.
Another critical factor for service providers is the server load. In
Figure 3a, when
and
, the average number of tasks for both servers is 4, and the blocking probability is 0.015. To increase the average number of tasks for the servers, we would need to raise
, which leads to a spike in the blocking probability value almost doubling to 0.03.
Case 2B, as shown in
Figure 6c, provides insight into the behavior of tasks across three VMs at different values of the scaling factor
k, revealing two distinct patterns. There are several points of interest concerning the average number of tasks. We observe 15 tasks on both VM1 and VM3 once and 25 tasks on VM1 and VM2 twice. Furthermore, the slope of the blocking probability curves changes rapidly at the exact
k-values. Additionally, the average number of tasks on both servers exhibits similar behavior within the same range of
k. From this analysis, we can predict how different processing rates affect the system’s performance at the beginning of the migration procedure.
6. Conclusions
The rapid evolution of cloud computing technologies has underscored the importance of VM migration as a critical area of research. It plays a pivotal role in optimizing resource management, enhancing fault tolerance, and ensuring service continuity. Motivated by this reality, our paper provides a thorough examination of VM migration complexities within cloud computing frameworks. We explore various VM migration approaches, methods for assessing server load conditions, protocols for VM selection during migration, strategies for identifying optimal times for VM relocation, and criteria for selecting target servers.
At the heart of our discussion is the introduction of a queuing theory model designed to analyze the dynamics of VM migration between servers in cloud systems. By shifting from a traditional resource utilization perspective to one focused on task processing, we capture the stochastic nature of resource demands characterized by randomly timed task arrivals and variable processing duration. Our model is specifically designed for scenarios involving two servers and three VMs. Through numerical examples, we articulate several key performance metrics: the probability of task blocking, the average number of tasks processed by each VM, and the average number of tasks handled by servers. Furthermore, we highlight the impact of task arrival rates and mean task duration on these performance metrics.
Future research will broaden the scope of our model to include a variable number of servers and VMs and will not only consider Poisson arrival processes for tasks but also correlated arrival processes. Additionally, we will consider service rate degradation to develop a more comprehensive understanding of the dynamics within cloud environments. The frequency of migrations is another topic for future research, which would enable exploration beyond quality metrics such as blocking probability.
Author Contributions
Conceptualization, project administration, supervision, methodology, I.K.; writing—review and editing, I.K. and A.G.; formal analysis, investigation, A.K., A.S. and I.K.; software, validation, visualization, writing—original draft, A.K. and A.S. All authors have read and agreed to the published version of the manuscript.
Funding
This publication has been partially supported by the RUDN University Scientific Projects Grant System, project no. 025319-2-000.
Data Availability Statement
No new data were created or analyzed in this study. Data sharing is not applicable to this article.
Acknowledgments
The research was carried out using the infrastructure of the Shared Research Facilities “High Performance Computing and Big Data” (CKP “Informatics”) of the Federal Research Center “Computer Science and Control” of the Russian Academy of Sciences.
Conflicts of Interest
The authors declare no conflicts of interest.
Abbreviations
The following abbreviations are used in this manuscript:
| AI | artificial intelligence |
| CPU | central processing unit |
| CTMC | continuous-time Markov chain |
| IaaS | infrastructure-as-a-service |
| PaaS | platform-as-a-service |
| QoS | quality of service |
| RAM | random access memory |
| RR | round-robin |
| SaaS | software-as-a-service |
| SLA | service level agreement |
| VM | virtual machine |
| WRR | weighted round-robin |
References
- Hieu, N.T.; Francesco, M.D.; Ylä-Jääski, A. Virtual Machine Consolidation with Multiple Usage Prediction for Energy-Efficient Cloud Data Centers. IEEE Trans. Serv. Comput. 2020, 13, 186–199. [Google Scholar] [CrossRef]
- Le, T. A survey of live Virtual Machine migration techniques. Comput. Sci. Rev. 2020, 38, 100304. [Google Scholar] [CrossRef]
- Wolke, A.; Bichler, M.; Setzer, T. Planning vs. Dynamic Control: Resource Allocation in Corporate Clouds. IEEE Trans. Cloud Comput. 2016, 4, 322–335. [Google Scholar] [CrossRef]
- Zhao, H.; Feng, N.; Li, J.; Zhang, G.; Wang, J.; Wang, Q.; Wan, B. VM performance-aware virtual machine migration method based on ant colony optimization in cloud environment. J. Parallel Distrib. Comput. 2023, 176, 17–27. [Google Scholar] [CrossRef]
- Xing, H.; Zhu, J.; Qu, R.; Dai, P.; Luo, S.; Iqbal, M. An ACO for Energy-Efficient and Traffic-Aware Virtual Machine Placement in Cloud Computing. Swarm Evol. Comput. 2021, 68, 101012. [Google Scholar] [CrossRef]
- Khan, M.A.; Paplinski, A.P.; Khan, A.M.; Murshed, M.; Buyya, R. Exploiting user provided information in dynamic consolidation of virtual machines to minimize energy consumption of cloud data centers. In Proceedings of the 2018 Third International Conference on Fog and Mobile Edge Computing (FMEC), Barcelona, Spain, 23–26 April 2018. [Google Scholar] [CrossRef]
- Movahedi Nia, Z.; Khayyambashi, M.R.; Miri, A. A static VM placement and hybrid job scheduling model for green data centers. PLoS ONE 2020, 15, e237238. [Google Scholar] [CrossRef]
- Varasteh, A.; Goudarzi, M. Server Consolidation Techniques in Virtualized Data Centers: A Survey. IEEE Syst. J. 2017, 11, 772–783. [Google Scholar] [CrossRef]
- Nikzad, B.; Barzegar, B.; Motameni, H. SLA-Aware and Energy-Efficient Virtual Machine Placement and Consolidation in Heterogeneous DVFS Enabled Cloud Datacenter. IEEE Access 2022, 10, 81787–81804. [Google Scholar] [CrossRef]
- Singh, J.; Walia, N.K. Virtual Machine Selection and Migration: Challenges and Future Directions. In Proceedings of the 2023 7th International Conference on Intelligent Computing and Control Systems (ICICCS), Madurai, India, 17–19 May 2023; pp. 1126–1131. [Google Scholar] [CrossRef]
- Hines, M.; Deshpande, U.; Gopalan, K. Post-copy live migration of virtual machines. Oper. Syst. Rev. 2009, 43, 14–26. [Google Scholar] [CrossRef]
- Elsaid, M.E.; Abbas, H.M.; Meinel, C. Virtual machines pre-copy live migration cost modeling and prediction: A survey. Distrib. Parallel Databases 2022, 40, 441–474. [Google Scholar] [CrossRef]
- Xiao, Z.; Song, W.; Chen, Q. Dynamic Resource Allocation Using Virtual Machines for Cloud Computing Environment. IEEE Trans. Parallel Distrib. Syst. 2013, 24, 1107–1117. [Google Scholar] [CrossRef]
- Wu, X.; Zeng, Y.; Lin, G. An Energy Efficient VM Migration Algorithm in Data Centers. In Proceedings of the 2017 16th International Symposium on Distributed Computing and Applications to Business, Engineering and Science (DCABES), Anyang, China, 13–16 October 2017. [Google Scholar] [CrossRef]
- Farahnakian, F.; Ashraf, A.; Pahikkala, T.; Liljeberg, P.; Plosila, J.; Porres, I.; Tenhunen, H. Using Ant Colony System to Consolidate VMs for Green Cloud Computing. IEEE Trans. Serv. Comput. 2015, 8, 187–198. [Google Scholar] [CrossRef]
- Energy-aware resource allocation heuristics for efficient management of data centers for Cloud computing. Future Gener. Comput. Syst. 2012, 28, 755–768. [CrossRef]
- Khan, M.A. An efficient energy-aware approach for dynamic VM consolidation on cloud platforms. Clust. Comput. 2021, 24, 3293–3310. [Google Scholar] [CrossRef]
- Sayadnavard, M.H.; Toroghi Haghighat, A.; Rahmani, A.M. A multi-objective approach for energy-efficient and reliable dynamic VM consolidation in cloud data centers. Eng. Sci. Technol. Int. J. 2022, 26, 100995. [Google Scholar] [CrossRef]
- Kamran, M.; Nazir, B. QoS-aware VM placement and migration for hybrid cloud infrastructure. J. Supercomput. 2018, 74, 4623–4646. [Google Scholar] [CrossRef]
- Zhou, J.; Kumar Lilhore, D.; Manoharan, P.; Tao, H.; Simaiya, S.; Jawawi, D.; Alsekait, D.; Ahuja, S.; Biamba, C.; Hamdi, M. Comparative analysis of metaheuristic load balancing algorithms for efficient load balancing in cloud computing. J. Cloud Comput. 2023, 12, 85. [Google Scholar] [CrossRef]
- Diallo, M.; Quintero, A.; Pierre, S. An Efficient Approach Based on Ant Colony Optimization and Tabu Search for a Resource Embedding Across Multiple Cloud Providers. IEEE Trans. Cloud Comput. 2021, 9, 896–909. [Google Scholar] [CrossRef]
- Wang, W.; Casale, G. Evaluating Weighted Round Robin Load Balancing for Cloud Web Services. In Proceedings of the 2014 16th International Symposium on Symbolic and Numeric Algorithms for Scientific Computing, Timisoara, Romania, 22–25 September 2014; pp. 393–400. [Google Scholar] [CrossRef]
- Kumar Lilhore, D.; Simaiya, S.; Guleria, K.; Prasad, D. An Efficient Load Balancing Method by Using Machine Learning-Based VM Distribution and Dynamic Resource Mapping. J. Comput. Theor. Nanosci. 2020, 17, 2545–2551. [Google Scholar] [CrossRef]
- Joshi, V. Load Balancing Algorithms in Cloud Computing. Int. J. Res. Eng. Innov. 2019, 3, 530–532. [Google Scholar]
- Sarma, S. Metaheuristic based auto-scaling for microservices in cloud environment: A new container-aware application scheduling. Int. J. Pervasive Comput. Commun. 2021; ahead-of-print. [Google Scholar] [CrossRef]
- Arunagiri, R.; Kandasamy, V. Workflow scheduling in cloud environment using a novel metaheuristic optimization algorithm. Int. J. Commun. Syst. 2021, 34, e4746. [Google Scholar] [CrossRef]
- Raghunath, B.R.; Annappa, B. Virtual Machine Migration Triggering using Application Workload Prediction. Procedia Comput. Sci. 2015, 54, 167–176. [Google Scholar] [CrossRef]
- Li, C.; Feng, D.; Hua, Y.; Qin, L. Efficient live virtual machine migration for memory write-intensive workloads. Future Gener. Comput. Syst. 2019, 95, 126–139. [Google Scholar] [CrossRef]
- S, K.; Nair, M. Bin packing algorithms for virtual machine placement in cloud computing: A review. Int. J. Electr. Comput. Eng. (IJECE) 2019, 9, 512. [Google Scholar] [CrossRef]
- Li, P.; Cao, J. A Virtual Machine Consolidation Algorithm Based on Dynamic Load Mean and Multi-Objective Optimization in Cloud Computing. Sensors 2022, 22, 9154. [Google Scholar] [CrossRef] [PubMed]
- R B, M.; Tiwari, H.; Verma C, D. Virtual Machine Placement Using Energy Efficient Particle Swarm Optimization in Cloud Datacenter. Cybern. Inf. Technol. 2021, 21, 62–72. [Google Scholar] [CrossRef]
- Sheetal, A.P.; Ravindranath, K. High Efficient Virtual Machine Migration Using Glow Worm Swarm Optimization Method for Cloud Computing. Ing. Syst. D’Inf. 2021, 26, 591–597. [Google Scholar] [CrossRef]
- Li, W.; Yan-xiang, H. Web Service Composition Based on QoS with Chaos Particle Swarm Optimization. In Proceedings of the 2010 6th International Conference on Wireless Communications Networking and Mobile Computing (WiCOM), Chengdu, China, 23–25 September 2010. [Google Scholar] [CrossRef]
- Imran, M.; Ibrahim, M.; Din, M.S.U.; Rehman, M.A.U.; Kim, B.S. Live virtual machine migration: A survey, research challenges, and future directions. Comput. Electr. Eng. 2022, 103, 108297. [Google Scholar] [CrossRef]
- Biswas, N.K.; Banerjee, S.; Biswas, U.; Ghosh, U. An approach towards development of new linear regression prediction model for reduced energy consumption and SLA violation in the domain of green cloud computing. Sustain. Energy Technol. Assess. 2021, 45, 101087. [Google Scholar] [CrossRef]
- Habib, A.; Khan, M. Reinforcement Learning based Autonomic Virtual Machine Management in Clouds. In Proceedings of the 2016 5th International Conference on Informatics, Electronics and Vision (ICIEV), Dhaka, Bangladesh, 13–14 May 2016. [Google Scholar] [CrossRef]
- Caviglione, L.; Gaggero, M.; Paolucci, M.; Ronco, R. Deep reinforcement learning for multi-objective placement of virtual machines in cloud datacenters. Soft Comput. 2021, 25, 12569–12588. [Google Scholar] [CrossRef]
- Fedorova, E.; Lapatin, I.; Lizyura, O.; Moiseev, A.; Nazarov, A.; Paul, S. Asymptotic Analysis of Two-Phase Queueing System with Service Rate Degradation and Heterogeneous Customers. In Proceedings of the 2023 5th International Conference on Problems of Cybernetics and Informatics (PCI), Baku, Azerbaijan, 28–30 August 2023. [Google Scholar] [CrossRef]
- Fedorova, E.; Lapatin, I.; Lizyura, O.; Moiseev, A.; Nazarov, A.; Paul, S. Queueing System with Two Phases of Service and Service Rate Degradation. Axioms 2023, 12, 104. [Google Scholar] [CrossRef]
- Cao, H.; Hou, Z. Krill Herd Algorithm for Live Virtual Machines Migration in Cloud Environments. Int. J. Adv. Comput. Sci. Appl. 2023, 14, 718–724. [Google Scholar] [CrossRef]
- Wu, Q.; Ishikawa, F.; Zhu, Q.; Xia, Y. Energy and migration cost-aware dynamic virtual machine consolidation in heterogeneous cloud datacenters. IEEE Trans. Serv. Comput. 2019, 12, 550–563. [Google Scholar] [CrossRef]
- Belgacem, A.; Mahmoudi, S.; Ferrag, M.A. A machine learning model for improving virtual machine migration in cloud computing. J. Supercomput. 2023, 79, 9486–9508. [Google Scholar] [CrossRef]
- Ma, Z.; Ma, D.; Lv, M.; Liu, Y. Virtual Machine Migration Techniques for Optimizing Energy Consumption in Cloud Data Centers. IEEE Access 2023, 11, 86739–86753. [Google Scholar] [CrossRef]
- Kaur, A.; Kumar, S.; Gupta, D.; Hamid, Y.; Hamdi, M.; Ksibi, A.; Elmannai, H.; Saini, S. Algorithmic Approach to Virtual Machine Migration in Cloud Computing with Updated SESA Algorithm. Sensors 2023, 23, 6117. [Google Scholar] [CrossRef]
- Tuli, K.; Malhotra, M. Novel Framework: Meta-Heuristic Elastic Scheduling Approach in Virtual Machine Selection & Migration. Int. J. Eng. Trends Technol. 2023, 71, 436–452. [Google Scholar] [CrossRef]
- Ahmad, I.; Shahnaz, A.; Asfand-E-Yar, M.; Khalil, W.; Bano, Y. A Service Level Agreement Aware Online Algorithm for Virtual Machine Migration. Comput. Mater. Contin. 2023, 74, 279–291. [Google Scholar] [CrossRef]
- Ma, X.; He, W.; Gao, Y. Virtual Machine Migration Strategy Based on Markov Decision and Greedy Algorithm in Edge Computing Environment. Wirel. Commun. Mob. Comput. 2023, 2023, 6441791. [Google Scholar] [CrossRef]
- Li, H.; Liu, J.; Zhou, Q. Research on energy-saving virtual machine migration algorithm for green data center. IET Control Theory Appl. 2023, 17, 1830–1839. [Google Scholar] [CrossRef]
- Yang, C.T.; Wan, T.Y. Implementation of an energy saving cloud infrastructure with virtual machine power usage monitoring and live migration on OpenStack. Computing 2020, 102, 1547–1566. [Google Scholar] [CrossRef]
| Disclaimer/Publisher’s Note: The statements, opinions and data contained in all publications are solely those of the individual author(s) and contributor(s) and not of MDPI and/or the editor(s). MDPI and/or the editor(s) disclaim responsibility for any injury to people or property resulting from any ideas, methods, instructions or products referred to in the content. |
© 2024 by the authors. Licensee MDPI, Basel, Switzerland. This article is an open access article distributed under the terms and conditions of the Creative Commons Attribution (CC BY) license (https://creativecommons.org/licenses/by/4.0/).


.jpg)

