Article

Sensitivity Analysis of Factors Influencing Coal Prices in China

1
School of Management, Xi’an University of Science and Technology, Xi’an 710054, China
2
School of Economics and Management, Beijing University of Technology, Beijing 100124, China
3
School of Economics and Management, Yan’an University, Yan’an 716000, China
*
Authors to whom correspondence should be addressed.
Mathematics 2024, 12(24), 4019; https://doi.org/10.3390/math12244019
Submission received: 3 November 2024 / Revised: 9 December 2024 / Accepted: 19 December 2024 / Published: 21 December 2024

Abstract

:
A scientific assessment of the sensitivity of the Chinese coal market has become an important research topic. This paper combines Gaussian Process Regression (GPR) and Sobol sensitivity analysis to construct a GPR–Sobol hybrid model innovatively applied to the Chinese coal market, thus addressing a gap in the economic applications of this method. The model is used to analyze the sensitivity of factors influencing coal prices in China. The GPR–Sobol model effectively handles nonlinear relationships, enabling an in-depth exploration of key factors affecting price volatility and quantifying their impacts, thus overcoming the limitations of traditional econometric models in nonlinear data processing. The results indicate that economic growth, energy prices, interest rates, exchange rates, and uncertainty factors exhibit high sensitivity and significantly impact coal price fluctuations in China. Coal prices in northwest China are more sensitive to interest rates and geopolitical risks, while prices in east and south China are more responsive to exchange rates but less so to economic policy uncertainty. Additionally, coal prices in north, south, and east China are highly sensitive to international energy prices, indicating that coal prices are dominated by the global energy market, yet their weak response to macroeconomic indicators suggests these regions is still insufficiently mature.

1. Introduction

China is a big country of coal consumption, and coal has a decisive impact on China’s energy market and energy transformation [1]. The stability of coal prices is critical for accelerating the construction of a modern energy system, ensuring energy security, and achieving carbon peaking and neutrality goals. However, since the Chinese government fully liberalized coal prices in 2005, coal prices have fluctuated frequently [2]. Coal prices rose in the first half of 2008 on the back of strong demand. However, in the second half, as the financial crisis deepened, weakening demand and excess supply caused prices to drop. From 2012 to 2016, coal prices fell by over 50% cumulatively in four years. At the same time, the government’s energy transition strategy further reduced coal demand, challenging coal enterprises. In February 2016, China’s supply-side structural reform, including a capacity reduction policy, drove coal prices up. By early 2020, the price of thermal coal had risen from CNY 385/ton to CNY 565/ton, maintaining a high level. In 2021, various factors, such as global economic recovery, increased energy demand, international energy market fluctuations, extreme weather, geopolitical risks, and domestic supply shortages, led to a surge in coal prices. Thermal coal prices spiked by over 300% compared to early 2016, reaching unprecedented levels. The historical changes in China’s coal prices indicate that their influencing factors have become increasingly complex. Changes in the prices of other energy sources, shifts in the macroeconomic environment, and policy changes all have a significant impact on coal prices, leading to frequent fluctuations [3].
In the new era of pursuing high-quality and sustainable development, China still faces the main energy structural issue of being “rich in coal, but poor in gas and oil”. For the foreseeable future, coal and other traditional energy sources will remain the main sources of energy consumption. As one of China’s main energy sources, coal price fluctuations not only directly affect the stability of the energy market but also have broader economic, social, and environmental impacts. Especially in terms of the environment, in the short term, fluctuations in coal prices may intensify mining and usage, leading to environmental pollution and ecological damage. In the long term, fluctuations in coal prices may influence the decisions of countries and regions regarding energy transition and environmental protection and could even delay the widespread adoption of green energy. In conclusion, the frequent fluctuations in coal prices have caused unprecedented transformations and challenges to the coal market [4]. In order to better cope with the instability of the coal market, it is particularly important to study the sensitivity of China’s coal price to various external factors. This paper employs a non-parametric model based on Gaussian Process Regression (GPR) combined with Sobol sensitivity analysis to quantify and analyze the factors affecting coal prices in China. This approach aims to identify key factors influencing coal prices, providing strong support for energy policy formulation, market forecasting, and regulation, and promoting the stable development of the energy market.
At this stage, research on coal price fluctuations can be divided into two main areas. The first area examines the factors influencing coal price volatility, analyzing how energy prices [2,5,6], economic growth [7,8], fiscal policy [9,10], monetary policy [11,12,13], and uncertainty [14,15,16] affect coal prices, focusing on in-depth analysis from a single dimension. The second area explores coal price forecasting [17,18,19] and the broader impacts of its volatility on macroeconomics [20,21,22], policy choices [23,24], the real economy [25,26,27], financial markets [28,29], energy markets [6,30,31,32], and other related markets [33,34], demonstrating the linkage effects between the coal market and related markets. This paper mainly focuses on the impact of multiple factors on coal prices. For example, Lin et al. [10] found through calculations and analysis that taxes directly influence the market price of coal. Rosa [12] used the event study method to analyze the impact of monetary policies on energy prices, finding that interest rate cuts and asset purchase programs boost economic growth while also raising energy prices, highlighting the significant role of monetary policy in energy markets. Zheng et al. [15] employed GARCH and CGARCH models to analyze the influence of geopolitical risks on coal price volatility in China’s futures market, concluding that such risks significantly increase price fluctuations. Carnero et al. [35] explored the relationship between coal prices and European Union Emission Allowance (EUA) prices, finding that the forward prices of coal and EUA are determined by the market’s equilibrium state, revealing the synergistic effect between coal prices and EUA prices. Shawhan and Picciano [36] used the E4ST model to simulate the potential impacts of implementing the “Grid Resiliency Pricing Rule”. The study found that the Grid Resiliency Pricing Rule could drive up coal prices by extending the operational lifespan of coal power plants, while also leading to significant environmental and health costs.
In studying coal price fluctuations, domestic and international scholars have primarily used traditional methods, such as Vector Autoregression (VAR) models [4,32,37,38,39], Vector Error Correction (VEC) models [6,38], and GARCH family models [15,31,33,40], to analyze internal factors and volatility. Additionally, Autoregressive Distributed Lag (ARDL) models [41,42,43] and Fully Modified Ordinary Least Squares (FMOLS) [7,44] have been used to identify long-term factors affecting coal prices. While these methods offer valuable insights, they have limitations. For instance, VAR assumes linear relationships between variables, and as the number of explanatory variables increases, the model’s complexity grows, potentially leading to inaccurate estimates. The ARDL model presumes long-term stable relationships but may struggle with multicollinearity among explanatory variables. Compared to traditional econometric models, Gaussian Process Regression (GPR) has a strong ability to handle nonlinear relationships and can more accurately describe the complex interactions between variables [45,46,47]. Additionally, it can provide reliable predictions and uncertainty estimates even with a small sample size [48]. Combining Gaussian Process Regression with Sobol analysis offers a powerful sensitivity analysis tool for coal price studies [49,50], allowing for deeper exploration of the key factors driving price fluctuations and quantifying the magnitude of their impacts [49,50,51].
In summary, the existing research on the influencing factors of coal prices provides a solid theoretical foundation and a logical starting point for this paper, but there are still areas for further exploration.
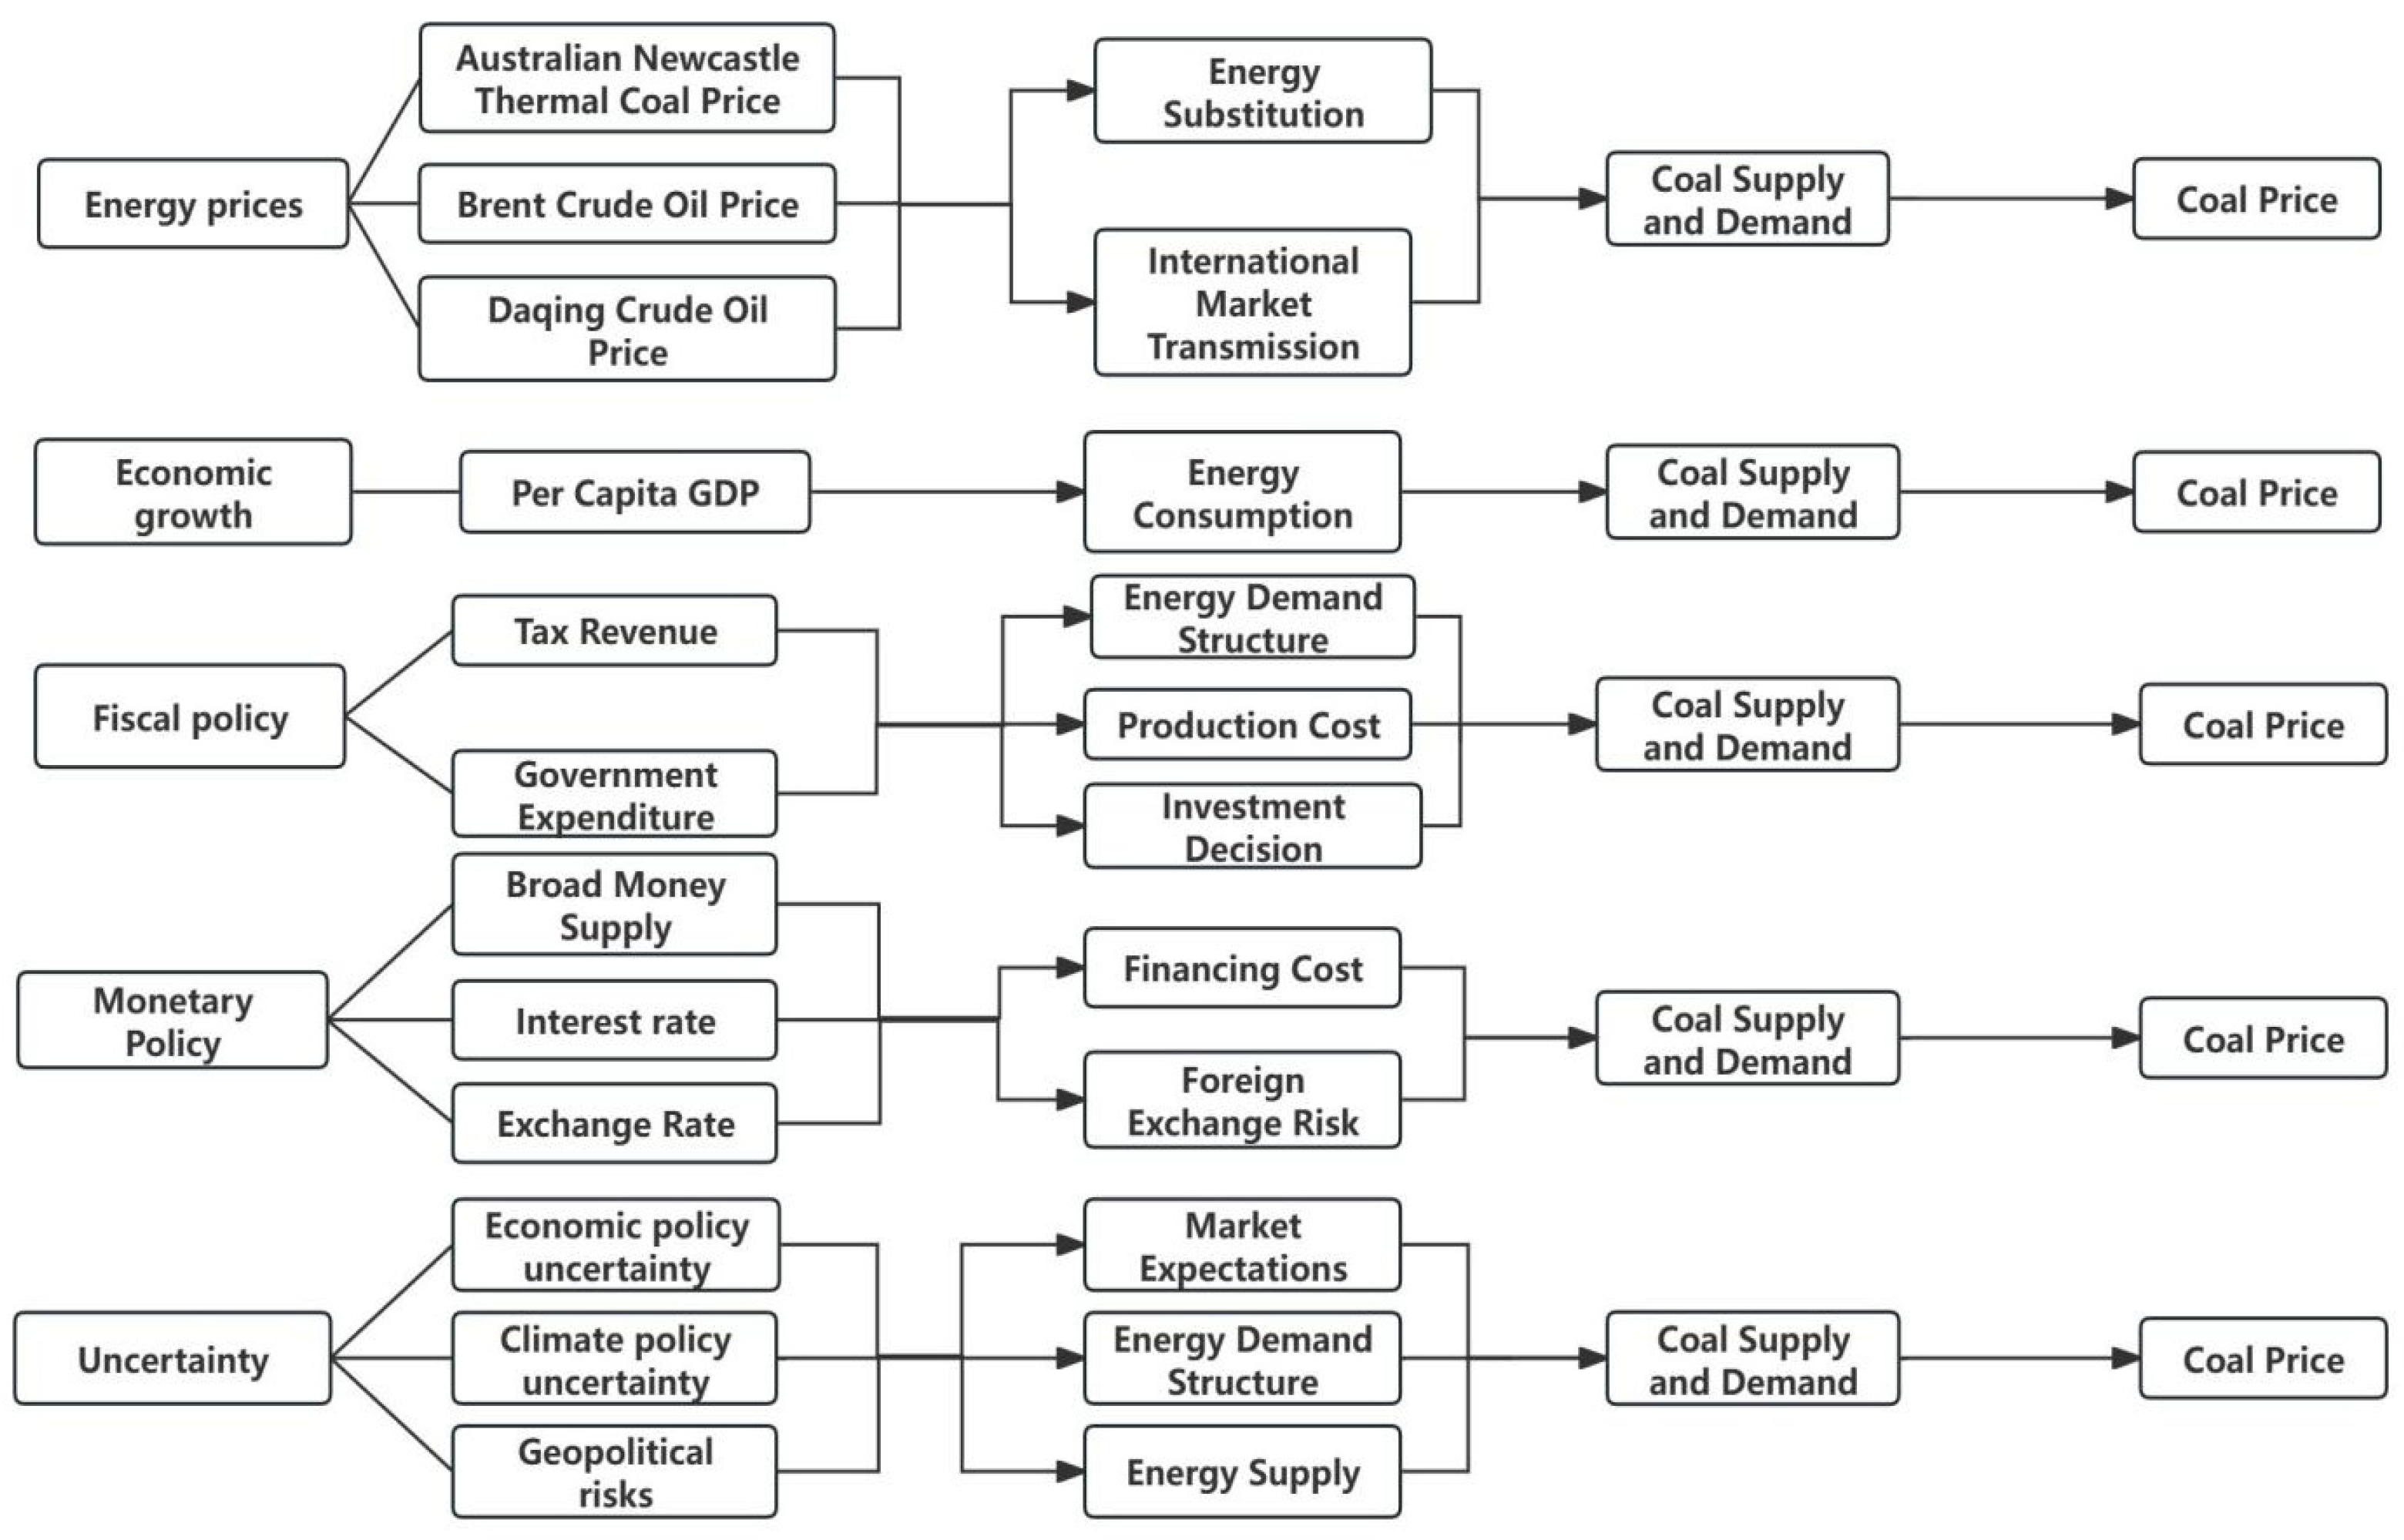
  • Although much research has discussed factors influencing coal prices in China, most studies focus on a single or a few factors. Few incorporate multiple factors into a single analytical framework for quantitative analysis. Therefore, starting from five dimensions of energy price, economic growth, monetary policy, fiscal policy, and uncertainty factors, this study selects 12 key indicators for analysis. It conducts specific quantitative analyses for each factor, providing a more comprehensive analytical framework for understanding the formation of coal prices.
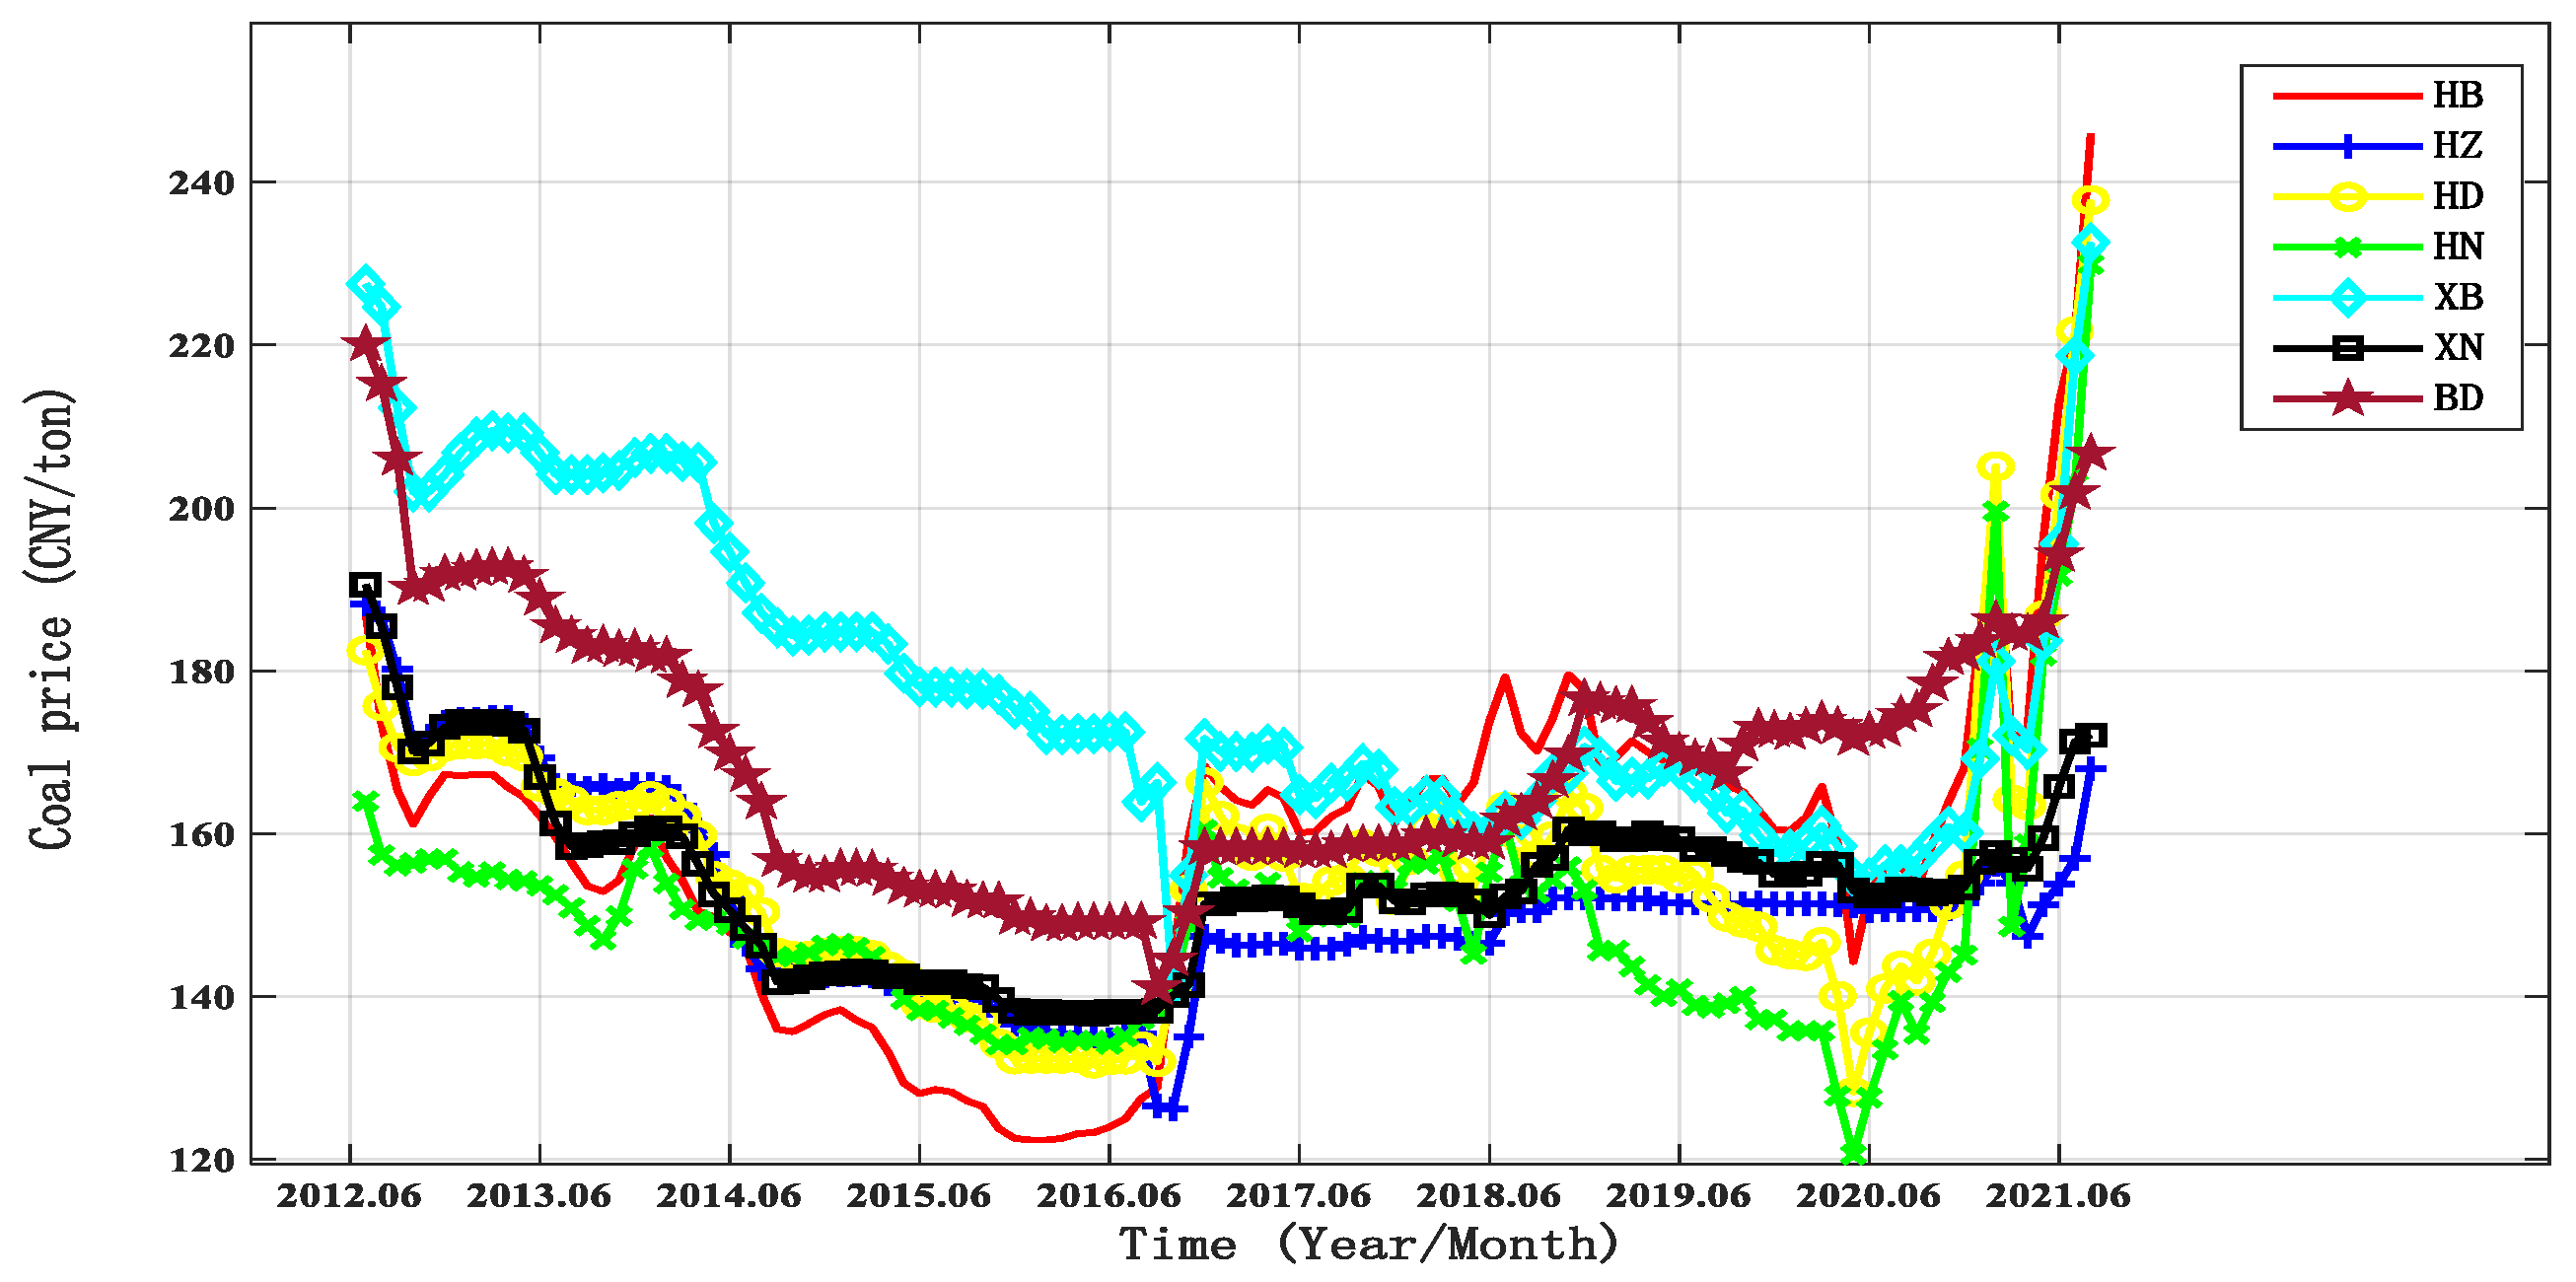
  • Due to the high-dimensional nonlinearity and strong randomness of Chinese coal prices, as illustrated in Figure 1, this paper innovatively applies the GPR–Sobol hybrid model to the Chinese coal market, filling the gap in its economic applications. Firstly, Gaussian Process Regression (GPR) is used to establish a non-parametric model, and a quantitative analysis is conducted using the accuracy parameters of the predicted outputs or estimated variances. The Sobol method, based on variance decomposition, effectively addresses the sensitivity caused by interactions between parameters in highly nonlinear models, making model construction more accurate and avoiding the limitations of traditional econometric models in data processing.
  • Due to differences in economic development stages, market structures, market mechanisms, and external environments across seven regions in China, this paper conducts a heterogeneity analysis of the regional coal markets. While performing a sensitivity analysis from an overall perspective, it also compares and analyzes the sensitivity performance of coal markets in the seven regions. This reveals the uniqueness and diversity of each regional market, fills existing research gaps, and provides more targeted theoretical support for regional policy formulation and market strategies.
  • There is limited application of advanced methods, such as Gaussian Process Regression (GPR), in the existing literature. This paper applies the GPR–Sobol hybrid model to the energy market and provides insights for market analysis in other contexts.
The following is the organization of the remainder of this article. The second part of the paper explores in depth how five major factors affect the growth and development of the coal market. In Section 3, we describe in detail the relevant variables of empirical research, how to select samples, and the construction method of the model. In Section 4, we present the findings of the study and provide a brief interpretation of these findings. In Section 5, we provide an overview of the recommendations and policy recommendations.

2. Theoretical Analysis

As a commodity, the value of coal is reflected by its price. According to the market price determination theory, the price of the market is ultimately determined by the fundamental changes in supply and demand. However, due to special internal and external conditions, the various factors that determine coal prices may vary from region to region.
Australia, as one of the world’s major coal exporters, has been highly dependent on its export trade for many years, especially with key markets in Asia [52]. Therefore, Australian coal prices are mainly influenced by export demand, exchange rates, production capacity, and transportation costs, all of which are factors related to export trade. The European coal market is affected by a number of factors, including, in particular, its dependence on imports from other countries, such as Australia, South Africa, and the United States. Fluctuations in global coal prices, particularly in these major coal-exporting countries, have a direct and significant impact on price levels in the European coal market [52]. Secondly, energy transition policies and environmental regulations, such as the EU’s carbon emission limits and the carbon trading market (EU ETS), directly affect coal demand and prices [53]. Additionally, geopolitical factors, such as sanctions, can lead to fluctuations in the Russian coal supply, which in turn can create pressure on the market [54]. In the United States, coal prices are significantly influenced by a number of factors, including domestic electricity demand, fluctuations in natural gas prices, and policy adjustments. U.S. coal price fluctuations are primarily driven by fluctuations in domestic electricity demand [55]. Although coal usage has been gradually declining, it still holds a certain share in some regions. When domestic electricity demand increases, coal demand also rises, which in turn drives up coal prices. Additionally, when natural gas prices rise, coal demand may increase, leading to higher coal prices. Furthermore, changes in environmental regulations and energy policies affect coal demand, thereby influencing prices [56]. Government energy policies and environmental requirements also have a profound impact on coal prices [36].
As the world’s largest coal consumer and second largest producer, the price of coal in China is also affected by multiple factors, which is similar to the complexity of coal market dynamics in various regions of the world [3]. This paper summarizes the transmission mechanisms of coal prices and their influencing factors, as shown in Figure 2.
In the era of globalization, energy prices, and especially the linkage between the price comparison mechanism and the international financial market, have a profound and significant impact on coal prices. The price comparison effect of the energy market has a significant influence on the trend of domestic coal prices. Given the cost competitiveness of coal compared to other energy sources, when the price of alternative energy sources rises, the energy consumption patterns and composition of companies often shift to coal accordingly, triggering an increase in the demand for coal and resulting in an increase in the price of coal [57]. In addition, the close interwoven relationship between global and local coal markets indicates that fluctuations in international market conditions affect domestic coal prices through various routes, such as coal trading, thereby increasing price volatility [30].
With the rapid development of industrialization and urbanization, and the continuous improvement of consumers’ quality of life, economic growth often leads to the rapid expansion of manufacturing, construction, and other energy-intensive industries. This keeps the demand for electricity rising in tandem with energy. Because these industries largely rely on coal for production, economic expansion often directly translates into higher demand for coal, driving up coal consumption [58]. Therefore, economic expansion increases energy demand across various industries, pushing coal consumption upward. If coal supply cannot keep up with the growing demand, prices will rise [59].
Fiscal policy can influence coal-related companies’ production costs, investment decisions, energy use, and demand structure through certain measures, such as taxes and expenditures, thus affecting coal prices. Adjustments in tax policy directly impact companies’ production costs and market pricing. When coal-related tax rates are raised, companies face increased cost pressures, leading to higher coal prices [60]. Furthermore, government investment in energy infrastructure, supporting research and development of new energy technologies, promoting energy efficiency programs, and providing financial support can reshape the supply and demand landscape of the coal market, which in turn affects energy costs [61].
Monetary policy is one of the key tools for national macroeconomic regulation. By influencing interest rates, it directly affects companies’ financing costs. When monetary policy is loose, the broad money supply increases, market interest rates decline, and companies’ financing costs decrease, prompting them to expand investment and production, which in turn raises demand for various forms of energy, driving up coal and other energy prices; the opposite occurs when monetary policy is tightened [62]. Moreover, changes in monetary policy can affect exchange rate stability, introducing foreign exchange risk into the international trade of commodities like coal. Because oil is priced in U.S. dollars, monetary policy impacts energy costs through exchange rates. Monetary policy affects spot exchange rates, causing oil price fluctuations, which in turn influence the prices of all energy sources [13].
Uncertainties may have an impact on forecast changes in the coal market and the relationship between supply and demand. The coal market possesses both financial and geopolitical attributes, meaning coal prices are significantly affected by uncertain factors [63]. As the financial attributes of the market increase, uncertainties stemming from changes in economic policy have impacted the energy demand changes in the real industry, thereby affecting coal prices [14]. Faced with the severe situation of global climate change, governments of all countries are taking climate-related policy measures to deal with environmental problems and promote the transformation of the energy system toward a low-carbon direction. However, the formulation and implementation of climate policies are fraught with uncertainty, which affects market expectations regarding future coal supply and demand, consequently influencing coal prices. If the market anticipates tighter policies and reduced coal supply, prices may rise; conversely, if the outlook is more lenient, prices may fall [64]. Finally, geopolitical events can increase the risk of energy supply disruptions. For example, regional conflicts or political instability may affect the supply chains of energy-producing countries. When the risk of supply disruptions rises, market expectations regarding energy supply become uncertain, often leading to increases in prices for various energy sources [15].
This section provides an in-depth theoretical analysis of the main factors influencing coal prices and offers theoretical support for the selection of subsequent indicators. The following text will, based on this foundation, construct the influencing indicators of coal prices and conduct a quantitative analysis using the GPR–Sobol method to verify whether the factors mentioned in the theoretical analysis have a significant impact on coal prices, along with the relevant analysis.

3. Research Design and Data

3.1. Variable Selection and Data Sources

This study focuses on the coal market in northwest, southwest, central, east, north, south, and northeast China and analyzes its price index. In selecting the influencing factors, this article, based on theoretical analysis, reviewed the relevant literature and screened variables according to their frequency of occurrence. Subsequently, the variables were tested in a preliminary model, and those with weaker effects were excluded. Ultimately, starting from five dimensions of energy price, economic growth, monetary policy, fiscal policy, and uncertainty factors, this study selects 12 key indicators for analysis. It is worth noting that the broad money M2 not only includes the money in circulation but also the quasi-money part, which not only reflects current actual purchasing power but also potential purchasing power in the future. Because M2 is a stock variable, it cannot accurately reflect the dynamic changes in the broad money supply. Therefore, this paper uses the month-on-month growth rate of M2 to illustrate its fluctuations [65]. The climate policy uncertainty data for China used in this study were obtained using the methodology outlined by Ma et al. [66]. The remaining data were sourced from the Wind database “https://www.wind.com.cn/mobile/EDB/zh.html (accessed on 20 May 2024)” and the Economic Policy Uncertainty website “http://www.policyuncertainty.com (accessed on 20 May 2024)”. Given that the variables adopted in this paper are time series data with non-stationary characteristics, the application of traditional parametric modeling methods may encounter the issue of spurious regression. However, the GPR–Sobol method employed in this paper is a non-parametric modeling technique that can deeply explore the complex patterns of associations among variables within the original dataset and identify the degree and direction of influence of each input on the output, thereby effectively avoiding the problem of spurious regression. The data range for this study is set from June 2012 to July 2021, utilizing 110 monthly data points. The core rationale for choosing this period of time to study coal prices is that it symbolizes a new period of instability in the coal market following the 2008 financial crisis, as shown in Figure 1. It covers the entire process of coal prices declining sharply, recovering, and then experiencing extreme increases. Studying this period can comprehensively reveal the changing trends in the coal market and the driving factors behind them. In addition, the extreme price fluctuations during 2020–2021 provide unique research value, helping to deepen the understanding of the impact of short-term economic fluctuations, sudden uncertainties, and other factors on the coal market. This article does not use the latest data from 2022 onward, mainly because in recent years there has been an increasing global push to reduce coal usage and governments have progressively intervened in coal prices. As a result, the coal price data from recent years do not accurately reflect the true market price, leading to a certain degree of data distortion. The selection and sources of the variables are detailed in Table 1.
In this study, each variable of 110 sample sizes was selected, and specific descriptive statistics can be found in Table 2. The analysis results showed that the mean value, standard deviation, and important statistical indicators in the sample showed the properties of normal distribution, and no standard deviation was found to exceed the absolute value of the mean value, so it was concluded that there were no obvious outliers.
In order to examine the multicollinearity issues between variables, this paper uses Stata software (The version of state16.0 was used in the part of multicollinearity test) to calculate the variance inflation factor (VIF) for each variable. Table 3 presents the calculation results.
Based on the results in Table 3, the variance inflation factors (VIFs) for BRENT and DQO are 145.82 and 150.96, respectively, both of which are well above the critical threshold of 10, indicating a strong multicollinearity between these two variables and others, which could lead to serious multicollinearity issues. At the same time, the VIF values for GDP and r also exceed 10, further intensifying the risk of multicollinearity. Although there is significant multicollinearity between some of the variables, the GPR–Sobol method used in this study differs from linear modeling. It is based on non-parametric, nonlinear modeling, which can effectively capture the complex relationships between variables. With its inherent regularization properties and optimal parameter selection, the method can adapt to datasets with different characteristics, enabling precise modeling [45,46,47,48]. Therefore, it can effectively avoid the complex issues caused by multicollinearity.

3.2. Gaussian Process Regression Model

Gaussian Process Regression (GPR), which combines statistical learning with Bayesian theory, is an efficient machine learning technique. It is particularly well-suited to analyzing complex datasets characterized by high dimensionality, nonlinearity, and significant randomness [45,46]. Unlike traditional regression methods, GPR does not require predefined assumptions about the functional form of the data. Instead, it learns an appropriate model from the data set and uses flexible, nonparametric methods to describe the interrelationships between inputs and outputs [46]. Furthermore, hyperparameters (such as the parameters in the kernel function) directly affect the performance of the model. In modeling, the method of maximizing marginal likelihood is generally used to automatically learn the hyperparameters in the model so that the model can adapt to various data features without human intervention [47].
In this study, for the Chinese coal market, which is characterized by strong price randomness, high volatility, and complex influencing factors, Gaussian Process Regression (GPR) effectively captures nonlinear relationships between factors and prices. It enables accurate predictions of both the mean and variance, facilitating precise modeling and uncertainty quantification [45,46]. The performance of GPR is often evaluated using the R2 value [45,46,47,48]. Here, a higher R2 value indicates that the input variables effectively explain the variations in coal prices and the model successfully captures the primary factors driving coal price fluctuations.
Next, we will introduce Gaussian Process Regression.
Assume that the training set consists of an input variable matrix X = { x i } i = 1 n and an output variable Y = { y i } i = 1 n , where x i is a vector containing m variables, i.e., x i R m , and y i is the corresponding scalar output. Here, n is the number of samples, and m is the number of variables.
To construct a complex nonlinear relationship model between the variables X and Y , the Gaussian Process Regression method is employed, with the specific form given by Equation (1):
Y = f ( X ) + ε
ε N ( 0 , σ n 2 ) is independent and identically distributed Gaussian white noise. After the data have undergone appropriate scaling and preprocessing, a regression function is predefined, which follows a Gaussian prior distribution with a mean of zero. The specific form is given by Equation (2):
y = [ f ( x 1 ) , f ( x 2 ) , , f ( x n ) ] G P ( 0 , C )
where C is an n × n covariance matrix that describes the covariance relationship between the points in the dataset. The Squared Exponential (SE) covariance function is one of the widely used covariance functions, represented as shown in Equation (3):
C ( x i , x j ) = σ f 2 e x p { 1 2 ( x i x j ) T M 1 ( x i x j ) } + δ i j σ n 2
If i = j , then δ i ¨ j = 1 . Conversely, δ i ¨ j = 0. M = l 2 I , where l is the length scale parameter that determines the smoothness of the model; I represents an identity matrix; and σ corresponds to the signal variance in the model.
To determine the set of hyperparameters θ = ( l , σ f , σ n ) for the Gaussian Process Regression (GPR) model, this can be achieved by maximizing the given log-likelihood function (4):
L = n 2 l o g ( 2 π ) 1 2 l o g ( d e t ( C ) ) 1 2 y T C 1 y
For a new input set X n e w , the corresponding output variable Y n e w also follows a Gaussian distribution, allowing us to calculate its mean and variance as follows:
y ¯ n e w = k T ( x n e w ) C 1 y
σ n e w 2 = C ( x n e w , x n e w ) k T ( x n e w ) C 1 k ( x n e w )
Gaussian Process Regression (GPR) provides a highly flexible and accurate solution for Sobol analysis, which can effectively deal with complex scenarios with small sample sizes, high dimensions, and complex parameter interactions. Gaussian Process Regression (GPR) has become a powerful tool for global sensitivity analysis due to its unique characteristics [45,46,47,48].

3.3. Sobol Sensitivity Analysis Method Based on Variance Decomposition

The Sobol method, first proposed by Sobol in 1993, is a widely used quantitative global sensitivity analysis technique. This method evaluates the influence of input parameters on the outcome by analyzing the variance of the output, including the individual effect (S1) and the interaction effect (ST), thereby visually demonstrating the effect of parameters on the output uncertainty [49,50,51].
Based on the prediction accuracy and the estimated variability of the GPR agent model, an efficient method is constructed to calculate the Sobol index. This process aims to accurately identify the main variables driving price movements and quantitatively assess their influence, thereby significantly improving the science and accuracy of sensitivity analysis. A higher sensitivity index indicates that this variable plays a more important role in the change in coal prices.
Next, we will introduce the variance-based Sobol sensitivity analysis method.
Assuming that in the output model y = f ( x ) x is an n-dimensional vector, f(x) can typically be decomposed into a sum of functions with increasing dimensions:
f ( x ) = f ( x 1 , x 2 , , x n ) = f 0 + s = 1 n i 1 < < i s f i 1 i 2 i s ( x i 1 , x i 2 , , x i s )
where n is the number of variables, f(0) is the constant term, and 1 i 1 < i 2 <… i s n, l s n, f i 1 i 2 i s ( x i 1 , x i 2 , , x i s ) is the multivariable function term of i s . Then, the total variance can be decomposed as
V = s = 1 n i 1 < < i s V i 1 i 2 i s ( x i 1 , x i 2 , , x i s )
The first-order sensitivity index can be defined as
S i = V i V , ( 1 i n )
The s-th-order sensitivity index can be defined as
S i 1 i 2 i s = V i 1 i 2 i s V , ( 1 i 1 i 2 < i s n )
The first-order sensitivity index S i measures the independent contribution of a single variable x i to changes in system output. Through first-order sensitivity analysis, key variables that have the greatest impact on model output can be identified. The s-th-order sensitivity index S i 1 i 2 i s quantifies the strength and influence of interactions between variables x i 1 , x i 2 , , x i s , revealing the complex contributions of these variable combinations to system output.
S i t o t = 1 V ( i ) V
where V ( i ) represents the variance term when the influence of the i-th parameter is not considered; the total-order sensitivity index S i t o t is the sum of the sensitivity coefficients of all orders, reflecting the overall impact of parameter changes on the model output variable.

4. Empirical Results and Analysis

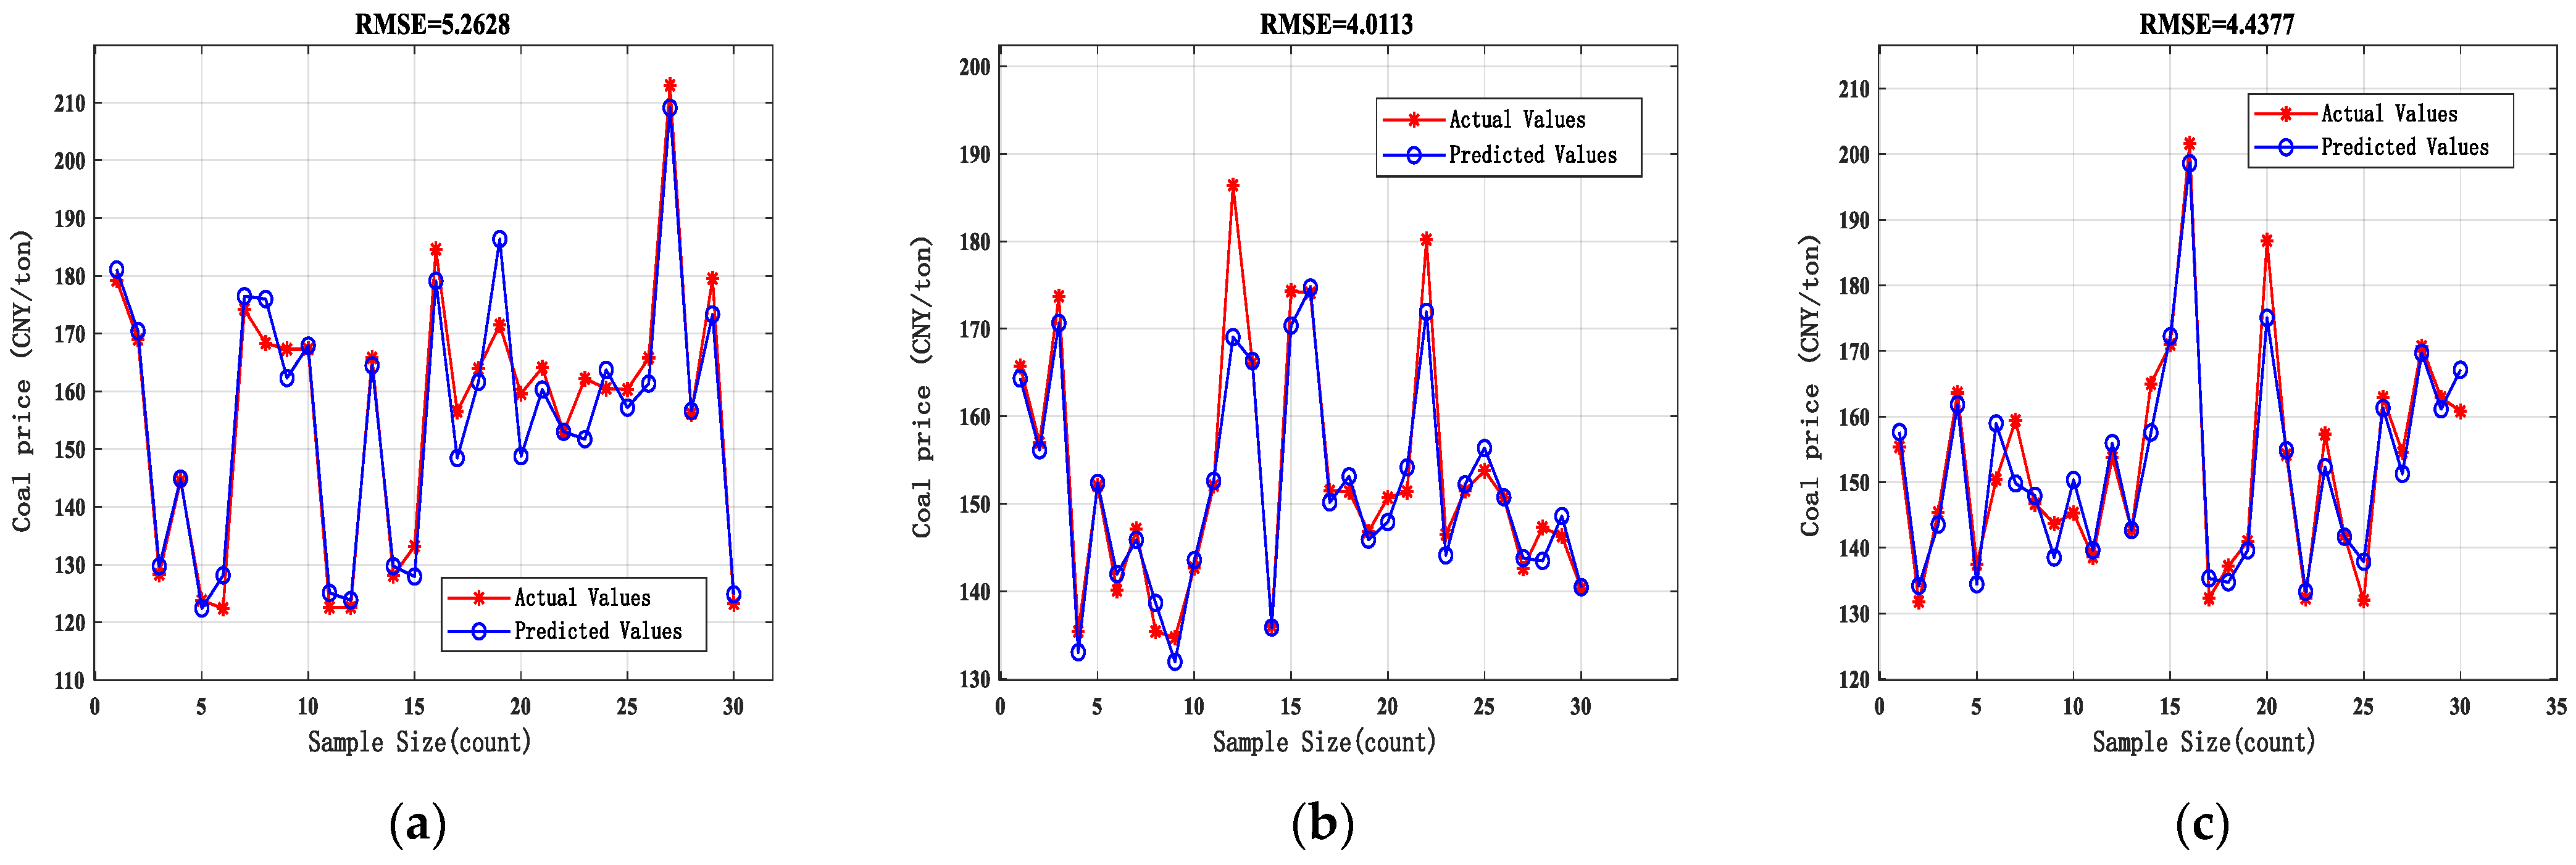
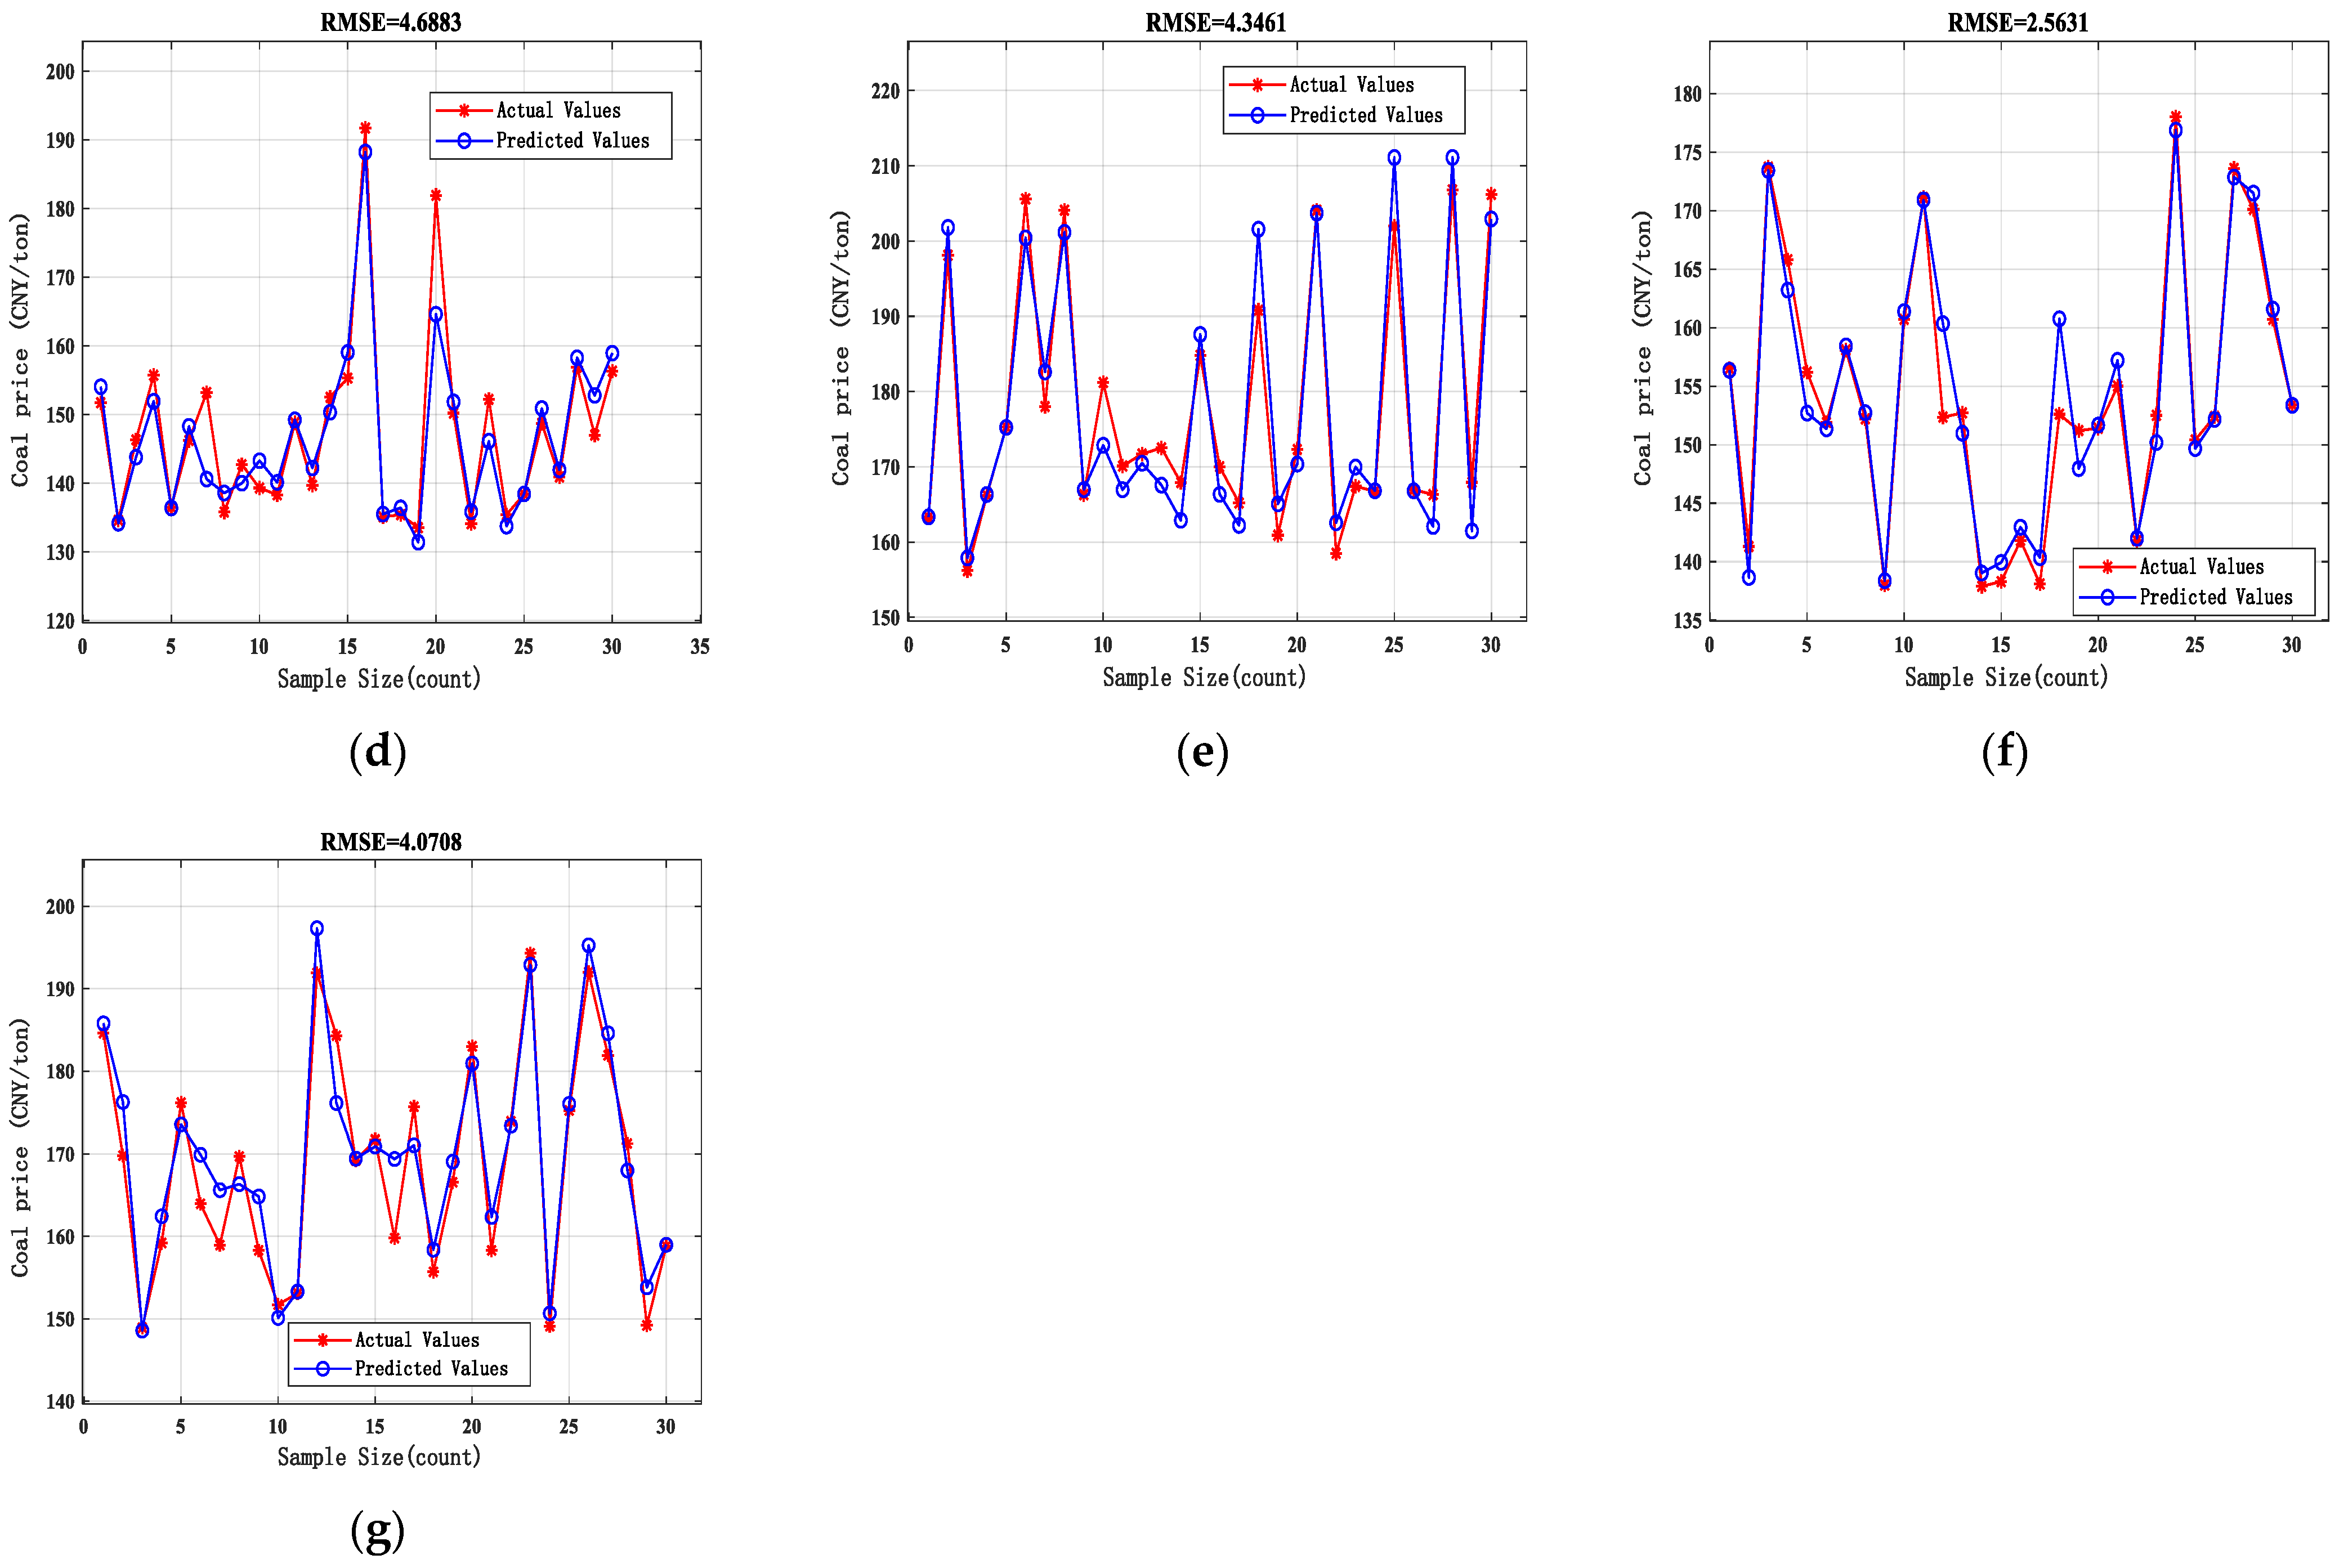
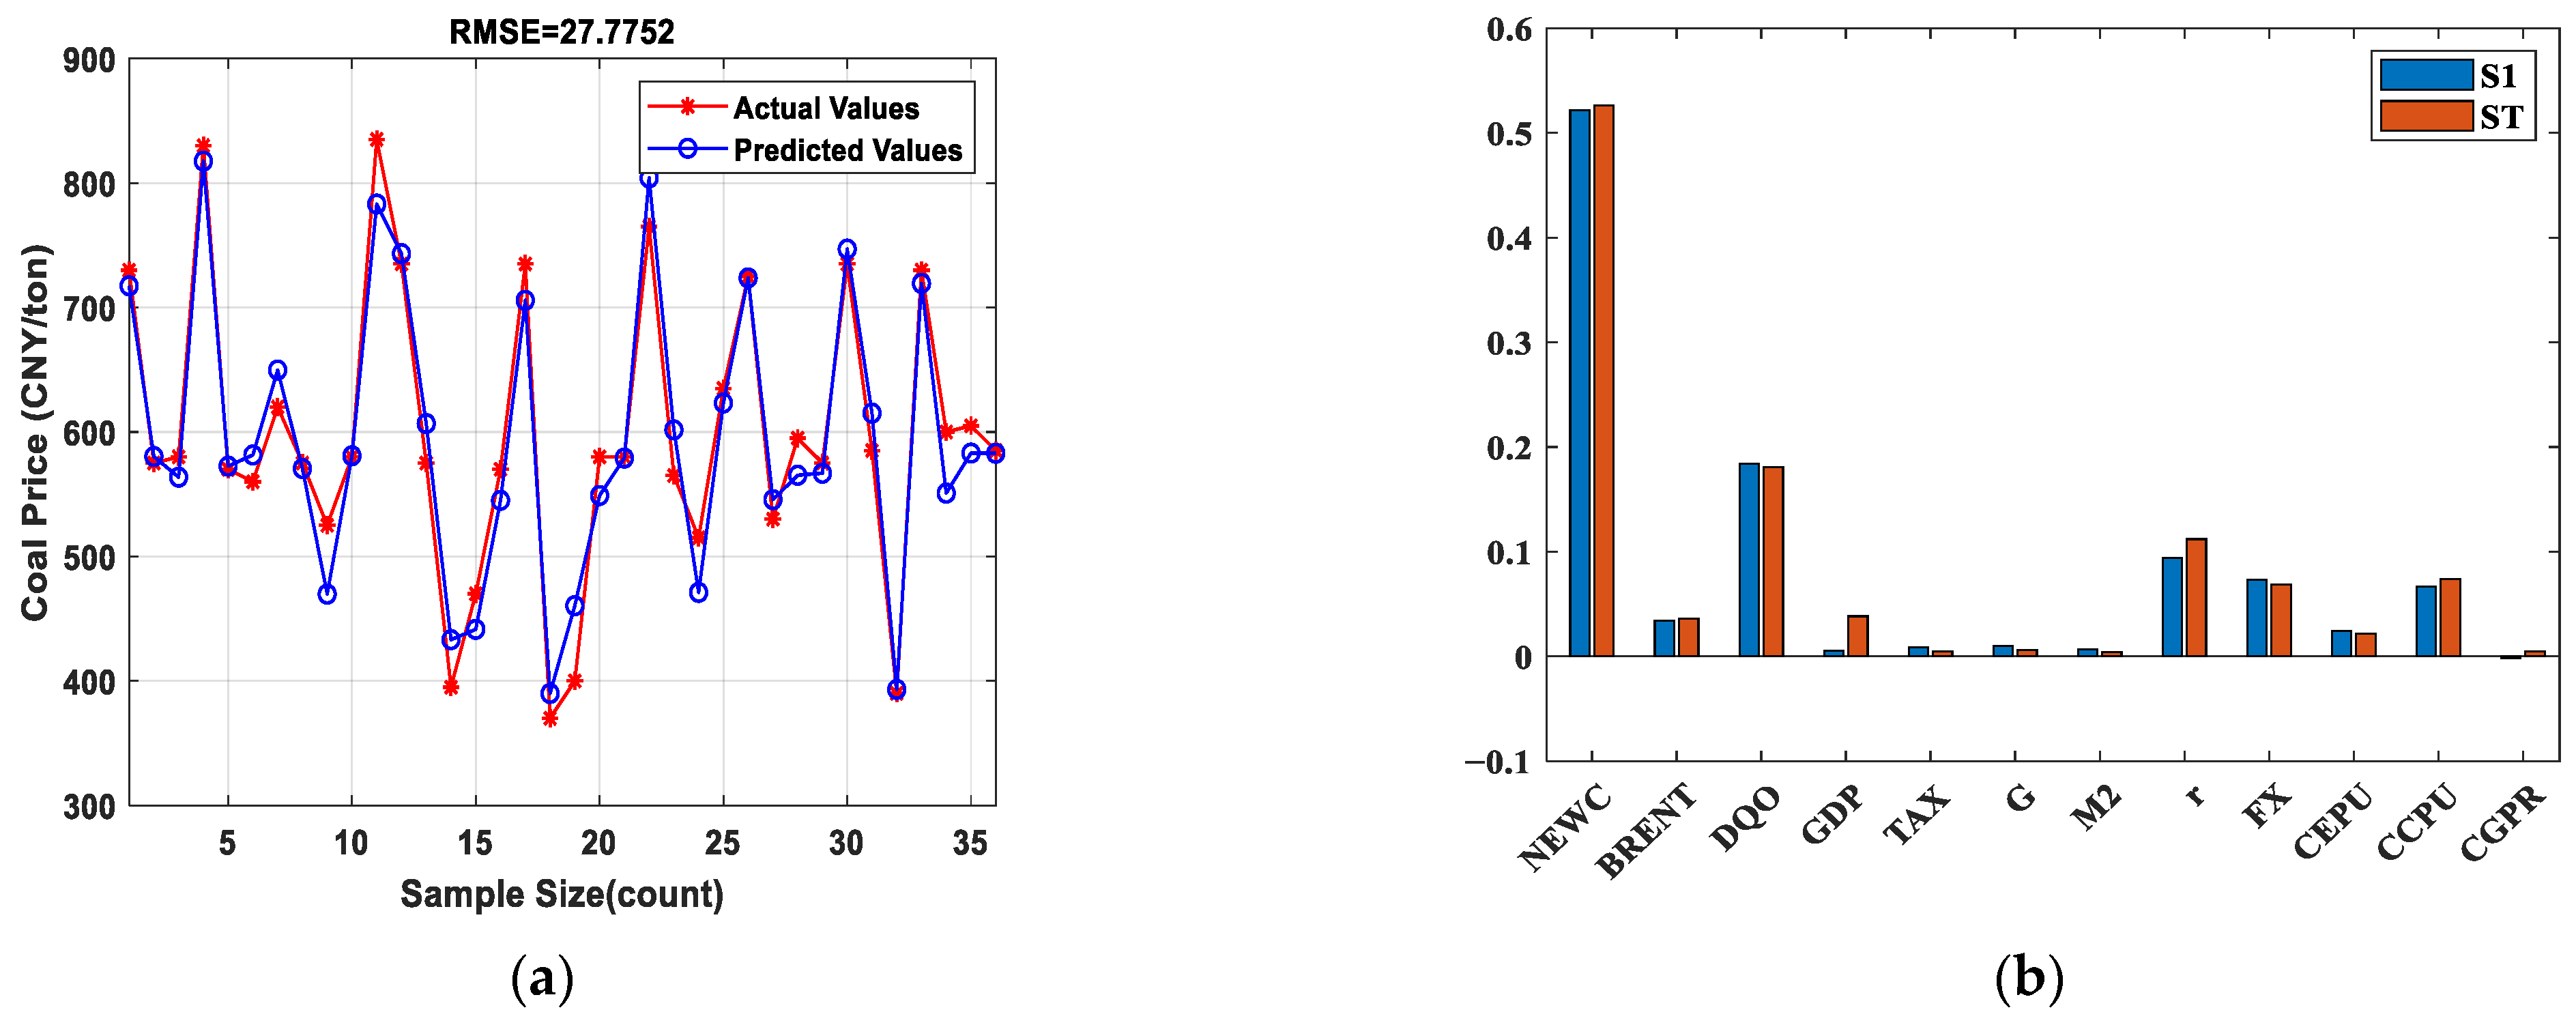
4.1. Gaussian Process Regression

First, a Gaussian regression model for the coal price index of seven regions was constructed using MATLAB (R2021b) software, with an interaction coefficient of five. For the choice of the kernel function, on the one hand, as coal prices represent a continuous time series, their fluctuation patterns are typically well-captured by smooth functions, which aligns with the smoothness characteristic of the exponential kernel function [67,68]. GPR has been proven to be effective in handling uncertainty measurement and prediction of non-stationary time series [47,68], which aligns well with the data used in this paper. From another perspective, when the R2 value of the model approaches one, it means that the model’s explanatory power is better. The lower the value of the RMSE, the smaller the error in its prediction. Table 4 shows the R2 and RMSE values for seven market models. The construction results of the model meet people’s expectations. After the above analysis, it is considered that the choice of exponential kernel function is quite reasonable.
Figure 3 provide a comparison between the model-predicted values and actual observed values for each regional market. Overall, there is high consistency between the model predictions and the actual values, indicating that the model can accurately capture the changing trends of the target variable, with a good overall fit. This is specifically reflected in three types: the first type includes the southwest and north China coal markets, which exhibit the highest prediction accuracy; the second type encompasses the northwest, east China, central China, and northeast coal markets; and the third type, although having a smaller R2, still performs well, mainly referring to the south China coal market.

4.2. Sensitivity Analysis of Factors Influencing Coal Prices in China

In MATLAB, Sobol analysis techniques were used to calculate the first-order sensitivity (S1) and total-order sensitivity (ST) for the coal price models of the seven markets, with the results for both indicators thoroughly presented in Table 5.
From Table 5, it can be seen that the coal price index in all regions shows a high sensitivity to Australian Newcastle thermal coal, especially in south China, east China, and north China, where the S1 values reach 0.796, 0.796, and 0.741, respectively, indicating a significant individual impact on the output. Various factors, such as crude oil, economic growth, interest rates, exchange rates, climate policy uncertainty, and economic policy uncertainty, in Daqing have shown high sensitivity in several markets. This indicates that the key sensitivity parameters corresponding to different coal markets are similar.
First-order sensitivity (S1) reveals the direct effect of a single model parameter on the yield, while full-order sensitivity (ST) shows the effect of all parameter combinations, including their inherent interactions. First-order sensitivity indicators provide us with a more intuitive way to understand how various factors affect coal pricing strategies. The following analysis is based on the first-order sensitivity index. Figure 4 shows a first-order sensitivity analysis chart for 12 impact factors for seven regional markets.
According to Figure 4, there are differences in the magnitude of the first-order sensitivity indices for the twelve factors influencing coal prices, but the overall trends are similar. Australian Newcastle thermal coal, Daqing crude oil, interest rates, economic growth, and economic policy uncertainty are the five factors with the highest sensitivity, while taxes, government spending, and the broad money supply exhibit the lowest sensitivity.
First, the seven coal markets show a high sensitivity to the price of Newcastle thermal coal. This indicates that China has a high dependence on coal, which is consistent with its energy consumption structure and trade conditions. China accounts for about half of the world’s coal use. To cope with rising market demand, China has long relied on coal imports, which has led to domestic coal prices being largely affected by fluctuations in the international market [1]. In recent years, coal imports have shown an erratic upward trend and hit their all-time high in 2023. Australia is China’s largest coal importer, and since 2010, China has continued to be the core market for Australian coal exports. In 2019, about 44 percent of Australia’s coal was exported directly to China, while China’s imports from Australia accounted for about half of Australia’s global coal exports. Both Daqing crude oil and Brent crude oil are key reference standards in the international crude oil market, but Daqing crude oil is relatively more sensitive to these standards. This finding reveals a significant correlation between China’s domestic oil market and coal market, and further proves that domestic oil prices have a more significant impact on coal market prices. Daqing crude oil not only reveals the latest trend of China’s oil market, but it also more accurately shows the supply and demand changes of China’s coal market. In recent years, clean alternative energy sources, such as natural gas, hydropower, wind, and solar, have been widely used in China, so coal pricing strategies are increasingly taking into account the importance of these alternative energy sources. Emerging disruptive factors have disrupted the interaction between international and domestic coal markets in China’s coal market, thereby mitigating the adverse impact of international oil market fluctuations on Chinese coal prices. Overall, energy prices have a clear impact on coal prices, and Australian coal prices in particular have a dominant effect on China’s coal prices. This is consistent with the research findings of scholars like Zhu [4], Xue and Huang [6], Batten [30], and others.
Second, China’s coal prices are highly sensitive to economic growth, indicating that the link between coal consumption and economic growth is still close, and coal prices show endogenous characteristics. Although in recent years the government has been trying to find a balance between economic growth and coal consumption, and it has made some achievements in promoting high-quality development and transforming the energy structure, China is the world’s largest coal consumer and producer, and many industries are highly dependent on coal. Currently, coal consumption in most regions of China still shows a weak decoupling from economic growth. When economic growth drives industrial development, coal demand rises, pushing prices up. Finding ways to gradually reduce dependence on coal while ensuring economic growth will be a key challenge for China’s sustainable economic development. Pang et al. [69] and Wei et al. [70] also agree that the weak decoupling between coal consumption and economic growth leads to a significant impact of economic growth on the coal market, which is consistent with the findings of this study.
Third, the sensitivity of coal prices in China to both government spending and taxation is low, suggesting that fiscal policy has a weak effect on coal prices. However, scholars, such as Liu et al. [9], Lin et al. [10], and Karl and Chen [71], have found in their studies that fiscal policy plays an important role in the changes in coal prices, which contrasts with the findings of this study. The reasons for this discrepancy may be as follows. In the context of China’s decentralized governance structure, local governments are incentivized by both fiscal revenue and promotion competition, leading to an over-reliance on land finance. According to data from the Ministry of Finance, since China began to reform its land trading market in 2004, land finance saw an average annual growth rate of 20.7% before 2017. Although the growth rate slowed between 2017 and 2021, the annual growth rate of land finance revenue during these five years remained between 10% and 20%, accounting for 45% of total revenue. Under the land finance model, the government’s expenditure bias towards “heavy infrastructure” has crowded out financial subsidies to the coal industry, inevitably weakening the direct impact of fiscal spending on coal prices. Additionally, land finance has created conditions for “misconduct” by officials, reducing the effectiveness of fiscal policies and distorting the critical role of government spending in the fluctuation of coal prices. At the same time, the low sensitivity of coal prices to taxation indicates that the role of China’s fiscal and tax policies in the coal industry has “limitations”. From 1 December 2014, the coal resource tax was adjusted to be based on price, and the collection of effective coal resource tax depends on in-depth understanding of the prices, outputs, and sales of coal companies. However, the government-led information exchange platform has not yet played its full role, leading to limited information for tax authorities, whose oversight mainly relies on invoices and self-declarations. Establishing a long-term mechanism for information exchange has proven difficult, making it challenging to accurately understand the production and operation status of coal enterprises, which hinders the precise management of tax sources. Due to the imbalance of information and insufficient supervision, coupled with the frequent fluctuations in coal prices in recent years, the effect of tax on coal price regulation has been distorted.
Fourth, the sensitivity of the broad money supply (M2) is relatively low, which indicates that the broad money supply has a relatively limited impact on coal prices. With the deepening of the market-oriented reform of the financial system, the monetary policy framework has changed from focusing on quantity control to focusing on price orientation, which has shown remarkable results. The People’s Bank of China (PBoC) has shifted its focus from directly regulating the money supply to using price instruments, such as interest rates, to guide economic activity and the functioning of financial markets [72,73]. As a result, the impact of interest rates and exchange rates on coal prices, both of which are relatively sensitive in most regions, has become more pronounced. The role of the traditional financial market in the coal market reveals the financial characteristics of China’s coal market. Given that the coal industry is a capital-concentrated field, there is a huge demand for funds, so coal companies usually choose to raise funds through capital market means, such as stocks and bonds. The financing and operating costs of these companies are directly affected by changes in interest rates, which further affects the efficiency and price of coal mining [62]. The exchange rate has a direct impact on China’s trade exports and foreign investment flows, resulting in changes in coal production [13]. The same is true for international markets. Since the global financial crisis of 2008, the Federal Reserve has pursued loose fiscal policy, which in turn has contributed to the depreciation of the dollar. In view of the inflationary challenges caused by the depreciation of the dollar, other economies have implemented accommodative monetary policies in response, resulting in an abundance of global capital liquidity. In order to avoid the risks associated with stock market and exchange rate movements, huge amounts of money have been diverted into commodities, triggering a virtual surge in demand, which has led to significant increases in coal prices in major exporters, such as Australia and Indonesia. However, the sensitivity coefficient of interest rates slightly exceeds the level of exchange rates. This is because in the process of promoting marketization in China, the pace and amplitude of the adjustment of the exchange rate system are not as fast as the change in the interest rate system. Interest rate liberalization is progressing rapidly, while exchange rate liberalization is progressing relatively slowly. In other words, the change in interest rate can better reflect the dynamics of supply and demand in the market, so it shows a higher responsiveness to interest rate changes [74]. The comprehensive analysis shows that China’s monetary policy has a significant impact on coal prices, and the interest rate plays the most critical role, followed by the exchange rate, while the broad money supply has a relatively small impact. However, various scholars, such as Zhou [65], Hammoudeh [75], Yan [76], and other scholars, hold the view that the broad money supply has the most obvious impact on coal prices, which obviously exceeds the impact of the exchange rate and the interest rate on coal prices. The conclusions drawn by this group of scholars differ from the findings of this study. From one perspective, this is because China’s monetary policy structure has shifted from a quantitative orientation to an efficient strategy based on prices. From another perspective, the GPR–Sobol model adopted in this study may more accurately reveal the role of these factors on coal prices, thus verifying the accuracy of the model.
Fifth, compared with geopolitical risks, economic policy uncertainty and climate policy uncertainty have a more prominent impact on coal prices, which indicates that policy management and government intervention have a stronger impact on coal prices. China’s coal pricing system shows obvious characteristics of “administrative intervention”. China’s coal market price generation system differs from the international one, and the Chinese market has long operated under the guidance of government intervention and industrial policies, including environmental protection regulations, emission reduction targets, and strategies to deal with coal overcapacity. Since 2016, China has implemented structural supply-side reform aimed at reducing excess capacity and strictly controlling new capacity, which has contributed to a rapid rise in coal prices. By 2020, the Chinese authorities established a two-carbon policy and imposed stricter environmental regulations and production controls on the coal industry, which has forced many emissions-intensive and energy-inefficient mines to shut down or scale back production, which in turn has had a significant impact on the coal market supply. In addition, these strategies have significantly promoted the rapid growth of the renewable energy industry, gradually reducing dependence on fossil fuels, such as coal. This shift has had an impact on the market, leading to a reassessment of future coal demand, which in turn has put continued downward pressure on coal prices. During periods of sharp price fluctuations, the government has taken measures, including tapping strategic coal reserves or regulating production, to stabilize prices. Recently, China has been committed to building a more stable energy security system, actively advocating for and practicing diversified strategies for energy supply, deepening the development and utilization of domestic energy resources, and expanding the breadth and depth of international energy cooperation to ensure the continued stability and reliability of the energy supply chain. Although geopolitical risks can affect coal prices by restricting international trade, pushing up transportation costs, and damaging supply chain stability, the abundant domestic coal supply and diversified energy import channels significantly mitigate the impact of such risks, thus easing the volatility of geopolitical changes on coal prices to a certain extent. In summary, the results of this study are consistent with the conclusions of Wang et al. [14], Zheng et al. [15], and Shang et al. [16], including, in particular, the finding that uncertainty regarding economic policy, climate policy, and geopolitical risks has had a significant impact on coal prices.
Based on the results of Table 5, Table 6 below presents the ranking of the first-order sensitivity indices for the factors affecting coal prices in the seven regions.
From Table 6, it can be seen that the twelve parameters have similar overall trends in terms of their impact on coal prices across the seven regions in China. However, a horizontal comparison reveals certain differences in their specific rankings and importance. These differences are reflected as follows:
  • Coal prices in the northwest are more sensitive to interest rates and geopolitical risks than in other regions. The economic development of the northwest region is relatively backward, which leads to the restriction of its financing channels [77]. As a capital-intensive industry, coal production in this region is highly dependent on the external financing environment. Therefore, the financing cost of coal enterprises will be directly affected by interest rate changes, which will further have a significant effect on the price of coal. In addition, as an important coal producing region, northwest China has geographical contact with many countries. Political instability or conflicts in the region can directly affect coal production and transportation, leading to further price fluctuations.
  • Coal prices in eastern and southern China are more sensitive to exchange rate fluctuations than in other regions. This is mainly because exchange rate fluctuations can more quickly change the way investment is diverted, which in turn affects the price of coal. South China and east China are the frontlines of China’s reform and opening up. Their economies grow rapidly, and their foreign economic exchanges are very active. These regions are characterized by a high degree of market liquidity and strong investment activity [77,78]. Due to the extroversion of the economy, investors have a deep understanding of international markets and cutting-edge investment concepts, which makes them highly sensitive to market fluctuations, and they can quickly capture market opportunities. According to the data, east China’s data transaction volume in 2022 exceeded 40% of the country’s total, while south China’s data transaction volume accounted for nearly 17%. In contrast, the capital markets in other regions are less developed, with lower market liquidity and investment activity due to weaker risk tolerance and market participation from investors [77]. However, east and south China regions, often the testing grounds for national economic reforms, display high sensitivity to economic policies [79,80]. Yet, coal prices in these regions show relatively low sensitivity to economic policy uncertainty, ranking behind other regions. This is largely due to the strong economic foundations in east and south China, where coal companies are well-capitalized, invest heavily in technological innovation and R&D, and can quickly adjust their strategies to adapt to policy changes [81]. In recent years, macroeconomic policies focused on carbon reduction have posed some challenges to coal companies, but the increasing uncertainty in economic policies has driven these enterprises to accelerate technological innovation and enhance risk management. Furthermore, these regions primarily rely on procurement from inland areas and imports to meet their coal demand. The coal supply chain is well-established, with local companies leveraging advanced infrastructure and logistics networks. By optimizing information flow, strengthening supplier relationships, improving inventory management, and adopting cutting-edge technologies, these companies have driven continuous improvements in the supply chain [82]. As a result, the coal market’s overall supply chain management level has steadily advanced, allowing it to respond to external shocks with greater flexibility and effectiveness, enhancing the resilience of the market [83].
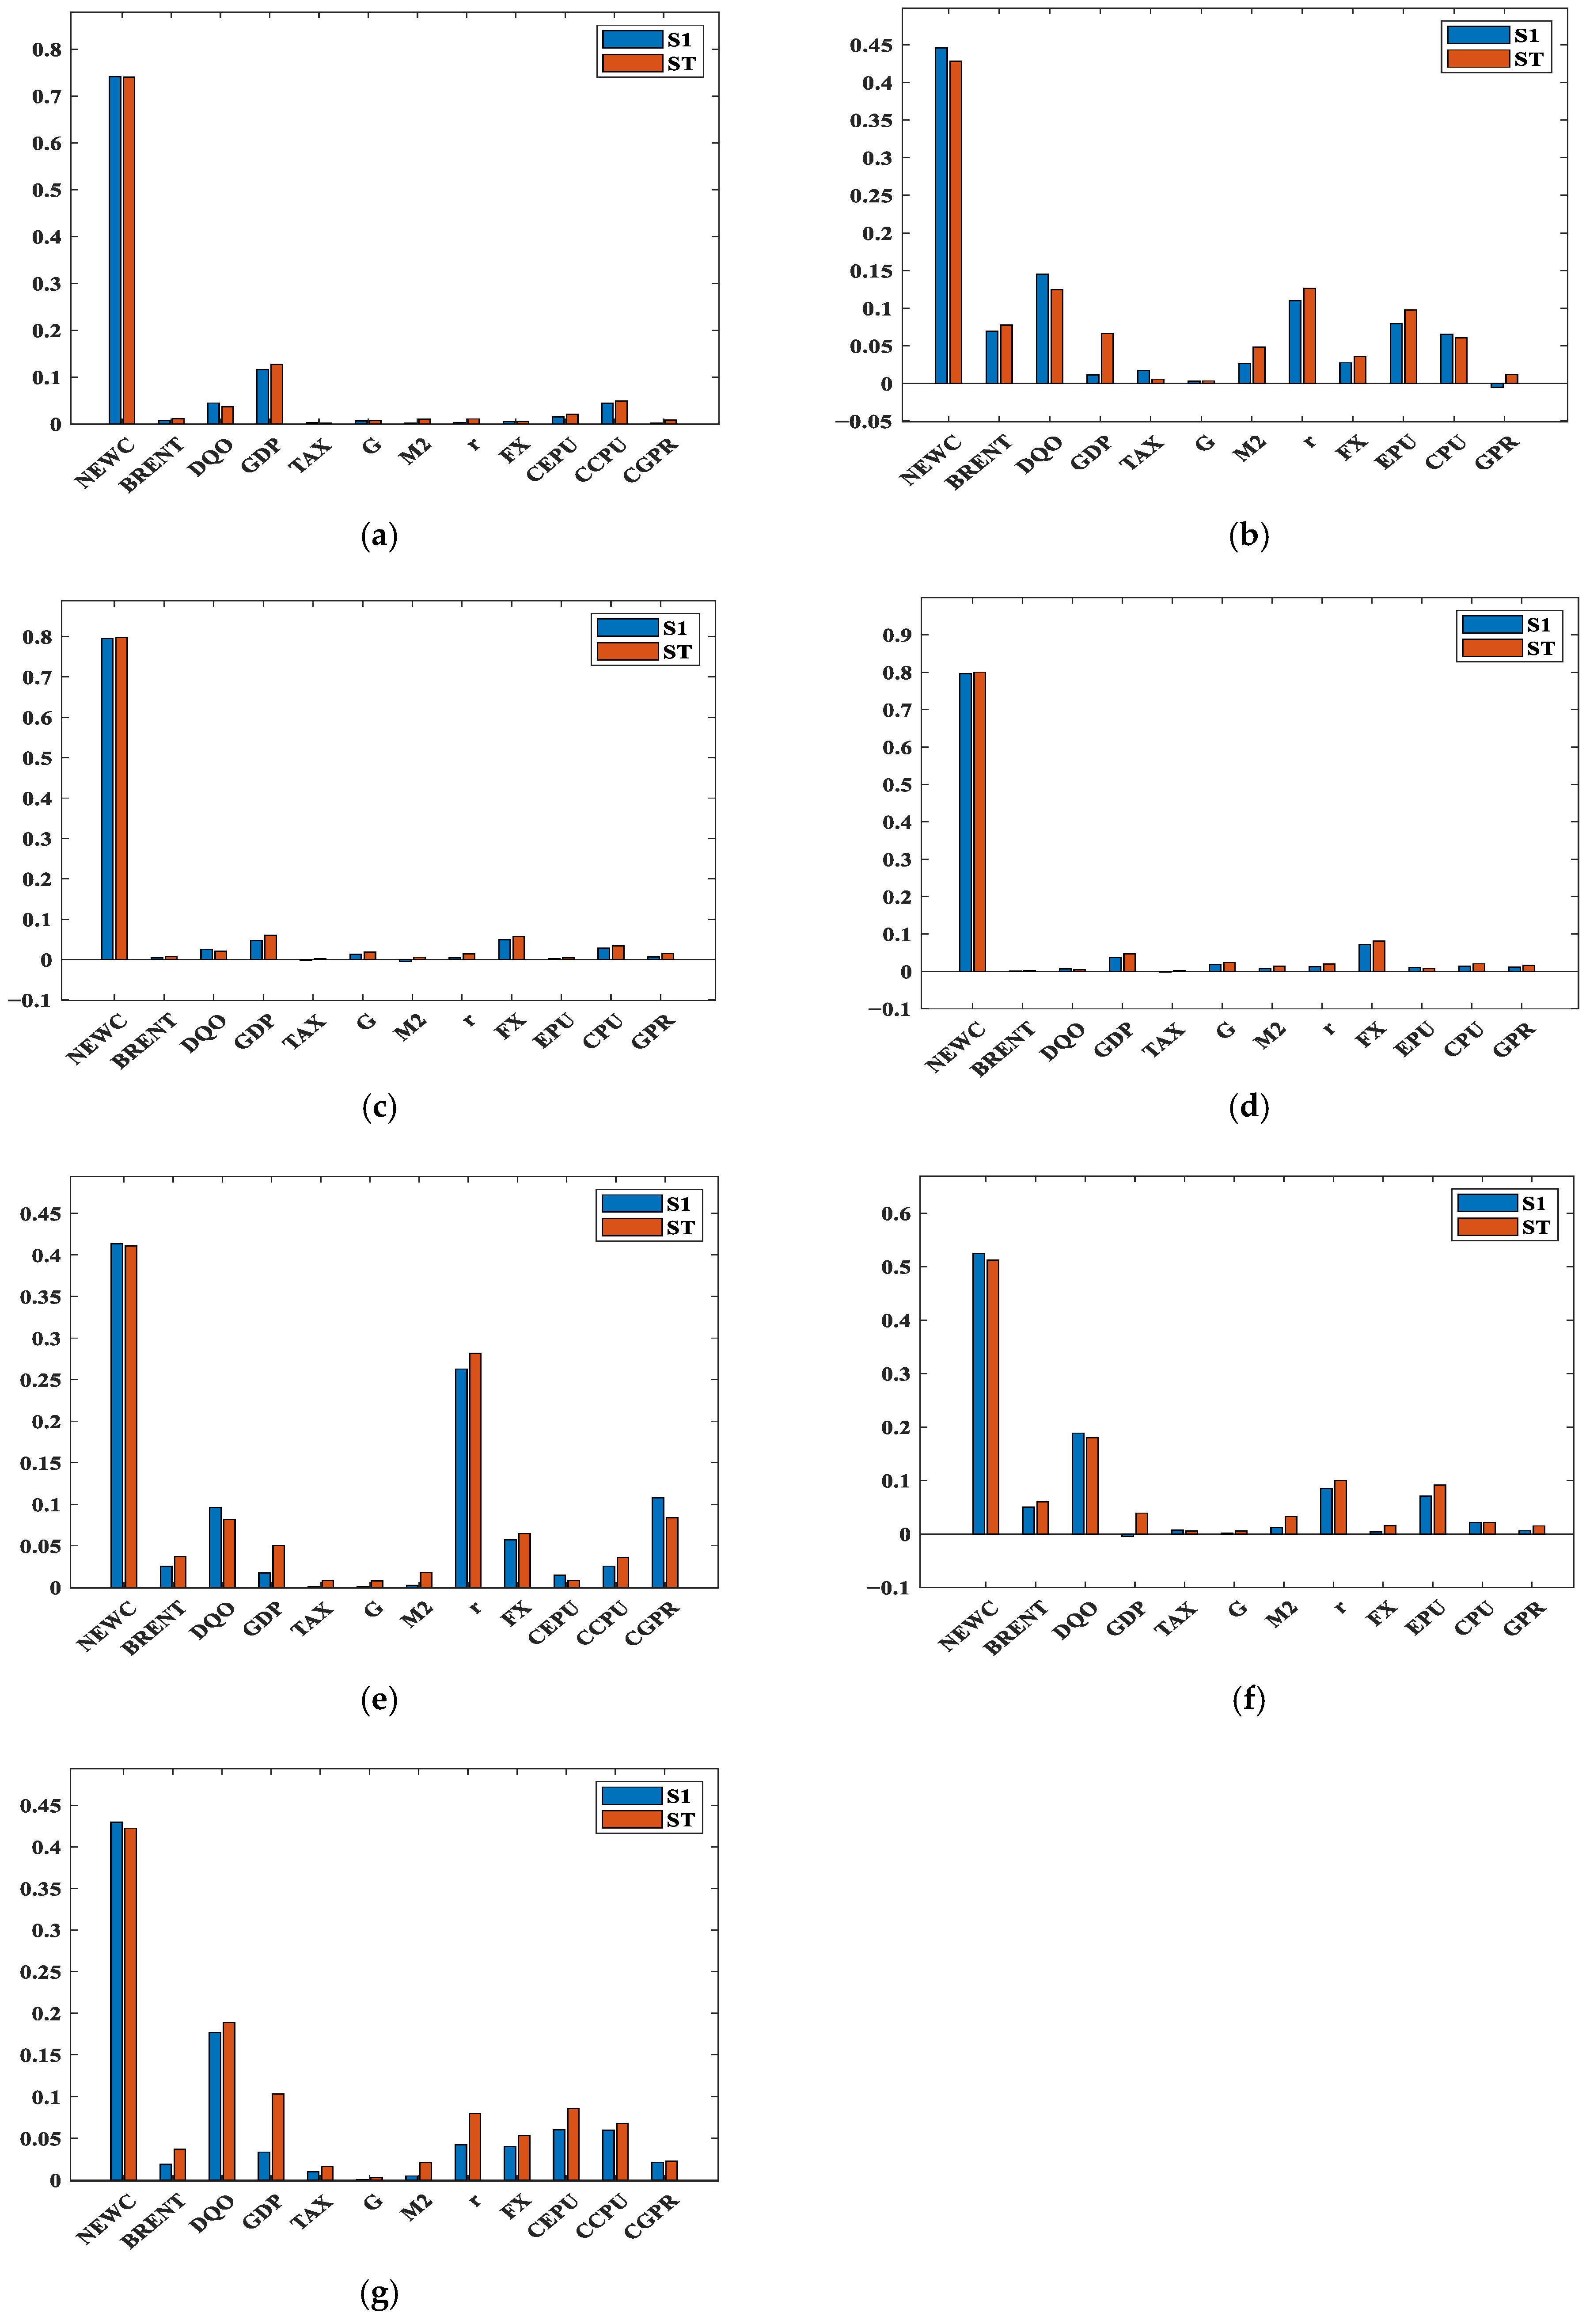
  • Figure 5 shows the Sobol index calculation results for seven regional markets. Figure 5 reveals similar trends in the sensitivity analysis of coal markets in north, south, and east China, which show significant sensitivity to energy price fluctuations. Coal pricing in these regions is more strongly influenced by global energy markets and less responsive to macroeconomic factors, such as economic growth, monetary policy, and fiscal policy. This suggests that the coal markets may not have fully leveraged the potential of economic growth or policy changes, indicating that their development is still insufficiently mature. In contrast, other markets display more complex sensitivity, influenced by multiple factors including the international energy market, economic growth, monetary policy, and policy changes, demonstrating greater market resilience.
Furthermore, it can be noted that there is no significant difference between the S1 and ST values of the twelve coal price influencing factors across the seven coal markets. This suggests that these variables did not exhibit significant multicollinearity or interdependence during the modeling process, and the interaction between parameter variables in the model has a minimal effect on the output parameters. The reason for this is that Gaussian Process Regression, through nonlinear modeling, is capable of automatically capturing complex relationships between variables, which enhances the model’s robustness in handling multicollinearity issues [84,85]. This also proves the validity and applicability of the model in dealing with complex data sets and the robustness of the empirical results in this paper [86].

4.3. Robustness Test of Empirical Results

To further validate the robustness of the empirical results presented in this study, we replaced the original variables with the Qinhuangdao Port closing price of thermal coal (Q5500K) for the corresponding time period and re-verified the empirical findings. The Qinhuangdao Port closing price of thermal coal (Q5500K) reflects changes in the supply–demand relationship in the coal market, production costs, and the impact of the external economic environment. As such, it is often used as an important reference indicator for domestic market coal prices. The data used in this analysis were sourced from the Wind database “https://www.wind.com.cn/mobile/EDB/zh.html (accessed on 20 May 2024)”.
In MATLAB, we constructed a Gaussian regression model for the Qinhuangdao Port closing price of thermal coal (Q5500K) and conducted an interaction test with an interaction coefficient of 5. The model’s goodness of fit (R2) is 0.94012. Subsequently, we used the Sobol method to compute the Sobol indices for various influencing parameters. Figure 6 presents the Gaussian regression results and the computed Sobol indices.
As shown in Figure 6a, the robustness test model also demonstrates a good fit, with a small gap between the actual and predicted values in the test set, indicating strong predictive capability. Figure 6b shows the Sobol indices for the Qinhuangdao Port closing price of thermal coal (Q5500K), where the S1 index for NEWC is the largest at 0.5214, and the S1 index for DQO is 0.1843. This indicates that energy prices remain the most important factor influencing coal prices in China. Additionally, interest rates, exchange rates, economic policy uncertainty, and climate policy uncertainty also have a significant impact on coal prices. In contrast, other factors, such as taxation, government spending, and broad money supply, have a relatively small effect on coal prices.
In conclusion, the GPR fit in the robustness test model is also strong, and the Sobol indices computed for each variable align closely with the results from the empirical analysis. This further confirms the robustness and scientific validity of the empirical results presented in this study.

5. Conclusions and Policy Recommendation

5.1. Conclusions

This paper comprehensively considers 12 factors across five dimensions, constructing a non-parametric Gaussian Process Regression model. Using Sobol sensitivity analysis, the sensitivity of the factors influencing coal prices in China is measured, resulting in both first-order sensitivity indices and total-order sensitivity indices for each factor. The empirical results were analyzed, and the conclusions are as follows:
  • China’s coal prices exhibit the highest sensitivity to energy prices, with international coal prices being the primary influencing factor. Coal prices are also sensitive to economic growth, reflecting endogenous characteristics. The uncertainty in economic and climate policies shows high sensitivity as well, indicating a degree of “administrative intervention” in the formation of coal prices in China. A synthesis of previous research findings reveals that energy prices, economic growth, and uncertainties in economic and climate policies significantly affect coal prices, which is consistent with the results of this study.
  • The main difference between this study and previous research lies in the use of the advanced GPR–Sobol model, which effectively addresses the issue of multicollinearity among variables, enhances the precision in assessing the sensitivity of various influencing factors, and overcomes the limitations of traditional models in handling nonlinear factors. Additionally, this study finds that the sensitivity of coal prices to government spending and taxation is relatively low, suggesting that fiscal policy has a limited impact on China’s coal industry. In contrast, some scholars [9,10,71] in earlier studies have found that fiscal policy plays a significant role in the fluctuation of coal prices. The study also reveals that monetary policy has a significant impact on coal prices in China, with interest rates having the greatest influence, followed by exchange rates, while the broad money supply has a smaller effect. However, scholars, such as Zhou [65], Hammoudeh [75], and Yan [76], argue that the broad money supply has the most significant impact on coal prices, which is much greater than the effects of exchange rates and interest rates. This conclusion contrasts with the findings of this study. The differences in these research results suggest that the mechanism affecting coal prices is complex and variable, which justifies the necessity of using advanced methods to analyze the factors influencing coal prices.
  • In existing relevant studies, there are few scholars who conduct a horizontal comparison of the sensitivity of coal price influencing factors across different regions in China. This study ranks the first-order sensitivity indices of the coal price influencing factors in seven regions and performs a horizontal comparison. The findings reveal that the specific rankings and their relative importance differ, mainly reflected in the following aspects: coal prices in northwest China are more sensitive to interest rates and geopolitical risks, while prices in east and south China are more responsive to exchange rates but show a weaker reaction to uncertainties in economic policy. The coal markets in north China, south China, and east China are sensitive to changes in energy prices but show a weaker response to macroeconomic indicators, indicating that their development is still not mature. In contrast, other markets exhibit more complex sensitivities, influenced by international energy prices and various economic factors, demonstrating greater market elasticity. The above findings are one of the potential marginal contributions of this study.
Although the GPR–Sobol technique is used in this work to assess the sensitivity of coal price drivers, the analysis is limited to first-order sensitivity measures and fails to integrate consideration of interaction effects on second-order sensitivity indicators. Future research could explore these second-order effects for a more comprehensive understanding. Additionally, the choice of surrogate model in Sobol analysis plays a crucial role in the results. The current model used in this study may have certain limitations, and there is a need to adopt more advanced models to better capture the complexity of coal price fluctuations. In order to enhance the accuracy and stability of sensitivity analysis, the new model should have excellent adaptability and calculation speed. Therefore, in the process of optimization and refinement of Sobol analysis, the proxy model adopted will become a key area of future research.

5.2. Policy Recommendations

Based on the above conclusions, this paper proposes the following policy recommendations to further adjust and optimize coal market policies in China, ensuring the healthy and stable development of the coal market:
  • Establishing a Coal Import Diversification Strategy Team and Risk Management System: To ensure the stability of the coal supply and the controllability of prices, it is recommended that the government establish a Coal Import Diversification Strategy Team responsible for evaluating and developing new coal supply markets. The team should leverage big data and artificial intelligence to develop a coal price forecasting model using future markets, enabling real-time adjustments that link import prices with international market prices. Additionally, constructing an international coal market risk early warning system is crucial. This system should comprehensively analyze supply, demand, transportation, geopolitical factors, and other elements to identify and respond to market risks in a timely manner, ensuring supply chain security and price stability.
  • Strengthening the Coordination Mechanism Between Monetary Policy and the Coal Market: The government should establish a policy coordination mechanism to ensure the complementary effects of interest rate and exchange rate policies on the coal market, avoiding unnecessary market fluctuations. Specifically, the government can provide targeted loans and low-interest loans to coal enterprises, especially supporting their transformation, upgrading, and green development. Additionally, maintaining liquidity in the coal market and constructing a stable coal futures market mechanism to prevent excessive market volatility is essential. Moreover, a funding guarantee system to cope with market fluctuations should be established to ensure that enterprises have access to necessary financial support during periods of coal price volatility.
  • Enhancing Fiscal Policy Support for Green Transformation and Technological Innovation: To promote the green transformation and sustainable development of the coal industry, the government should implement tax incentives to encourage coal enterprises to invest in clean energy utilization and green transformation. At the same time, the government should increase fiscal expenditure, particularly in supporting environmental projects and technological R&D in the coal industry, thereby advancing technological upgrades and industrial transformation. Specific measures include establishing green credit policies to support the development and application of low-carbon and environmentally friendly technologies, pushing for structural adjustments and transformation in the coal sector.
  • Developing a Coal Consumption and Economic Growth Coordination Plan: To ensure the coordination of coal consumption and economic growth, the government should formulate mid- to long-term goals and annual plans for coal consumption based on economic growth forecasts, ensuring that the two are mutually aligned. Simultaneously, a monitoring and evaluation system for coal consumption and economic growth should be established to regularly assess key data, such as coal consumption, economic growth rates, and environmental indicators, adjusting policies as necessary to ensure the sustainability of coal consumption and the balance of economic growth. In particular, independent energy consumption and environmental protection targets should be set to ensure that economic growth does not lead to excessive coal consumption.
  • Enhancing the Ability to Manage Policy Uncertainty and Geopolitical Risks: To address policy uncertainty and geopolitical risks, the government should establish a dedicated economic and climate policy research team to regularly track domestic and international policy dynamics, analyze their potential impact on the coal market, and propose timely countermeasures. An emergency response and risk management mechanism should be developed to ensure that the coal market remains stable in the event of policy changes or external shocks. A comprehensive market emergency mechanism should be put in place to quickly respond to and adjust for unforeseen risks, ensuring the long-term stability of the coal market.
  • Implementing Regional Coal Market Strategies: Given the economic development stages and market structures of different regions, the government should formulate region-specific coal market strategies. For example, in east China and south China, emphasis should be placed on enhancing exchange rate flexibility to mitigate the impact of external economic fluctuations. In northwest China, the government should optimize credit conditions and financial support policies to stabilize the coal market. At the same time, regional coal market cooperation should be encouraged, allowing for the sharing of resources, technology, and experience to promote coordinated development across the coal market.

Author Contributions

Conceptualization, J.L. and C.L.; formal analysis, J.L. and J.Z.; funding acquisition, J.L. and W.Z.; methodology, J.L. and C.L.; software, C.L.; supervision, W.Z. and J.Z.; visualization, C.L.; writing—original draft, J.L. and C.L.; writing—review and editing, J.L. and J.Z. All authors have read and agreed to the published version of the manuscript.

Funding

The authors are grateful for the financial support provided by the National Natural Science Foundation of China (No.: 62073008) and the Ministry of Education’s Humanities and Social Sciences Research Planning Fund Project (No.: 24YJA790041).

Data Availability Statement

The climate policy uncertainty data for China used in this study were obtained using the methodology outlined by Ma et al. [66], as published in Sci Data. The remaining data are sourced from the Wind database “https://www.wind.com.cn/mobile/EDB/zh.html (accessed on 20 May 2024)” and the Economic Policy Uncertainty website “http://www.policyuncertainty.com (accessed on 20 May 2024)”. If needed, I can provide the raw data for review to ensure the transparency and reliability of the research.

Conflicts of Interest

The authors declare that they have no known competing financial interests or personal relationships that could have appeared to influence the work reported in this paper.

References

  1. Zhu, S.; Chi, Y.; Gao, K.; Chen, Y.; Peng, R. Analysis of Influencing Factors of Thermal Coal Price. Energies 2022, 15, 5652. [Google Scholar] [CrossRef]
  2. Wang, T.; Wu, F.; Dickinson, D.; Zhao, W. Energy price bubbles and extreme price movements: Evidence from China’s coal market. Energy Econ. 2024, 2, 107253. [Google Scholar] [CrossRef]
  3. Pierre, F.; Yue, L. The complexity of energy price fluctuations. Energies 2023, 16, 2354. [Google Scholar] [CrossRef]
  4. Zhu, J.; Wang, J. Analysis of the affecting factors of coal price in China based on VAR model. J. Discret. Math. Sci. Cryptogr. 2017, 20, 1303–1308. [Google Scholar] [CrossRef]
  5. Lv, C.; Pan, L.; Zhang, K. The Dynamic Cointegration Relationship between International Crude Oil, Natural Gas, and Coal Price. Energies 2024, 17, 3126. [Google Scholar] [CrossRef]
  6. Xue, J.; Huang, G. Study on the price co-movement among the Asia Pacific, European, and Chinese coal markets—Based on the empirical analysis of MS-VEC model. Appl. Econ. 2017, 49, 693–701. [Google Scholar] [CrossRef]
  7. Ali, M.; Seraj, M.; Alper, E.; Tursoy, T.; Uktamov, K.F. Russia-Ukraine war impacts on climate initiatives and sustainable development objectives in top European gas importers. Environ. Sci. Pollut. Res. 2023, 30, 96701–96714. [Google Scholar] [CrossRef]
  8. Song, M.; Song, H.; Zhao, J.; Wang, J. Power supply, coal price, and economic growth in China. Energy Syst. 2017, 8, 727–746. [Google Scholar] [CrossRef]
  9. Liu, H.; Chen, Z.; Wang, J.; Fan, J. The impact of resource tax reform on China’s coal industry. Energy Econ. 2016, 56, 52–61. [Google Scholar] [CrossRef]
  10. Lin, B.; Liu, X.; Zou, C. Resource tax reform: A case study of coal from the perspective of resource economics. Soc. Sci. China 2012, 33, 116–139. [Google Scholar]
  11. Miljkovic, D.; Baek, J. Monetary impacts and overshooting of energy prices: The case of the U.S. coal prices. Miner. Econ. 2019, 3, 317–322. [Google Scholar] [CrossRef]
  12. Rosa, C. The high-frequency response of energy prices to U.S. monetary policy: Understanding the empirical evidence. Energy Econ. 2014, 29, 295–303. [Google Scholar] [CrossRef]
  13. Rosa, C. The high-frequency response of exchange rates to monetary policy actions and statements. J. Bank. Financ. 2010, 35, 478–489. [Google Scholar] [CrossRef]
  14. Wang, J.; Dai, P.F.; Chen, X.H.; Nguyen, D.K. Examining the linkage between economic policy uncertainty, coal price, and carbon pricing in China: Evidence from pilot carbon markets. J. Environ. Manag. 2024, 352, 120003. [Google Scholar] [CrossRef]
  15. Zheng, D.; Zhao, C.; Hu, J. Impact of geopolitical risk on the volatility of natural resource commodity futures prices in China. Resour. Policy 2023, 83, 103568. [Google Scholar] [CrossRef]
  16. Shang, Y.; Han, D.; Gozgor, G.; Mahalik, M.K.; Sahoo, B.K. The impact of climate policy uncertainty on renewable and non-renewable energy demand in the United States. Renew. Energy 2022, 65, 654–667. [Google Scholar] [CrossRef]
  17. Xu, M.; Li, X.; Li, Q.; Sun, C. LNBi-GRU model for coal price prediction and pattern recognition analysis. Appl. Energy 2024, 365, 123302. [Google Scholar] [CrossRef]
  18. Liu, J.; Liu, L. Point and Interval Forecasting of Coal Price Adopting a Novel Decomposition Integration Model. Energies 2024, 16, 4166. [Google Scholar] [CrossRef]
  19. Li, H.; Wu, Z.; Yuan, X.; Yang, Y.; He, X.; Duan, H. The research on modeling and application of dynamic grey forecasting model based on energy price-energy consumption-economic growth. Energy 2022, 257, 124801. [Google Scholar] [CrossRef]
  20. Lin, B.; Song, Y. Coal price shocks and economic growth: A province-level study of China. Energy Policy 2024, 193, 114297. [Google Scholar] [CrossRef]
  21. Chen, H.; Liu, K.; Shi, T.; Wang, L. Coal consumption and economic growth: A Chinese city-level study. Energy Econ. 2022, 109, 105940. [Google Scholar] [CrossRef]
  22. Ferdaus, J.; Appiah, B.K.; Majumder, S.C.; Martial, A.A.A. A panel dynamic analysis on energy consumption, energy prices and economic growth in next 11 countries. Int. J. Energy Econ. Policy 2020, 6, 87–99. [Google Scholar] [CrossRef]
  23. Duparc Portier, G.; Figus, G. How should governments respond to energy price crises? A horse-race between fiscal policies. Energy Econ. 2024, 130, 107284. [Google Scholar] [CrossRef]
  24. Parry, I.; Mylonas, V.; Vernon, N. Reforming Energy Policy in India: Assessing the Options. IMF Work. Pap. 2017, 103, 1. [Google Scholar] [CrossRef]
  25. Du, W.; Wu, Y.; Zhang, Y.; Gao, Y. The Impact Effect of Coal Price Fluctuations on China’s Agricultural Product Price. Sustainability 2022, 15, 8971. [Google Scholar] [CrossRef]
  26. He, L.-y.; Li, Y. Characteristics of China’s coal, oil and electricity price and its regulation effect on entity economy. Procedia Earth Planet. Sci. 2009, 1, 1627–1634. [Google Scholar]
  27. Wang, Y.; Wang, N.; Wu, M.M. The Impacts of Energy Price Fluctuations on China’s Agriculture and Rural Economic Development. Adv. Mater. Res. 2012, 524–527, 3216–3219. [Google Scholar] [CrossRef]
  28. Zhang, Y.; Xu, Y.; Zhu, X.; Huang, J. Coal price shock propagation through sectoral financial interconnectedness in China’s stock market: Quantile coherency network modelling and shock decomposition analysis. J. Commod. Mark. 2024, 34, 100392. [Google Scholar] [CrossRef]
  29. Lin, B.; Wang, C. Impacts of coal prices on the performance of Chinese financial institutions: Does electricity consumption matter? Int. Rev. Econ. Financ. 2021, 88, 884–896. [Google Scholar] [CrossRef]
  30. Batten, J.A.; Brzeszczynski, J.; Ciner, C.; Lau, M.C.K.; Lucey, B.; Yarovaya, L. Price and volatility spillovers across the international steam coal market. Energy Econ. 2019, 77, 119–138. [Google Scholar] [CrossRef]
  31. Zhang, Y.-J.; Sun, Y.-F. The dynamic volatility spillover between European carbon trading market and fossil energy market. J. Clean. Prod. 2016, 112, 2654–2663. [Google Scholar] [CrossRef]
  32. Green, R.; Larsson, K.; Lunina, V.; Nilsson, B. Cross-commodity news transmission and volatility spillovers in the German energy markets. J. Bank. Financ. 2017, 95, 231–243. [Google Scholar] [CrossRef]
  33. Feng, J.; Jingwei, L.; Guangchen, L. Connectedness between crude oil, coal, rare earth, new energy and technology markets: A GARCH-vine-copula-EVT analysis. Appl. Econ. 2023, 38, 4469–4485. [Google Scholar]
  34. Zou, S.; Zhang, T. Correlation and Dynamic Volatility Spillover between Green Investing Market, Coal Market, and CO2 Emissions: Evidence from Shenzhen Carbon Market in China. Adv. Civ. Eng. 2022, 2022, 7523563. [Google Scholar] [CrossRef]
  35. Carnero, M.A.; Olmo, J.; Pascual, L. Modelling the dynamics of fuel and EU allowance prices during Phase 3 of the EU ETS. Energies 2018, 11, 3148. [Google Scholar] [CrossRef]
  36. Shawhan, D.L.; Picciano, P.D. Costs and benefits of saving unprofitable generators: A simulation case study for US coal and nuclear power plants. Energy Policy 2019, 129, 383–400. [Google Scholar] [CrossRef]
  37. Ding, H.; Feng, S.; Li, L. The impact of coal price fluctuations on China’s economic output. Appl. Econ. 2016, 24, 2225–2237. [Google Scholar] [CrossRef]
  38. Shi, R.; Wang, D.; Zhao, Y.; Martínez, O.S.; Fenza, G.; Crespo, R.G. The effect of international energy market shocks on coal price of China based on the fuzzy integrated vector auto regressive and error correction model. J. Intell. Fuzzy Syst. 2021, 4, 8451–8461. [Google Scholar] [CrossRef]
  39. Basistha, A.; Kurov, A. The Impact of Monetary Policy Surprises on Energy Prices. J. Futures Mark. 2015, 1, 87–103. [Google Scholar] [CrossRef]
  40. Ringim, S.H.; Abdulkareem, A.; Hasan, G.; Victor, B.F. Economic Policy Uncertainty and Energy Prices: Empirical Evidence from Multivariate DCC-GARCH Models. Energies 2022, 10, 3712. [Google Scholar] [CrossRef]
  41. Hou, J.C.; Yang, M.C. The asymmetric effect of coal price on China’s macro economy using NARDL model. IOP Conf. Ser. Earth Environ. Sci. 2016, 1, 012012. [Google Scholar] [CrossRef]
  42. Istemi, B.; Yetkiner, H. Energy prices and economic growth in the long run: Theory and evidence. Renew. Sustain. Energy Rev. 2014, 22, 228–235. [Google Scholar]
  43. Zaghdoudi, T.; Tissaoui, K.; Maaloul, M.H.; Bahou, Y.; Kammoun, N. Asymmetric connectedness between oil price, coal and renewable energy consumption in China: Evidence from Fourier NARDL approach. Energy 2023, 285, 129416. [Google Scholar] [CrossRef]
  44. Rahman, Z.U.; Khattak, S.I.; Ahmad, M.; Khan, A. A disaggregated-level analysis of the relationship among energy production, energy consumption and economic growth: Evidence from China. Energy 2020, 194, 116836. [Google Scholar] [CrossRef]
  45. Papadopoulos, H. Guaranteed coverage prediction intervals with Gaussian process regression. IEEE Trans. Pattern Anal. Mach. Intell. 2024, 41, 3817–3830. [Google Scholar] [CrossRef]
  46. Wang, J. An intuitive tutorial to Gaussian process regression. Comput. Sci. Eng. 2023, 4, 25. [Google Scholar] [CrossRef]
  47. Kang, L.; Chen, R.-S.; Xiong, N.; Chen, Y.-C.; Hu, Y.-X.; Chen, C.-M. Selecting Hyper-Parameters of Gaussian Process Regression Based on Non-Inertial Particle Swarm Optimization in Internet of Things. IEEE Access 2019, 7, 59504–59513. [Google Scholar] [CrossRef]
  48. Ozbayram, O.; Olivier, A.; Brady, L.G. Heteroscedastic Gaussian Process Regression for material structure–property relationship modeling. Comput. Methods Appl. Mech. Eng. 2024, 431, 117326. [Google Scholar] [CrossRef]
  49. Puy, A.; Piano, S.L.; Saltelli, A.; Levin, S.A. Sensobol: An R package to compute variance-based sensitivity indices. arXiv 2021, arXiv:2101.10103. [Google Scholar] [CrossRef]
  50. Gratiet, L.L. Asymptotic normality of a Sobol index estimator in Gaussian process regression framework. Statistics 2013, 40, 840–855. [Google Scholar]
  51. Sobol’, I.M. Global sensitivity indices for nonlinear mathematical models and their Monte Carlo estimates. Math. Comput. Simul. 2001, 1, 271–280. [Google Scholar] [CrossRef]
  52. Ozga-Blaschke, U. Dynamics of Coking Coal Pricing in International Trade in 1980–2020; Instytut Gospodarki Surowcami Mineralnymi i Energia Polskiej Akademii Nauk: Kraków, Poland, 2021; Volume 37, pp. 125–138. [Google Scholar]
  53. Meyer, A.; Pac, G. How responsive are EU coal-burning plants to changes in energy prices? B.E. J. Econ. Anal. Policy 2015, 15, 1481–1506. [Google Scholar] [CrossRef]
  54. Liptáková, E.; Rimár, M.; Kizek, J.; Šefčíková, Z. The evolution of natural gas prices in EU countries and their impact on the country’s macroeconomic indicators. Civ. Environ. Eng. Rep. 2021, 31, 255–273. [Google Scholar] [CrossRef]
  55. Harrison, C. Electricity capital and accumulation strategies in the U.S. electricity system. Environ. Plan. E Nat. Space 2020, 3, 251484862094909. [Google Scholar] [CrossRef]
  56. Delborne, J.A.; Hasala, D.; Wigner, A.; Kinchy, A. Dueling metaphors, fueling futures: “Bridge fuel” visions of coal and natural gas in the United States. Energy Res. Soc. Sci. 2020, 61, 101350. [Google Scholar] [CrossRef]
  57. Li, J.; Xie, C.; Long, H. The roles of inter-fuel substitution and inter-market contagion in driving energy prices: Evidences from China’s coal market. Energy Econ. 2019, 84, 104525. [Google Scholar] [CrossRef]
  58. Chen, J.; Li, Z.; Song, M.; Wang, Y.; Wu, Y.; Li, K. Economic and intensity effects of coal consumption in China. J. Environ. Manag. 2022, 301, 113912. [Google Scholar] [CrossRef]
  59. Liu, L.-C.; Cheng, L.; Zhao, L.-T.; Cao, Y.; Wang, C. Investigating the significant variation of coal consumption in China in 2002–2017. Energy 2020, 207, 118307. [Google Scholar] [CrossRef]
  60. Dongyan, L. Fiscal and tax policy support for energy efficiency retrofit for existing residential buildings in China’s northern heating region. Energy Policy 2008, 37, 2113–2118. [Google Scholar] [CrossRef]
  61. Wang, T.; Wen, Y.; Lin, B. Energy consumption and the influencing factors in China: A nonlinear perspective. J. Clean. Prod. 2020, 249, 119375. [Google Scholar] [CrossRef]
  62. Frankel, J.A. The Effect of Monetary Policy on Real Commodity Prices. Monet. Econ. Work. Pap. 2006, 12713, 1–40. [Google Scholar]
  63. Liu, Z.; Chen, S.; Zhong, H.; Ding, Z. Coal price shocks, investor sentiment, and stock market returns. Energy Econ. 2024, 135, 107619. [Google Scholar] [CrossRef]
  64. Liu, H.-H.; Chen, Y.-C. A study on the volatility spillovers, long memory effects and interactions between carbon and energy markets: The impacts of extreme weather. Econ. Modell. 2013, 40, 840–855. [Google Scholar] [CrossRef]
  65. Zhou, G. Monetary policy and energy price fluctuations in China: An analysis based on the equilibrium of the money market and product market. Commer. Res. 2016, 3, 10–17. [Google Scholar]
  66. Ma, Y.R.; Liu, Z.; Ma, D.; Zhai, P.; Guo, K.; Zhang, D.; Ji, Q. A news-based climate policy uncertainty index for China. Sci. Data 2023, 10, 881. [Google Scholar] [CrossRef]
  67. Gu, C.; Yang, Y.; Zhou, R. Estimation of nonparametric term structure model of interest rates based on different kernel functions. J. Beijing Univ. Chem. Technol. (Nat. Sci. Ed.) 2009, 36, 112–115. [Google Scholar]
  68. Zhang, W.; Yin, G.; Tang, J.; Kang, Q. Application of exponential smoothing technique in coal demand forecasting in Chongqing. J. Chongqing Univ. (Nat. Sci. Ed.) 2006, 29, 110–111+116. [Google Scholar]
  69. Pang, J.; Liang, Y.C.; Sun, K.K.; Shi, Y. Decoupling effects and driving factors between provincial economic growth and coal consumption in China. China Environ. Sci. 2024, 44, 1144–1157. [Google Scholar]
  70. Wei, W.; Cai, W.; Guo, Y.; Bai, C.; Yang, L. Decoupling relationship between energy consumption and economic growth in China’s provinces from the perspective of resource security. Resour. Policy 2020, 68, 101693. [Google Scholar] [CrossRef]
  71. Karl, Y.; Chen, Z. Government expenditure and energy intensity in China. Energy Policy 2009, 2, 691–694. [Google Scholar]
  72. Fu, L.; Ho, C.-Y. Monetary policy surprises and interest rates under China’s evolving monetary policy framework. Emerg. Mark. Rev. 2022, 52, 100895. [Google Scholar] [CrossRef]
  73. Soyoung, K.; Hongyi, C. From a quantity to an interest rate-based framework: Multiple monetary policy instruments and their effects in China. J. Money Credit Bank. 2021, 54, 2103–2123. [Google Scholar]
  74. Li, J.; Liu, M.-H. Interest rate liberalization and pass-through of monetary policy rate to bank lending rates in China. Front. Bus. Res. China 2019, 13, 8. [Google Scholar] [CrossRef]
  75. Hammoudeh, S.; Nguyen, D.K.; Sousa, R.M. China’s monetary policy framework and global commodity prices. Energy Econ. 2024, 138, 107767. [Google Scholar] [CrossRef]
  76. Yan, S. The Effect of Interest Rate of Monetary Policy Transmission Mechanism in China. Adv. Manag. Sci. 2015, 2, 111–115. [Google Scholar]
  77. Yang, W.; Huang, R.; Li, D. China’s high-quality economic development: A study of regional variations and spatial evolution. Econ. Chang. Restruct. 2024, 57, 86. [Google Scholar] [CrossRef]
  78. Song, Y.; Pei, J.; Zhang, J.; Shi, Y. On the impact of provincial digital economy on high-quality economic development in China from a regional heterogeneity perspective. Int. J. Financ. Eng. 2024, 11, 2450015. [Google Scholar] [CrossRef]
  79. Xiao, D.; Sun, T.; Huang, K. Does the Innovative City Pilot Policy Promote Urban Energy Use Efficiency? Evidence from China. Sustainability 2024, 17, 7552. [Google Scholar] [CrossRef]
  80. Zhou, Y. Does the Concept of Green Development Promote High-Quality Urban Development?—An Empirical Analysis Based on the Pilot Policy of the “Zero-Waste City” in China. Sustainability 2024, 18, 8240. [Google Scholar] [CrossRef]
  81. Mai, Q.; Bai, M.; Li, L. Study on the Dynamic Evolution and Regional Differences of the Level of High-Quality Economic and Social Development in China. Sustainability 2022, 15, 382. [Google Scholar] [CrossRef]
  82. Zhang, C. Research on the Economical Influence of the Difference of Regional Logistics Developing Level in China. J. Ind. Integr. Manag. 2020, 2, 19. [Google Scholar] [CrossRef]
  83. Shang, X.; Liu, Q. Digital Inclusive Finance and Regional Economic Resilience: Evidence from China’s 283 Cities over 2011–2021. Financ. Res. Lett. 2024, 69, 105953. [Google Scholar] [CrossRef]
  84. He, Z.; Liu, G.; Zhao, X.; Wang, M.H. A review of Gaussian process regression methods. Control Decis. 2013, 28, 10. [Google Scholar]
  85. Huang, H.; Li, Z.; Peng, X.; Ding, S.X.; Zhong, W. Gaussian Process Regression With Maximizing the Composite Conditional Likelihood. IEEE Trans. Instrum. Meas. 2021, 70, 1–11. [Google Scholar] [CrossRef]
  86. Baláž, P.; Dutková, E.; Levinský, P.; Daneu, N.; Kubíčková, L.; Knížek, K.; Hejtmánek, J. Enhanced thermoelectric performance of chalcopyrite nanocomposite via co-milling of synthetic and natural minerals. Mater. Lett. 2020, 275, 128107. [Google Scholar] [CrossRef]
Figure 1. Coal prices in China’s seven major regions.
Mathematics 12 04019 g001
Figure 2. Theoretical analysis of factors influencing coal prices.
Mathematics 12 04019 g002
Figure 3. Predicted and actual values for seven regional markets: (a) predicted values vs. actual values of HB; (b) predicted values vs. actual values of HZ; (c) predicted values vs. actual values of HD; (d) predicted values vs. actual values of HN; (e) predicted values vs. actual values of XB; (f) predicted values vs. actual values of XN; (g) predicted values vs. actual values of DB.
Mathematics 12 04019 g003aMathematics 12 04019 g003b
Figure 4. First-order sensitivity index (S1).
Mathematics 12 04019 g004
Figure 5. S1 of factors influencing coal prices in China: (a) S1 of factors influencing coal prices in HB; (b) S1 of factors influencing coal prices in HZ; (c) S1 of factors influencing coal prices in HD; (d) S1 of factors influencing coal prices in HN; (e) S1 of factors influencing coal prices in XB; (f) S1 of factors influencing coal prices in XN; (g) S1 of factors influencing coal prices in DB.
Mathematics 12 04019 g005
Figure 6. The results of Gaussian regression and the Sobol index of thermal coal (Q5500K) at Qinhuangdao Port: (a) Gaussian regression results of thermal coal (Q5500K) at Qinhuangdao Port; (b) Sobol index of Qinhuangdao Port closing price thermal coal (Q5500K).
Mathematics 12 04019 g006
Table 1. Variable selection.
VariableIndicatorIndicator RepresentationData Source
Chinese coal pricesChina Coal Price Index: north China (CNY/ton)HBWind database
China Coal Price Index: central China (CNY/ton)HZWind database
China Coal Price Index: east China (CNY/ton)HDWind database
China Coal Price Index: south China (CNY/ton)HNWind database
China Coal Price Index: northwest (CNY/ton)XBWind database
China Coal Price Index: southwest (CNY/ton)XNWind database
China Coal Price Index: northeast China (CNY/ton)DBWind database
Energy pricesAustralian Newcastle Thermal Coal Price (USD/ton)NEWCWind database
Brent Crude Oil Price (USD/ton)BRENTWind database
Daqing Crude Oil Price (USD/ton)DQOWind database
Economic growthPer capita GDP (CNY)GDPWind database
Fiscal policyTax revenue (in CNY billions)TaxWind database
Government expenditure (in CNY billions)GWind database
Monetary policyBroad money supply month-on-month growth rate (%)M2Wind database
Interest rate (%)rWind database
Exchange rate (USD to RMB)FXWind database
UncertaintyEconomic policy uncertainty (China)CEPUEconomic Policy Uncertainty website
Climate policy uncertainty (China)CCPUThe methodology outlined by Ma et al. [66]
Geopolitical risks (China)CGPREconomic Policy Uncertainty website
Table 2. Descriptive statistics of variables.
VariableMeanMaximumMinimumStandard DeviationSample Size (Count)
HB158.0138246122.420.97395110
HZ151.4122188.2126.212.03921110
HD155.6604237.8128.317.42826110
HN148.884229.9120.614.87323110
XB178.4719232.6141.319.22749110
XN154.0935190.6137.910.77017110
DB169.6328220.1141.116.18112110
NEWC80.07973158.3848.1420.62362110
BRENT69.34314115.7317.8525.33874110
DQO63.94891115.1515.8326.09483110
GDP58,015.7881,369.9739,771.3712,078.33110
Tax11,188.3121,476.4466183224.343110
G16,872.9137,70069106880.059110
M20.86145453.74−1.270.9128188110
r4.7846366.313.850.8188386110
FX6.5288877.15436.05370.3152343110
CEPU392.5458970.829940.40321265.0098110
CCPU2.3493.441.120.453110
CGPR0.61182261.5211360.2220820.2850985110
Table 3. VIF values of 12 influencing factors.
VariableVIF1/VIF
NEWC2.140.4663
BRENT145.820.0068
DQO150.960.0066
GDP10.430.0958
Tax1.770.5641
G2.410.4149
M21.380.7236
r19.430.0514
FX6.860.1458
CEPU6.980.1432
CCPU1.480.6770
CGPR1.940.5158
Mean VIF 29.30
Table 4. R2 and RMSE values for the seven market models.
HBHZHDHNXBXNDB
R20.942270.912730.924140.882860.926310.946370.9056
RMSE5.26284.01134.43774.68834.34612.56314.0708
Table 5. S1 and ST of factors influencing coal prices in the seven markets.
VAR
Area
HB
(North China)
HZ
(Central China)
HD
(East China)
HN
(South China)
XB
(Northwest China)
XN
(Southwest China)
DB
(Northeast China)
S1STS1STS1STS1STS1STS1STS1ST
NEWC0.741 *0.740 **0.4460.4280.7950.7970.7960.8000.4130.4110.5240.5120.4300.422
BRENT0.0080.0110.0700.0780.0040.0070.0010.0020.0260.0370.0500.0600.0190.037
DQO0.0450.0370.1450.1250.0260.0210.0070.0040.0960.0820.1890.1800.1770.189
GDP0.1160.1270.0110.0660.0480.0600.0370.0470.0170.050−0.0050.0390.0340.103
TAX0.0020.0020.0170.006−0.0030.002−0.0020.0020.0010.0080.0070.0060.0100.016
G0.0060.0080.0030.0030.0130.0190.0190.0240.0010.0080.0010.0060.0000.003
M20.0020.0100.0260.048−0.0050.0060.0080.0140.0020.0180.0120.0320.0050.021
r0.0030.0110.1100.1260.0050.0140.0130.0200.2630.2820.0850.1000.0420.080
FX0.0050.0060.0270.0360.0490.0570.0720.0810.0570.0650.0040.0160.0400.053
CEPU0.0150.0210.0790.0980.0020.0040.0100.0080.0150.0080.0710.0910.0600.086
CCPU0.0440.0490.0650.0610.0280.0340.0140.0200.0260.0360.0220.0210.0600.068
CGPR0.0010.008−0.0050.0120.0070.0160.0110.0170.1080.0840.0060.0150.0210.023
This article explains the data with examples to help facilitate understanding. The value marked with * represents the S1 value for HB (north China) coal prices with respect to the variable NEWC, which is 0.741. A higher value indicates a greater influence of the variable on coal prices, while a lower value suggests a weaker impact. Similarly, the value marked with ** refers to the ST value for HB (north China) coal prices with respect to NEWC, which is 0.740. A larger value signifies a more significant contribution of this variable to coal prices, as well as stronger interaction with other variables. The same interpretation applies to other values in the analysis.
Table 6. Ranking of first-order sensitivity indices for factors affecting coal prices.
AreaRanking of the First-Order Sensitivity of Variables
HB (North China)NEWC > GDP > DQO > CCPU > CEPU > BRENT > G > FX > r > TAX > M2 > CGPR
HZ (Central China)NEWC > DQO > r > CEPU > BRENT > CCPU > FX > M2 > TAX > GDP > G
HD (East China)NEWC > FX > GDP > CCPU > DQO > G > CGPR > r > BRENT > CEPU
HN (South China)NEWC > FX > GDP > G > CCPU > r > CGPR > CEPU > M2 > DQO > BRENT
XB (Northwest China)NEWC > r > CGPR > DQO > FX > CCPU > BRENT > GDP > CEPU > M2 > G > TAX
XN (Southwest China)NEWC > DQO > r > CEPU > BRENT > CCPU > M2 > TAX > CGPR > FX > G
DB (Northeast China)NEWC > DQO > CEPU > CCPU > r > FX > GDP > CGPR > BRENT > TAX > M2 > G
Note: To facilitate understanding, the following explanation is provided: the ranking in each row represents the order of the S1 values of each variable in the market of the respective region.
Disclaimer/Publisher’s Note: The statements, opinions and data contained in all publications are solely those of the individual author(s) and contributor(s) and not of MDPI and/or the editor(s). MDPI and/or the editor(s) disclaim responsibility for any injury to people or property resulting from any ideas, methods, instructions or products referred to in the content.

