Article

Sustainable Design Factors and Solutions Analysis and Assessment for the Graphic Design Industry: A Hybrid Fuzzy AHP–Fuzzy MARCOS Approach

1
The Faculty of Art and Design, Quzhou College of Technology, Quzhou 324000, China
2
General Department, National and Kapodistrian University of Athens, Euripus Campus, 34400 Chalkis, Greece
Mathematics 2024, 12(24), 4014; https://doi.org/10.3390/math12244014
Submission received: 24 October 2024 / Revised: 17 November 2024 / Accepted: 20 December 2024 / Published: 21 December 2024
(This article belongs to the Special Issue Fuzzy Decision Making and Applications)

Abstract

:
Within the realm of graphic design sustainability, selecting appropriate solutions has become a crucial strategic decision for organizations aiming to optimize their operations. This paper presents a novel hybrid multi-criteria decision-making (MCDM) approach, integrating a fuzzy analytical hierarchy process (FAHP) and fuzzy measurement alternatives and ranking according to compromise solution (FMARCOS). Evaluation criteria for graphic design sustainability are determined through consultation with experts, with their judgments expressed using linguistic terms based on fuzzy numbers. Criteria weights are calculated using FAHP, and the ranking and selection of the optimal potential solution are determined using FMARCOS. Subsequently, sensitivity analysis of the criteria weights is conducted to validate the results. Findings indicate that the integrated FAHP and FMARCOS model provides a robust and adaptable assessment framework for graphic design sustainability, enabling companies to navigate complexities strategically and effectively. The key contribution of this research is its emphasis on a systematic and objective model, offering practical insights relevant to the industry. It also serves as a valuable benchmark for future research in similar fields.

1. Introduction

The concept of sustainable design originated in the 1960s [1,2]. In the early 1970s, Victor Papanek [3] published a book called Design for the Real World: Human Ecology and Social Change, arguing that designers should consider environmental and social factors in the design process. This book is considered to be a seminal work in the field of sustainable design, establishing relevant concepts and principles in the field of sustainable design. McDonough et al. [4] outlined their vision of sustainability in product design, arguing that products should be designed for continuous cycles of use and reuse. Tu [5,6] further added sustainable approaches and suggestions for the product design industry. Clark et al. [7] explored emerging trends in product design and development, emphasizing that ecological design elements will become crucial indicators for achieving sustainability in future product designs. Morelli [8] reported that designers should carefully consider the environmental and social impacts of products’ production processes, including raw material extraction, manufacture, use, and disposal. Müller [9] argued that designers should aim to minimize the environmental impact of the products they design. This includes reducing resource consumption, minimizing waste and pollution, and improving energy efficiency throughout the product lifecycle. In the context of mounting global interest in the protection of the planet’s health and the assurance of shared prosperity for humanity, the United Nations established a set of 17 global goals in 2015 [10]. These goals, collectively known as the Sustainable Development Goals (SDGs), are further delineated into 169 specific targets, each providing a detailed account of the specific objectives associated with its respective SDG [11]. Since then, many scholars have begun to explore and study the relationship between sustainable design and SDGs. For example, Kellert et al. [12] mentioned that human well-being should be prioritized when thinking about sustainability, thereby promoting user health and community well-being as well as social equity and accessibility. Goubran et al. [13] introduced an innovative analytical drawing tool to support architectural designers. This tool is expected to enhance architectural practices in both the private and public sectors and advance the theory and practice of sustainable building design. Fan et al. [14] used Porter’s Diamond Model as a research tool to propose strategies and suggestions for the sustainable development of China’s animation industry from various aspects such as production, demand, supply chain, corporate strategy, cultural factors, and government.
Li [15] offered a new perspective on employee perception in the context of design’s impact on brand equity. This is one of the more recent studies to explore the concept of sustainable design from the perspective of employees in the post-epidemic era. It attempted to gain insight into the ways in which the principles of sustainable design shape employee perceptions and behaviors. The findings reported that sustainable design elements have a notable influence on employee perceptions, which, in turn, inspire positive actions and enhance brand equity, which is mediated by sustainable design concepts.
Murdoch-Kitt et al. [16] proposed a collection of case studies from university-level graphic design and visual communication courses that used project-based learning to further sustainable practices. They found that students developed unique problem-solving skills and were inspired to think about graphic design sustainability when they used design and communication skills to solve public practice problems in the field of sustainability. Ji et al. [17] investigated the potential for visual design techniques to facilitate the formation of long-lasting emotional connections between consumers and products. Their findings suggest that well-designed graphics have the ability to evoke long-term emotional responses, which in turn influence consumers’ perceptions and behaviors towards the product, including an increased likelihood of sustainable usage.

1.1. Motivation

More recently, Lin et al. [18] implemented a hybrid multi-criteria decision-making (MCDM) approach to examine the pivotal SDGs influencing the visual design industry. By exploring and discussing the differences in perspective between service providers and consumers, the authors proposed that visual design practitioners should focus on fulfilling basic consumer needs to achieve SDGs. This is one of the most recent research findings to apply a hybrid MCDM method to the sustainability of the visual design industry. It helps visual design service providers to identify the key factors that meet consumer expectations, thereby aligning with consumer needs. However, the study only explored the prioritization of SDGs from the dual perspective of service providers and consumers. It did not delve into sustainable design factors and potential solutions for the sustainability of visual design-related industries.
In addition, Chang et al. [19] emphasized that the fuzzy analytic hierarchy process (FAHP) is a highly esteemed MCDM technique. By integrating fuzzy logic, FAHP skilfully addresses the inherent uncertainty, complexity, and vagueness of both the problem and the expert opinion. This leads to a more realistic and robust identification of key influencing factors. This technique minimizes the risk of overly subjective and imprecise results, which are common in pairwise comparisons. It is particularly useful when many decision criteria are involved, representing a fuzzy spectrum of collective expert judgment. Gupta et al. [20] reported that the imprecise or fuzzy judgment of the decision-maker can be incorporated based on the FAHP for anticipating a better decision for the selection of sustainable factors. Aminuddin et al. [21] pointed out that compared to other traditional MCDM methods, such as the best-worst (BMW) and analytical network process (ANP) methods, the FAHP can process fuzzy judgment inputs from multiple decision-makers through efficient computations, thereby providing accurate and consistent results.
Moreover, Wang et al. [22] highlighted the advantages of the fuzzy measurement of alternatives and ranking according to the compromise solution (FMARCOS) as follows. (1) The model incorporates fuzzy reference points from the outset, considering both the fuzzy ideal and fuzzy anti-ideal solutions. (2) It allows for a more precise determination of utility in relation to both established solutions. (3) It is a novel method for determining and aggregating utility functions. (4) It accommodates the consideration of a large number of criteria and alternatives. Bakır [23] noted that the strength of the FMARCOS method lies in its fusion of the ratio approach and the reference point sorting approach, which leads to more logical and consistent results, thereby demonstrating commendable stability and reliability in its results, even in dynamic environments.
Furthermore, the related research on sustainable factors and potential solutions for the graphic design industry is still insufficient. Most practitioners in the graphic design industry lack clear guidance on how to improve and achieve sustainability. Therefore, this study aims to address this gap by exploring and analyzing the key sustainable design factors and potential solutions to provide related decision-making suggestions for achieving graphic design sustainability.

1.2. Research Objectives

In view of this, in this research, an evaluation framework of sustainable design factors and alternatives will be established via expert consultations. Afterwards, the FAHP will be implemented to assess and calculate the weights of the main criteria and sub-criteria. Subsequently, the FMARCOS will be applied to rank all alternatives, thereby achieving the following research objectives:
  • To construct an evaluation structure for graphic design sustainability.
  • To analyze and calculate the weight of dimensions and indicators using the FAHP.
  • To evaluate and rank all solutions using the FMARCOS.
  • To provide related sustainable decision-making suggestions to practitioners in the graphic design industry.
The main contribution of this paper is to propose a new hybrid model combining the FAHP and FMARCOS for the evaluation and measurement of sustainable design indicators and potential solutions in the graphic design industry. The originality of this paper is as follows. (1) This study is the first to consider sustainable design factors and alternatives in the graphic design industry in a fuzzy environment. This research can provide valuable insights into the sustainability of the graphic design industry. (2) By exploiting the advantages of FAHP and FMARCOS methods, the proposed integrated method can conveniently express the real situation of the decision problem and better represent expert evaluations by simplifying the calculation. (3) By conducting sensitivity analysis and comparative analysis with other fuzzy MCDM methods (fuzzy WASPAS, fuzzy COPRAS, fuzzy TOPSIS, and fuzzy VIKOR), decision-makers can test the stability of the method. The research results can be effectively applied to other fields.

2. Literature Review

In this research, a method integrating the FAHP and FMARCOS will be implemented to evaluate the sustainable design index and alternatives for the graphic design industry. Thus, the literature related to this study is explored and discussed as follows.

2.1. Research Gaps

This study introduces a novel methodology that integrates FAHP and FMARCOS techniques to assess sustainability in graphic design for the first time. In the MCDM process, the allocation of criterion weights is of paramount importance due to their significant impact on the outcomes [24]. Odu [25] and Deng et al. [26] have noted that employing mathematical approaches to determine weights facilitates data-driven structural analysis and enhances decision-making efficacy.
Simultaneously, Kumar et al. [27] demonstrated the application of advanced arithmetic operations on fuzzy numbers, transitioning reliability assessments from point estimates to interval estimates. Additionally, Dhiman et al. [28] investigated the reliability of ultra-low-temperature (ULT) freezers within a fuzzy framework, particularly regarding their pivotal role during the COVID-19 pandemic in vaccine preservation. Their research examined the influence of preventive maintenance and external conditions on the performance of these critical devices, offering insights to ensure their optimal functionality. Kumar et al. [29] further examined the performance of an “injection molding machine” in a fuzzy environment. These studies represent recent advancements in applying fuzzy numbers to MCDM, showcasing the utility of fuzzy methodologies for addressing complex decision-making challenges.
Despite this, the adoption of hybrid MCDM approaches for evaluating sustainability in the graphic design sector under fuzzy conditions remains scarce. The hybrid FAHP and FMARCOS approach proposed in this research seeks to bolster methodological robustness. It highlights previously overlooked aspects of the graphic design industry, thereby addressing gaps in the existing literature. This paper aims to contribute to filling this research void.

2.2. The Development of the Graphic Design Industry

The term “graphic design” first appeared in a seminal book by William Addison Dwiggins entitled New Kind of Printing Calls for New Design in 1922 [30]. As a book designer, Dwiggins crafted the term to articulate his approach to orchestrating and refining the visual elements within his creations. Despite this, the term “graphic design industry” has long lacked a clear definition and a well-defined research field. It was not until the early 1980s, with the publication of Meggs’ seminal work Meggs’ History of Graphic Design, that a comprehensive description and analysis of the field emerged [31]. The book helped establish a canon of significant movements, figures, and works, providing a framework for understanding the evolution of the discipline. Subsequently, Eskilson [32] provided a thorough overview of the field’s history, significant movements, and influential figures, offering readers a nuanced understanding of how graphic design has shaped and been shaped by broader cultural and technological trends.
It is worthy of note that Barnard [33], Albadi et al. [34], and Martins et al. [35] have mentioned that, in contrast to the visual communication design industry, which encompasses traditional print and digital media, the graphic design industry is more focused on print-related media, such as posters, fonts, layouts, book-binding, magazines, and packaging, with the main objective of creating attractive print-related design works.
As people’s environmental awareness gradually increased, Szenasy [36] mentioned that graphic design practitioners should start thinking about the impact of manufacturing processes on the environment and society, which is considered the origin of the concept of sustainable graphic design. In 2008, Barth [37] went on to explain the concepts and trends of the sustainable graphic design industry. He mentioned that the sustainable graphic design industry must adhere to the two main principles of recyclability and waste minimization in the printing and manufacturing processes. In the meantime, he emphasized that all decision-making processes of graphic designers should have relevant concepts of sustainable development to achieve the sustainability of the graphic design industry.
Jedlicka [38] argued that graphic designers should not be content with merely addressing conventional design issues and must play a role in promoting sustainability. Thus, he proposed the concept of systems thinking, encouraging graphic designers to consider the entire lifecycle of their work from audience impact and choices to material sourcing and societal consequences. Fine [39] further added that graphic designers should consider the impact of the materials on the sustainability of the design and manufacturing processes. Similarly, Huang [40] presented novel perspectives on the positioning and capability requirements of the graphic design industry in the post-epidemic era. She mentioned that graphic design practitioners should continue to enhance their cross-disciplinary competencies, with a particular focus on techniques pertaining to achieving sustainability to meet the novel challenges and opportunities presented by the post-COVID-19 era.
Bonsu et al. [41] believed that graphic designers in developing countries should also contribute to sustainability. They suggested that graphic designers in such countries should adhere to professional ethics when performing related design works and one of the responsibilities of graphic designers in developing countries is to educate customers on the relevant concepts of sustainable development for achieving design sustainability. Kadas [42] reported that graphic designers should adhere to the highest standards of ethical conduct, as they bear significant public responsibility and contribute to social sustainability by defending social values, shaping social norms, and cultivating beliefs about sustainability.
Alahira et al. [43] suggested that graphic design’s creative potential to cultivate sustainable solutions can make a significant contribution to improving sustainability. They observed that sustainable graphic design practices encompass a spectrum of strategies that aim to minimize environmental impacts while maximizing aesthetic and functional value, reflecting elements of sustainability awareness and responsibility. In addition, they can be integrated into design work to raise awareness of sustainable practices and inspire corresponding actions for sustainability.

2.3. Fuzzy Analytic Hierarchy Process (FAHP)

The analytic hierarchy process (AHP) was initially proposed by Saaty [44] and has since become a prominent approach for addressing MCDM challenges across diverse fields. Its effectiveness has been substantiated by numerous studies [45,46,47]. The AHP is particularly adept at organizing complex problems into a structured hierarchy, facilitating a systematic decomposition into more manageable units for comprehensive evaluation and quantitative assessment.
Nevertheless, in order to address the inherent uncertainties associated with real-world scenarios, Chang [48] developed an integrated approach in 1996 that combined fuzzy logic with AHP, known as fuzzy AHP (FAHP). This innovative method effectively addresses the challenges of decision-making that arise from the presence of imprecise or ambiguous information.
In recent decades, the FAHP has become a widely embraced and trusted methodology for addressing MCDM challenges. Its robustness and dependability have been repeatedly demonstrated through successful implementation across a variety of studies [49,50,51,52].
In addition, some scholars have employed the FAHP to address questions pertaining to sustainability. For instance, Rehman et al. [53] employed the FAHP as a research instrument to propose pertinent strategies and recommendations for the manufacturing sector to attain the SDGs. In a related study, Larimian et al. [54] developed an FAHP model for the evaluation of sustainable environmental design factors in Tehran City. The researchers found that factors related to environmental design are the most crucial element in promoting environmental sustainability, as they facilitate the establishment of a sense of ownership and responsibility among citizens. Wang et al. [55] proposed a case study on the location of renewable energy power plants in Vietnam, employing a hybrid approach combining the FAHP, data envelopment analysis (DEA), and the technique for order of preference by similarity to ideal solution (TOPSIS).
Mostafa et al. [56] employed the FAHP to evaluate forest management plans. Alyamani et al. [57] employed the FAHP for the assessment and selection of a sustainable project. The most significant factor in the selection of sustainable projects was identified as project cost, followed by novelty and uncertainty. Pan [58] employed the FAHP to assess and select sustainable bridge engineering methods, thereby demonstrating the viability of the FAHP in addressing challenges in the domain of sustainable engineering. Ashour et al. [59] applied the FAHP to explore the obstacles that the interior design industry may encounter in achieving the SDGs. They reported that the implementation of adequate sustainable design modules, the establishment of effective design specifications, and client interest in the SDGs represent crucial factors that can facilitate the interior design industry in surmounting obstacles and achieving the SDGs.
The preceding research outcomes substantiated the viability of employing the FAHP in the fields of sustainable design, engineering, energy, and business. Furthermore, they served as a pivotal source of inspiration for this study’s utilization of the FAHP approach in the evaluation of graphic design sustainability.

2.4. Fuzzy Measurement of Alternatives and Ranking According to Compromise Solution (FMARCOS)

The measurement of alternatives and ranking according to compromise solution (MARCOS) was initially introduced in 2020 [60]. It represents a novel and efficient technique within the MCDM field. It transforms the decision-making process by overcoming several limitations inherent in other approaches. Specifically, MARCOS overcomes challenges such as the neglect of the relative importance of distances and reduces the complexity of extensive computations. The method evaluates a range of parameters relating to the performance of alternatives and uses utility-driven functions to determine their final performance scores. El-Araby [61] indicated that MARCOS is a contemporary method highly suited to decision-making scenarios as it is less susceptible to the rank reversal issue.
In recent years, the feasibility of applying MARCOS to issues related to sustainability has been demonstrated by some scholars. For example, Badi et al. [62] and Pamucar et al. [63] assessed sustainable performance indicators for the green innovation and road transportation industries using MARCOS. Krishankumar et al. [64] and Birkocak et al. [65] established an assessment framework for zero-carbon mobility and fiber fabric recycling using the MARCOS methodology.
Despite this, many scholars [66,67,68] argued that the introduction of fuzzy-related methods contributes to a more precise determination of an acceptable solution, especially since the consideration of different factors is a very demanding and difficult task. Accordingly, a novel integrated method combining fuzzy numbers and MARCOS, called fuzzy MARCOS (FMAROCS), was proposed by Stanković et al. [69]. Subsequently, FMARCOS has been applied by many scholars in the sustainability field, demonstrating its feasibility, efficiency, and high accuracy in solving sustainability issues. For example, Puška et al. [70] proposed a selection model of sustainable suppliers using FMARCOS. Wang et al. [71] applied FMARCOS to evaluate and select a sustainable food supplier. The proposed framework was applied to a numerical example of a sustainable food supplier and comparative studies were conducted to demonstrate its rationality, robustness, and advantages over existing MCDM approaches for solving sustainable food supply problems. Similarly, Tuş et al. [72] developed an applicable and efficient methodology for green supplier selection using an integrated method of fuzzy stepwise weight assessment ratio analysis (FSWARA) and FMARCOS. The proposed framework was applied to a real-world green supplier selection problem in the textile industry. Its effectiveness is verified through sensitivity and comparative analyses, providing a practical and effective decision-making result for green supplier selection.
Çakır et al. [73] utilized the FMARCOS method to help a municipality in Turkey choose among sustainable hybrid electric vehicle alternatives, solving the sustainable hybrid electric vehicle selection problem. Wang et al. [74] proposed a hybrid model combining the ordinal priority approach (OPA) and FMARCOS for evaluating and ranking innovative and potentially sustainable last-mile solutions (LMSs). The results indicated that convenience store pickup, green vehicles, and parcel lockers are the most sustainable LMS options for Vietnam based on technical, economic, social, and environmental criteria. In addition, they also conducted a sensitivity analysis and a comparative analysis to validate the robustness of the proposed OPA–fuzzy MARCOS model, demonstrating its stability and applicability for LMS evaluation.

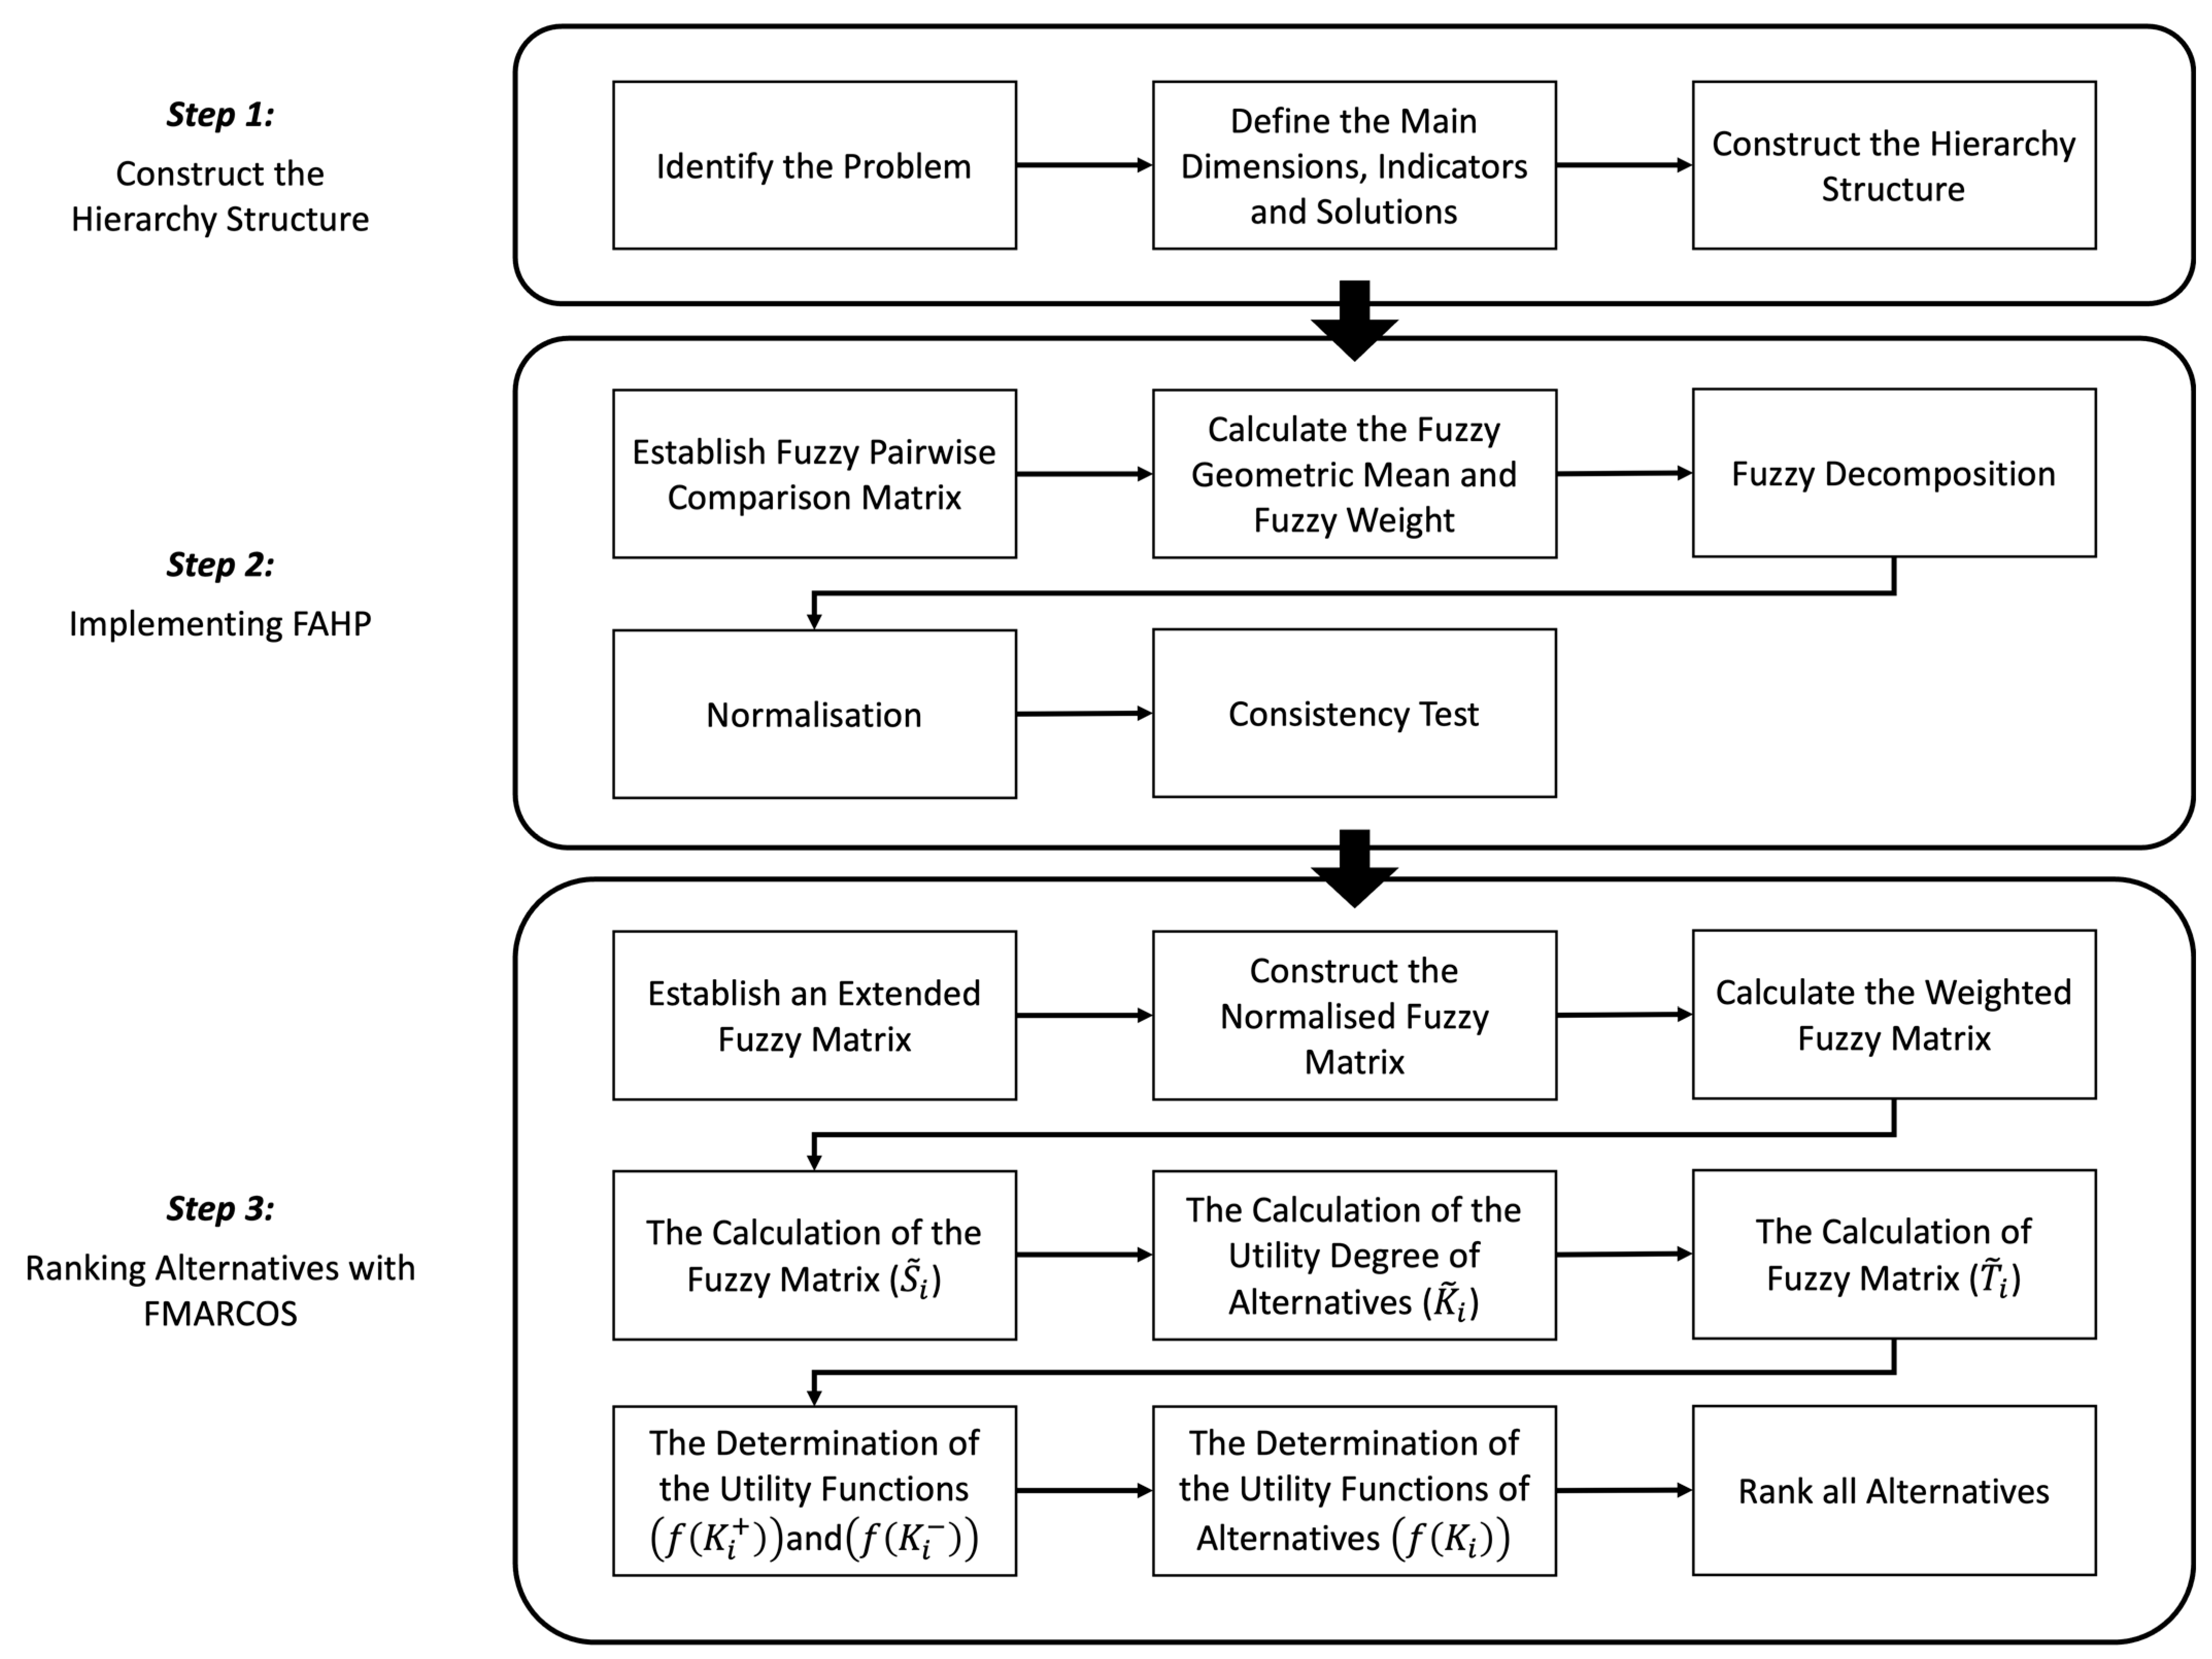
3. Materials and Methods

In this research, a method combining the FAHP and FMARCOS is proposed to analyze and evaluate sustainable design factors and alternatives for the graphic design industry. The research process is shown in Figure 1.

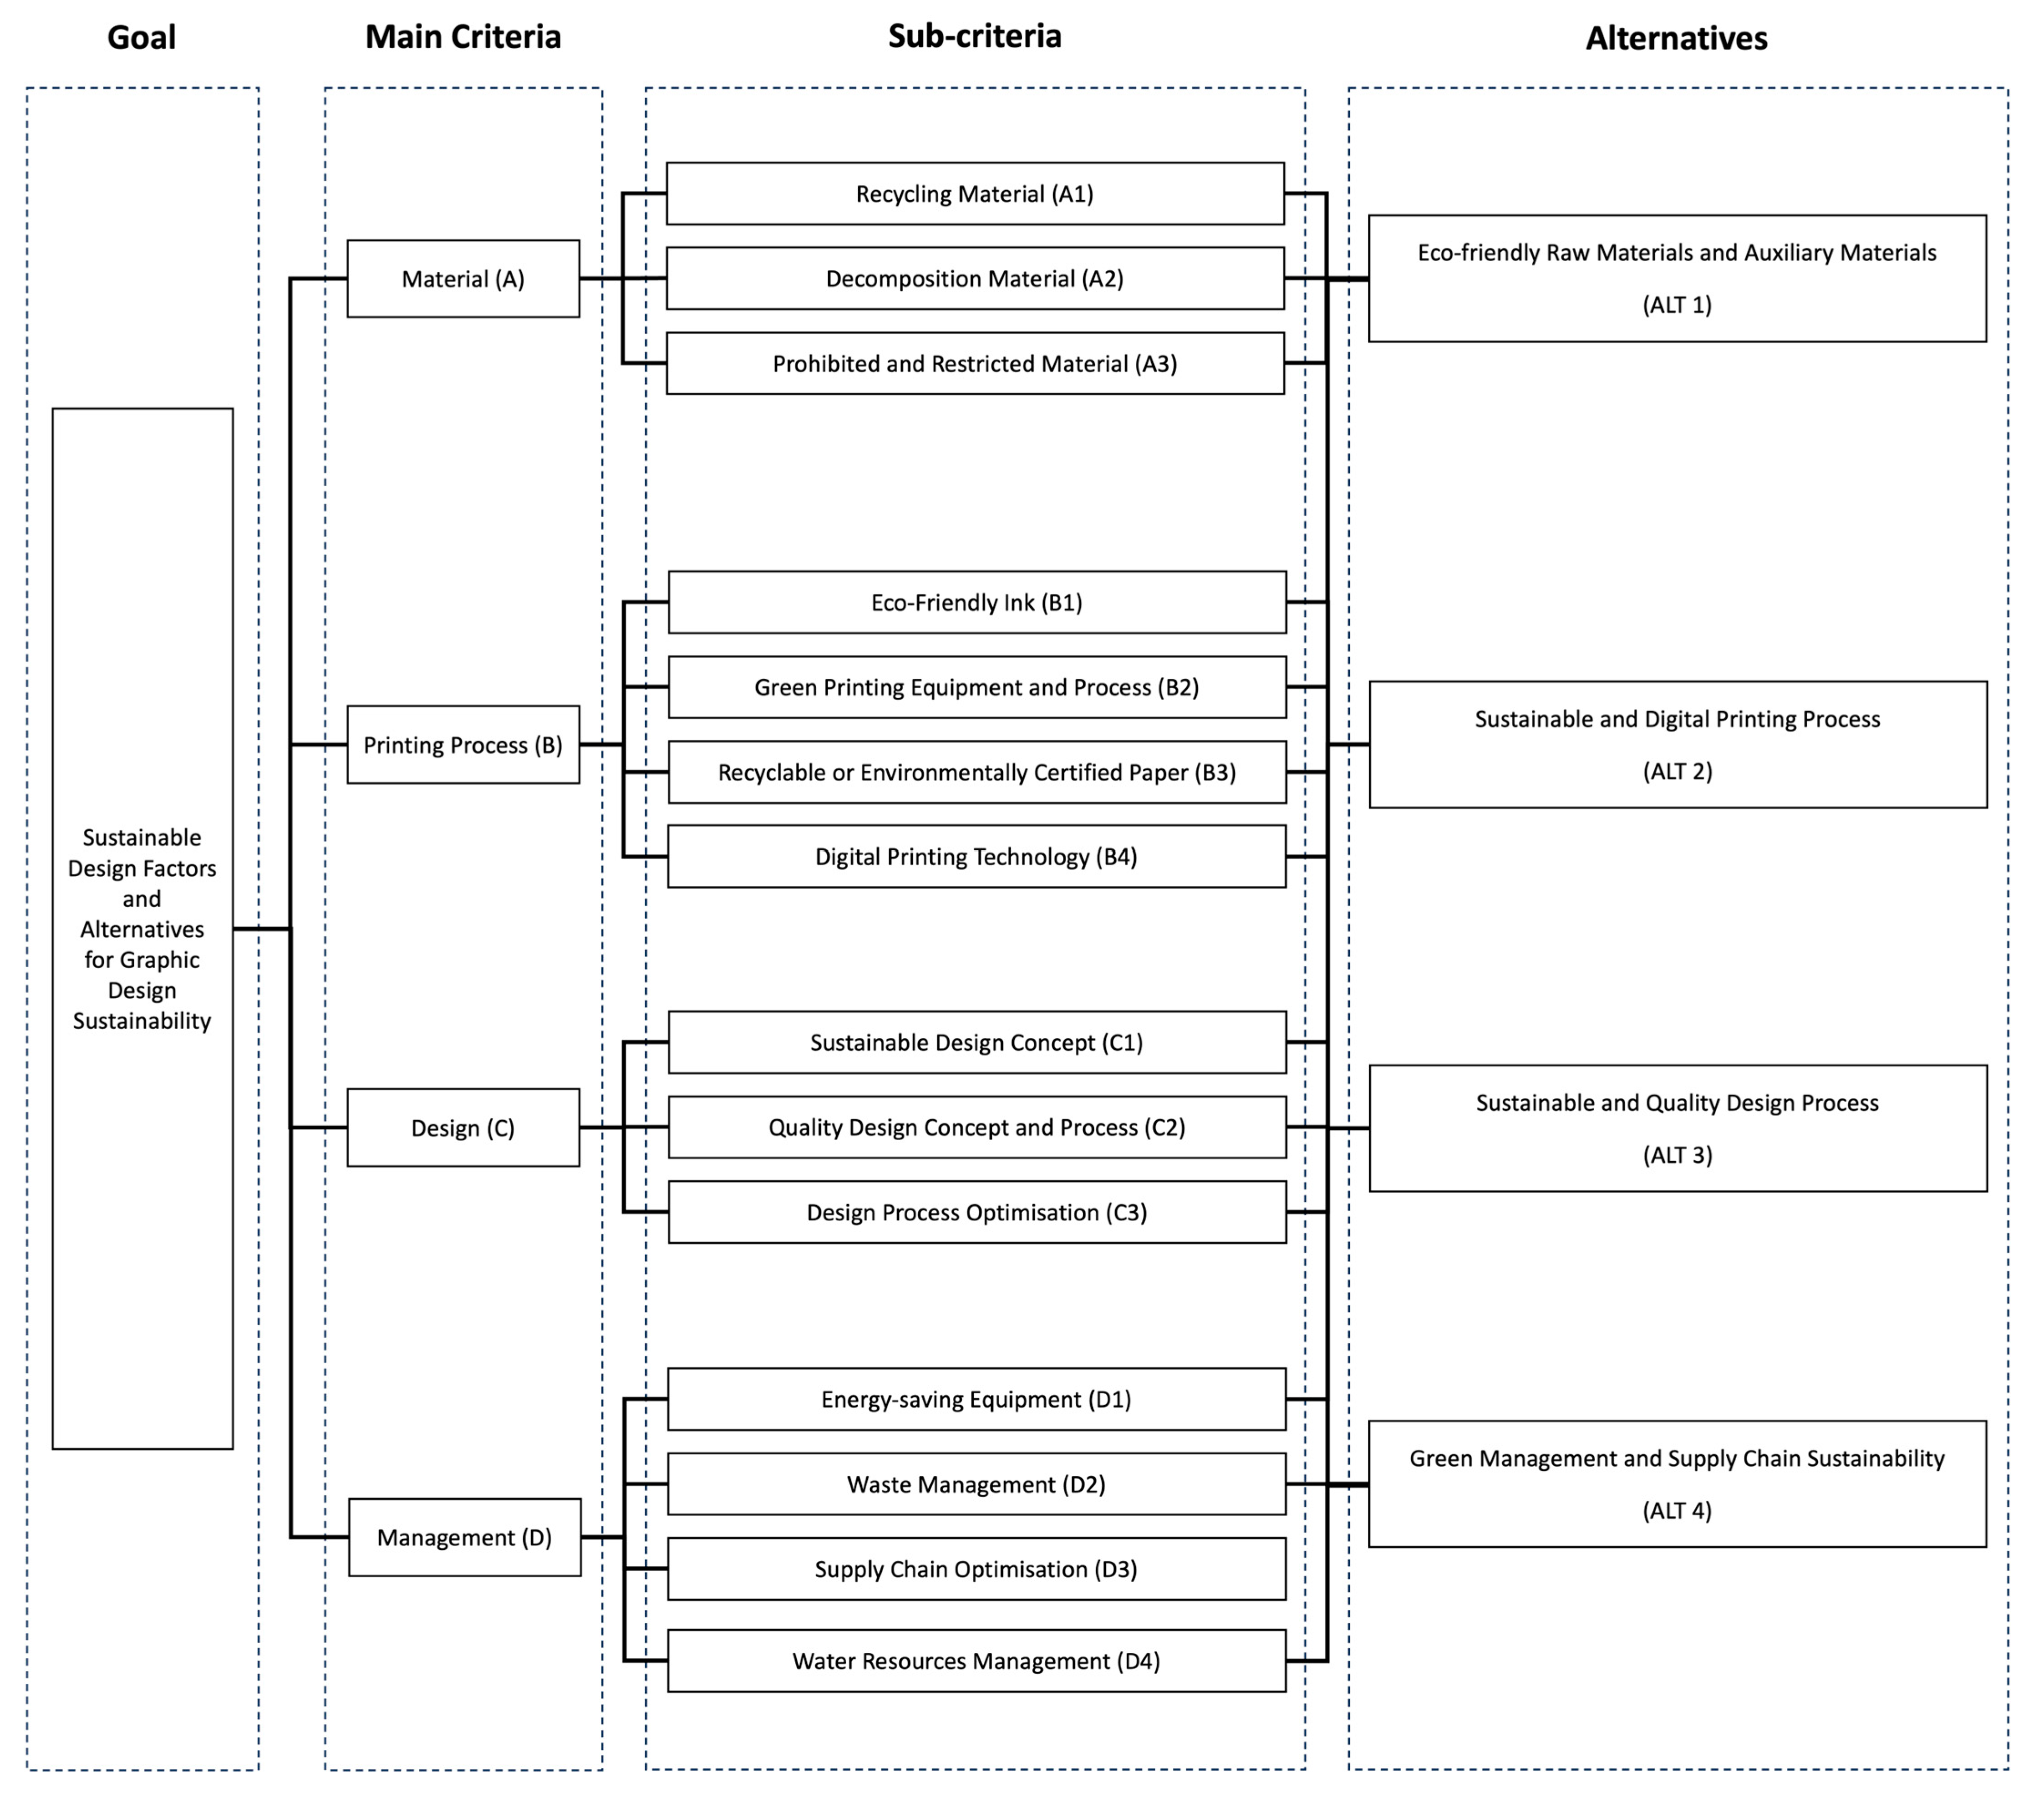
3.1. The Construction of the Hierarchy Structure

To construct the hierarchy structure, the problem has been decomposed into evaluation criteria and alternatives in accordance with the research methods. In addition, Tsai et al. [75] suggested that the description of evaluation criteria and solutions should be reviewed and revised via expert consultation. Accordingly, a total of ten experts were invited to establish a focus group for this study. Among these, three are senior managers in graphic-design-related industries, four are senior creative directors, and the other three are senior graphic designers.
Subsequently, each focus group member independently reviewed every criterion based on their professional experiences. This assessment sought to ascertain whether the descriptions were congruent with this study’s aims. Thereafter, they engaged in an inductive examination of the assessment criteria and solutions to construct an initial hierarchy structure for the research.
Although the initial hierarchy structure was established, a pre-test was conducted to check and evaluate whether the semantic description and classification of the main criteria, sub-criteria, and alternatives were clear and appropriate. A total of 167 expert questionnaires were distributed and 109 valid responses were obtained. Subsequently, we invited another ten experts to review and revise the description and wording of each criterion in accordance with the results of the pre-test. Following this, the hierarchical structure of graphic design sustainability was constructed, including 4 main criteria, 14 sub-criteria, and 4 alternatives, as shown in Figure 2.

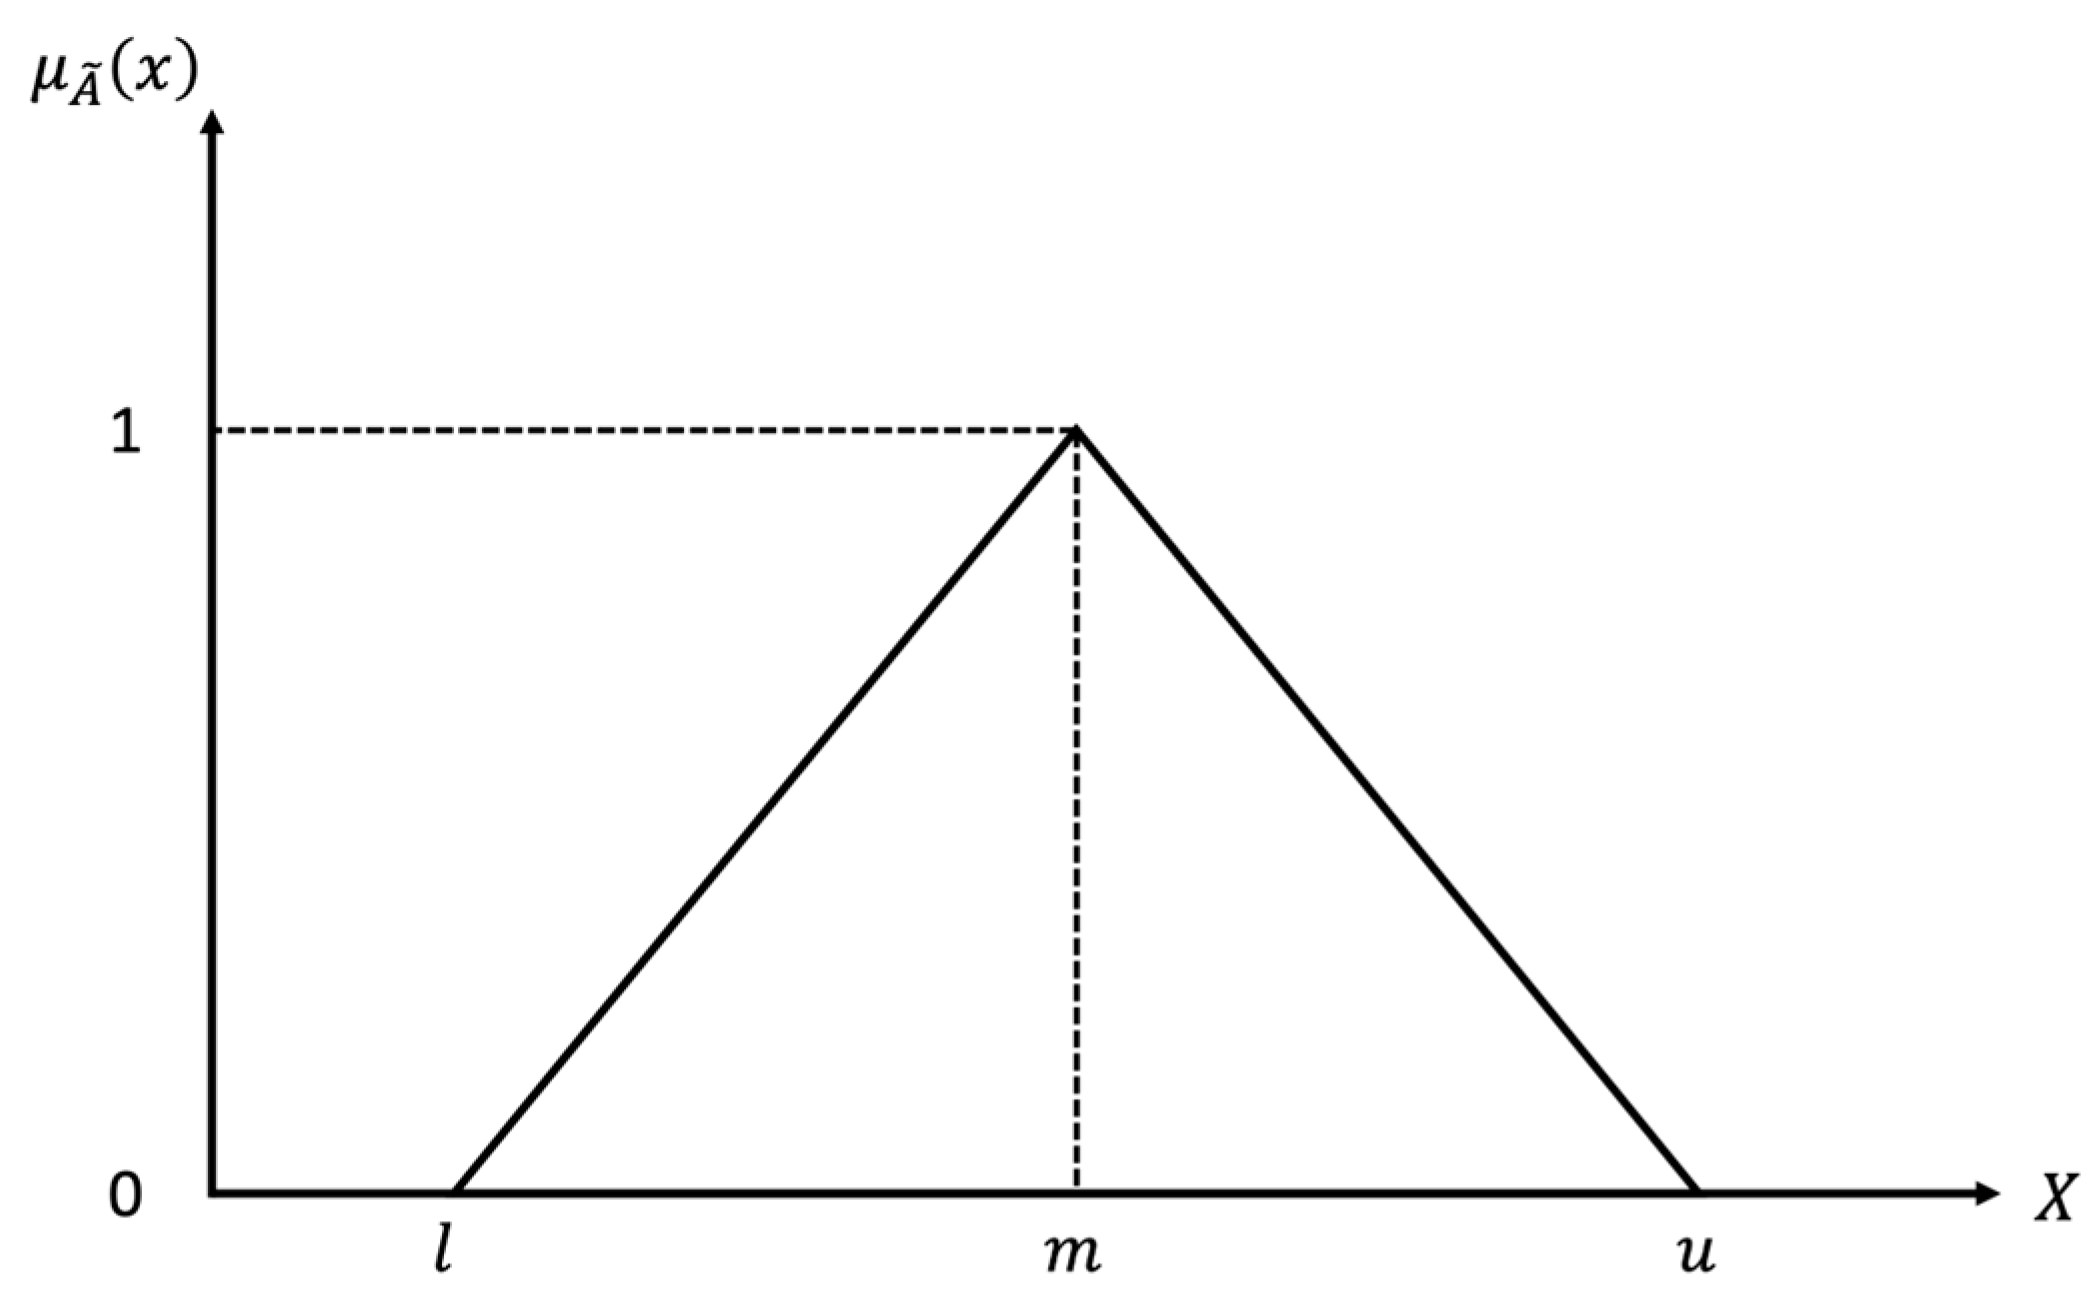
3.2. Fuzzy Theory and Triangular Fuzzy Numbers

Fuzzy theory was firstly proposed by Dr. Lotfi Zadeh [76], addressing imprecision or vagueness in real-world problems. The triangular fuzzy numbers (TFN) can be denoted as ( l , m , u ), indicating the least likely ( l ), most promising ( m ), and largest conceivable ( u ) values in the TFN. The TFN A ( l , m , u ), given by the following equation, are shown in Figure 3.
μ A ~ x = x l m l , l x m x u u m , m x u 0 , o t h e r w i s e ,
A ~ = A o y , A i y = l + m l y ,   u + u m y ,   y 0 ,   1
where o y and i y denote the left and right sides of a fuzzy number, respectively.
The operations of TFN A ~ 1 = l 1 ,   m 1 ,   u 1 and A ~ 2 = l 2 ,   m 2 ,   u 2 are as follows [77,78]:
Addition:
A ~ 1 A ~ 2 = l 1 ,   m 1 ,   u 1 + l 2 ,   m 2 ,   u 2 = l 1 + l 2 ,   m 1 + m 2 ,   u 1 + u 2
Subtraction:
A ~ 1 A ~ 2 = l 1 ,   m 1 ,   u 1 + l 2 ,   m 2 ,   u 2 = l 1 l 2 ,   m 1 m 2 ,   u 1 u 2
Multiplication:
A ~ 1 A ~ 2 = l 1 ,   m 1 ,   u 1 + l 2 ,   m 2 ,   u 2 = l 1 × l 2 ,   m 1 × m 2 ,   u 1 × u 2
Division:
A ~ 1 A ~ 2 = l 1 ,   m 1 ,   u 1 l 2 ,   m 2 ,   u 2 = l 1 u 2 , m 1 m 2 , u 1 l 2
Reciprocal:
A ~ 1 1 = l 1 ,   m 1 ,   u 1 1 = 1 u 1 , 1 m 1 , 1 l 1

3.3. Fuzzy Analytic Hierarchy Process (FAHP)

The intervals of the linguistic variable have been suggested by [79,80,81]. The relative importance of the two criteria is rated on a scale from 1 to 9 using the linguistic variables provided. The corresponding fuzzy numbers in the FAHP model are shown in Table 1.
Step 1: Set up the fuzzy pairwise comparison matrix. In this step, a fuzzy pairwise comparison matrix is performed and presented as follows:
A k ~ = a 11 k ~ a 12 k ~ a 1 n k ~ a 21 k ~ a 22 k ~ a 2 n k ~ a n 1 k ~ a n 2 k ~ a n n k ~ ,
where A k ~ represents the fuzzy pairwise comparison matrix and a n n k ~ is the triangular fuzzy mean value for comparing priority pairs among elements.
Step 2: The fuzzy geometric mean ( r ~ i ) and fuzzy weight ( w ~ i ) are calculated as follows:
r ~ i = l 1 l 2 , , l i 1 i ,   m 1 m 2 , , m i 1 i ,   u 1 u 2 , , u i 1 i ,
w ~ i = r ~ i r ~ 1 r ~ 2 r ~ n 1 = l w i ,   m w i ,   u w i ,
where l w i is the smallest value of the triangular fuzzy weight, m w i is the median value of the triangular fuzzy weight, and u w i is the largest value of the triangular fuzzy weight.
Step 3: In terms of fuzzy decomposition, the “center of area” (COA) method [82] is applied for defuzzification. The process of fuzzy decomposition is as follows:
w i = l w i + m w i + u w i 3 ,
Step 4: Afterwards, the de-fuzzified weights ( w i ) were normalized using the following equation to obtain the weighted total as 1.
ω i = w i w i

3.4. Fuzzy Measurement of Alternatives and Ranking According to Compromise Solution (FMARCOS)

Step 1: Establishing an extended fuzzy matrix. The extended fuzzy matrix is performed by determining the fuzzy anti-ideal A ~ A I solution and fuzzy ideal solution A ~ I D as follows:
X ~ = A ~ A I A ~ 1 A ~ 2 A ~ m A ~ I D C ~ 1         C ~ 2         C ~ n x ~ a i 1 x ~ a i 2 x ~ a i n x ~ 11 x ~ 12 x ~ 1 n x ~ 21 x ~ m 1 x ~ i d 1 x ~ 22 x ~ m 2 x ~ i d 2 x ~ 2 n x ~ m n x ~ i d n ,
The fuzzy A ~ I D represents an alternative with the best performance, whereas the fuzzy A ~ A I denotes the least desirable alternative. Depending on the characteristics of the criteria, the A ~ I D and A ~ A I sets are established as follows:
A ~ I D = max i x ~ i j   i f   j B   a n d   min i x ~ i j   i f   j C
A ~ A I = min i x ~ i j   i f   j B   a n d   max i x ~ i j   i f   j C
where B belongs to the maximization group of criteria while C belongs to the minimization group of criteria.
Step 2: Constructing the normalized fuzzy matrix N ~ = n ~ i j m × n . It can be obtained by applying the following equations.
n ~ i j = n i j l , n i j m , n i j u = x i j l x i d u , x i j m x i d u , x i j u x i d u   i f   j B
n ~ i j = n i j l , n i j m , n i j u = x i d l x i j u , x i d l x i j m , x i d l x i j l   i f   j C
where x i j l , x i j m , x i j u and x i d l , x i d m , x i d u represent the elements of the matrix X ~ .
Step 3: Calculation of the weighted normalized fuzzy matrix V ~ . The weighted fuzzy matrix V ~ is obtained by multiplying the normalized matrix N ~ with the weight coefficient of each criterion ω ~ j using the following equation.
v ~ i j = v i j l , v i j m , v i j u = n ~ i j × ω ~ j = n i j l × ω j l , n i j m × ω j m , n i j u × ω j u
where ω ~ j = ω j l , ω j m , ω j u represents the elements of the fuzzy weight of the criteria.
Step 4: Calculating the fuzzy matrix S ~ i using the following equation.
S ~ i = i = 1 n v ~ i j
where S ~ i s i l , s i m , s i u represents the sum of the elements of the weighted fuzzy matrix V ~ .
Step 5: Calculation of the utility degree of alternatives K ~ i . The utility degrees of alternatives K ~ i are calculated as follows:
K ~ i = S ~ i S ~ a i = s i l s a i u , s i m s a i m , s i u s a i l
K ~ i + = S ~ i S ~ i d = s i l s i d u , s i m s i d m , s i u s i d l
Step 6: Calculating of the fuzzy matrix T ~ i using the following equation.
T ~ i = t ~ i = K ~ i K ~ i + = K i l + K i + l ,   K i m + K i + m ,   K i u + K i + u
Afterwards, a new fuzzy number D ~ is determined as follows:
D ~ = d l ,   d m ,   d u = max i t ~ i j
Subsequently, the number D ~ must be de-fuzzified using d f c r i s p = l + 4 m + u 6 to obtain the number d f c r i s p .
Step 7: Determination of utility functions in relation to the ideal f K ~ i + and anti-ideal f K ~ i solutions. The ideal and anti-ideal solutions are calculated as follows:
f K ~ i + = K ~ i d f c r i s p = K i l d f c r i s p ,   K i m d f c r i s p ,   K i u d f c r i s p
f K ~ i = K ~ i + d f c r i s p = K i + l d f c r i s p ,   K i + m d f c r i s p ,   K i + u d f c r i s p
Subsequently, the values of K ~ i , K ~ i + , f K ~ i and f K ~ i + can be de-fuzzified using the same de-fuzzification formula.
Step 8: Determination of the utility function of alternatives. The utility function of alternatives is determined as follows:
f K i = K i + + K i 1 + 1 f K i + f K i + + 1 f K i f K i
Step 9: Ranking the Solutions. Within the FMARCOS model, all possible options are ordered based on the ultimate values of the utility function, represented as f K i . The optimal choice is determined as the one nearest to the ideal point while being the most distant from the anti-ideal reference point. This suggests that alternatives with greater utility function values are regarded as more advantageous.
In addition, a new linguistic scale for evaluating alternatives has been defined within the FMARCOS model, which is shown in Table 2. A total of nine linguistic terms are defined, as well as the triangular fuzzy number for each term.

4. Results

4.1. Numerical Analysis

4.1.1. Fuzzy Analytic Hierarchy Process (FAHP)

In this study, the fuzzy pairwise comparison matrix was established using Equation (8). Table 3 demonstrates the fuzzy pairwise comparison matrix of the main criteria in the FAHP model.
The calculation processes of fuzzy geometric mean values, the fuzzy weight ( w ~ i ), the de-fuzzified weight, and the normalized weight ( ω i ) for the main criteria by applying Equations (9)–(12) are shown in Table 4, Table 5, Table 6 and Table 7.
Since the number of main criteria was four, we obtained n = 4 and R . I . = 0.90 . Thus, the consistency index (C.I.) and consistency ratio (C.R.) were calculated as follows:
λ m a x = 4.118 + 4.23 + 4.229 + 4.303 4 = 4.22
C . I . = λ m a x n n 1 = 4.22 4 4 1 = 0.0734
C . R . = C . I . R . I . = 0.0734 0.90 = 0.0815
Subsequently, Table 8 revealed the calculation results of the triangular fuzzy number matrix for each main criterion, including normalized weights ( ω i ), the consistency index (C.I.), and the consistency ratio (C.R.).
The calculation process of the triangular fuzzy number matrix for the remaining criteria is analogous to the above calculation method. Finally, the calculation results of the triangular fuzzy number matrix for the remaining criteria are shown in Table 9, Table 10, Table 11 and Table 12.
As shown in Table 9, Table 10, Table 11 and Table 12, the consistency index (C.I.) and the consistency ratio (C.R.) for all criteria are less than 0.1. It means that the data in the pairwise comparison matrix are consistent.
After passing the consistency test, the fuzzy weights ( w ~ i ) of all sub-criteria in the FAHP model are shown in Table 13.

4.1.2. Fuzzy Measurement of Alternatives and Ranking According to Compromise Solution (FMARCOS)

The FMARCOS method is implemented by using the fuzzy weights obtained by the FAHP to identify the optimal alternatives. The extended fuzzy matrix was established using Equation (13), as shown in Table 14.
The normalized fuzzy matrix (Table 15) was constructed using Equation (16). Since all criteria need to be maximized, an example of normalization is as follows:
n ~ 11 = 5.000 9.000 , 7.000 9.000 , 7.000 9.000 = 0.556 ,   0.778 ,   0.778
The values of the weighted normalized fuzzy matrix shown in Table 16 were obtained by applying Equation (18): v ~ i j = n 11 l × ω 1 l , n 11 m × ω 1 m , n 11 u × ω 1 u = 0.556 × 0.210 , 0.778 × 0.333 , 0.778 × 0.588 = 0.117 , 0.259 , 0.457 .
The calculation results of utility degrees and the fuzzy matrix ( T ~ i ) by using Equations (19)–(22) are shown in Table 17.
Subsequently, a new fuzzy number D ~ must be determined using Equation (23) D ~ = d l ,   d m ,   d u = max i t ~ i j . Thus, D ~ = 0.702 ,   2.601 ,   12.720 was obtained and then the fuzzy number D ~ should be de-fuzzified using the expression d f c r i s p = l + 4 m + u 6 to obtain the de-fuzzified number d f c r i s p = 3.9713 .

4.2. Research Results

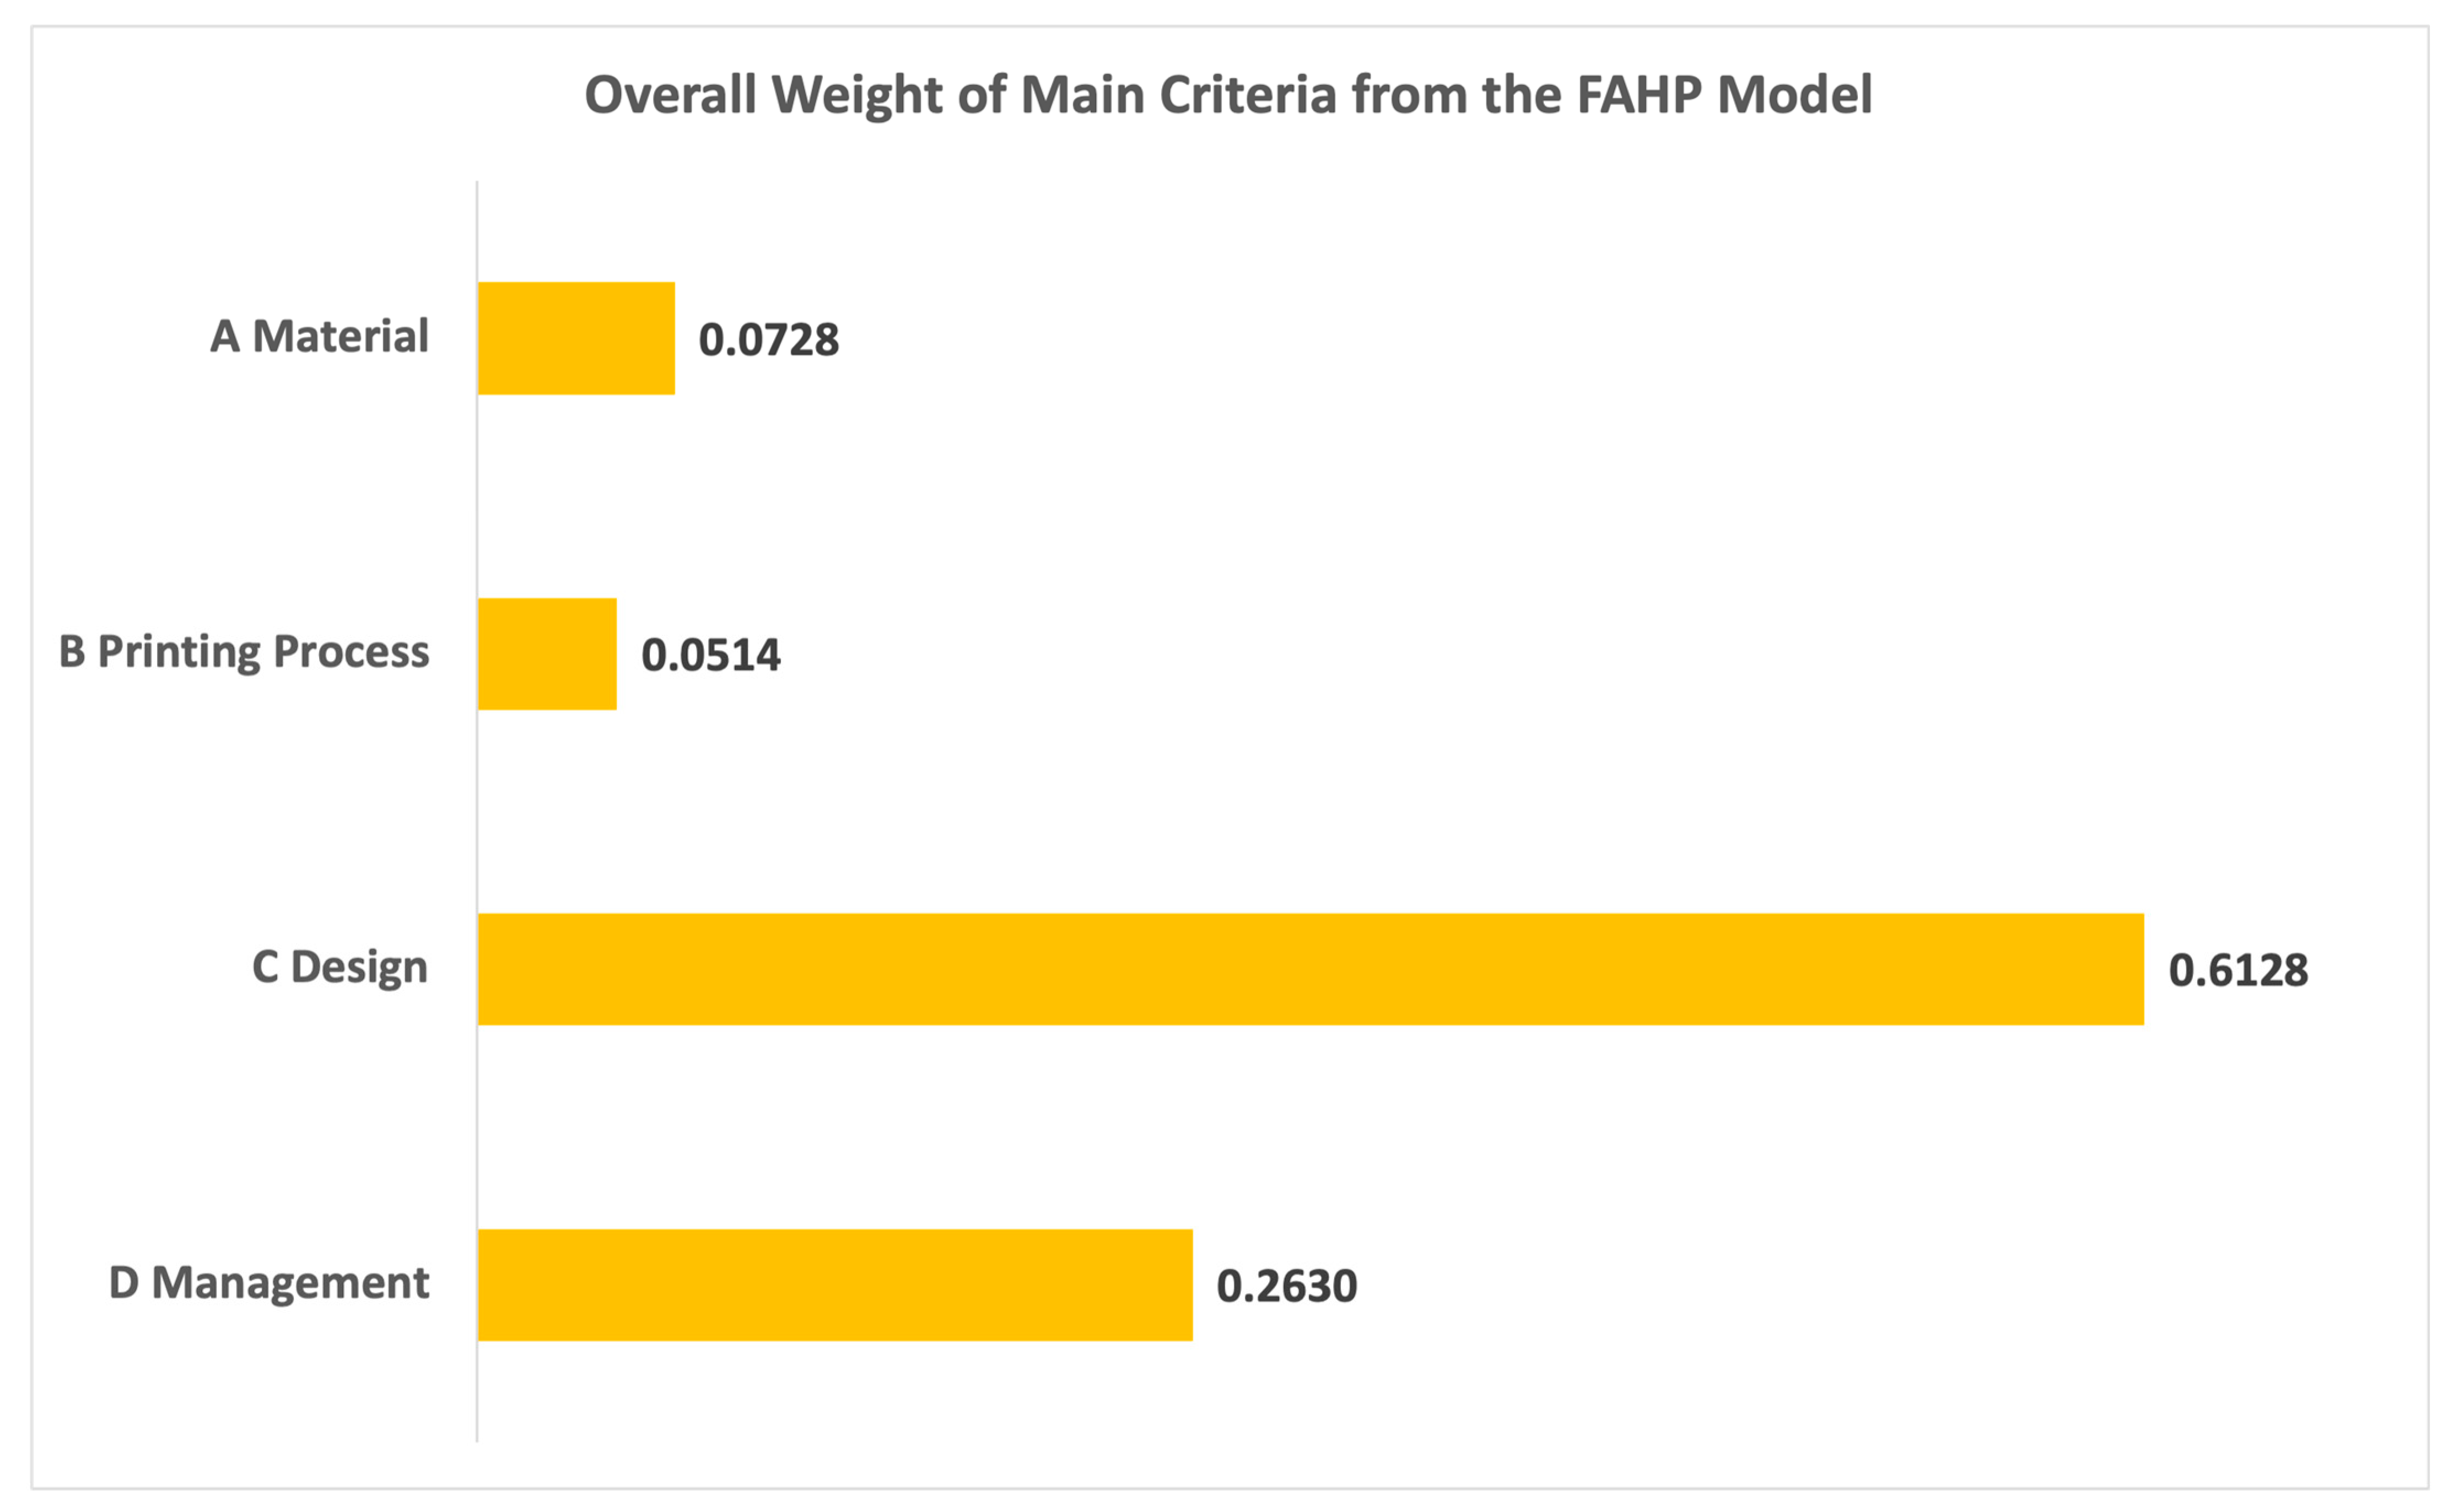
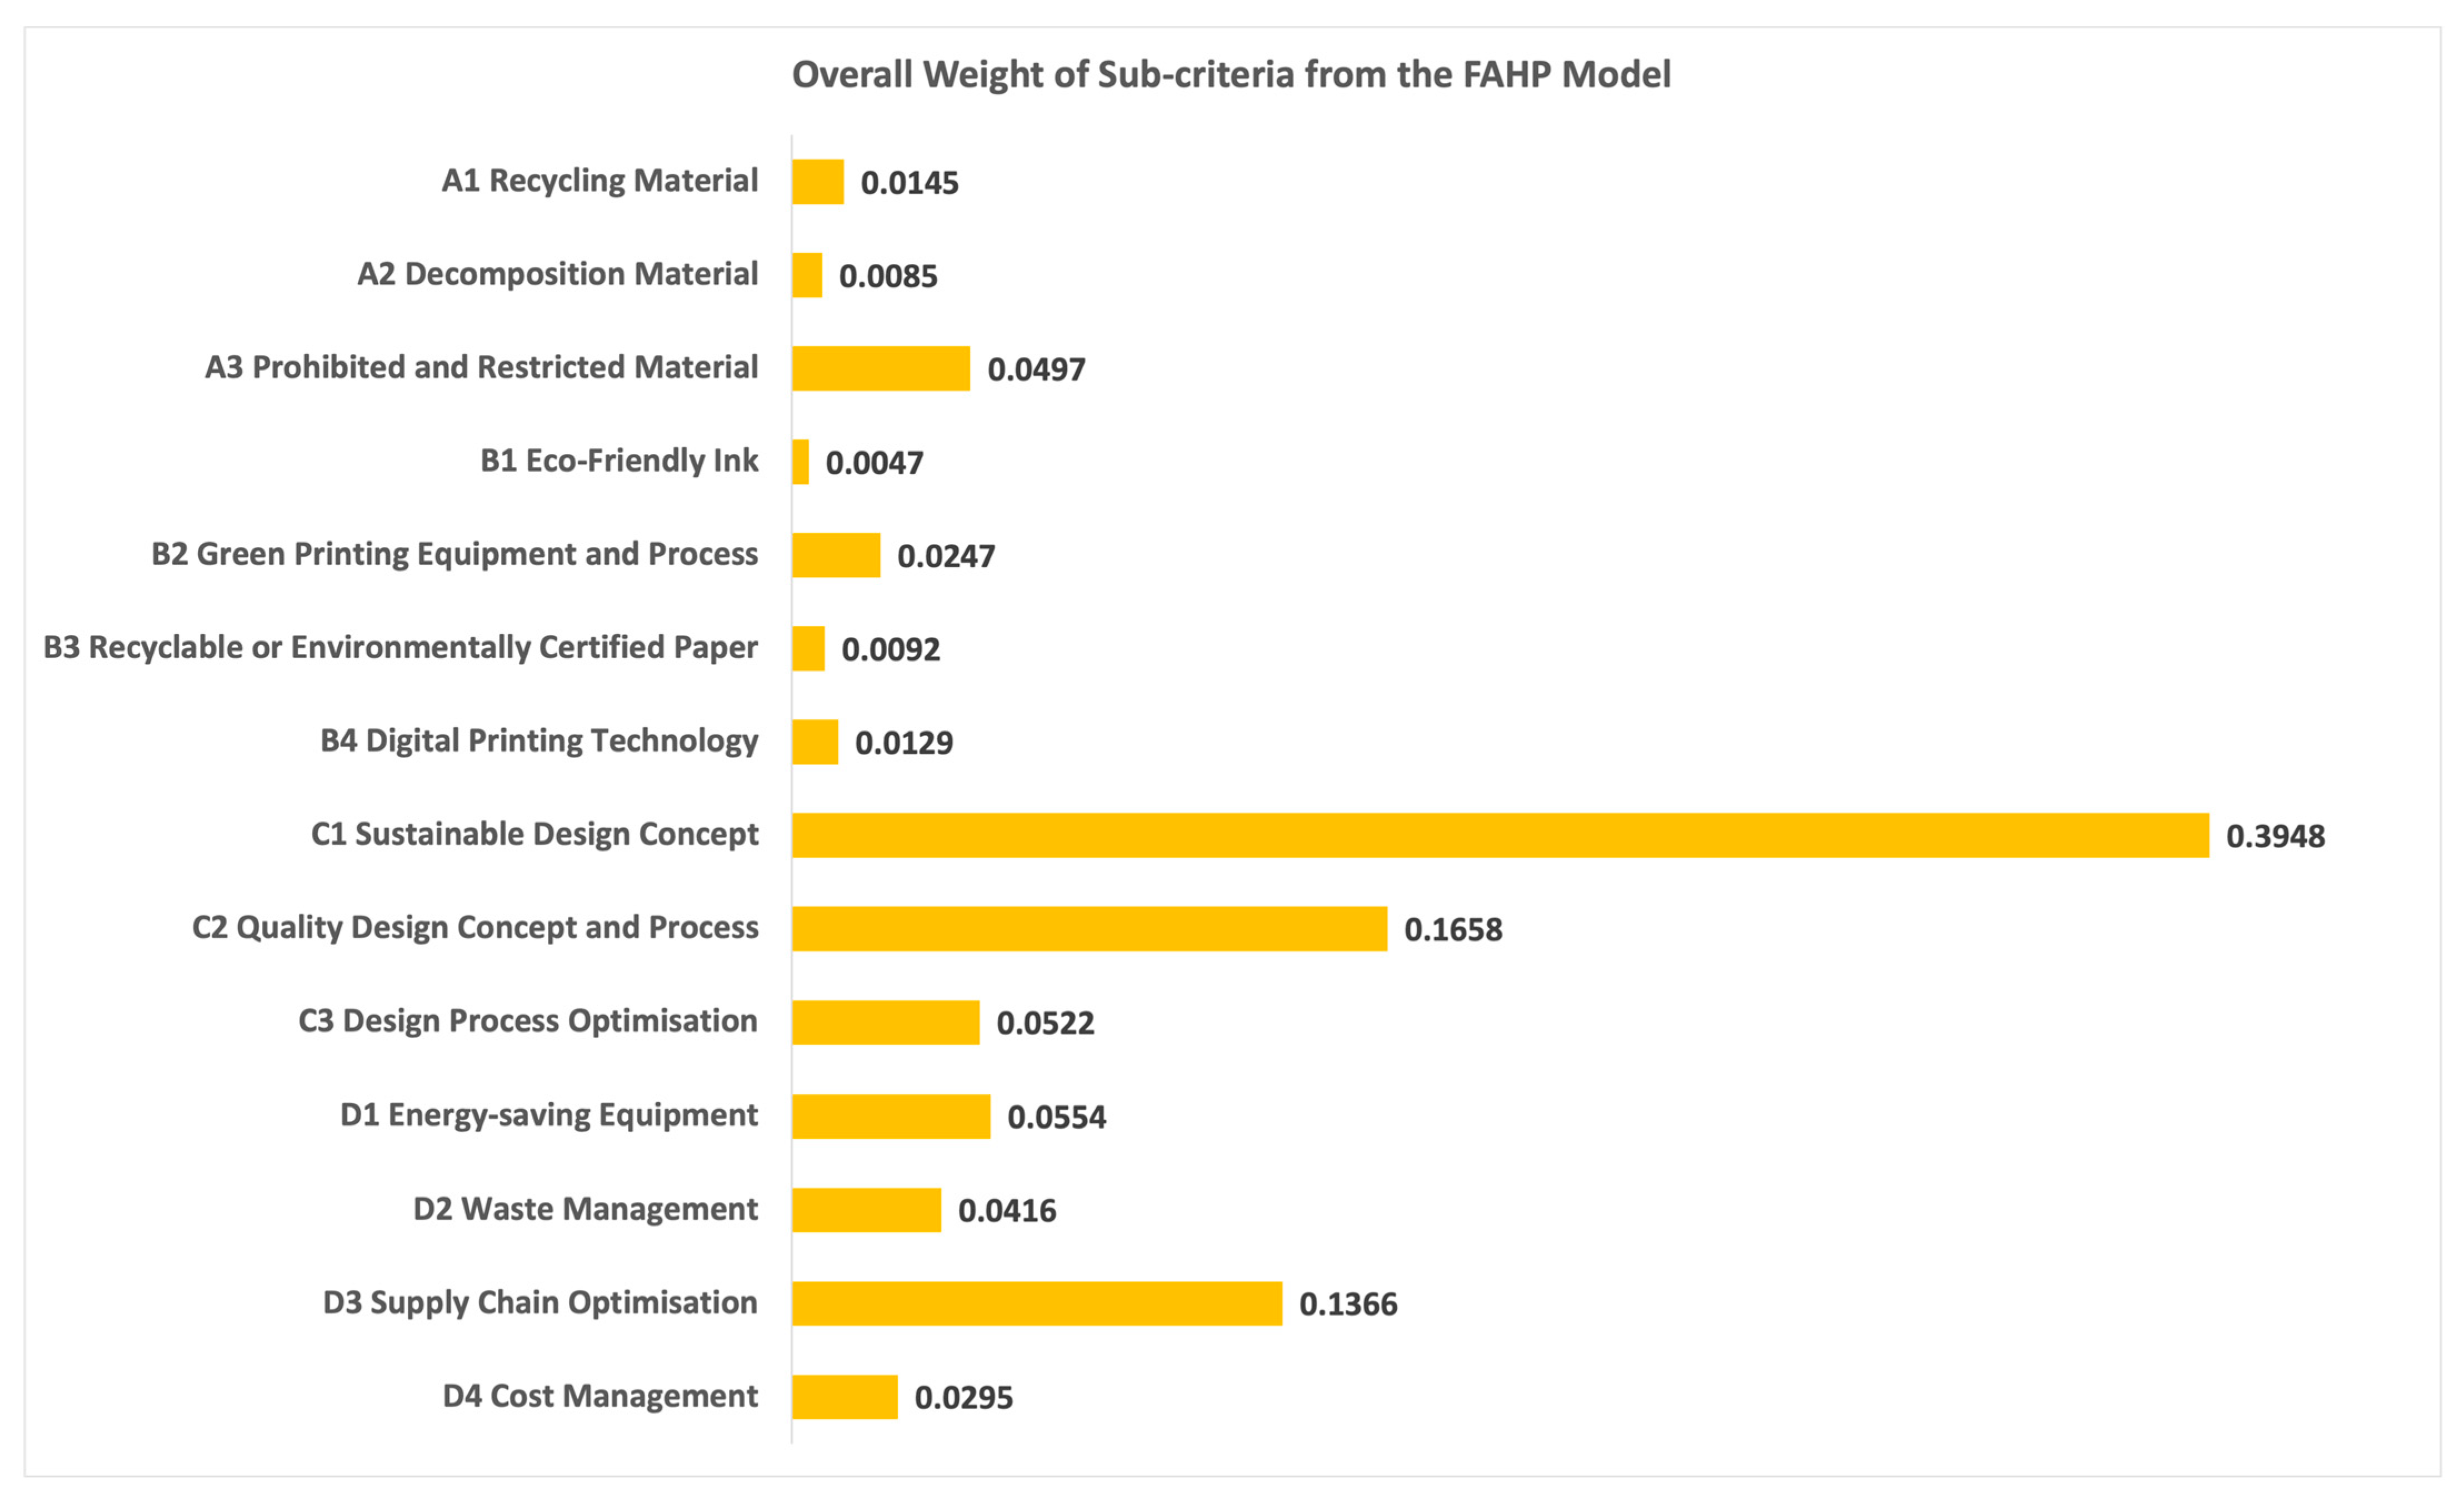
4.2.1. Fuzzy Analytic Hierarchy Process (FAHP)

In the FAHP model, all criteria are ranked based on their overall weight (OW). Accordingly, we entered all data in the pairwise comparison matrix into Super Decision 3.2 software. This software was developed by Prof. Saaty [83], the inventor of the analytic hierarchy process (AHP), and is suitable for obtaining the overall weight of all criteria. The ranking results of all criteria in the FAHP model are shown in Figure 4 and Figure 5.
In Figure 4, the most significant main criterion was design (0.6128), followed by management (0.2630), material (0.0728), and printing process (0.0514).
In Figure 5, the five sub-criteria with the most impact, as identified through the FAHP analysis, were “Sustainable Design Concept” (C1), “Quality Design Concept and Process” (C2), “Supply Chain Optimisation” (D3), “Energy-saving Equipment” (D1), and “Design Process Optimisation”, with overall weights of 0.3948, 0.1658, 0.1366, 0.0554, and 0.0522, respectively.

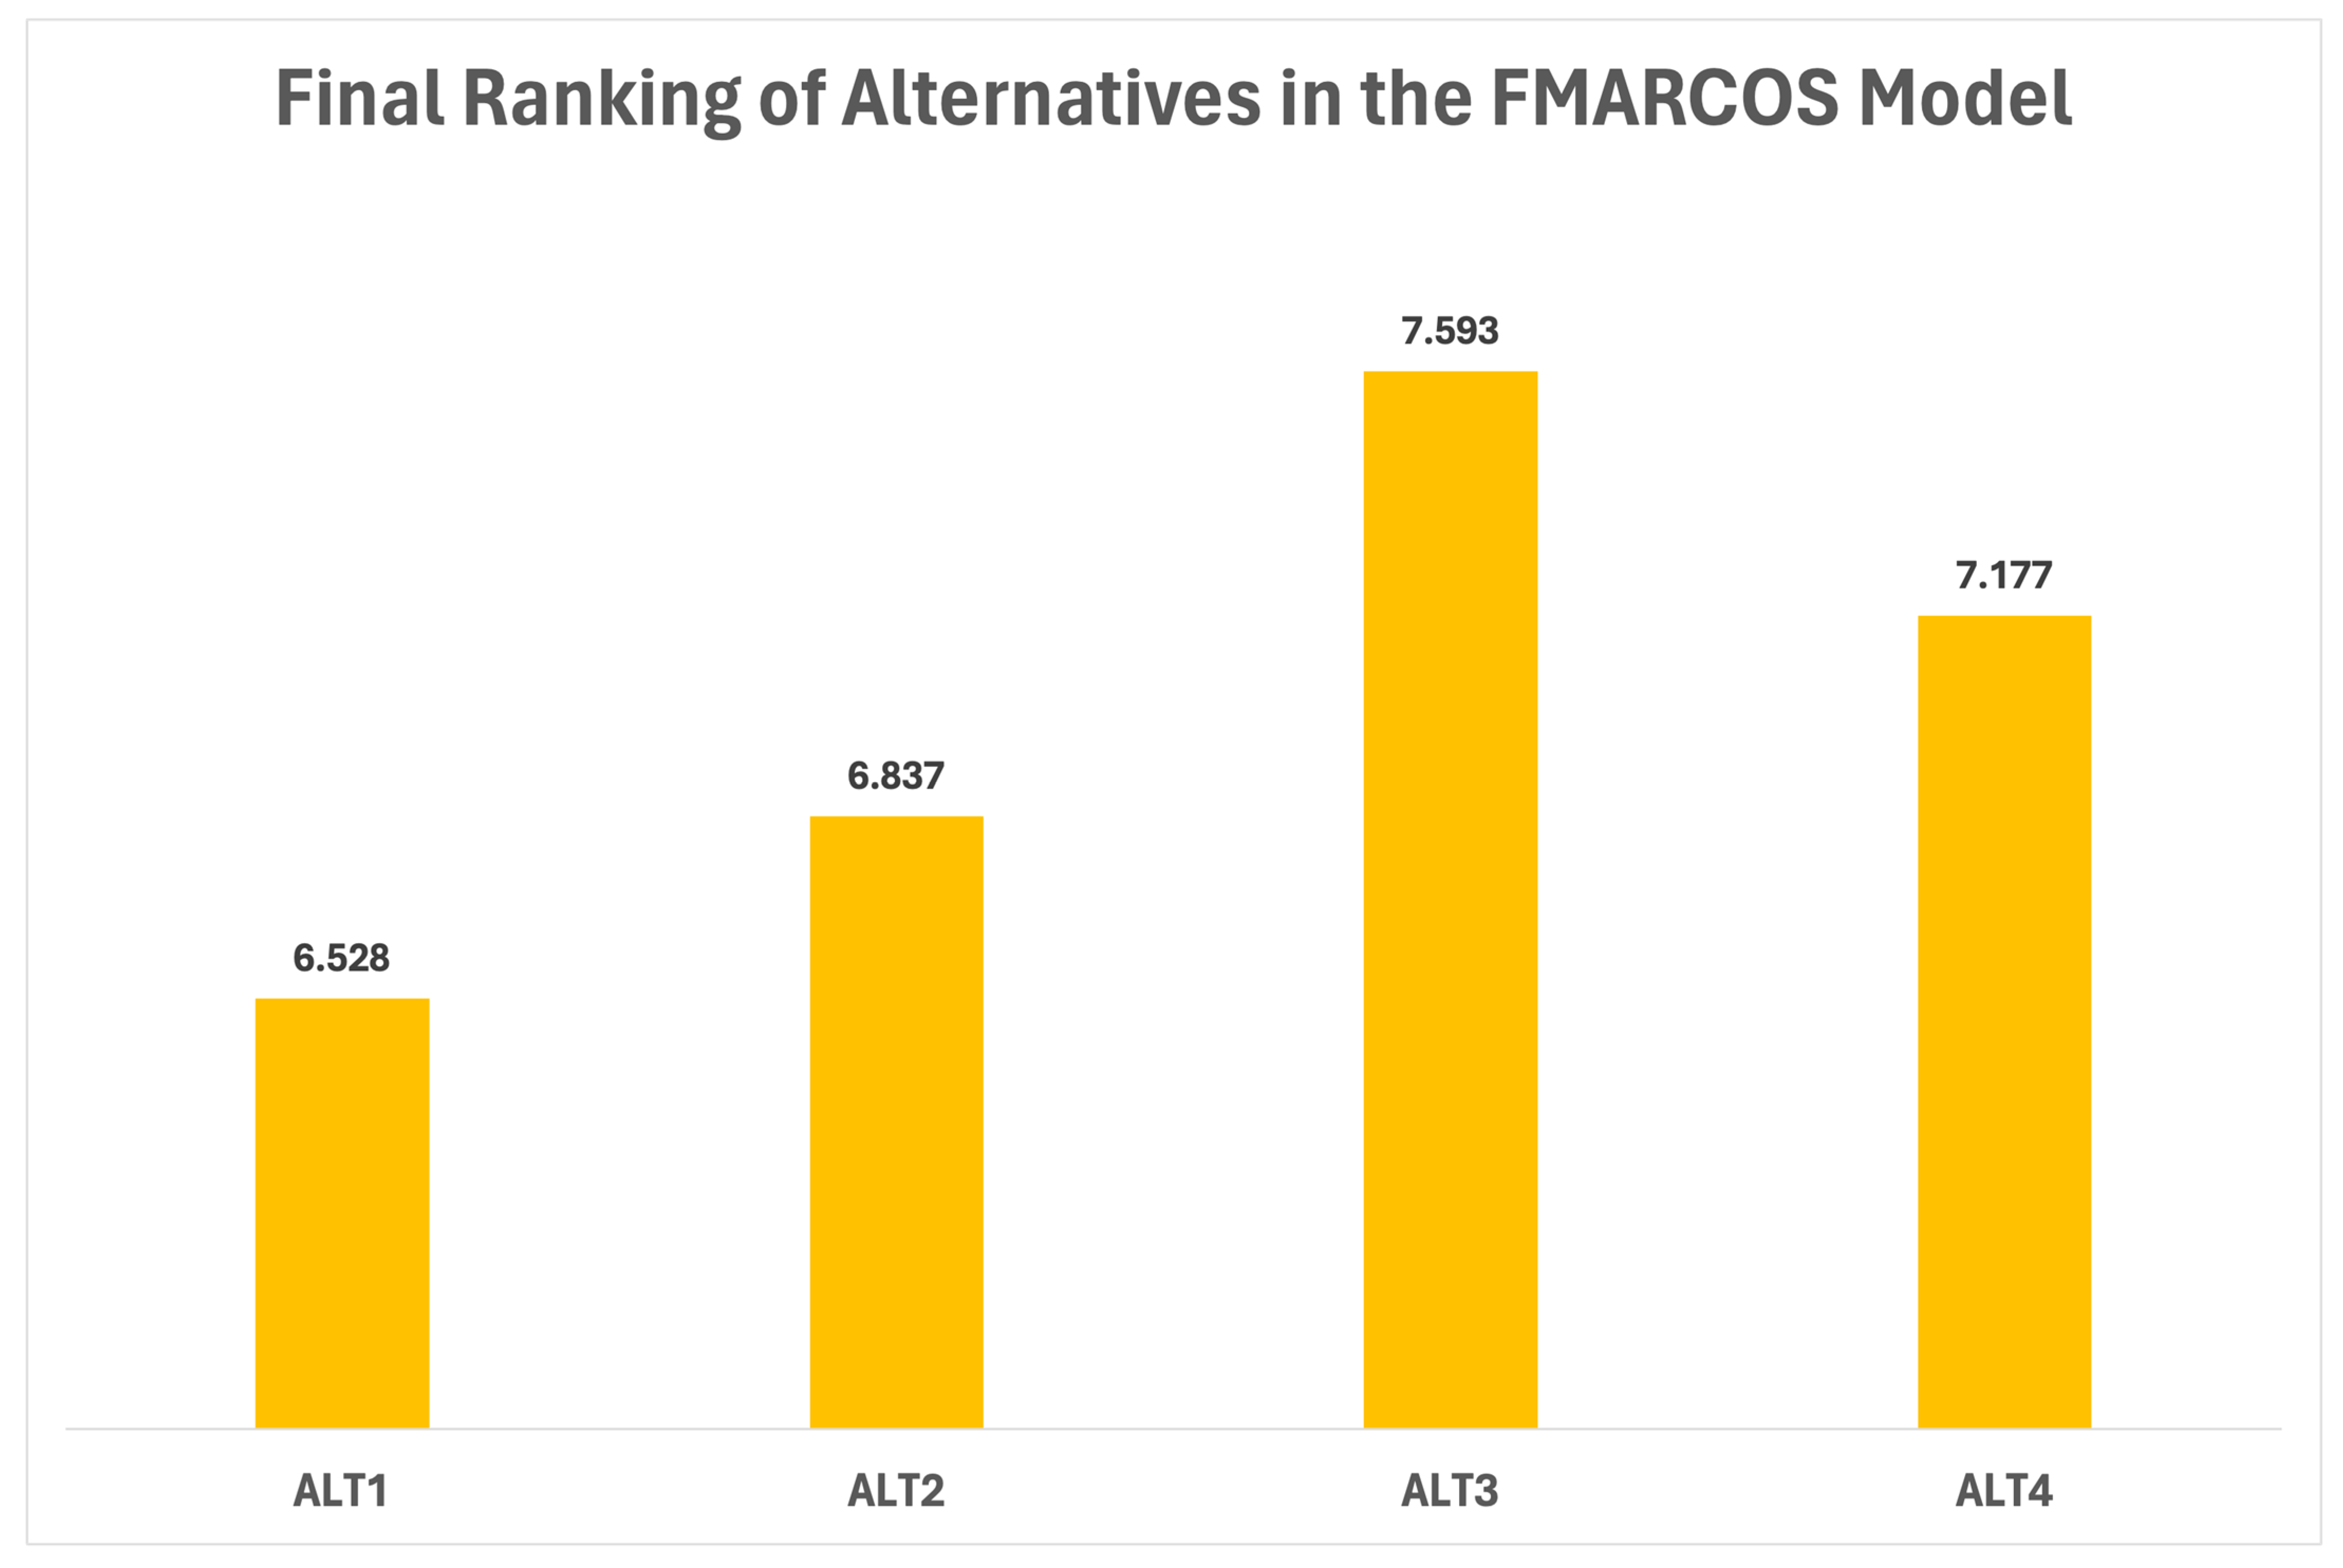
4.2.2. Fuzzy Measurement of Alternatives and Ranking According to Compromise Solution (FMARCOS)

In the FMARCOS model, the utility functions are related to the ideal f K ~ i + and anti-ideal f K ~ i solutions. The ideal and anti-ideal solutions can be calculated by applying Equations (24) and (25) as follows:
f K ~ 1 + = K ~ 1 d f c r i s p = 0.413 3.9713 ,   1.601 3.9713 ,   9.260 3.9713 = 0.104 ,   0.403 ,   2.332
f K ~ 1 = K ~ 1 + d f c r i s p = 0.289 3.9713 ,   1.000 3.9713 ,   3.460 3.9713 = 0.073 ,   0.252 ,   0.871
The values of K ~ i , K ~ i + , f K ~ i and f K ~ i + can be de-fuzzified by using the expression d f c r i s p = l + 4 m + u 6 .
Subsequently, the ranking of all alternatives was determined by the value of the final utility function ( f K i ). The final utility function value of all alternatives was calculated using Equation (26), as shown in Table 18.
The ranking result of all alternatives based on the final utility function value in the FMARCOS model is shown in Figure 6.
In Figure 6, the ranking of all alternatives based on the final utility function value ( f K i ) was as follows: “Sustainable and Quality Design Process” (ALT 3, 7.593), “Green Management and Supply Chain Sustainability” (ALT 4, 7.177), “Sustainable and Digital Printing Process” (ALT 2, 6.837), and “Eco-friendly Raw Materials and Auxiliary Materials” (ALT 1, 6.528).

5. Validation and Discussion

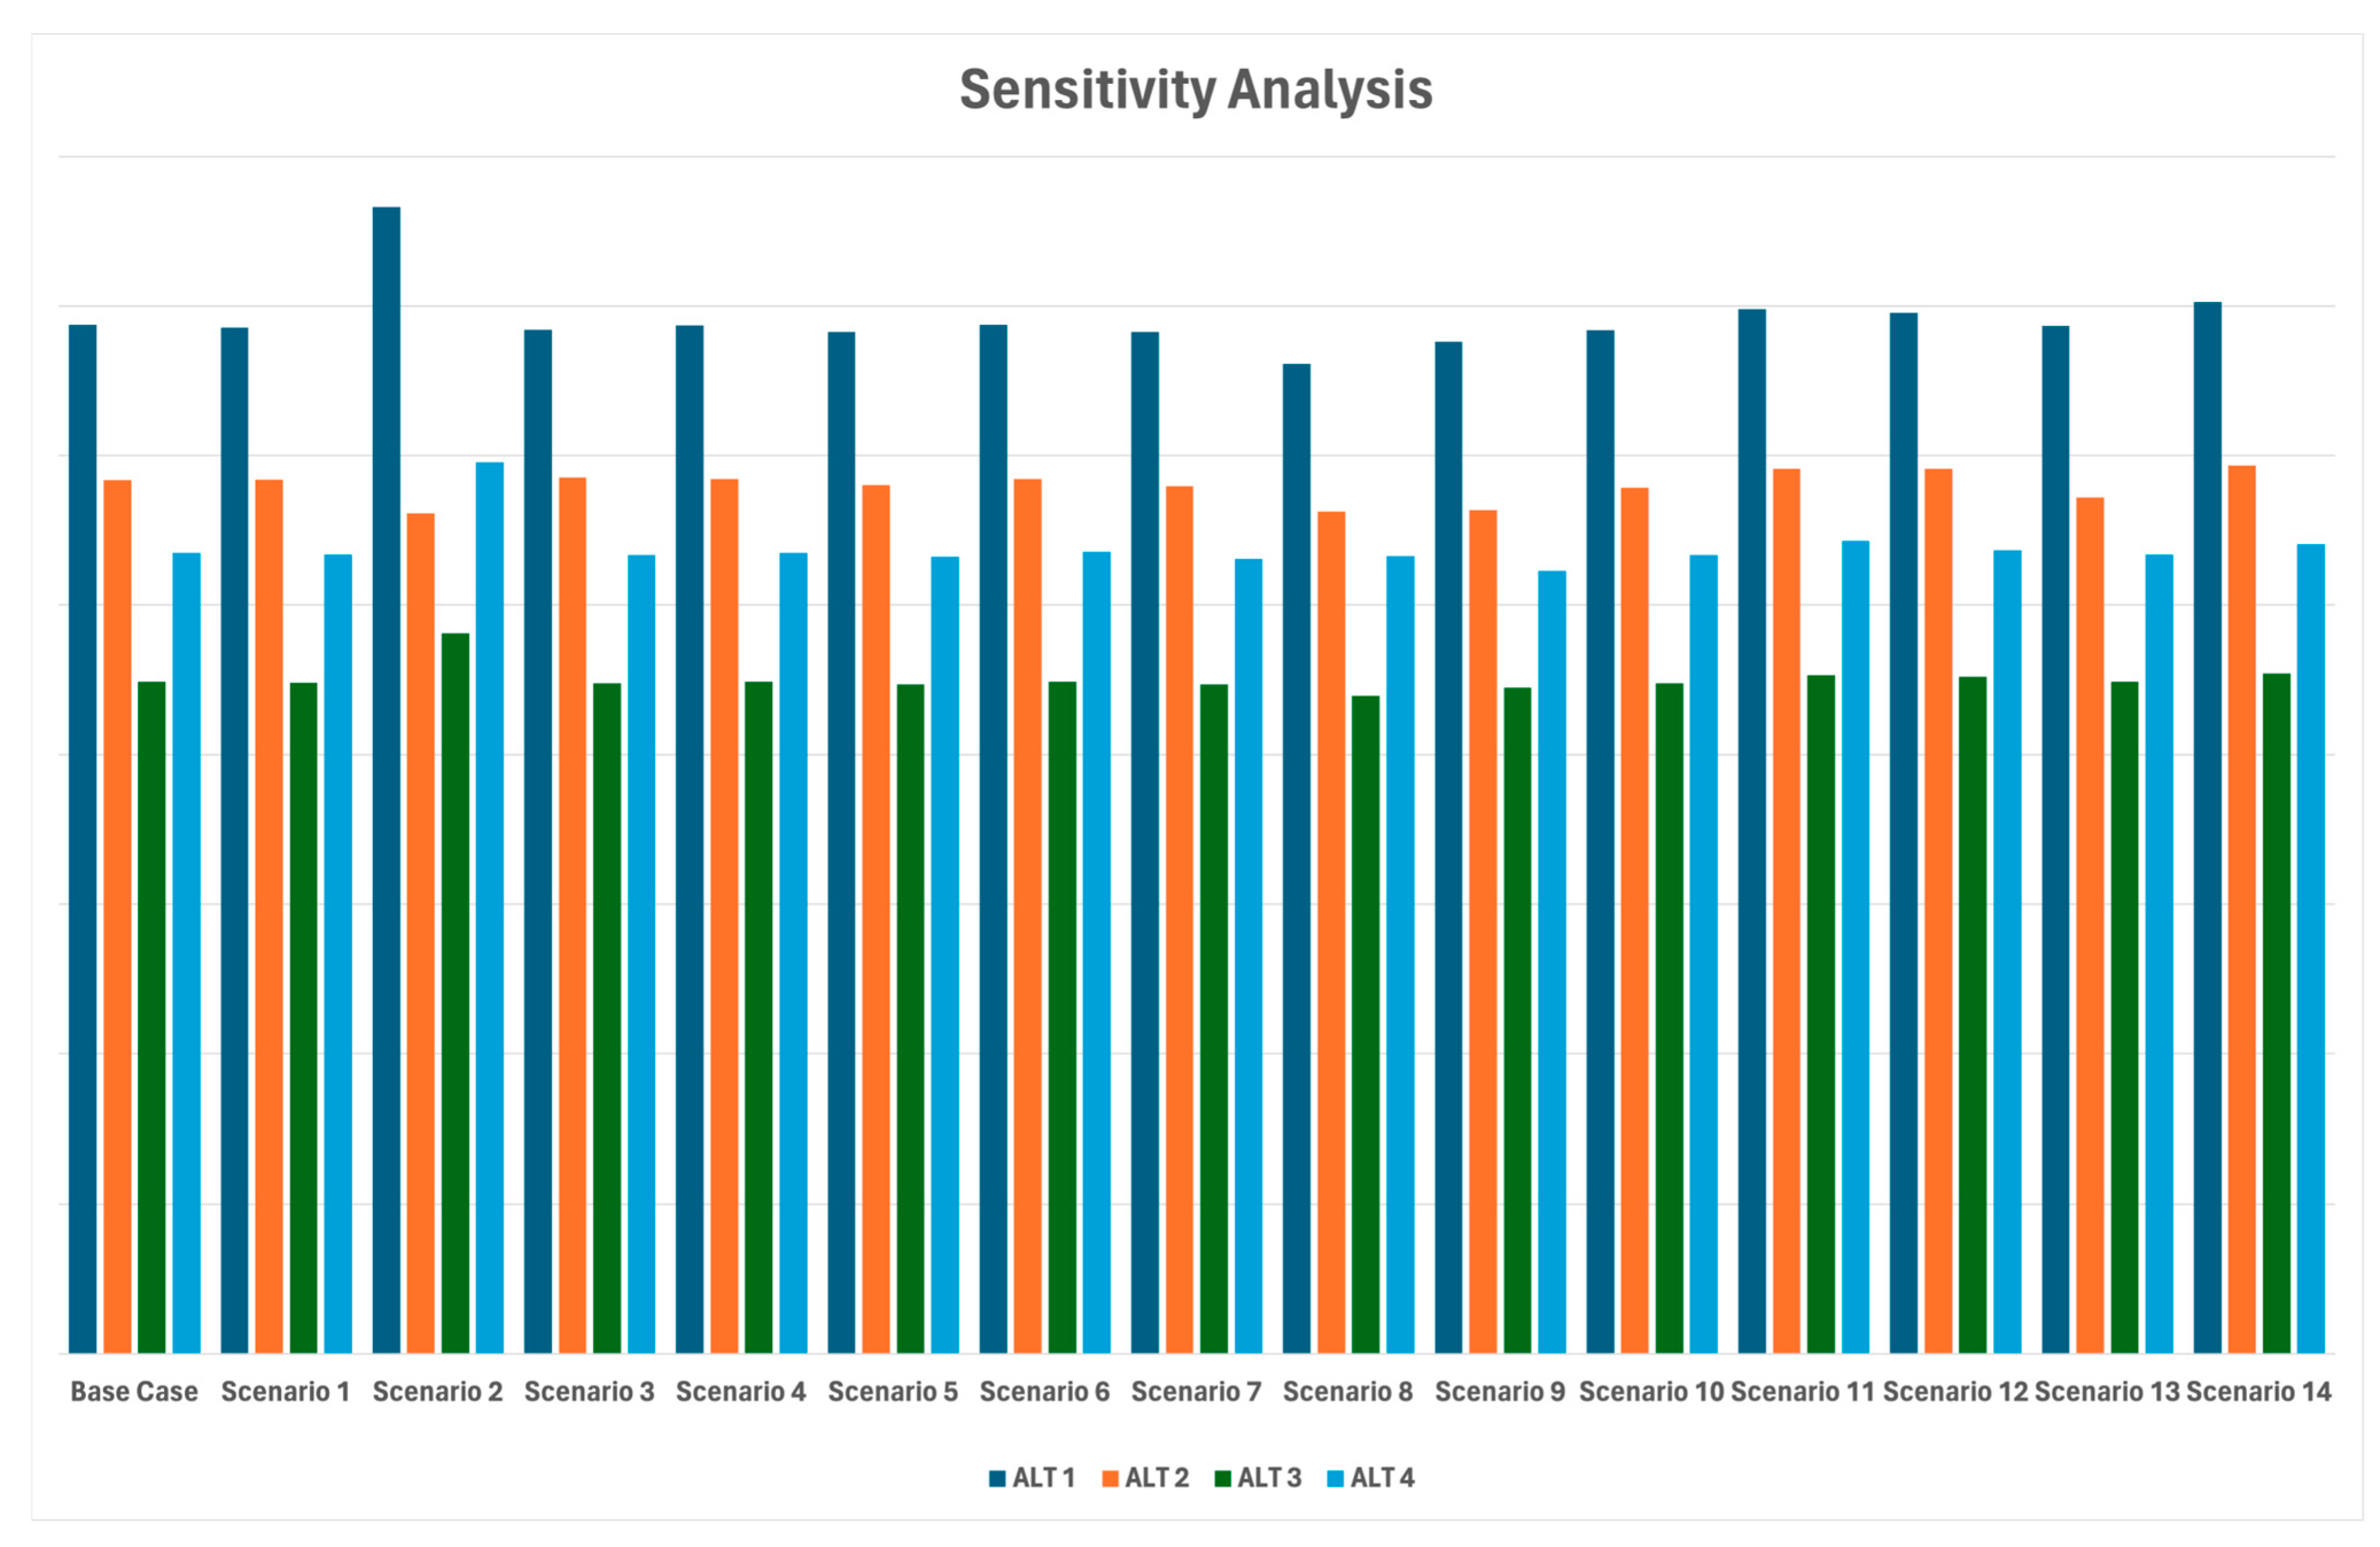
5.1. Sensitivity Analysis of Criteria Weight

In MCDM problems, the input data are often variable and subject to frequent changes, rather than being stable and consistent. As such, sensitivity analysis plays a crucial role in supporting the decision-making process. This research employs sensitivity analysis within the MCDM framework to evaluate the effect of alterations in the weight of a single criterion on the overall outcomes. These modifications include changes to the weights of other criteria and shifts in the final ranking of alternatives [84].
To conduct this analysis, each criterion is individually removed, generating 15 distinct scenarios for the sensitivity analysis of criterion weights. The weights for all criteria and the prospect values of the alternatives across these scenarios are presented in Table 19 and Table 20. The rankings are illustrated in Figure 7. Although the prospect values fluctuate, the final ranking remains largely stable, with “Eco-friendly Raw Materials and Auxiliary Materials” (ALT 1) consistently identified as the optimal choice. These findings from the sensitivity analysis highlight a resilient ranking of alternatives that is largely unaffected by variations in criterion weights. This underscores the robustness and versatility of the proposed FAHP–FMARCOS model.

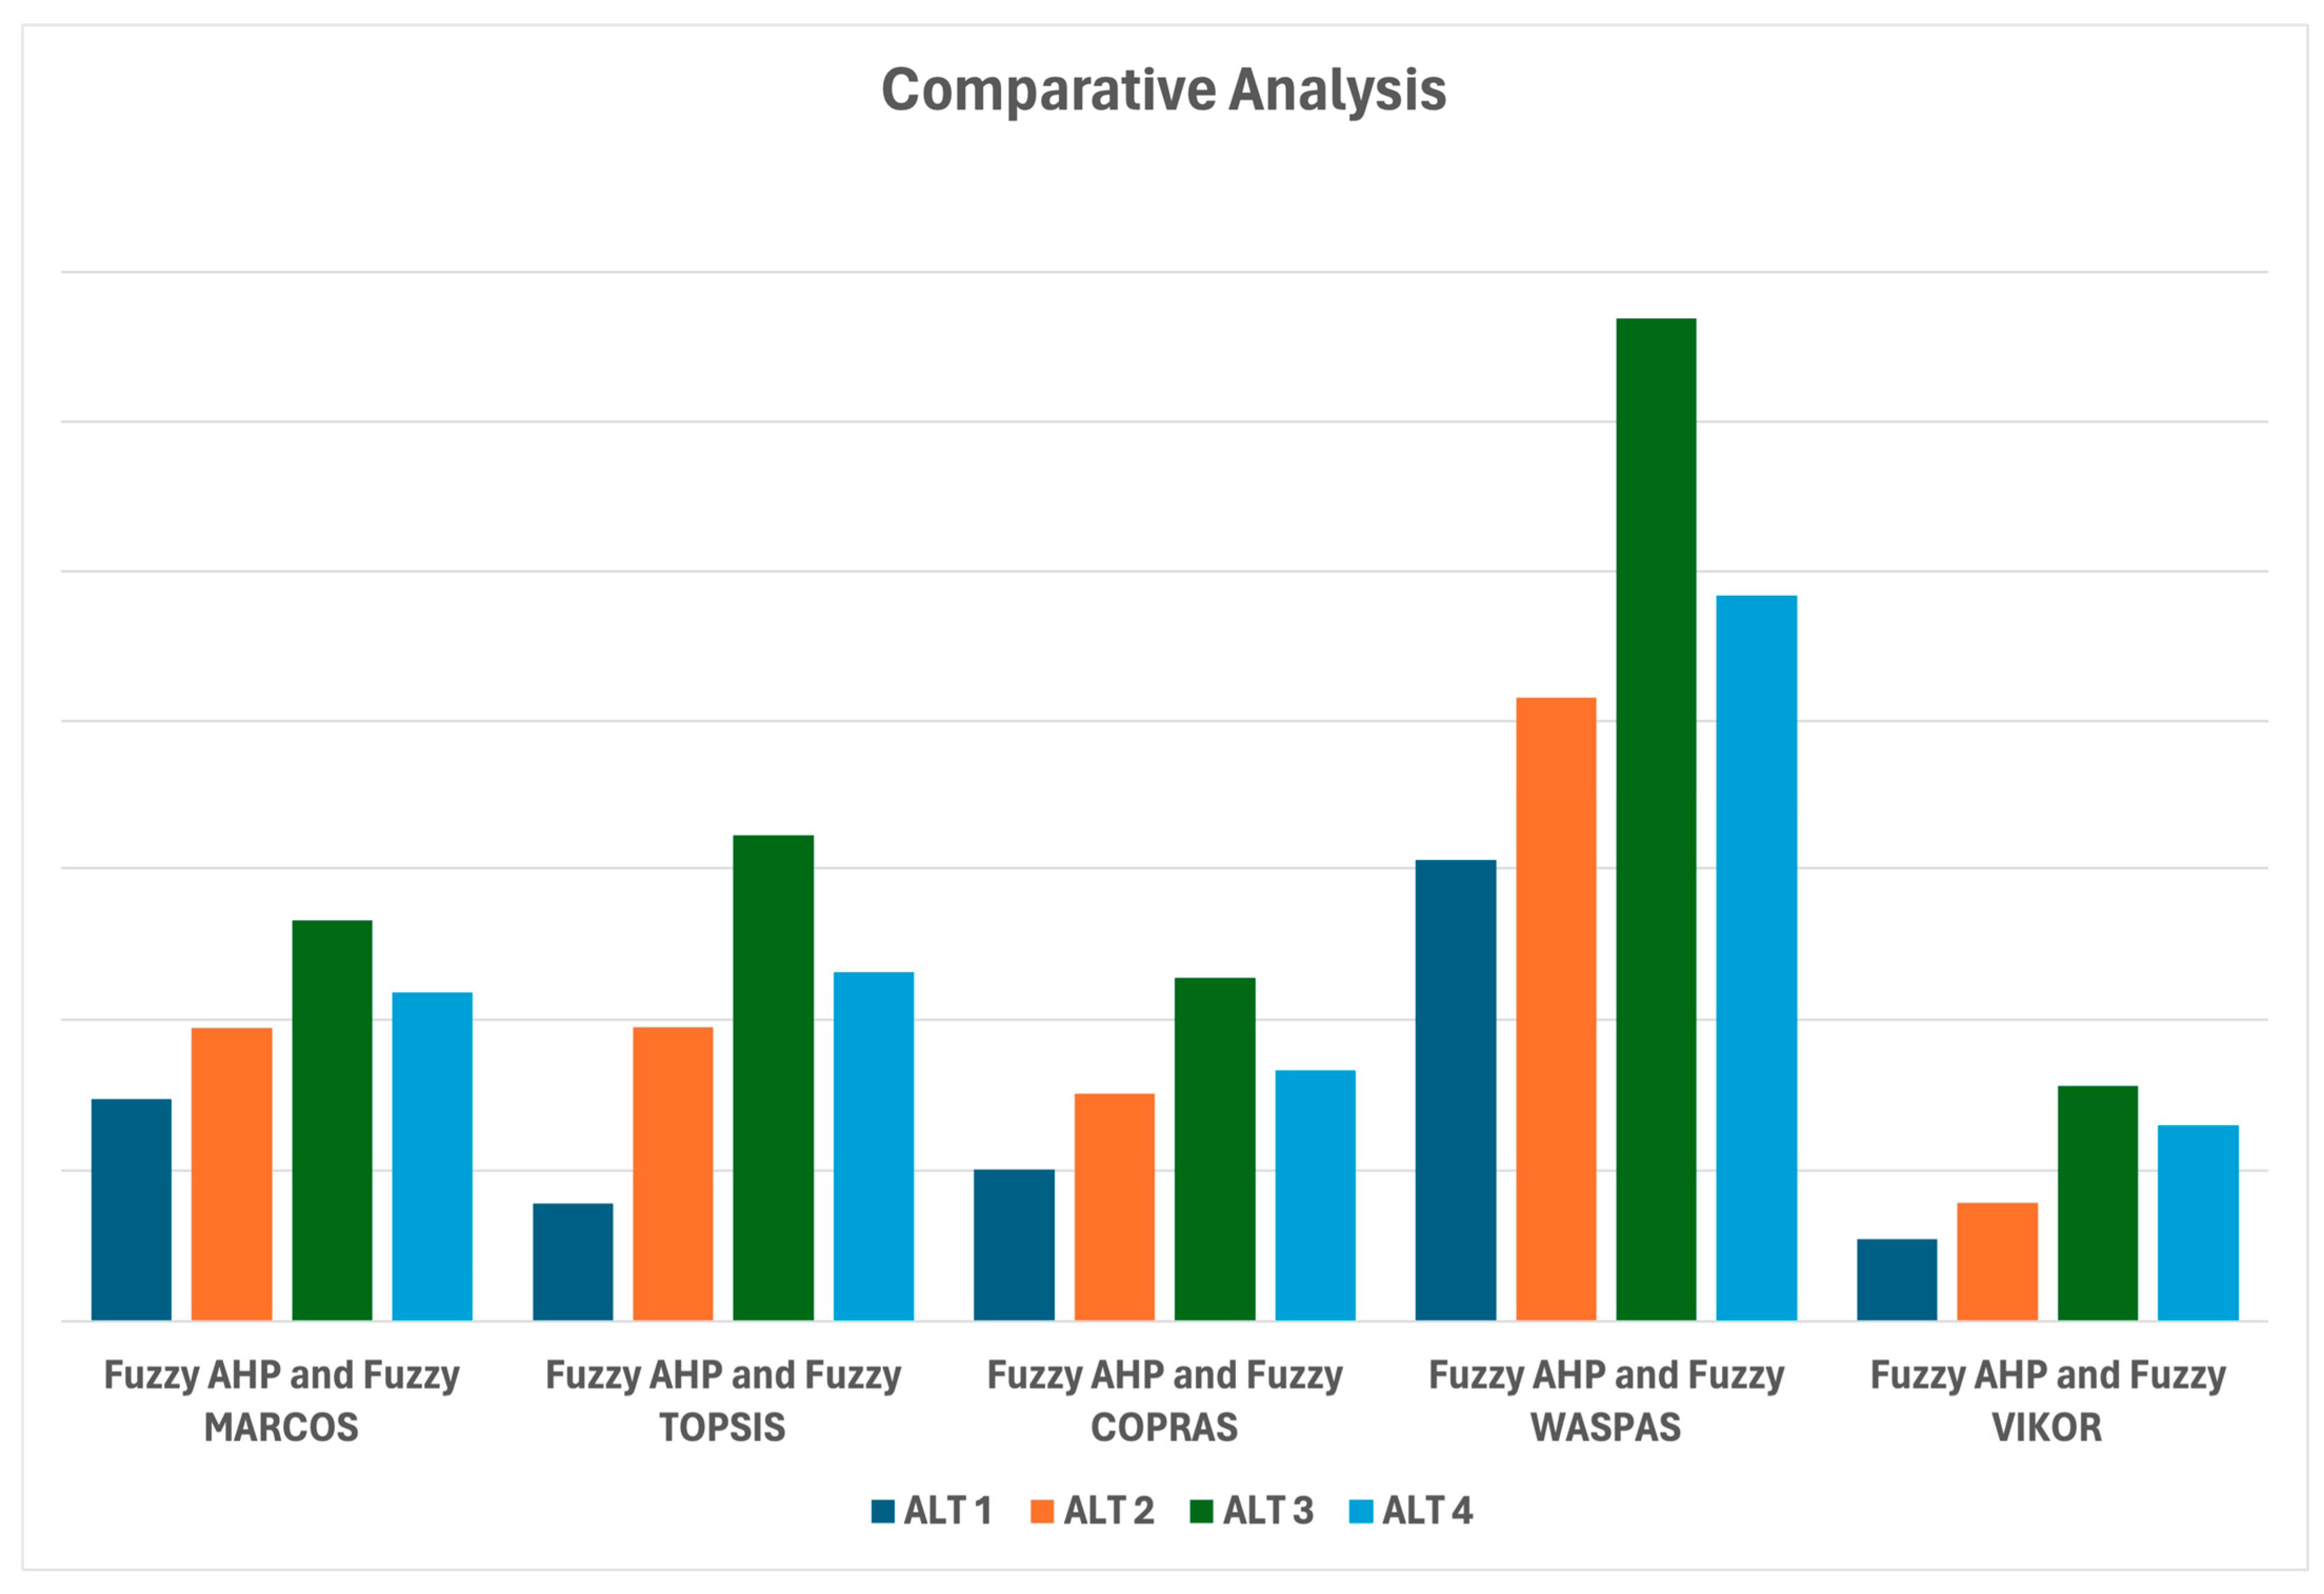
5.2. Comparative Analysis of Other Fuzzy MCDM Methods

In this phase, four distinct integrated fuzzy MCDM methods are taken into consideration to cross-verify the outcomes obtained through the proposed approach. The considered MCDM methods are the fuzzy weighted aggregated sum product assessment (fuzzy WASPAS) [85], the fuzzy complex proportional assessment of alternatives (fuzzy COPRAS) [86], the fuzzy technique for order of preference by similarity to ideal solution (fuzzy TOPSIS) [87], and the fuzzy Vlsekriterijumska Optimizacija I KOmpromisno Resenje (fuzzy VIKOR) [88].
The comparison between the FAHP and FMARCOS with other MCDM methods is illustrated in Figure 8. The results derived from different MCDM methods demonstrate that there is no notable disparity in the ranking of the top alternative (ALT 3), which consistently maintains its position as the preferred alternative. This consistent outcome across all the considered MCDM methods serves to corroborate the results obtained from the proposed model.

5.3. Implications for Research

This study introduces a hybrid MCDM approach that combines the strengths of the FAHP and FMARCOS, enhancing the overall robustness of the methodology while addressing the limitations inherent in each individual technique. By applying this integrated approach to real-world datasets, the research ensures improved objectivity and minimizes bias, offering practitioners in the graphic design sector more actionable and reliable insights for decision-making.
Additionally, the hybrid MCDM framework proposed in this study provides valuable guidance for professionals in the graphic design industry to better comprehend sustainable design factors and identify viable solutions to achieve sustainability. Practitioners can utilize the proposed priority rankings of indicators to benchmark their industry’s priorities against the ideal rankings outlined in the model.
The main criteria, including design, management, and material, emerge as the three most significant in the FAHP model. Among the sub-criteria, “Sustainable Design Concept” ranks highest, followed by “Quality Design Concept and Process” and “Supply Chain Optimization”. Therefore, professionals in the graphic design field should prioritize these key criteria to enhance the sustainability of their practices. Notably, indicators such as digital printing technology, biodegradable materials, and eco-friendly paper and ink, while ranked lower, represent secondary priorities in this study’s decision framework. Their placement should not be interpreted as diminishing their overall importance.
Furthermore, this research makes a scientific contribution by validating the efficacy of the proposed hybrid MCDM method. It demonstrates how the integration of the FAHP and FMARCOS can aid in identifying and understanding the critical design factors that contribute to the sustainability of graphic design. This study further provides a detailed analysis and evaluation of the relative priorities of sustainable design factors, which are comprehensively presented in the findings.

5.4. Implications for Management

In the graphic design sector, identifying sustainable design solutions and making informed decisions represent a significant challenge in the decision-making process. These decisions are pivotal for enabling companies to achieve their sustainability objectives. Based on the findings of this research, incorporating sustainable and high-quality design principles, optimizing environmentally friendly supply chains, and implementing sustainable printing practices can facilitate the transformation of the conventional graphic design industry. Consequently, collaboration with suppliers to develop new standards and guidelines is essential to fulfill the requirements of graphic design sustainability.
Ultimately, this transformative approach carries broader implications for management practices in associated industries. While the proposed model is specifically designed for the graphic design field, it provides insightful recommendations not only for graphic designers but also for professionals in business, management, and related domains.

5.5. Research Limitations

This study introduced a hybrid MCDM approach by integrating the FAHP and FMARCOS models. Within the FAHP model, the pairwise comparison of indicator importance, alongside the values of the consistency index (C.I.) and the consistency ratio (C.R.), was employed to ensure logical progression and consistency. Meanwhile, the FMARCOS method was utilized to analyze and determine the ranking of alternatives.
The findings of this research were derived from expert evaluations, making them dependent on professional judgment. This is the limitation of this study. To address this, the research incorporated input from experts with substantial experience, ensuring the reliability of the responses provided in the questionnaire. Furthermore, a majority of the participants were professionals actively working within the graphic design industry.
As a result, the conclusions of this study are particularly pertinent to the graphic design field, offering meaningful insights to improve alignment with customer preferences. These findings serve as an essential reference and guideline for the industry to pursue sustainability objectives that resonate with client expectations.

6. Conclusions

In this study, an integrated method of the FAHP and FMARCOS is proposed and applied to the analysis, evaluation, and selection of sustainable design factors and solutions for the graphic design industry. The FAHP method is used to analyze and calculate the criteria considered and to determine the extent to which these criteria influence the decision-making process, which is then transferred to and processed by FMARCOS for ranking all alternatives.
In addition, the development of the novel hybrid FAHP and FMARCOS model represents the primary contribution of this paper. This flexible and integrative approach significantly reduces the time and computational burden on decision-makers. The results confirm the robustness of the proposed approach, enabling stakeholders in related industries to utilize it with confidence.
Finally, the integrated operations performed in this study were logically coherent, practical, and functional. In addition to establishing a systematic and objective general model of selection in the context of this study and reflecting the characteristics of the conditions to meet practical needs, it can also serve as a reference for future studies in similar fields.

Funding

This research received no external funding.

Data Availability Statement

Data are contained within the article.

Conflicts of Interest

The author declares no conflicts of interest.

References

  1. Carson, R. Silent Spring; Houghton Mifflin Harcourt: Boston, MA, USA, 1962. [Google Scholar]
  2. Olgyay, V. Design with Climate; Princeton University Press: Princeton, NJ, USA, 1963. [Google Scholar]
  3. Papanek, V. Design for the Real World: Human Ecology and Social Change; Thames and Hudson: London, UK, 1971. [Google Scholar]
  4. McDonough, W.; Braungart, M. Cradle to Cradle: Remaking the Way We Make Things, 1st ed.; North Point Press: New York, NY, USA, 2002; ISBN 978-0-86547-587-8. [Google Scholar]
  5. Tu, J.-C. A Study of Sustainability Assessment Model for Recycling Materials from the Life Cycle Design. In Proceedings of the 1998 IEEE International Symposium on Electronics and the Environment. ISEE—1998 (Cat. No.98CH36145), Oak Brook, IL, USA, 6 May 1998; pp. 316–321. [Google Scholar]
  6. Tu, J.-C. Product Sustainable Design: Green Design in Theory and Practice; Asia-Pacific: Taipei, Taiwan, 2002; ISBN 978-986-7809-03-2. [Google Scholar]
  7. Clark, G.; Kosoris, J.; Hong, L.N.; Crul, M. Design for Sustainability: Current Trends in Sustainable Product Design and Development. Sustainability 2009, 1, 409–424. [Google Scholar] [CrossRef]
  8. Morelli, N. Active, Local, Connected: Strategic and Methodological Insights in Three Cases. Des. Issues 2011, 27, 90–110. [Google Scholar] [CrossRef]
  9. Müller, M. Design-Driven Innovation for Sustainability: A New Method for Developing a Sustainable Value Proposition. Int. J. Innov. Sci. 2012, 4, 11–24. [Google Scholar] [CrossRef]
  10. United Nations. Transforming Our World: The 2030 Agenda for Sustainable Development. Resolution Adopted by the General Assembly on 25 September 2015; United Nations: New York, NY, USA, 2015. [Google Scholar]
  11. United Nations. 17 Goals to Transform Our World. 2015. Available online: https://www.un.org/sustainabledevelopment/ (accessed on 18 May 2022).
  12. Kellert, S.; Calabrese, E. The Practice of Biophilic Design. 2015. Available online: www.biophilic-design.com (accessed on 17 February 2023).
  13. Goubran, S.; Cucuzzella, C. Integrating the Sustainable Development Goals in Building Projects. J. Sustain. Res. 2019, 1, 1–43. [Google Scholar] [CrossRef]
  14. Fan, K.-K.; Feng, T.-T. Sustainable Development Strategy of Chinese Animation Industry. Sustainability 2021, 13, 7235. [Google Scholar] [CrossRef]
  15. Li, Y. Design Visual Elements and Brand-Based Equity: Mediating Role of Green Concept. Front. Psychol. 2022, 13, 888164. [Google Scholar] [CrossRef] [PubMed]
  16. Murdoch-Kitt, K.M.; Emans, D.; Martin, K.N. Sustainability at the Forefront: Educating Students through Complex Challenges in Visual Communication and Design. Interdiscip. Environ. Rev. 2015, 16, 285–311. [Google Scholar] [CrossRef]
  17. Ji, S.; Lin, P.-S. Aesthetics of Sustainability: Research on the Design Strategies for Emotionally Durable Visual Communication Design. Sustainability 2022, 14, 4649. [Google Scholar] [CrossRef]
  18. Lin, C.-L.; Hsu, C.-Y.; Ting, C.-H. Research on the Key Influencing Goals for Visual Design Sustainability: A Dual Perspective. Sustainability 2024, 16, 1885. [Google Scholar] [CrossRef]
  19. Chang, W.-S.; Yin, M.-C. A Study on the Construction of Science Education Website Evaluation Indicators from the Perspective of Learning Strategy. Contemp. Educ. Res. Q. 2014, 22, 47–91. [Google Scholar]
  20. Gupta, S.; Gupta, S. What Drives Customers Crazy for Green Vehicles? A Fuzzy AHP Approach. Environ. Dev. Sustain. 2024, 26, 23283–23302. [Google Scholar] [CrossRef]
  21. Aminuddin, A.S.A.; Khalif, K.M.N.K.; Jamil, F.C.; Jaini, N.I. Fuzzy Analytic Hierarchy Process Using Intuitive Vectorial Centroid for Eco-Friendly Car Selection. J. Phys. Conf. Ser. 2019, 1366, 012076. [Google Scholar] [CrossRef]
  22. Wang, C.-N.; Thi-Be-Oanh-Cao; Dang, T.-T.; Nguyen, N.-A.-T. Third-Party Logistics Provider Selection in the Industry 4.0 Era by Using a Fuzzy AHP and Fuzzy MARCOS Methodology. IEEE Access 2024, 12, 67291–67313. [Google Scholar] [CrossRef]
  23. Bakır, M.; Atalık, Ö. Application of Fuzzy AHP and Fuzzy MARCOS Approach for the Evaluation of E-Service Quality in the Airline Industry. Decis. Mak. Appl. Manag. Eng. 2021, 4, 127–152. [Google Scholar] [CrossRef]
  24. Wang, J.-J.; Jing, Y.-Y.; Zhang, C.-F.; Zhao, J.-H. Review on Multi-Criteria Decision Analysis Aid in Sustainable Energy Decision-Making. Renew. Sustain. Energy Rev. 2009, 13, 2263–2278. [Google Scholar] [CrossRef]
  25. Odu, G.O. Weighting Methods for Multi-Criteria Decision Making Technique. J. Appl. Sci. Environ. Manag. 2019, 23, 1449–1457. [Google Scholar] [CrossRef]
  26. Deng, H.; Yeh, C.-H.; Willis, R.J. Inter-Company Comparison Using Modified TOPSIS with Objective Weights. Comput. Oper. Res. 2000, 27, 963–973. [Google Scholar] [CrossRef]
  27. Kumar, A.; Dhiman, P. Reliability Range Through Upgraded Operation with Trapezoidal Fuzzy Number. Fuzzy Inf. Eng. 2020, 12, 452–463. [Google Scholar] [CrossRef]
  28. Dhiman, P.; Kumar, A. A Situational Based Reliability Indices Estimation of ULT Freezer Using Preventive Maintenance under Fuzzy Environment. Int. J. Math. Eng. Manag. Sci. 2023, 8, 477–503. [Google Scholar] [CrossRef]
  29. Kumar, A.; Dhiman, P. Performance Analysis of “Injection Moulding Machine” under Fuzzy Environment through Contemporary Arithmetic Operations on Right Triangular Generalized Fuzzy Numbers (RTrGFN). J. Intell. Fuzzy Syst. 2023, 45, 4427–4445. [Google Scholar] [CrossRef]
  30. Dwiggins, W. New Kind of Printing Calls for New Design; Firefly Press: Wales, UK, 1922. [Google Scholar]
  31. Meggs, P.; Purvis, A. Meggs’ History of Graphic Design; Wiley: Chichester, UK, 1983. [Google Scholar]
  32. Eskilson, S. Graphic Design: A New History; Yale University Press: New Haven, CO, USA, 2007. [Google Scholar]
  33. Barnard, M. Graphic Design as Communication; Routledge: London, UK, 2013; ISBN 978-1-315-01538-5. [Google Scholar]
  34. Albadi, N.; Zollinger, S.W. Dominant Learning Styles of Interior Design Students in Generation Z. J. Inter. Des. 2021, 46, 49–65. [Google Scholar] [CrossRef]
  35. Martins, N.; Raposo, D. (Eds.) Communication Design and Branding: A Multidisciplinary Approach; Springer Series in Design and Innovation; Springer Nature: Cham, Switzerland, 2023; Volume 32, ISBN 978-3-031-35384-0. [Google Scholar]
  36. Szenasy, S.S. Ethics and Sustainability: Graphic Designers’ Role. In Proceedings of the Power of Design: AIGA National Design Conference, Vancouver, BC, Canada, 23–25 October 2003. [Google Scholar]
  37. Barth, C. Sustainable Graphic Design for the Print Industry. Ph.D. Thesis, California Polytechnic State University, San Luis Obispo, CA, USA, 2008. [Google Scholar]
  38. Jedlicka, W. Sustainable Graphic Design: Tools, Systems and Strategies for Innovative Print Design; John Wiley & Sons: Hoboken, NJ, USA, 2010. [Google Scholar]
  39. Fine, P.C. Sustainable Graphic Design: Principles and Practices; Bloomsbury Publishing: London, UK, 2016. [Google Scholar]
  40. Huang, H.-L. Examining the Design Policies and Taiwan’s Visual Design Industry from the Design Ladder Perspective. Ph.D. Thesis, National Cheng Kung University, Tainan, Taiwan, 2021. [Google Scholar]
  41. Bonsu, G.; Chisin, A.; Cronjé, J. Challenges to Sustainability in the Graphic Design Practices of a Developing Nation. Des. Cult. 2019, 12, 57–81. [Google Scholar] [CrossRef]
  42. Kadas, S. An Effort to Integrate Social and Environmental Awareness into Graphic Design Education. In Care, Climate, and Debt; Wilson, B.C., Ed.; Palgrave Macmillan: London, UK, 2022. [Google Scholar]
  43. Alahira, J.; Ninduwezuor-Ehiobu, N.; Olu-lawal, K.A.; Ani, E.C.; Ejibe, I. Eco-innovative graphic design practices: Leveraging fine arts to enhance sustainability in industrial design. Eng. Sci. Technol. J. 2024, 5, 783–793. [Google Scholar] [CrossRef]
  44. Saaty, T.L. The Analytic Hierarchy Process: Planning, Priority Setting, Resources Allocation; McGraw-Hill: New York, NY, USA, 1980. [Google Scholar]
  45. Tseng, H.-E.; Li, R.-K. Analytic Hierarchical Process for Design Alternative Selection. J. Des. 1998, 3, 43–54. [Google Scholar]
  46. Shahin, A.; Mahbod, M.A. Prioritization of Key Performance Indicators: An Integration of Analytical Hierarchy Process and Goal Setting. Int. J. Product. Perform. Manag. 2007, 56, 226–240. [Google Scholar] [CrossRef]
  47. Tu, J.-C.; Chang, Y.-C. Strategy of Sustainable Product Development by Applying Analytic Hierarchy Process (AHP). Kaohsiung Norm. Univ. J. 2006, 21, 139–153. [Google Scholar]
  48. Chang, D.-Y. Applications of the Extent Analysis Method on Fuzzy AHP. Eur. J. Oper. Res. 1996, 95, 649–655. [Google Scholar] [CrossRef]
  49. Hsu, Y.; Lee, C.; Kreng, V.B. The Application of Fuzzy Delphi Method and Fuzzy AHP in Lubricant Regenerative Technology Selection. Expert Syst. Appl. 2010, 37, 419–425. [Google Scholar] [CrossRef]
  50. Kaganski, S.; Majak, J.; Karjust, K. Fuzzy AHP as a Tool for Prioritization of Key Performance Indicators. Procedia CIRP 2018, 72, 1227–1232. [Google Scholar] [CrossRef]
  51. Kwong, C.K.; Bai, H. A Fuzzy AHP Approach to the Determination of Importance Weights of Customer Requirements in Quality Function Deployment. J. Intell. Manuf. 2002, 13, 367–377. [Google Scholar] [CrossRef]
  52. Lam, K.C.; Lam, M.C.K.; Wang, D. MBNQA–Oriented Self-Assessment Quality Management System for Contractors: Fuzzy AHP Approach. Constr. Manag. Econ. 2008, 26, 447–461. [Google Scholar] [CrossRef]
  53. Rehman, A.U.; Mian, S.H.; Umer, U.; Usmani, Y.S. Strategic Outcome Using Fuzzy-AHP-Based Decision Approach for Sustainable Manufacturing. Sustainability 2019, 11, 6040. [Google Scholar] [CrossRef]
  54. Larimian, T.; Zarabadi, Z.S.S.; Sadeghi, A. Developing a Fuzzy AHP Model to Evaluate Environmental Sustainability from the Perspective of Secured by Design Scheme—A Case Study. Sustain. Cities Soc. 2013, 7, 25–36. [Google Scholar] [CrossRef]
  55. Wang, C.-N.; Nguyen, V.T.; Thai, H.T.N.; Duong, D.H. Multi-Criteria Decision Making (MCDM) Approaches for Solar Power Plant Location Selection in Viet Nam. Energies 2018, 11, 1504. [Google Scholar] [CrossRef]
  56. Mostafa, M.; Hatami, N.; Espahbodi, K.; Asadi, F. Fuzzy Analytic Hierarchy Process (FAHP) Applied to Evaluating the Forest Management Approaches. J. For. Sci. 2022, 68, 263–276. [Google Scholar] [CrossRef]
  57. Alyamani, R.; Long, S. The Application of Fuzzy Analytic Hierarchy Process in Sustainable Project Selection. Sustainability 2020, 12, 8314. [Google Scholar] [CrossRef]
  58. Pan, N.F. Fuzzy AHP Approach for Selecting the Suitable Bridge Construction Method. Autom. Constr. 2008, 17, 958–965. [Google Scholar] [CrossRef]
  59. Ashour, M.; Mahdiyar, A.; Haron, S.H.; Hanafi, M.H. Barriers to the Practice of Sustainable Interior Architecture and Design for Interior Renovations: A Parsimonious-Cybernetic Fuzzy AHP Approach. J. Clean. Prod. 2022, 366, 132958. [Google Scholar] [CrossRef]
  60. Stević, Ž.; Pamučar, D.; Puška, A.; Chatterjee, P. Sustainable Supplier Selection in Healthcare Industries Using a New MCDM Method: Measurement of Alternatives and Ranking According to COmpromise Solution (MARCOS). Comput. Ind. Eng. 2020, 140, 106231. [Google Scholar] [CrossRef]
  61. El-Araby, A. The Utilization of MARCOS Method for Different Engineering Applications: A Comparative Study. Int. J. Res. Ind. Eng. 2023, 12, 155–164. [Google Scholar] [CrossRef]
  62. Badi, I.; Jibril, M.; Abubakar, M.; Bakir, M. Measuring Sustainability Performance Indicators Using FUCOM-MARCOS Methods. Oper. Res. Eng. Sci. Theory Appl. 2022, 5, 99–116. [Google Scholar] [CrossRef]
  63. Pamucar, D.; Ecer, F.; Deveci, M. Assessment of Alternative Fuel Vehicles for Sustainable Road Transportation of United States Using Integrated Fuzzy FUCOM and Neutrosophic Fuzzy MARCOS Methodology. Sci. Total Environ. 2021, 788, 147763. [Google Scholar] [CrossRef]
  64. Krishankumar, R.; Mishra, A.R.; Rani, P.; Ecer, F.; Ravichandran, K.S. Assessment of Zero-Carbon Measures for Sustainable Transportation in Smart Cities: A CRITIC-MARCOS Framework Based on Q-Rung Fuzzy Preferences. IEEE Internet Things J. 2023, 10, 18651–18662. [Google Scholar] [CrossRef]
  65. Birkocak, D.T.; Acar, E.; Bakadur, A.Ç.; Ütebay, B.; Özdağoğlu, A. An Application of the MARCOS Method Within the Framework of Sustainability to Determine the Optimum Recycled Fibre-Containing Fabric. Fibers Polym. 2023, 24, 2595–2608. [Google Scholar] [CrossRef]
  66. Morente-Molinera, J.A.; Kou, G.; Pérez, I.J.; Samuylov, K.; Selamat, A.; Herrera-Viedma, E. A Group Decision Making Support System for the Web: How to Work in Environments with a High Number of Participants and Alternatives. Appl. Soft Comput. 2018, 68, 191–201. [Google Scholar] [CrossRef]
  67. Zavadskas, E.K.; Stević, Ž.; Tanackov, I.; Prentkovskis, O. A Novel Multicriteria Approach—Rough Step-Wise Weight Assessment Ratio Analysis Method (R-SWARA) and Its Application in Logistics. Stud. Inform. Control 2018, 27, 97–106. [Google Scholar] [CrossRef]
  68. Tripathy, P.; Khambete, A.K.; Chauhan, K.A. An Innovative Approach to Assess Sustainability of Urban Mobility—Using Fuzzy MCDM Method. In Proceedings of the Innovative Research in Transportation Infrastructure; Deb, D., Balas, V.E., Dey, R., Shah, J., Eds.; Springer: Singapore, 2019; pp. 55–63. [Google Scholar]
  69. Stanković, M.; Stević, Ž.; Das, D.K.; Subotić, M.; Pamučar, D. A New Fuzzy MARCOS Method for Road Traffic Risk Analysis. Mathematics 2020, 8, 457. [Google Scholar] [CrossRef]
  70. Puška, A.; Stević, Ž.; Stojanović, I. Selection of Sustainable Suppliers Using the Fuzzy MARCOS Method. Curr. Chin. Sci. 2021, 1, 218–229. [Google Scholar] [CrossRef]
  71. Wang, Y.; Wang, W.; Wang, Z.; Deveci, M.; Roy, S.K.; Kadry, S. Selection of Sustainable Food Suppliers Using the Pythagorean Fuzzy CRITIC-MARCOS Method. Inf. Sci. 2024, 664, 120326. [Google Scholar] [CrossRef]
  72. Tuş, A.; Adalı, E.A. Green Supplier Selection Based on the Combination of Fuzzy SWARA (SWARA-F) and Fuzzy MARCOS (MARCOS-F) Methods. Gazi Univ. J. Sci. 2022, 35, 1535–1554. [Google Scholar] [CrossRef]
  73. Çakır, E.; Taş, M.A.; Ulukan, Z. Neutrosophic Fuzzy MARCOS Approach for Sustainable Hybrid Electric Vehicle Assessment. In Proceedings of the 2021 IEEE International Conference on Systems, Man, and Cybernetics (SMC), Melbourne, Australia, 17–20 October 2021; pp. 3423–3428. [Google Scholar]
  74. Wang, C.-N.; Chung, Y.-C.; Wibowo, F.D.; Dang, T.-T.; Nguyen, N.-A.-T. Sustainable Last-Mile Delivery Solution Evaluation in the Context of a Developing Country: A Novel OPA–Fuzzy MARCOS Approach. Sustainability 2023, 15, 12866. [Google Scholar] [CrossRef]
  75. Tsai, W.C.; Kung, P.T.; Wang, R.H.; Chang, Y.H.; Lee, S.Y. Applying the SERVQUAL Questionnaire to Establish Quality Indicators for Chinese Medicine. Taiwan J. Public Health 2008, 27, 309–319. [Google Scholar]
  76. Zadeh, L. Fuzzy Sets. Inf. Control 1965, 9, 338–353. [Google Scholar] [CrossRef]
  77. Sun, C.-C. A Performance Evaluation Model by Integrating Fuzzy AHP and Fuzzy TOPSIS Methods. Expert Syst. Appl. 2010, 37, 7745–7754. [Google Scholar] [CrossRef]
  78. Tseng, G.-H.; Huang, J.-J. Multiple Attribute Decision Making: Methods and Applications; CRC Press: Boca Raton, FL, USA, 2011. [Google Scholar]
  79. Gumus, A.T. Evaluation of Hazardous Waste Transportation Firms by Using a Two Step Fuzzy-AHP and TOPSIS Methodology. Expert Syst. Appl. 2009, 36, 4067–4074. [Google Scholar] [CrossRef]
  80. Wang, C.-N.; Chou, C.-C.; Dang, T.-T.; Nguyen, H.-P.; Nguyen, N.-A.-T. Integrating Triple Bottom Line in Sustainable Chemical Supplier Selection: A Compromise Decision-Making-Based Spherical Fuzzy Approach. Processes 2022, 10, 889. [Google Scholar] [CrossRef]
  81. Lin, C.-L.; Chen, J.-J.; Ma, Y.-Y. Ranking of Service Quality Solution for Blended Design Teaching Using Fuzzy ANP and TOPSIS in the Post-COVID-19 Era. Mathematics 2023, 11, 1255. [Google Scholar] [CrossRef]
  82. Chou, S.-W.; Chang, Y.-C. The Implementation Factors That Influence the ERP (Enterprise Resource Planning) Benefits. Decis. Support Syst. 2008, 46, 149–157. [Google Scholar] [CrossRef]
  83. Saaty, T.L. The Analytic Hierarchy and Analytic Network Processes for the Measurement of Intangible Criteria and for Decision-Making. Mult. Criteria Decis. Anal. State Art Surv. 2016, 363–419. [Google Scholar]
  84. Alinezhad, A.; Amini, A. Sensitivity Analysis of TOPSIS Technique: The Results of Change in the Weight of One Attribute on the Final Ranking of Alternatives. J. Optim. Ind. Eng. 2011, 7, 23–28. [Google Scholar]
  85. Agarwal, S.; Kant, R.; Shankar, R. Evaluating Solutions to Overcome Humanitarian Supply Chain Management Barriers: A Hybrid Fuzzy SWARA—Fuzzy WASPAS Approach. Int. J. Disaster Risk Reduct. 2020, 51, 101838. [Google Scholar] [CrossRef]
  86. Yazdani, M.; Alidoosti, A.; Zavadskas, E.K. Risk Analysis of Critical Infrastructures Using Fuzzy Copras. Econ. Res.-Ekon. Istraživanja 2011, 24, 27–40. [Google Scholar] [CrossRef]
  87. Wang, C.-N.; Nguyen, V.T.; Duong, D.H.; Thai, H.T.N. A Hybrid Fuzzy Analysis Network Process (FANP) and the Technique for Order of Preference by Similarity to Ideal Solution (TOPSIS) Approaches for Solid Waste to Energy Plant Location Selection in Vietnam. Appl. Sci. 2018, 8, 1100. [Google Scholar] [CrossRef]
  88. Zare, A.; Feylizadeh, M.; Mahmoudi, A.; Liu, S. Suitable Computerized Maintenance Management System Selection Using Grey Group TOPSIS and Fuzzy Group VIKOR: A Case Study. Decis. Sci. Lett. 2018, 7, 341–358. [Google Scholar] [CrossRef]
Figure 1. The process of this research.
Mathematics 12 04014 g001
Figure 2. The hierarchy structure of this research.
Mathematics 12 04014 g002
Figure 3. Fuzzy triangular numbers.
Mathematics 12 04014 g003
Figure 4. The ranking of main criteria in the FAHP model.
Mathematics 12 04014 g004
Figure 5. The ranking of sub-criteria in the FAHP model.
Mathematics 12 04014 g005
Figure 6. The ranking of all alternatives in the FMARCOS model.
Mathematics 12 04014 g006
Figure 7. The ranking of alternatives in all scenarios.
Mathematics 12 04014 g007
Figure 8. The comparison of the proposed model with other approaches.
Mathematics 12 04014 g008
Table 1. Fuzzy numbers and scales in the FAHP model.
Linguistic VariablesFuzzy NumbersTriangular Fuzzy ScaleReversed Triangular Fuzzy Scale
Equally Preferred 1 ~ 111111
Intermediate 2 ~ 1231/31/21
Moderately Preferred 3 ~ 2341/41/31/2
Intermediate 4 ~ 3451/51/41/3
Strongly Preferred 5 ~ 4561/61/51/4
Intermediate 6 ~ 5671/71/61/5
Very Strongly Preferred 7 ~ 6781/81/71/6
Intermediate 8 ~ 7891/91/81/7
Extremely Preferred 9 ~ 9991/91/91/9
Table 2. The newly defined linguistic scale of the rating system for alternatives.
Linguistic ScaleSymbolTFN
Extremely PoorEP 1 ,   1 ,   1
Very PoorVP 1 ,   1 ,   3
PoorP 1 ,   3 ,   3
Medium–PoorMP 3 ,   3 ,   5
MediumM 3 ,   5 ,   5
Medium–GoodMG 5 ,   5 ,   7
GoodG 5 ,   7 ,   7
Very GoodVG 7 ,   7 ,   9
Extremely GoodEG 7 ,   9 ,   9
Table 3. The fuzzy pairwise comparison matrix of four main criteria from the FAHP model.
DimensionsMaterial (A)Printing Process (B)Design (C)Management (D)
lmUlmulmulmu
Material (A)1111/31/21678567
Printing Process (B)123111789456
Design (C)1/81/71/61/91/81/71111/51/41/3
Management (D)1/71/61/51/61/51/4345111
Table 4. The calculation of geometric mean values.
DimensionsComputation ProcessResults
Material (A) 1 × 1 / 3 × 6 × 5 1 4 , 1 × 1 / 2 × 7 × 6 1 4 , 1 × 1 × 8 × 7 1 4 1.7782.1412.736
Printing Process (B) 1 × 1 × 7 × 4 1 4 , 2 × 1 × 8 × 5 1 4 , 3 × 1 × 9 × 6 1 4 2.3002.9913.568
Design (C) 1 / 8 × 1 / 9 × 1 × 1 / 5 1 4 , 1 / 7 × 1 / 8 × 1 × 1 / 4 1 4 , 1 / 6 × 1 / 7 × 1 × 1 / 3 1 4 0.2300.2580.298
Management (D) 1 / 7 × 1 / 6 × 3 × 1 1 4 , 1 / 6 × 1 / 5 × 4 × 1 1 4 , 1 / 5 × 1 / 4 × 5 × 1 1 4 0.5170.6040.707
Total4.8255.9947.309
Table 5. The calculation of the fuzzy weight for each main criterion.
DimensionsComputation ProcessResults
Material (A) ( 1.778 ,   2.141 ,   2.736 ) 1 7.309 ,   1 5.994 ,   1 4.825 0.2430.3570.567
Printing Process (B) ( 2.300 ,   2.991 ,   3.568 ) 1 7.309 ,   1 5.994 ,   1 4.825 0.3150.4990.739
Design (C) ( 0.230 ,   0.258 ,   0.298 ) 1 7.309 ,   1 5.994 ,   1 4.825 0.0310.0430.062
Management (D) ( 0.517 ,   0.604 ,   0.707 ) 1 7.309 ,   1 5.994 ,   1 4.825 0.0710.1010.147
Table 6. De-fuzzified weight of four main criteria.
DimensionsComputation ProcessResults
Material (A) 0.243 + 0.357 + 0.567 3 0.389
Printing Process (B) 0.315 + 0.499 + 0.739 3 0.518
Design (C) 0.031 + 0.043 + 0.062 3 0.045
Management (D) 0.071 + 0.101 + 0.147 3 0.106
Total1.058
Table 7. Normalized weight of four main criteria.
DimensionsComputation ProcessResults
Environment (A) 0.389 1.058 0.368
Society (B) 0.518 1.058 0.489
Production (C) 0.045 1.058 0.043
Management (D) 0.106 1.058 0.100
Total1.000
Table 8. Triangular fuzzy number matrix for each main criterion from the FAHP model.
DimensionsMaterialPrinting ProcessDesignManagement ω i
lmulmulmulmu
Material1111/31/216785670.368
Printing Process1231117894560.489
Design1/81/71/61/91/81/71111/51/41/30.043
Management1/71/61/51/61/51/43451110.100
Total1
λ m a x = 4.22 ,   C . I . = 0.0734 ,   C . R . = 0.0815
Table 9. Triangular fuzzy number matrix for material criteria.
DimensionsA1A2A3 ω i
lmulmulmu
A11111/31/213450.355
A21231114560.549
A31/51/41/31/61/51/41110.097
Total1
λ m a x = 3.0246 ,   C . I . = 0.0123 ,   C . R . = 0.0212
Table 10. Triangular fuzzy number matrix for printing process criteria.
DimensionsB1B2B3B4 ω i
lmulmulmulmu
B11114562341230.470
B21/61/51/41111/41/31/21/31/210.093
B31/41/31/22341111230.246
B41/31/211231/31/211110.191
Total1
λ m a x = 4.1065 ,   C . I . = 0.0355 ,   C . R . = 0.0395
Table 11. Triangular fuzzy number matrix for design criteria.
DimensionsC1C2C3 ω i
lmulmulmu
C11111/41/31/21/71/61/50.094
C22341111/51/41/30.220
C35673451110.686
Total1
λ m a x = 3.0536 ,   C . I . = 0.0268 ,   C . R . = 0.0462
Table 12. Triangular fuzzy number matrix for management criteria.
DimensionsD1D2D3D4 ω i
lmulmulmulmu
D11111/31/213451/31/210.240
D21231112341110.334
D31/51/41/31/41/31/21111/41/31/20.093
D41231112341110.334
Total1
λ m a x = 4.1218 ,   C . I . = 0.0406 ,   C . R . = 0.0451
Table 13. The overall weight of all sub-criteria in the FAHP model.
IndicatorsDescriptionFuzzy Weight ( w ~ i )
A1Recycling Material0.2100.3330.588
A2Decomposition Material0.3330.5700.901
A3Prohibited and Restricted Material0.0680.0970.150
B1Eco-Friendly Ink0.2630.4880.846
B2Green Printing Equipment and Process0.0540.0890.173
B3Recyclable or Environmentally Certified Paper0.1320.2480.455
B4Digital Printing Technology0.0900.1750.382
C1Sustainable Design Concept0.0680.0910.131
C2Quality Design Concept and Process0.1520.2180.312
C3Design Process Optimization0.5100.6910.926
D1Energy-saving Equipment0.1320.2200.431
D2Waste Management0.2070.3450.536
D3Supply Chain Optimization0.0580.0900.155
D4Cost Management0.2070.3450.536
Table 14. The extended fuzzy matrix of the FMARCOS model.
Sub-CriteriaALT 1ALT 2ALT 3ALT 4
lmulmUlmulmu
A1577133113335
A2557355133133
A3799335133355
B1799133133335
B2779355113335
B3779335133133
B4577355111355
C1557335113133
C2557355113335
C3799577133355
D1779557335355
D2779355335577
D3779577133355
D4355355335557
Table 15. The normalized fuzzy matrix of the FMARCOS model.
Sub-CriteriaALT 1ALT 2ALT 3ALT 4
lmulmulmulmu
A10.5560.7780.7780.1430.4290.4290.2000.2000.6000.4290.4290.714
A20.5560.5560.7780.4290.7140.7140.2000.6000.6000.1430.4290.429
A30.7781.0001.0000.4290.4290.7140.2000.6000.6000.4290.7140.714
B10.7781.0001.0000.1430.4290.4290.2000.6000.6000.4290.4290.714
B20.7780.7781.0000.4290.7140.7140.2000.2000.6000.4290.4290.714
B30.7780.7781.0000.4290.4290.7140.2000.6000.6000.1430.4290.429
B40.5560.7780.7780.4290.7140.7140.2000.2000.2000.4290.7140.714
C10.5560.5560.7780.4290.4290.7140.2000.2000.6000.1430.4290.429
C20.5560.5560.7780.4290.7140.7140.2000.2000.6000.4290.4290.714
C30.7781.0001.0000.7141.0001.0000.2000.6000.6000.4290.7140.714
D10.7780.7781.0000.7140.7141.0000.6000.6001.0000.4290.7140.714
D20.7780.7781.0000.4290.7140.7140.6000.6001.0000.7141.0001.000
D30.7780.7781.0000.7141.0001.0000.2000.6000.6000.4290.7140.714
D40.3330.5560.5560.4290.7140.7140.6000.6001.0000.7140.7141.000
Table 16. The weighted normalized fuzzy matrix of the FMARCOS model.
Sub-CriteriaALT 1ALT 2ALT 3ALT 4
lmulmulmuLmu
A10.1170.2590.4570.0300.1430.2520.0420.0670.3530.0900.1430.420
A20.1850.3160.7010.1430.4070.6430.0670.3420.5410.0480.2440.386
A30.0530.0970.1500.0290.0420.1070.0140.0580.0900.0290.0700.107
B10.2050.4880.8460.0380.2090.3630.0530.2930.5080.1130.2090.604
B20.0420.0690.1730.0230.0640.1230.0110.0180.1040.0230.0380.123
B30.1020.1930.4550.0560.1060.3250.0260.1490.2730.0190.1060.195
B40.0500.1360.2970.0390.1250.2730.0180.0350.0760.0390.1250.273
C10.0380.0510.1020.0290.0390.0940.0140.0180.0790.0100.0390.056
C20.0850.1210.2420.0650.1550.2230.0300.0440.1870.0650.0930.223
C30.3970.6910.9260.3640.6910.9260.1020.4150.5560.2190.4940.661
D10.1030.1710.4310.0940.1570.4310.0790.1320.4310.0570.1570.308
D20.1610.2680.5360.0890.2460.3830.1240.2070.5360.1480.3450.536
D30.0450.0700.1550.0420.0900.1550.0120.0540.0930.0250.0640.111
D40.0690.1920.2980.0890.2460.3830.1240.2070.5360.1480.2460.536
Table 17. The calculation results of utility degrees and the fuzzy matrix of T ~ i .
Alternatives S ~ i K ~ i K ~ i + T ~ i
lmuLmulmulmu
ALT11.5812.9315.4700.4131.6019.2600.2891.0003.4600.7022.60112.720
ALT21.0402.4754.2970.2721.3527.2730.1900.8442.7180.4622.1969.992
ALT30.5911.8313.8240.1541.0006.4740.1080.6242.4190.2621.6248.893
ALT40.8822.1284.0030.2311.1626.7760.1610.7262.5320.3921.8889.308
Table 18. The final utility function value of all alternatives.
AlternativesUtility Degrees
f K ~ i f K ~ i + K i K i + f K i f K i + f K i
ALT 1 0.073 ,   0.252 ,   0.871 0.104 ,   0.403 ,   2.332 2.6801.2920.6750.3256.528
ALT 2 0.048 ,   0.213 ,   0.684 0.069 ,   0.340 ,   1.832 2.1591.0480.5440.2646.837
ALT 3 0.027 ,   0.157 ,   0.609 0.039 ,   0.252 ,   1.630 1.7710.8380.4460.2117.593
ALT 4 0.041 ,   0.183 ,   0.638 0.058 ,   0.293 ,   1.706 1.9430.9330.4890.2357.177
Table 19. The criteria weights in all scenarios.
Sub-CriteriaScenarios
Base1234567891011121314
A10.01450.00000.01510.01810.01490.01630.01520.01550.04270.02640.01830.01850.01750.02430.0166
A20.00850.00950.00000.01210.00880.01030.00920.00940.03670.02030.01220.01250.01150.01830.0106
A30.04970.05080.05030.00000.05000.05150.05040.05060.07790.06160.05340.05370.05270.05950.0518
B10.00470.00570.00530.00820.00000.00640.00530.00560.03280.01650.00840.00860.00760.01440.0068
B20.02470.02570.02530.02820.02500.00000.02530.02560.05290.03650.02840.02860.02760.03440.0268
B30.00920.01030.00980.01280.00950.01100.00000.01010.03740.02110.01290.01320.01220.01900.0113
B40.01290.01390.01350.01640.01320.01470.01360.00000.04110.02470.01660.01680.01590.02260.0150
C10.39480.39580.39540.39830.39510.39650.39540.39570.00000.40660.39850.39870.39770.40450.3969
C20.16580.16680.16640.16930.16610.16760.16640.16670.19400.00000.16950.16970.16880.17550.1679
C30.05220.05330.05280.05580.05260.05400.05290.05310.08040.06410.00000.05620.05520.06200.0543
D10.05540.05640.05600.05890.05570.05710.05600.05630.08360.06720.05910.00000.05840.06510.0575
D20.04160.04260.04220.04510.04190.04330.04220.04250.06970.05340.04530.04550.00000.05130.0437
D30.13660.13760.13720.14010.13690.13830.13720.13750.16480.14840.14030.14050.13950.00000.1387
D40.02950.03060.03010.03310.02990.03130.03020.03040.05770.04140.03330.03350.03250.03930.0000
Table 20. The prospect value of alternatives in all scenarios.
AlternativesScenarios
Base1234567891011121314
ALT 16.87386.85767.66316.84006.87066.82596.87346.82796.61096.76196.83836.97986.95286.86767.0282
ALT 25.83715.83975.61235.85435.84085.80125.84325.79595.62445.63545.78505.91025.91285.71995.9321
ALT 34.48864.48234.81214.47614.48744.47014.48864.47074.39304.44754.47554.53194.52084.48874.5427
ALT 45.34865.33725.95455.33425.34935.32265.35725.30765.32575.22705.33355.42955.36645.33855.4069
Disclaimer/Publisher’s Note: The statements, opinions and data contained in all publications are solely those of the individual author(s) and contributor(s) and not of MDPI and/or the editor(s). MDPI and/or the editor(s) disclaim responsibility for any injury to people or property resulting from any ideas, methods, instructions or products referred to in the content.

