Author Contributions
Conceptualization, Y.C., S.S. and Z.L. (Zhibin Li); methodology, Y.C.; software, Z.H.; validation, Y.C., Z.H. and S.S.; formal analysis, Y.C.; investigation, Z.H.; resources, Z.L. (Zhijie Li); data curation, S.S. and Z.H.; writing—original draft preparation, Z.H., Y.C. and Z.L. (Zhijie Li); writing—review and editing, S.S. and Z.L. (Zhijie Li); visualization, Z.H.; supervision, S.S. and Z.L. (Zhibin Li); project administration, S.S.; funding acquisition, S.S. and Z.L. (Zhibin Li). All authors have read and agreed to the published version of the manuscript.
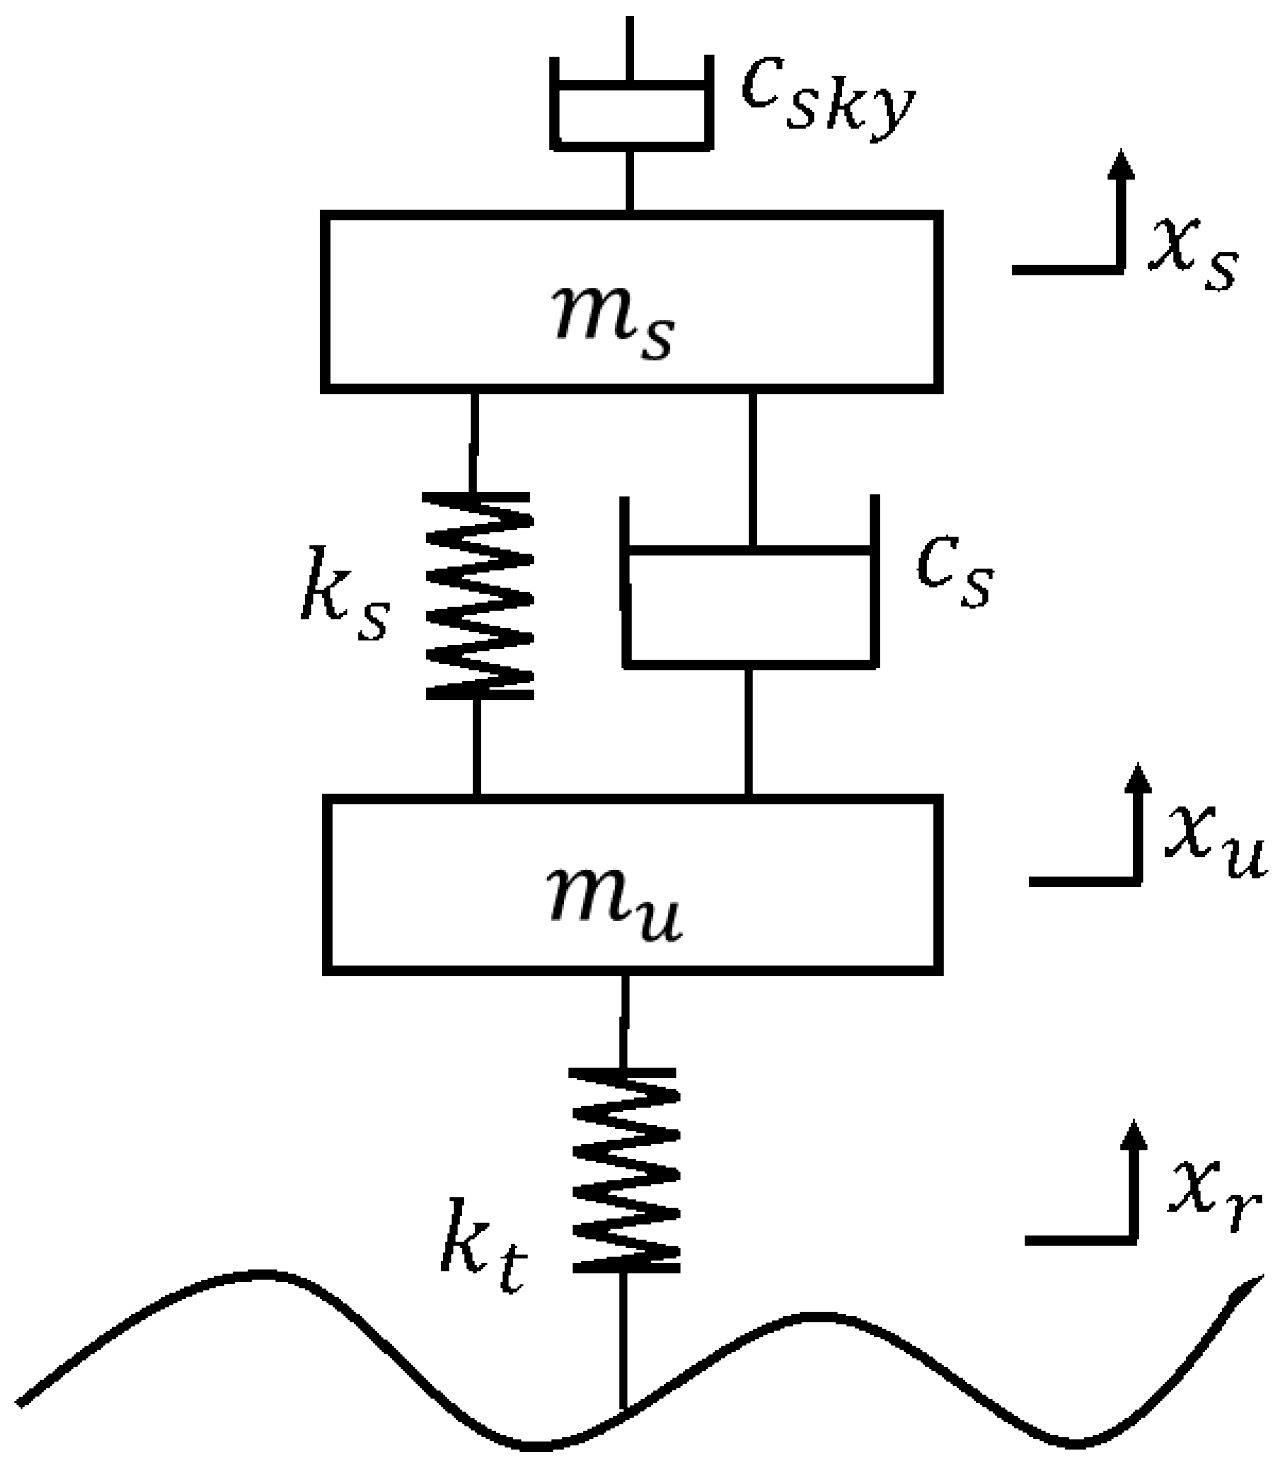
Figure 1.
Control quarter suspension model.
Figure 1.
Control quarter suspension model.
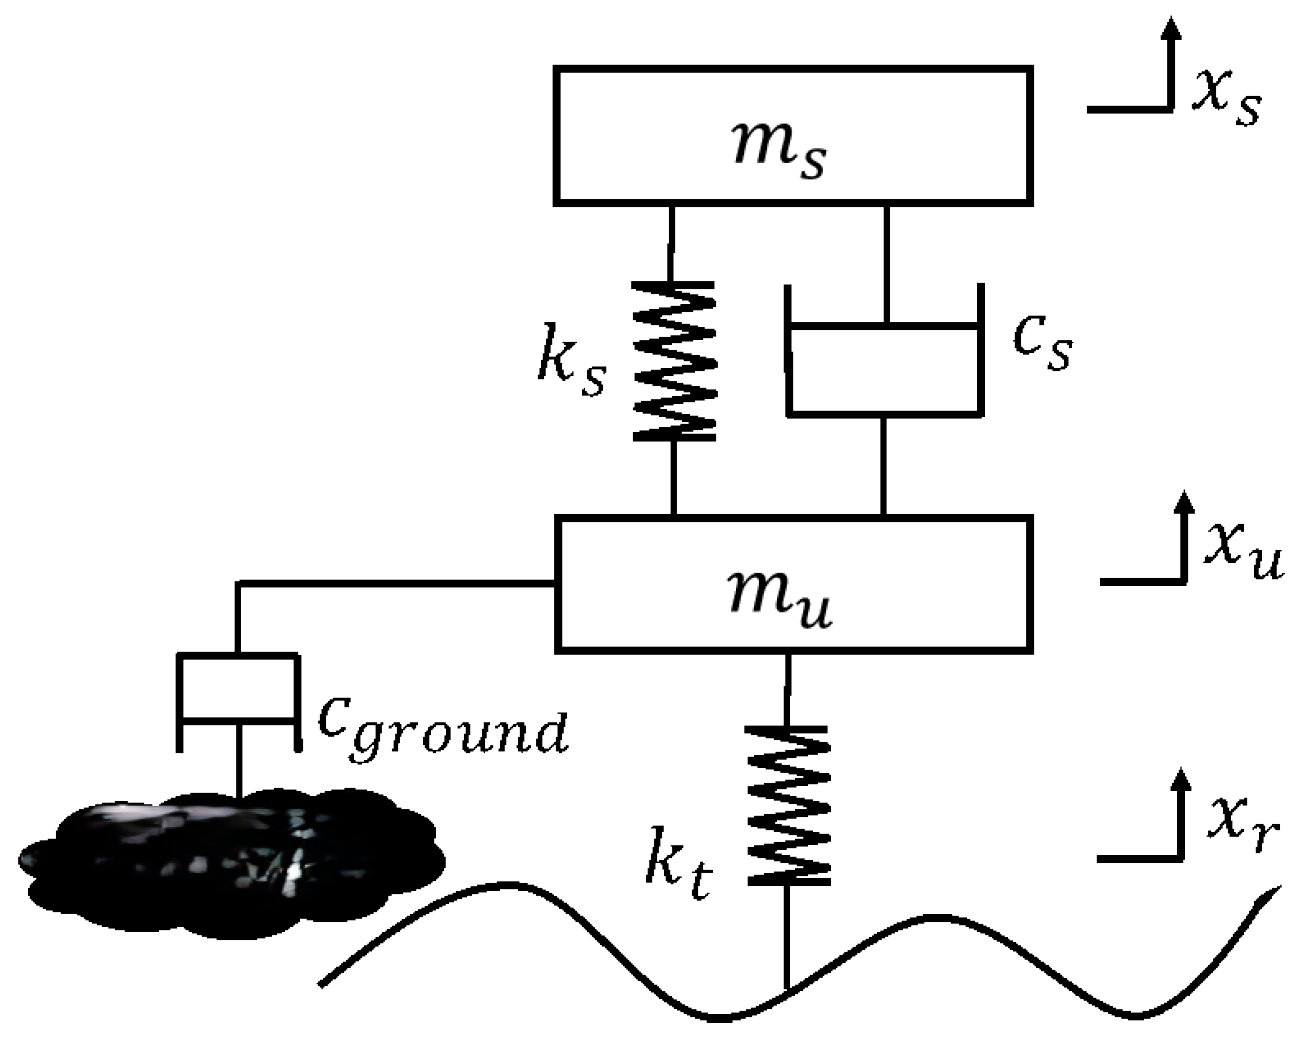
Figure 2.
Ideal floor shed suspension model.
Figure 2.
Ideal floor shed suspension model.
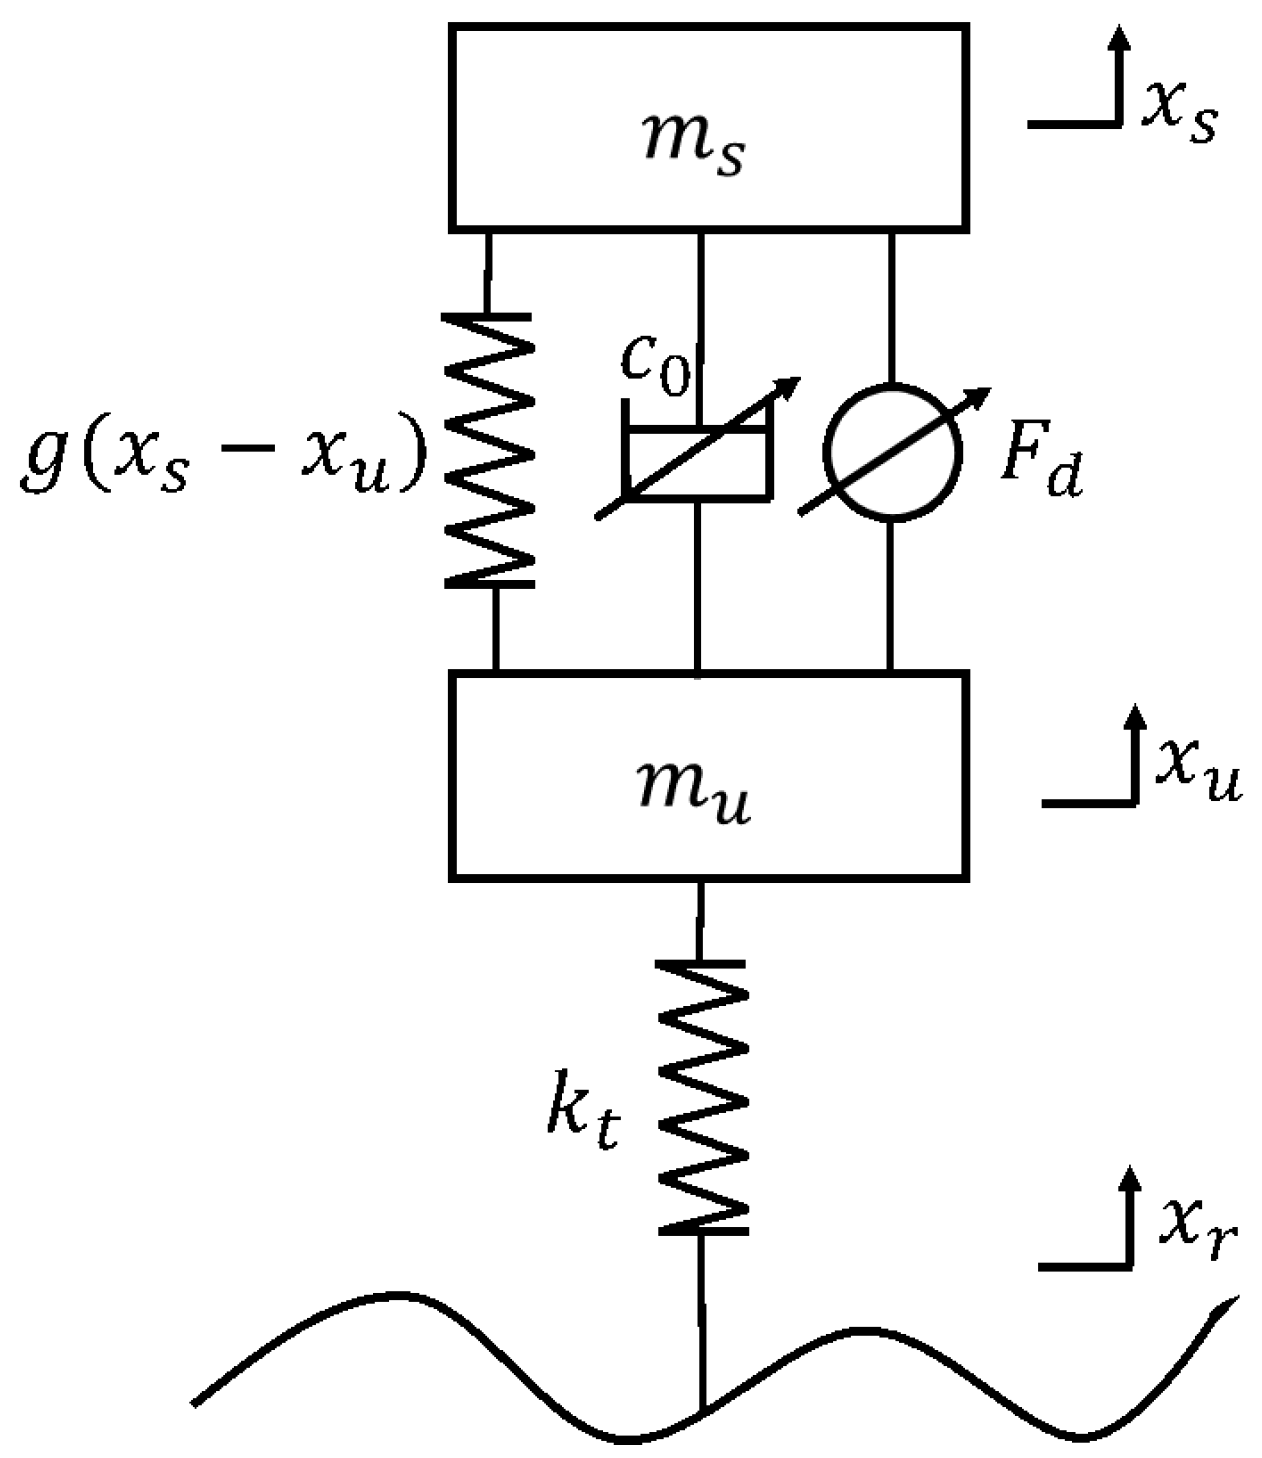
Figure 3.
Improved sky and groundhook negative stiffness semi-active suspension.
Figure 3.
Improved sky and groundhook negative stiffness semi-active suspension.
Figure 4.
Stiffness variation curve.
Figure 4.
Stiffness variation curve.
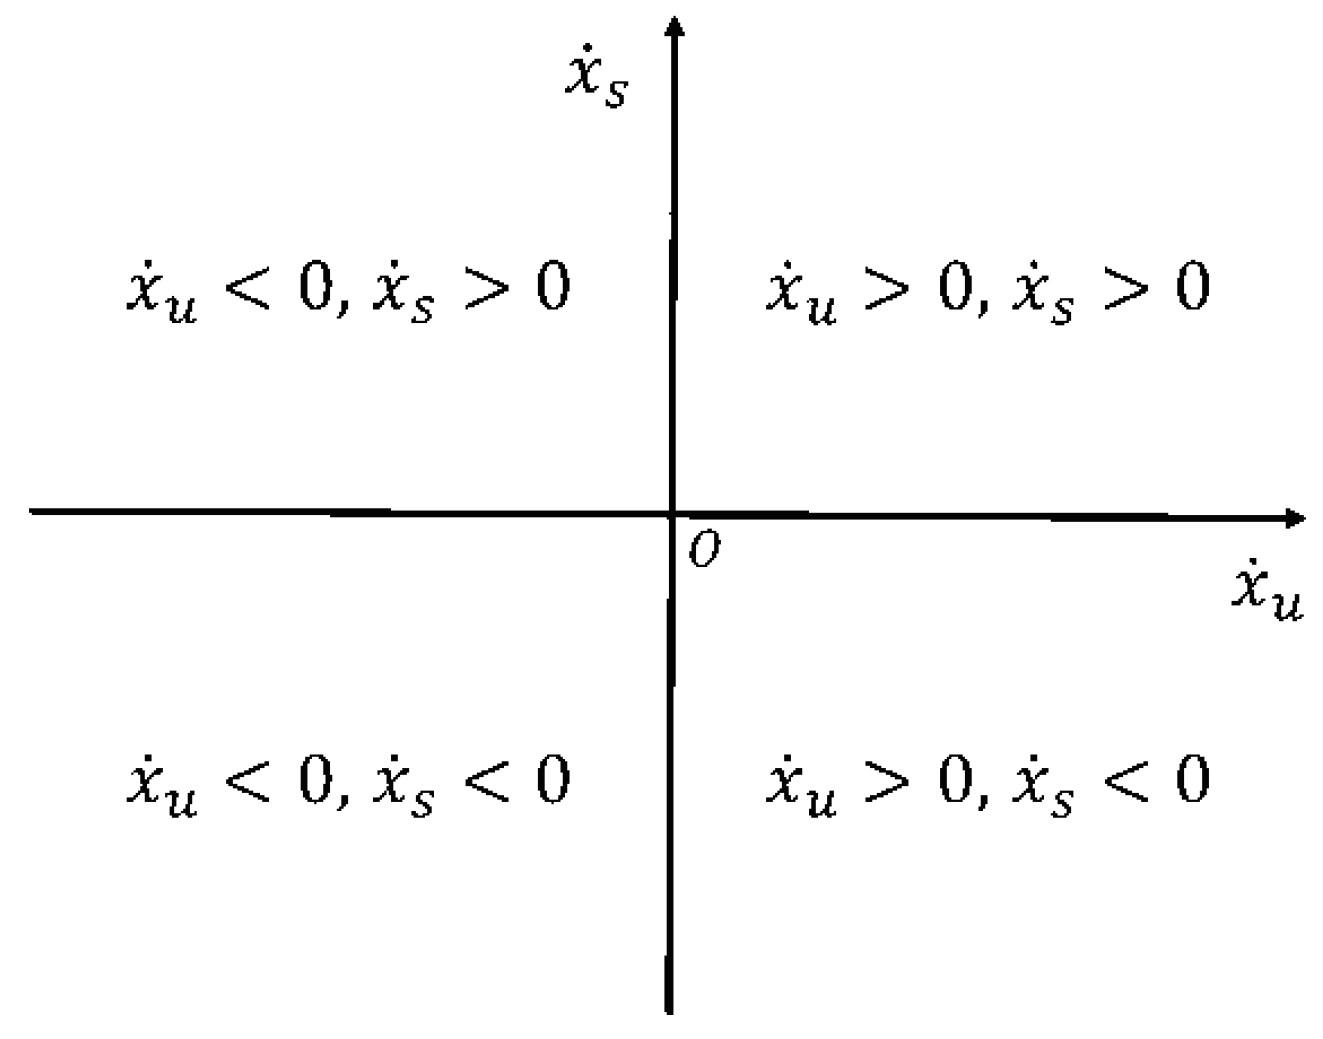
Figure 5.
Body and wheel vertical velocity relationship.
Figure 5.
Body and wheel vertical velocity relationship.
Figure 6.
Schematic diagram of body and wheel vertical velocity. It illustrates four distinct types of relative relationships (a–d).
Figure 6.
Schematic diagram of body and wheel vertical velocity. It illustrates four distinct types of relative relationships (a–d).
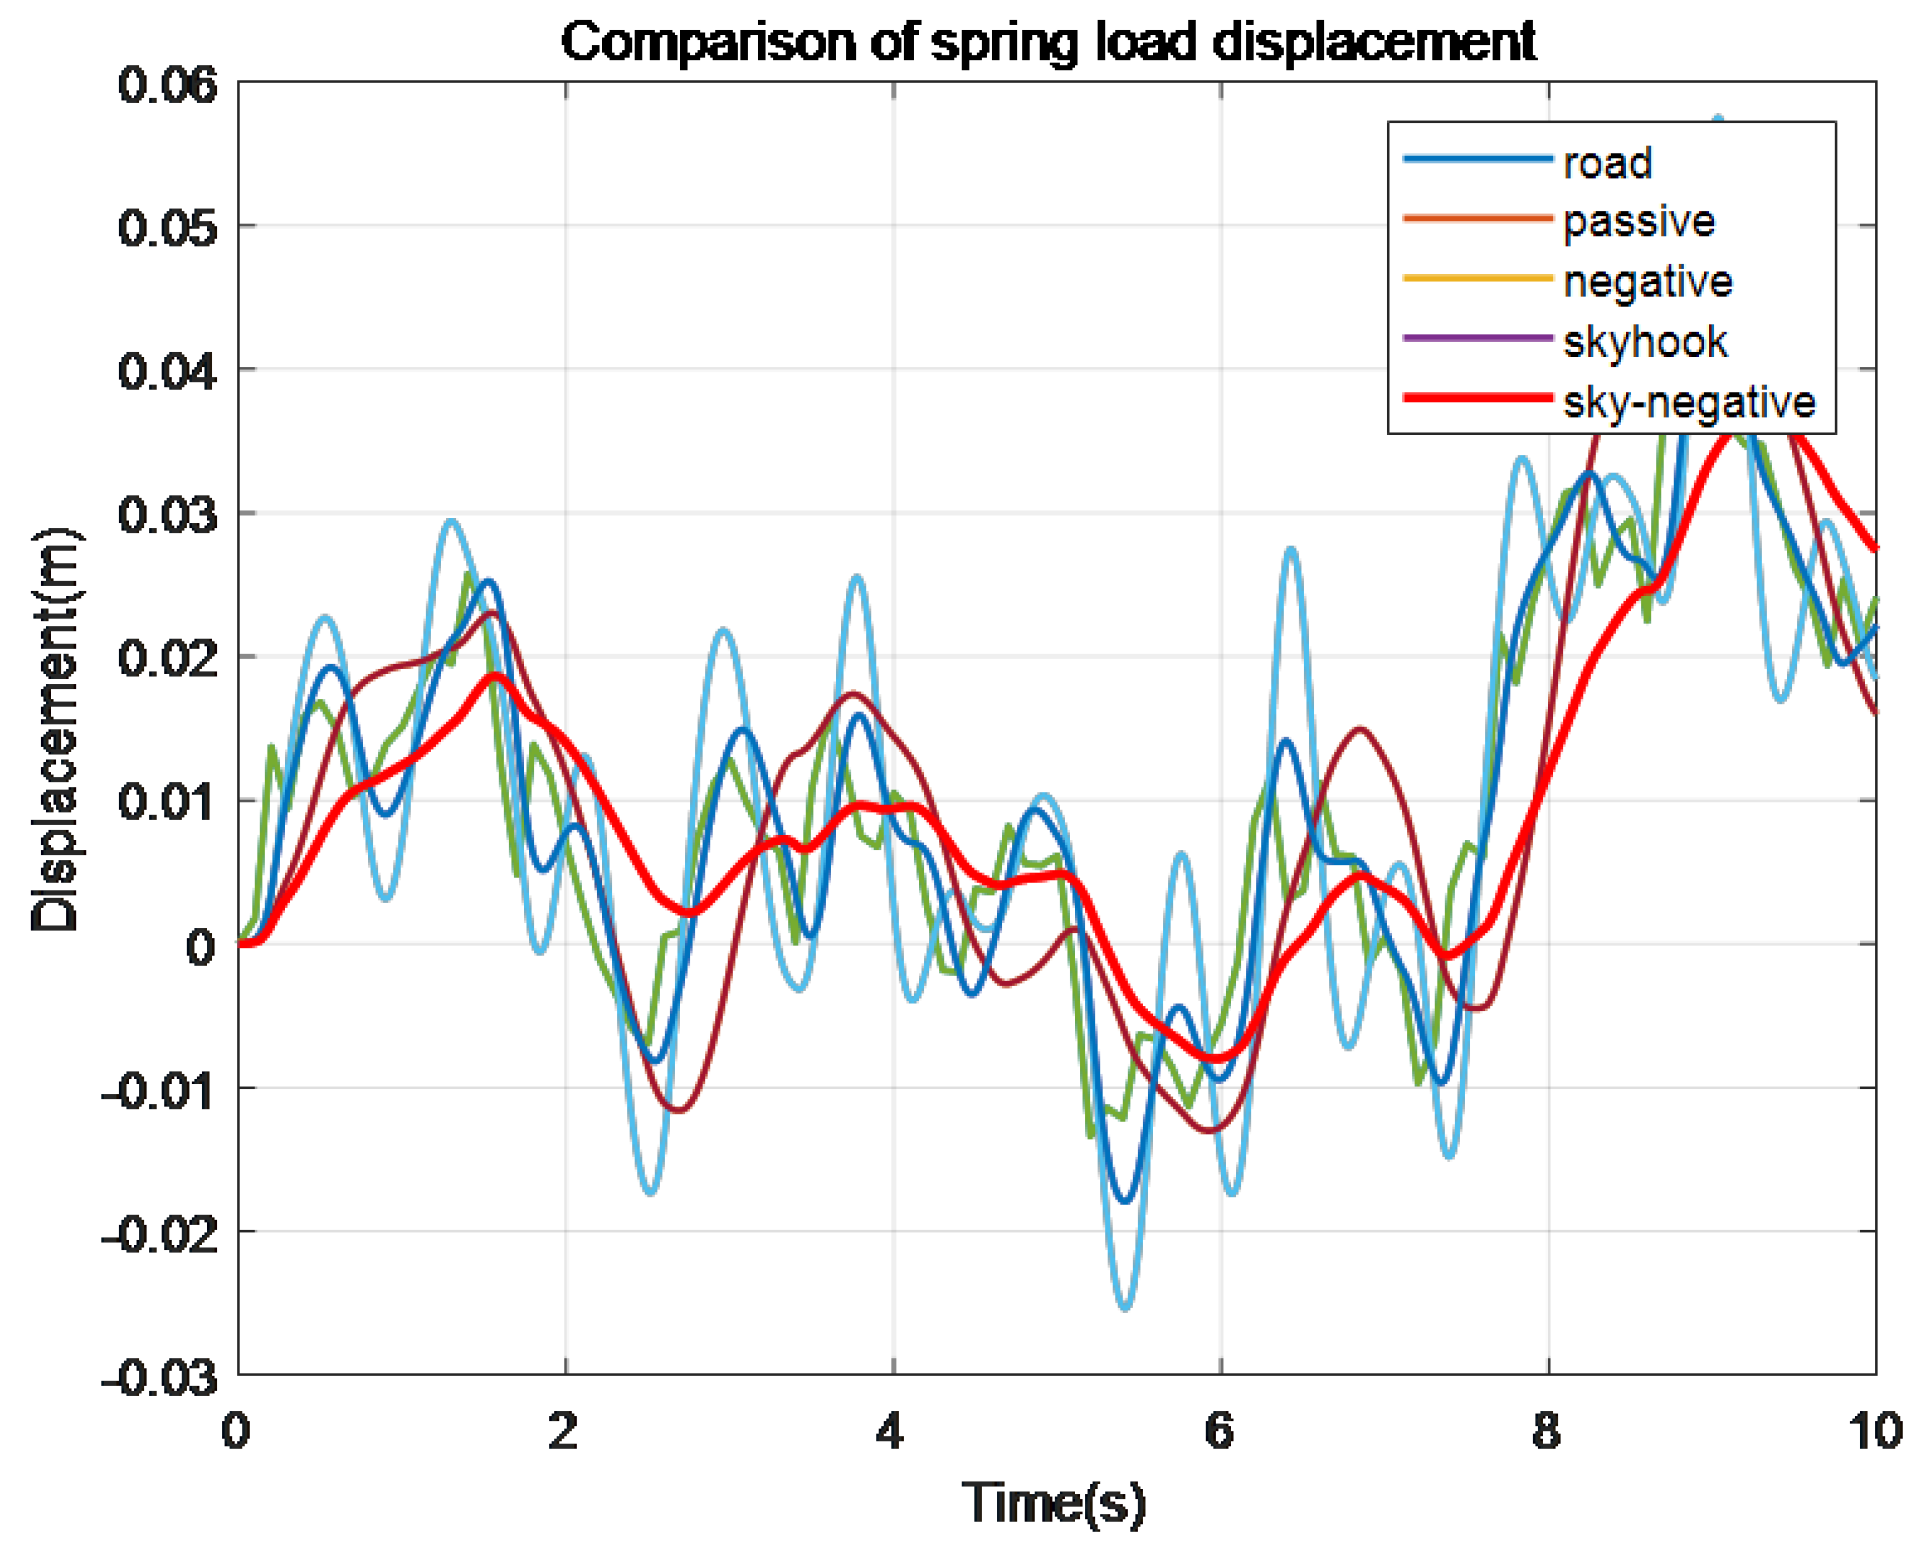
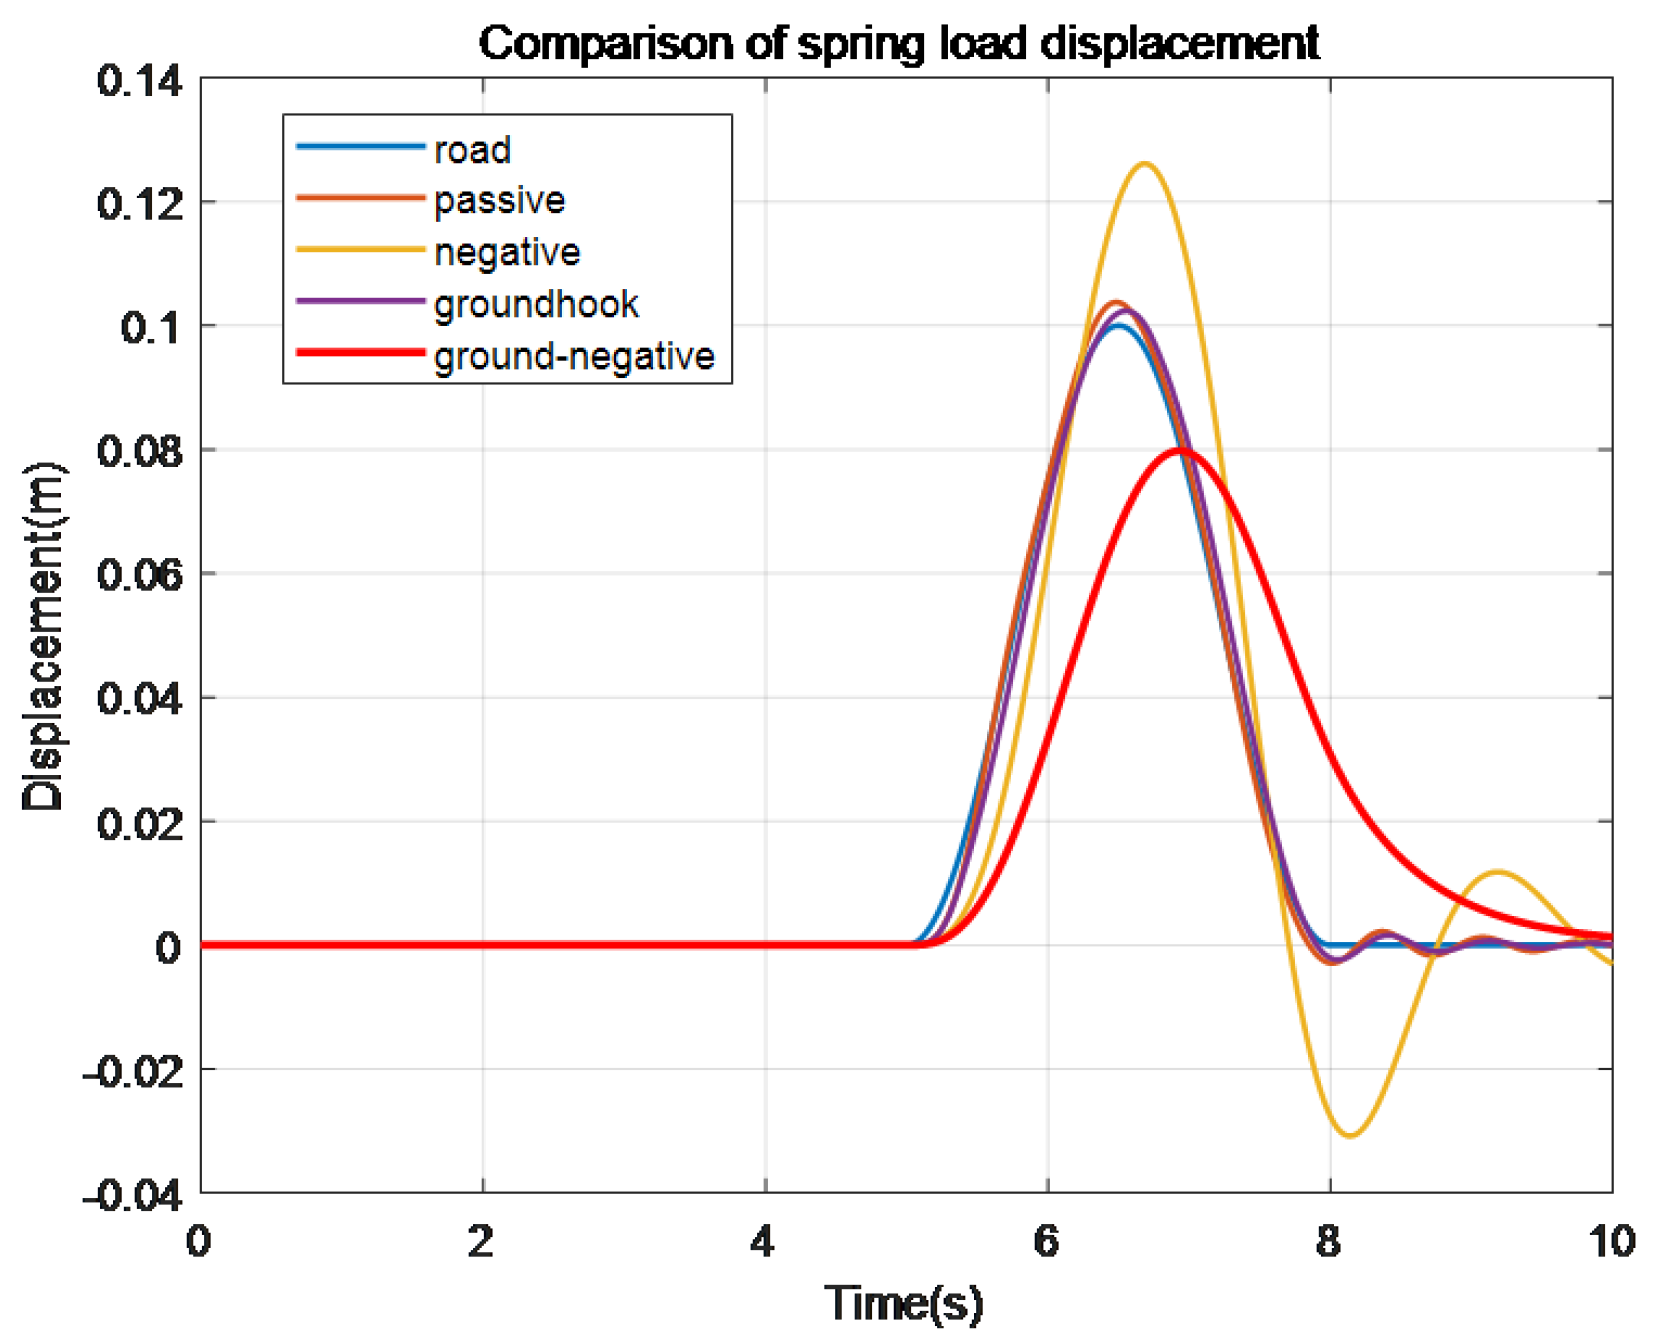
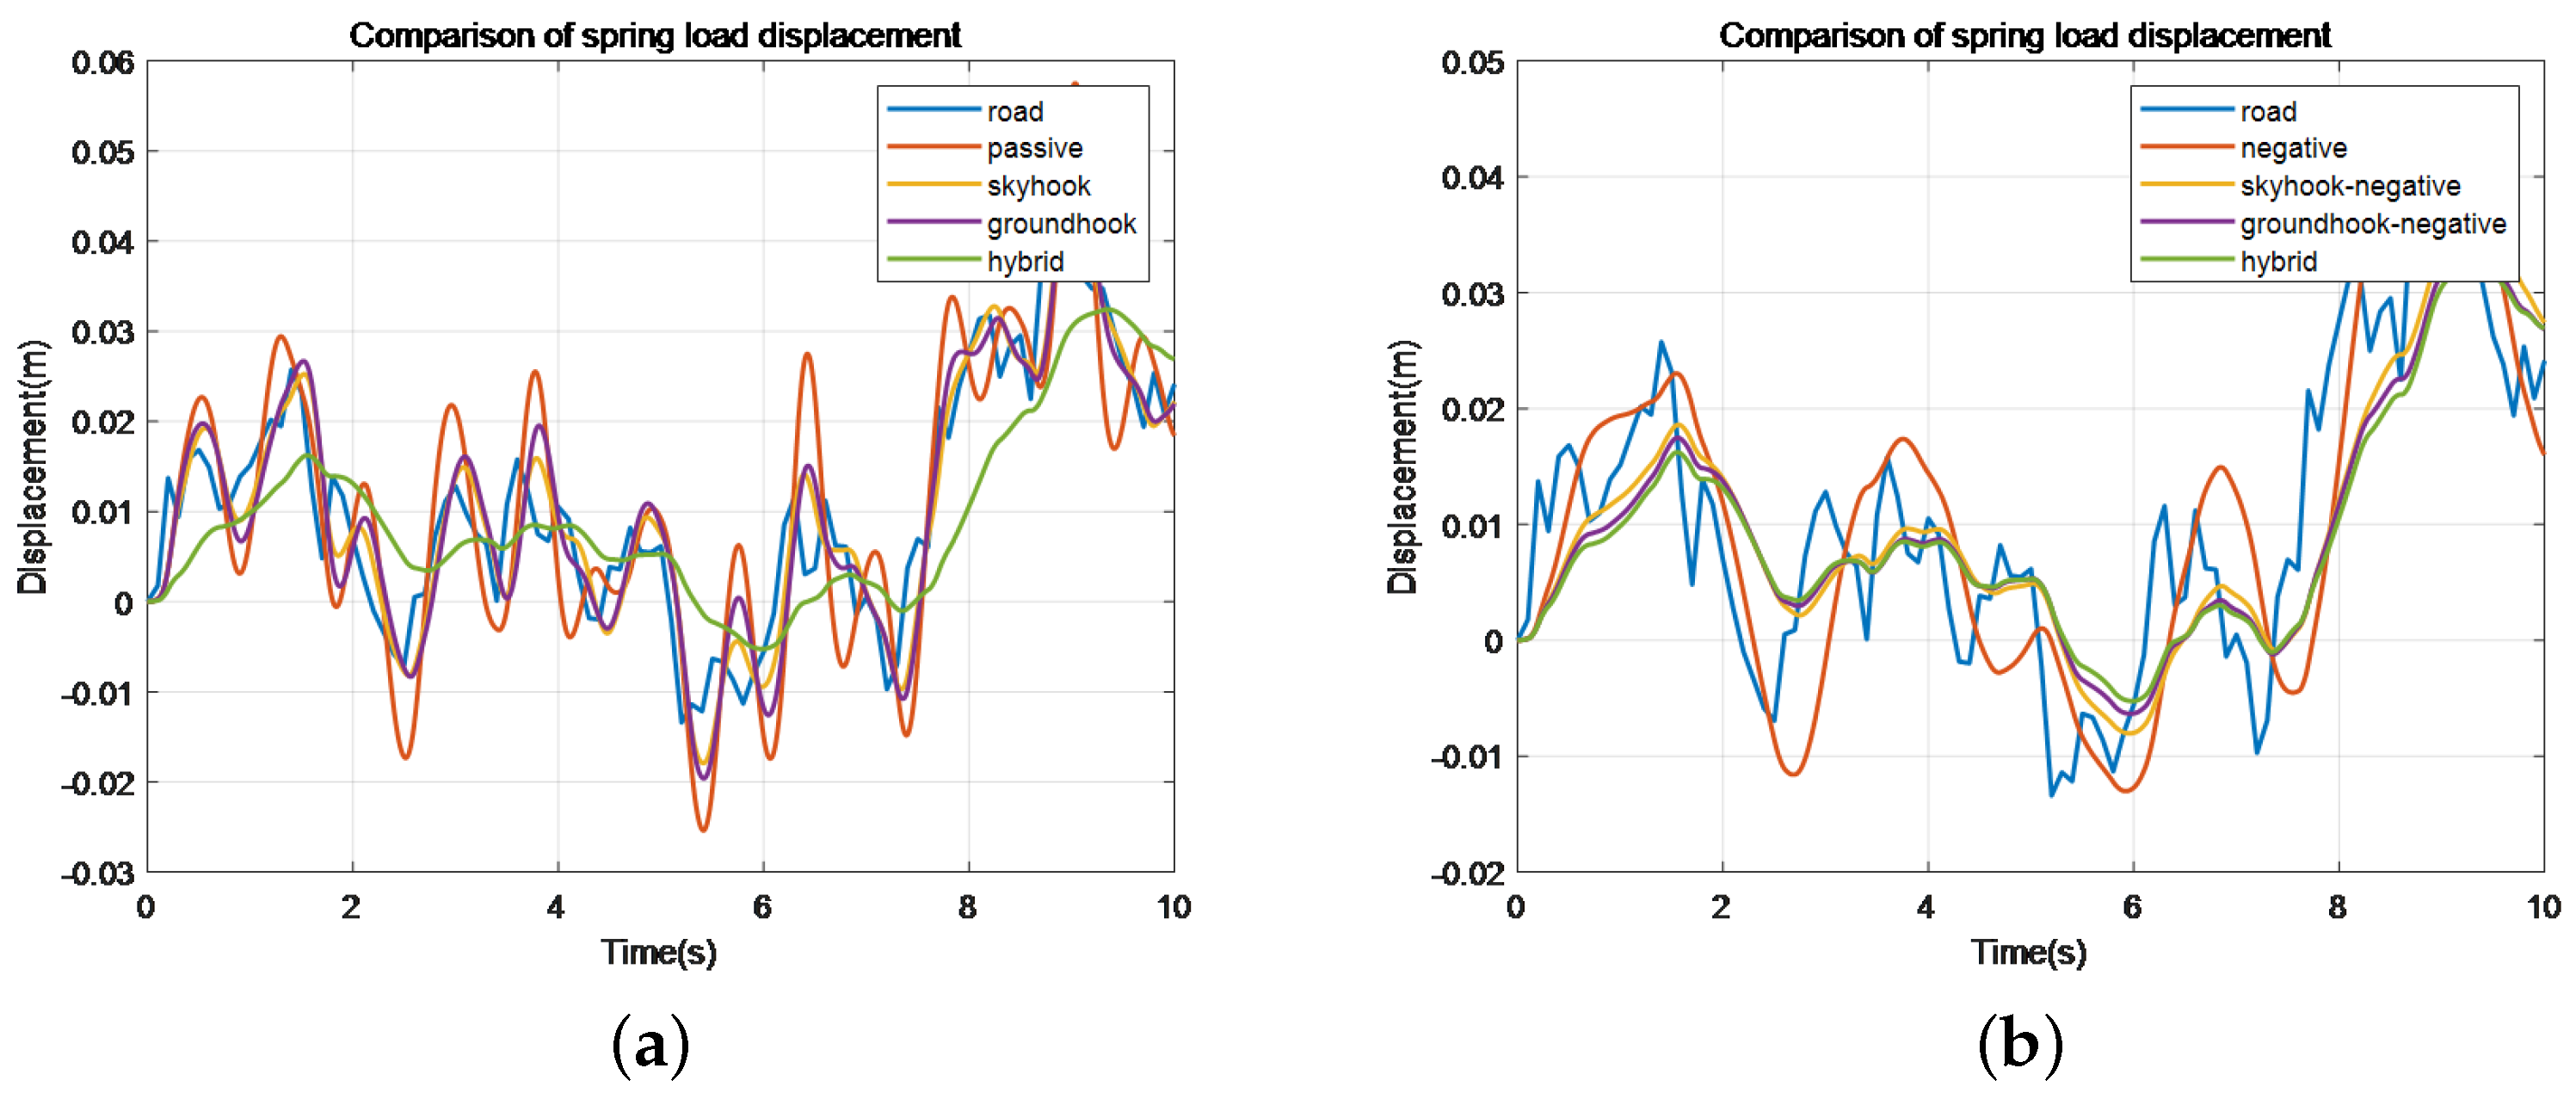
Figure 7.
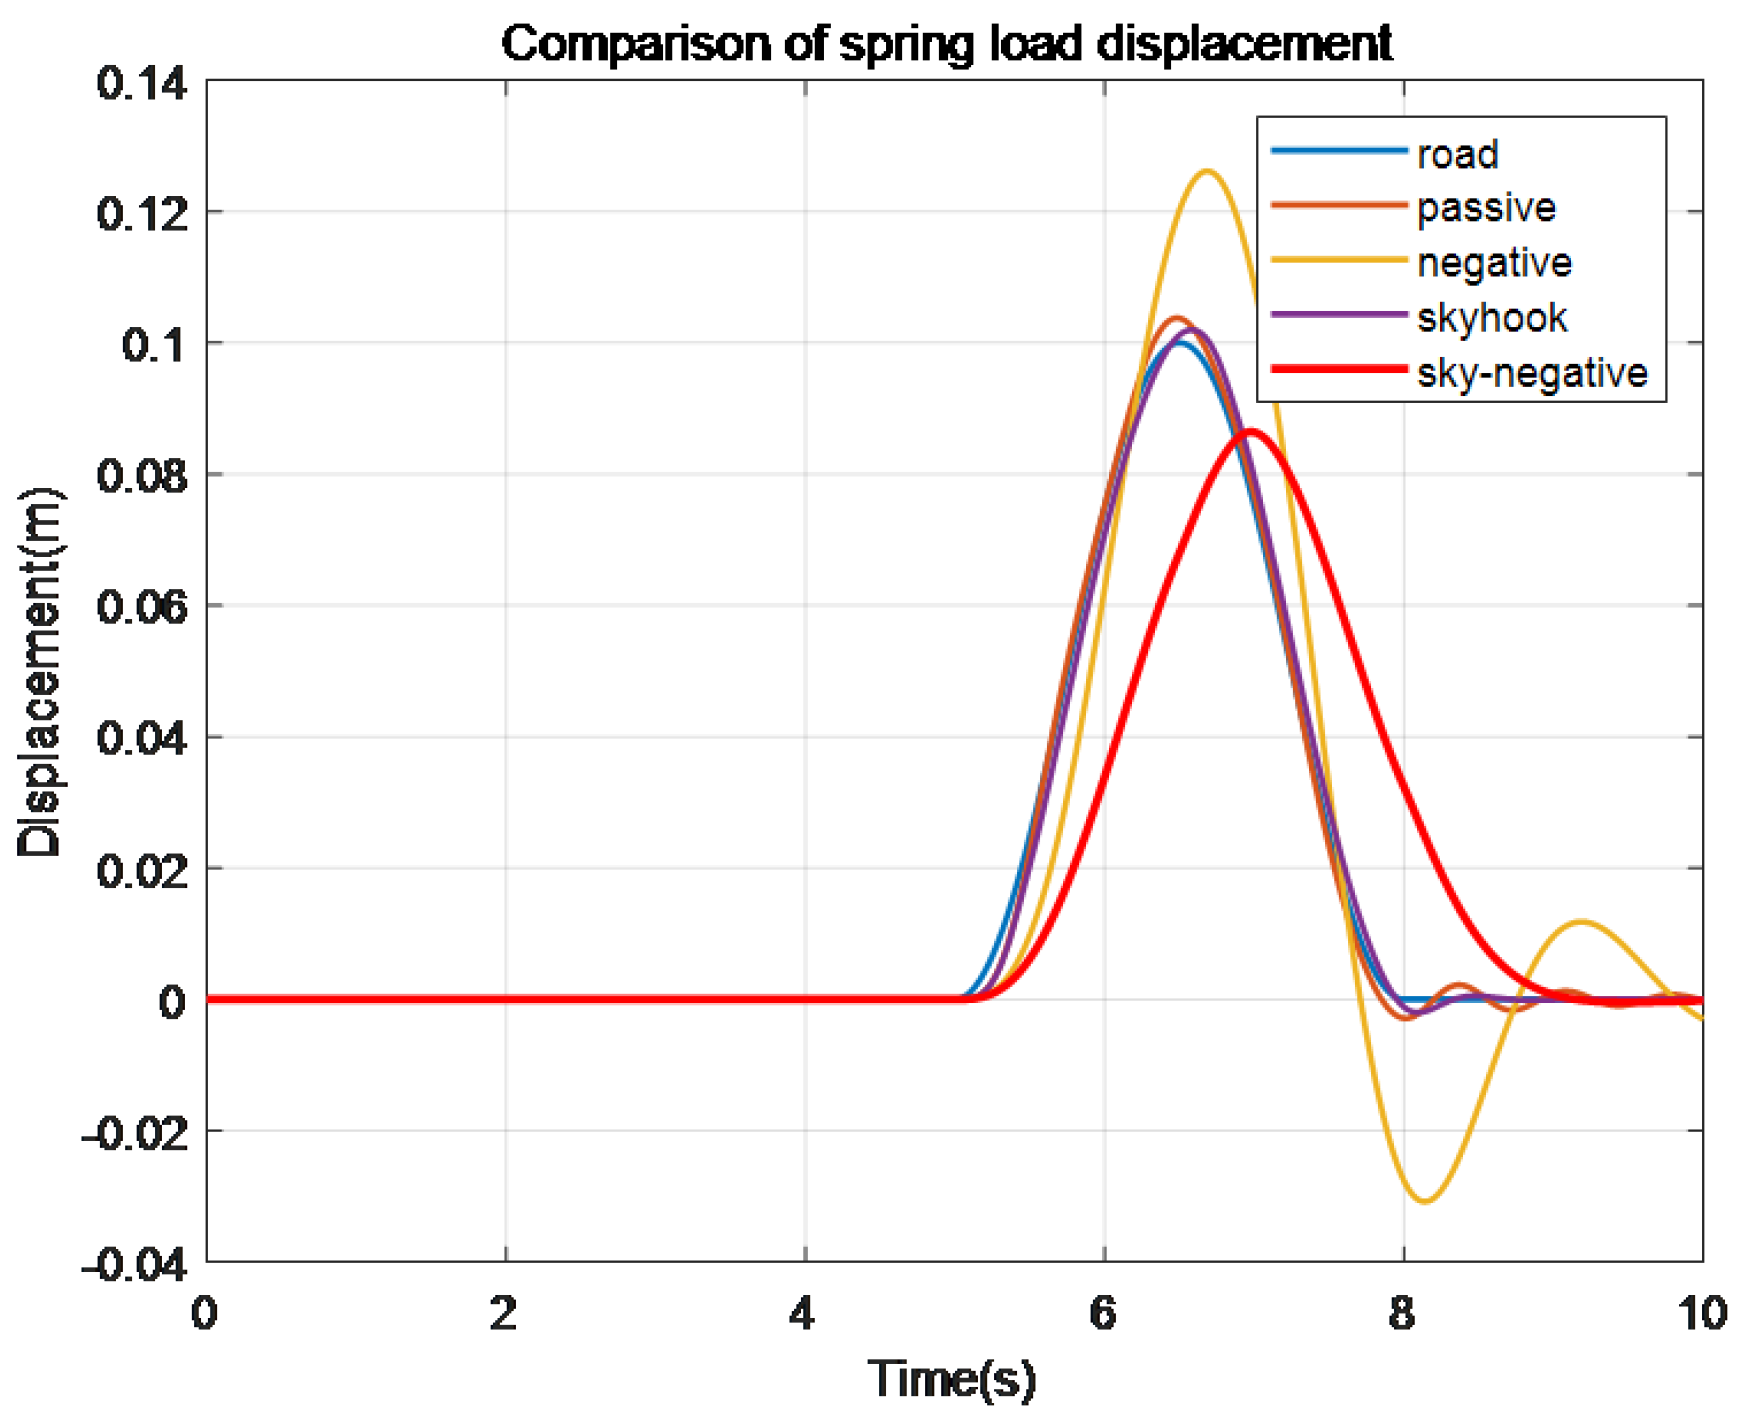
Spring load displacement comparison chart.
Figure 7.
Spring load displacement comparison chart.
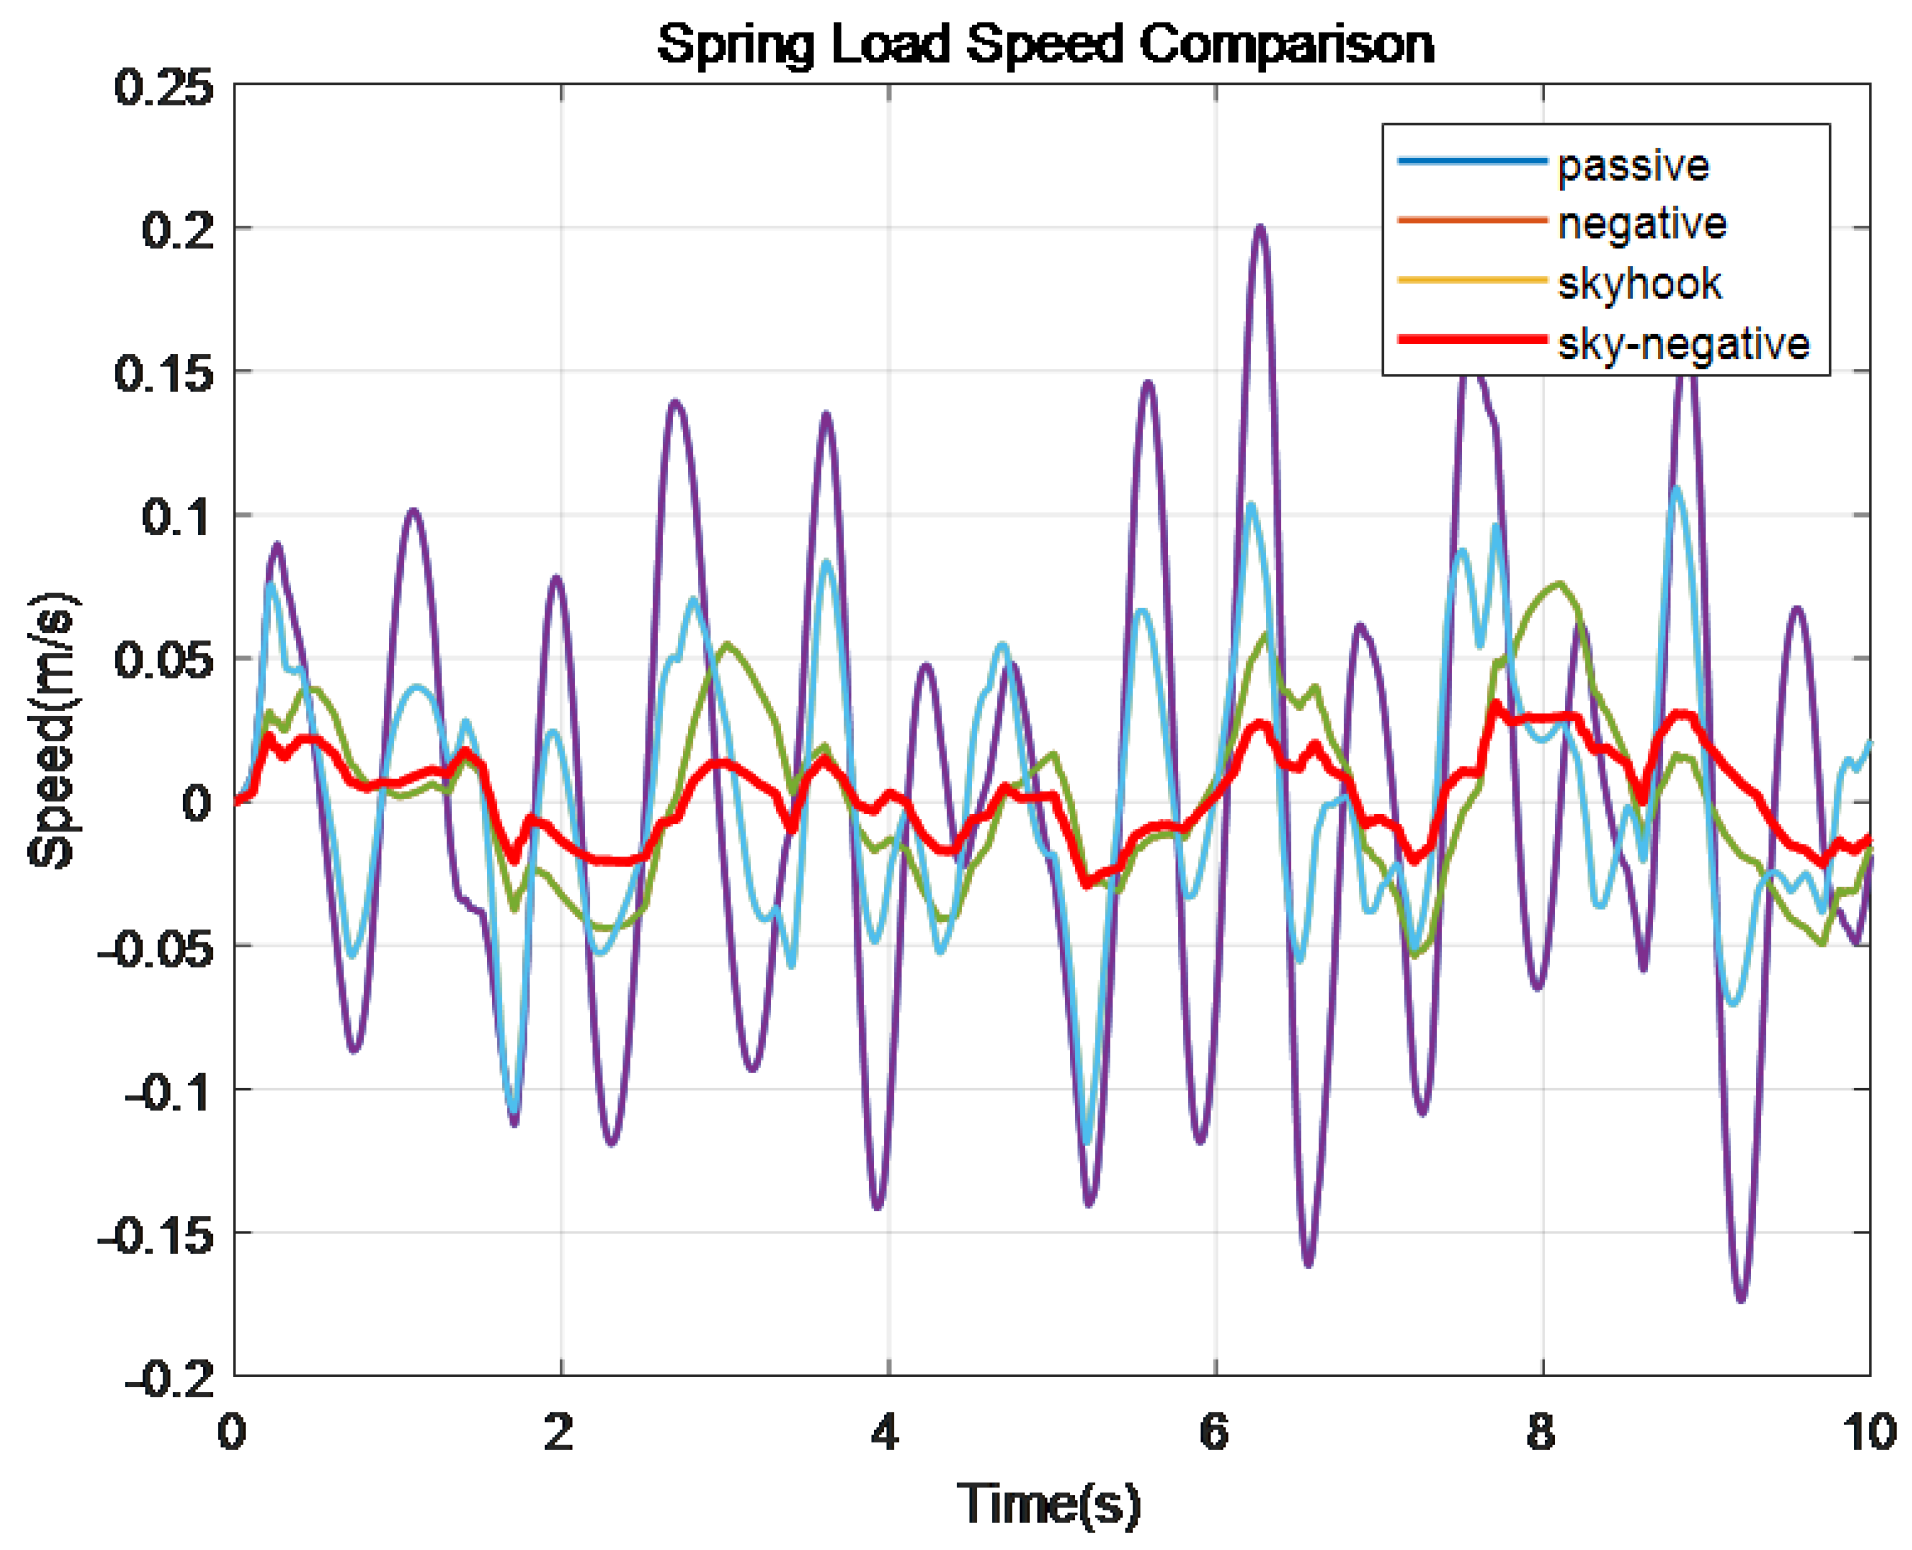
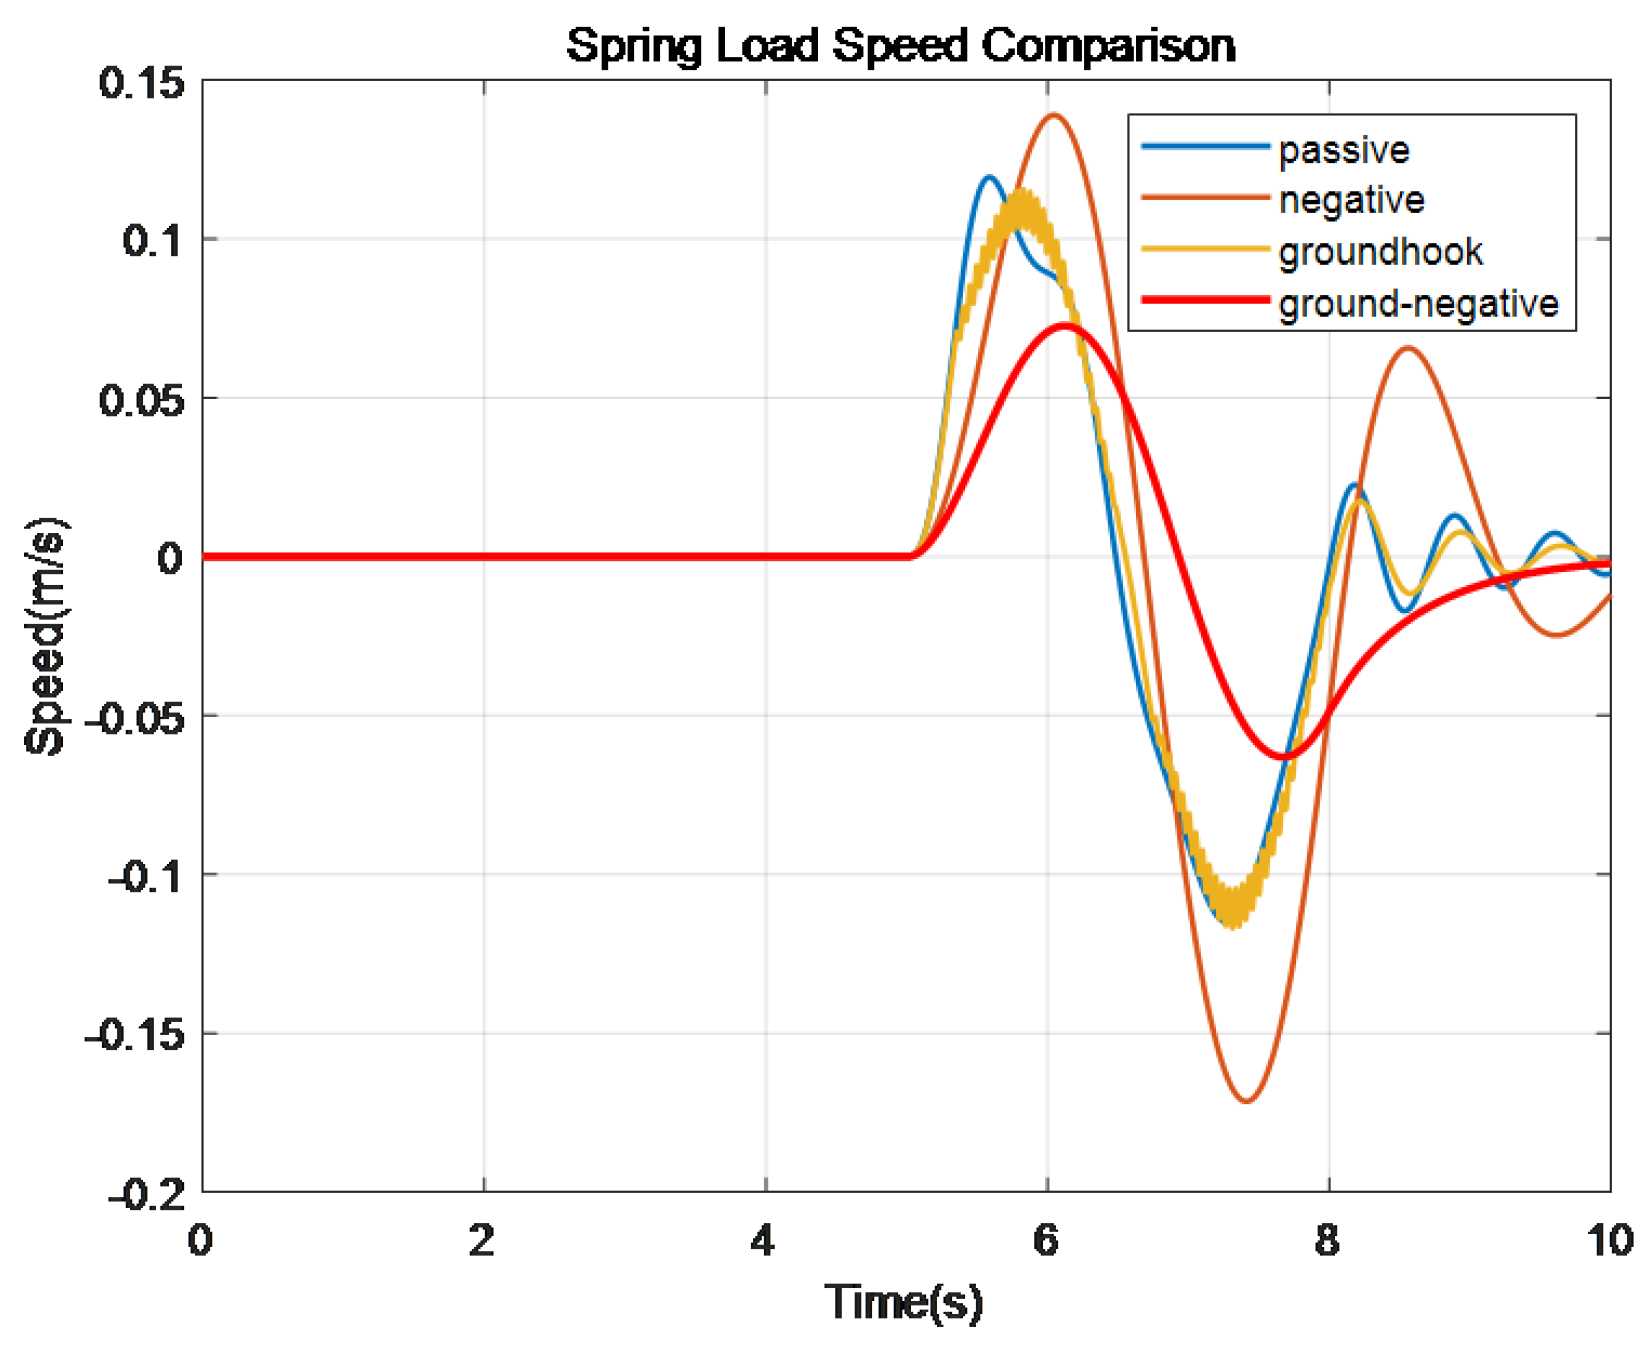
Figure 8.
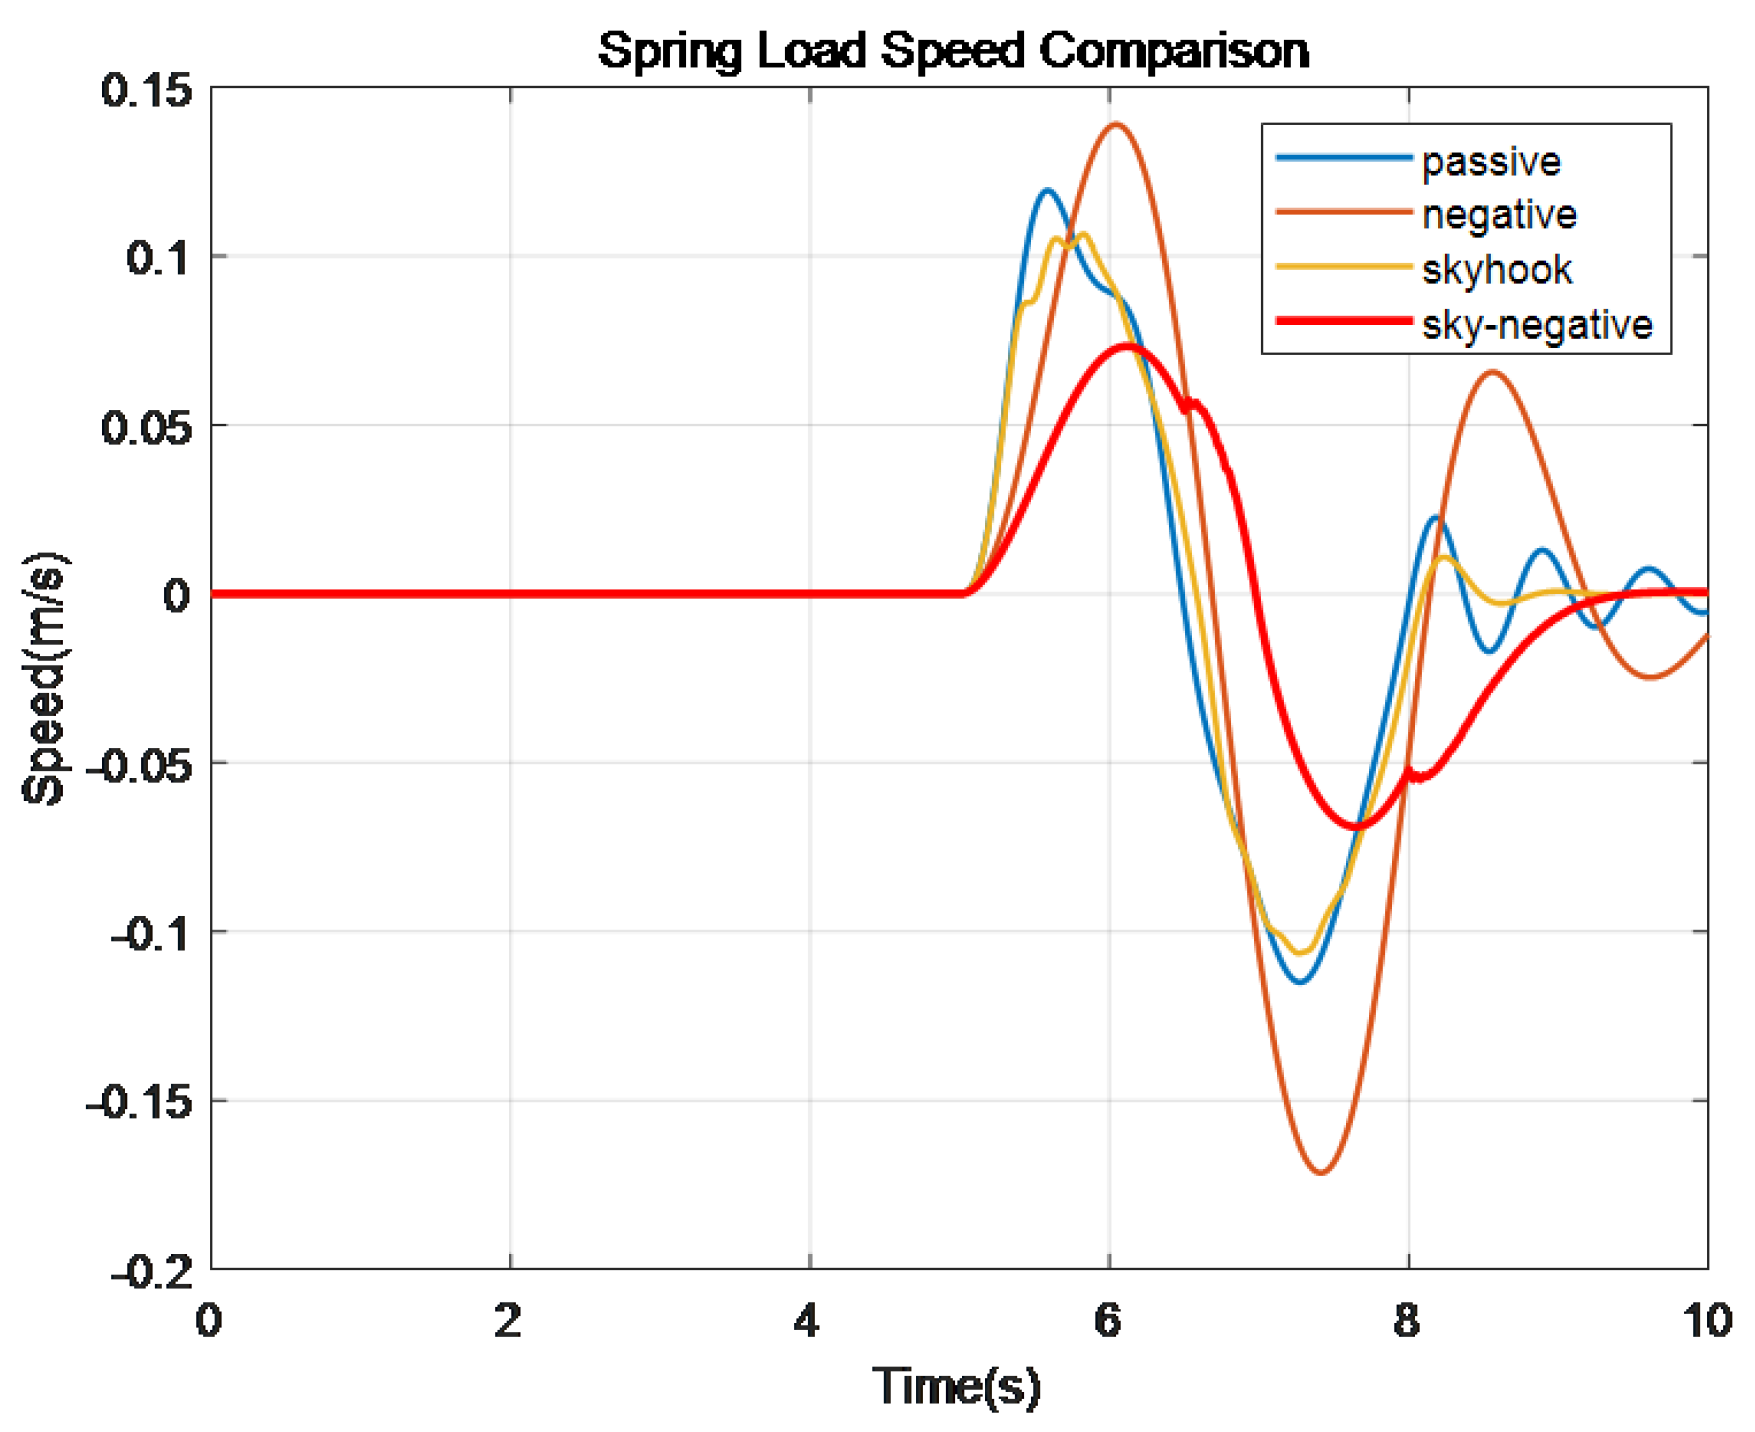
Comparison of spring load speed.
Figure 8.
Comparison of spring load speed.
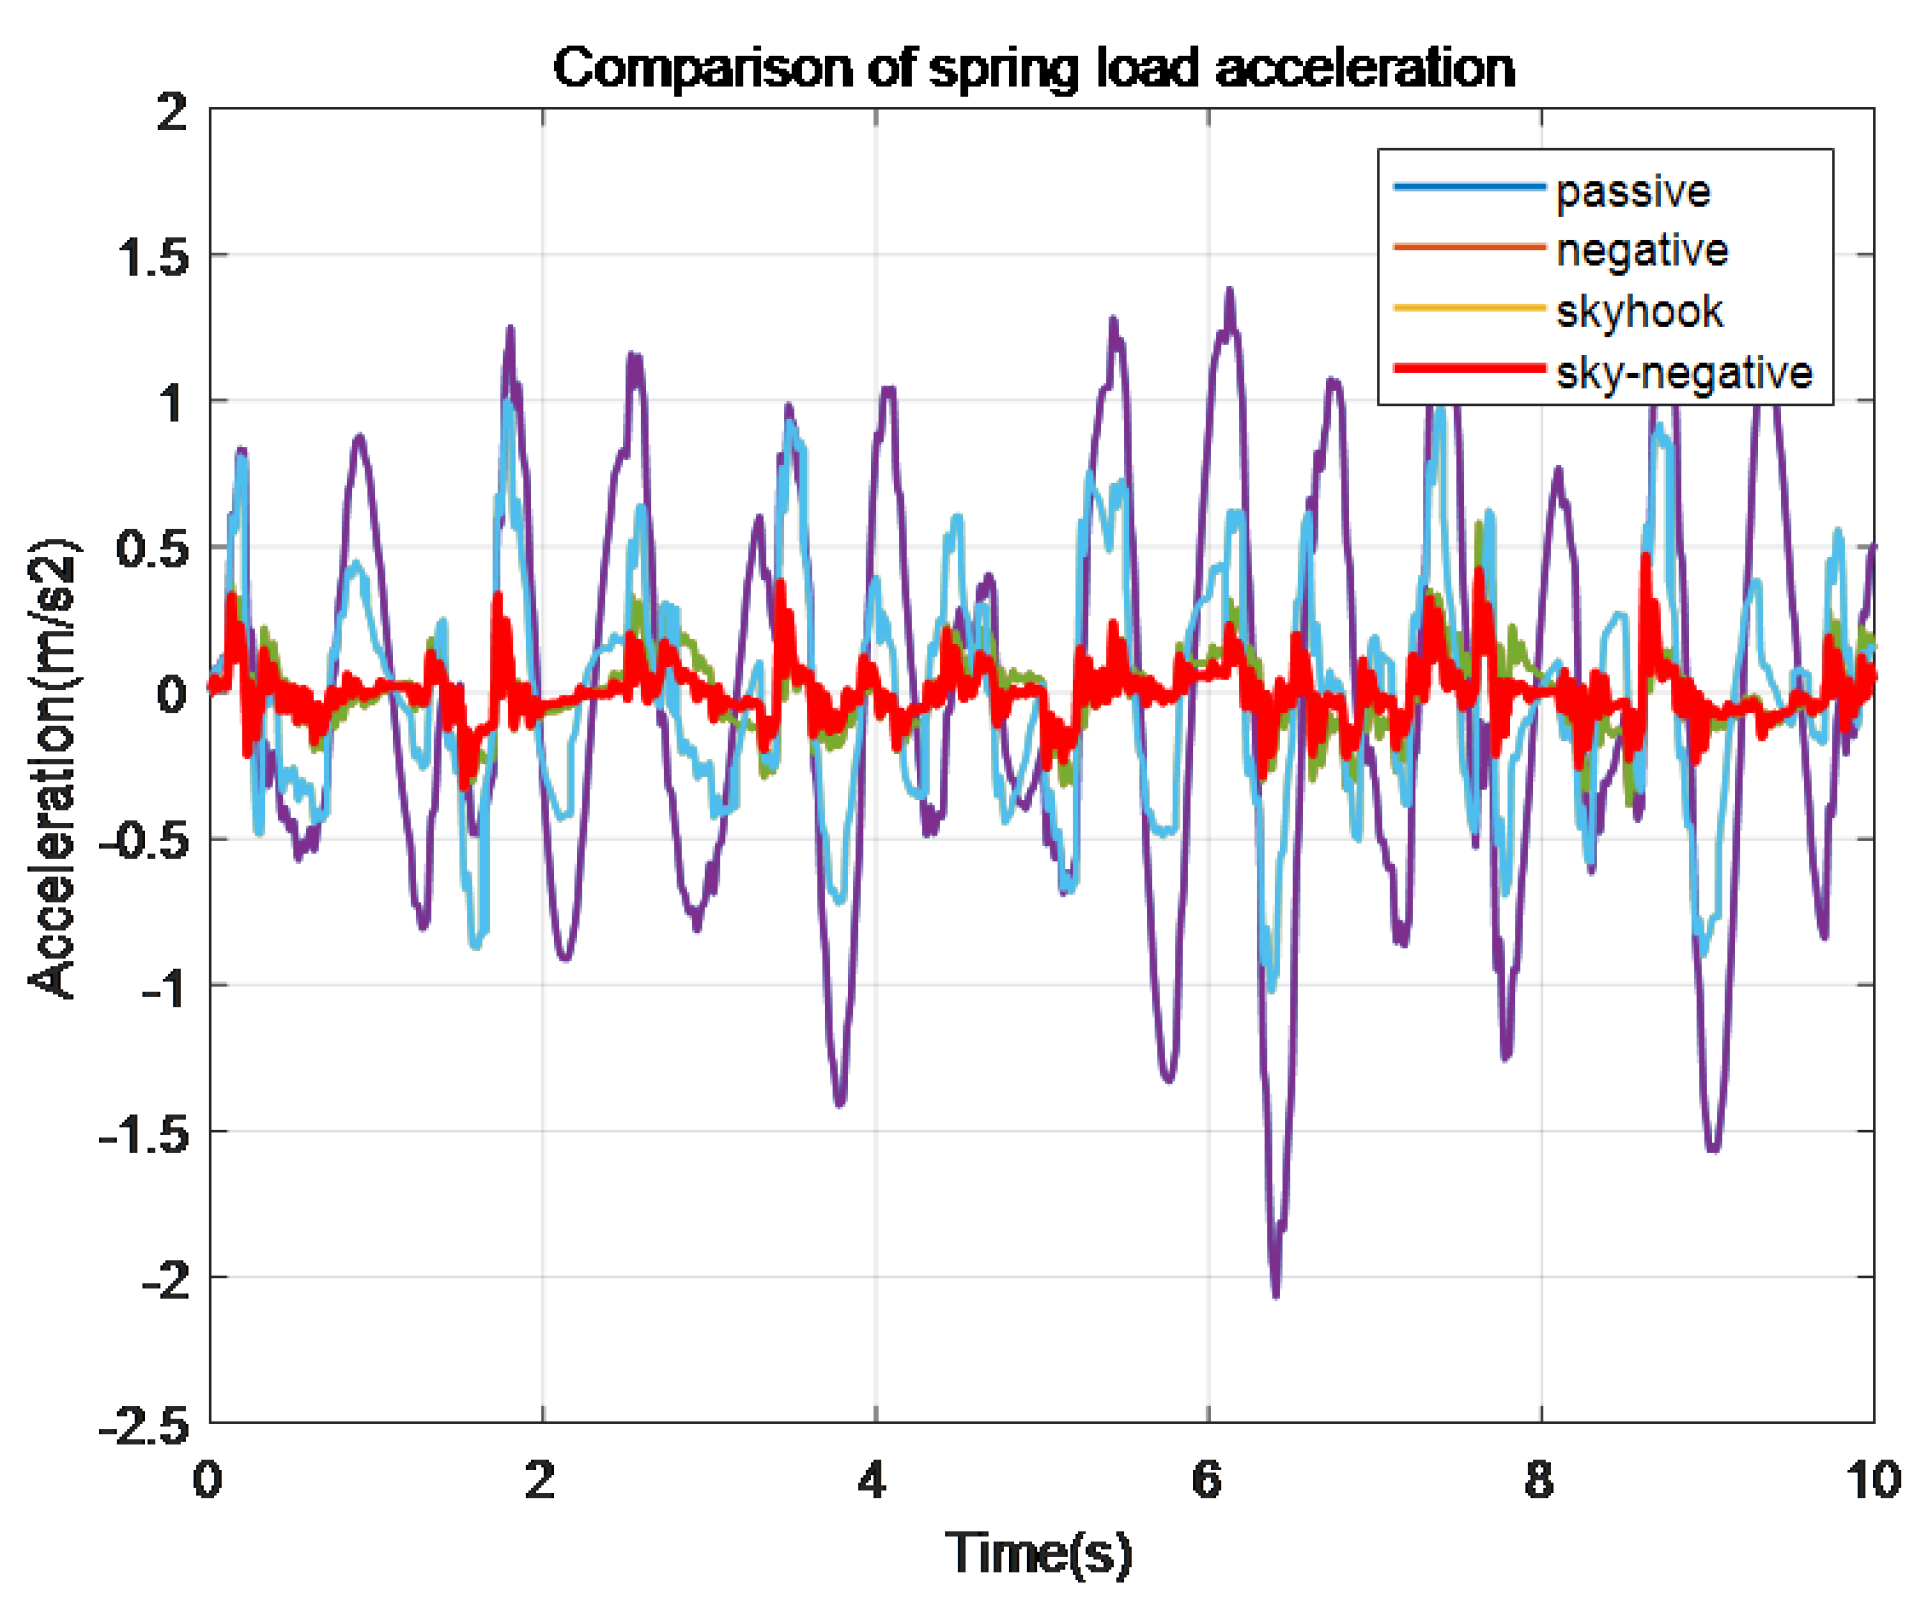
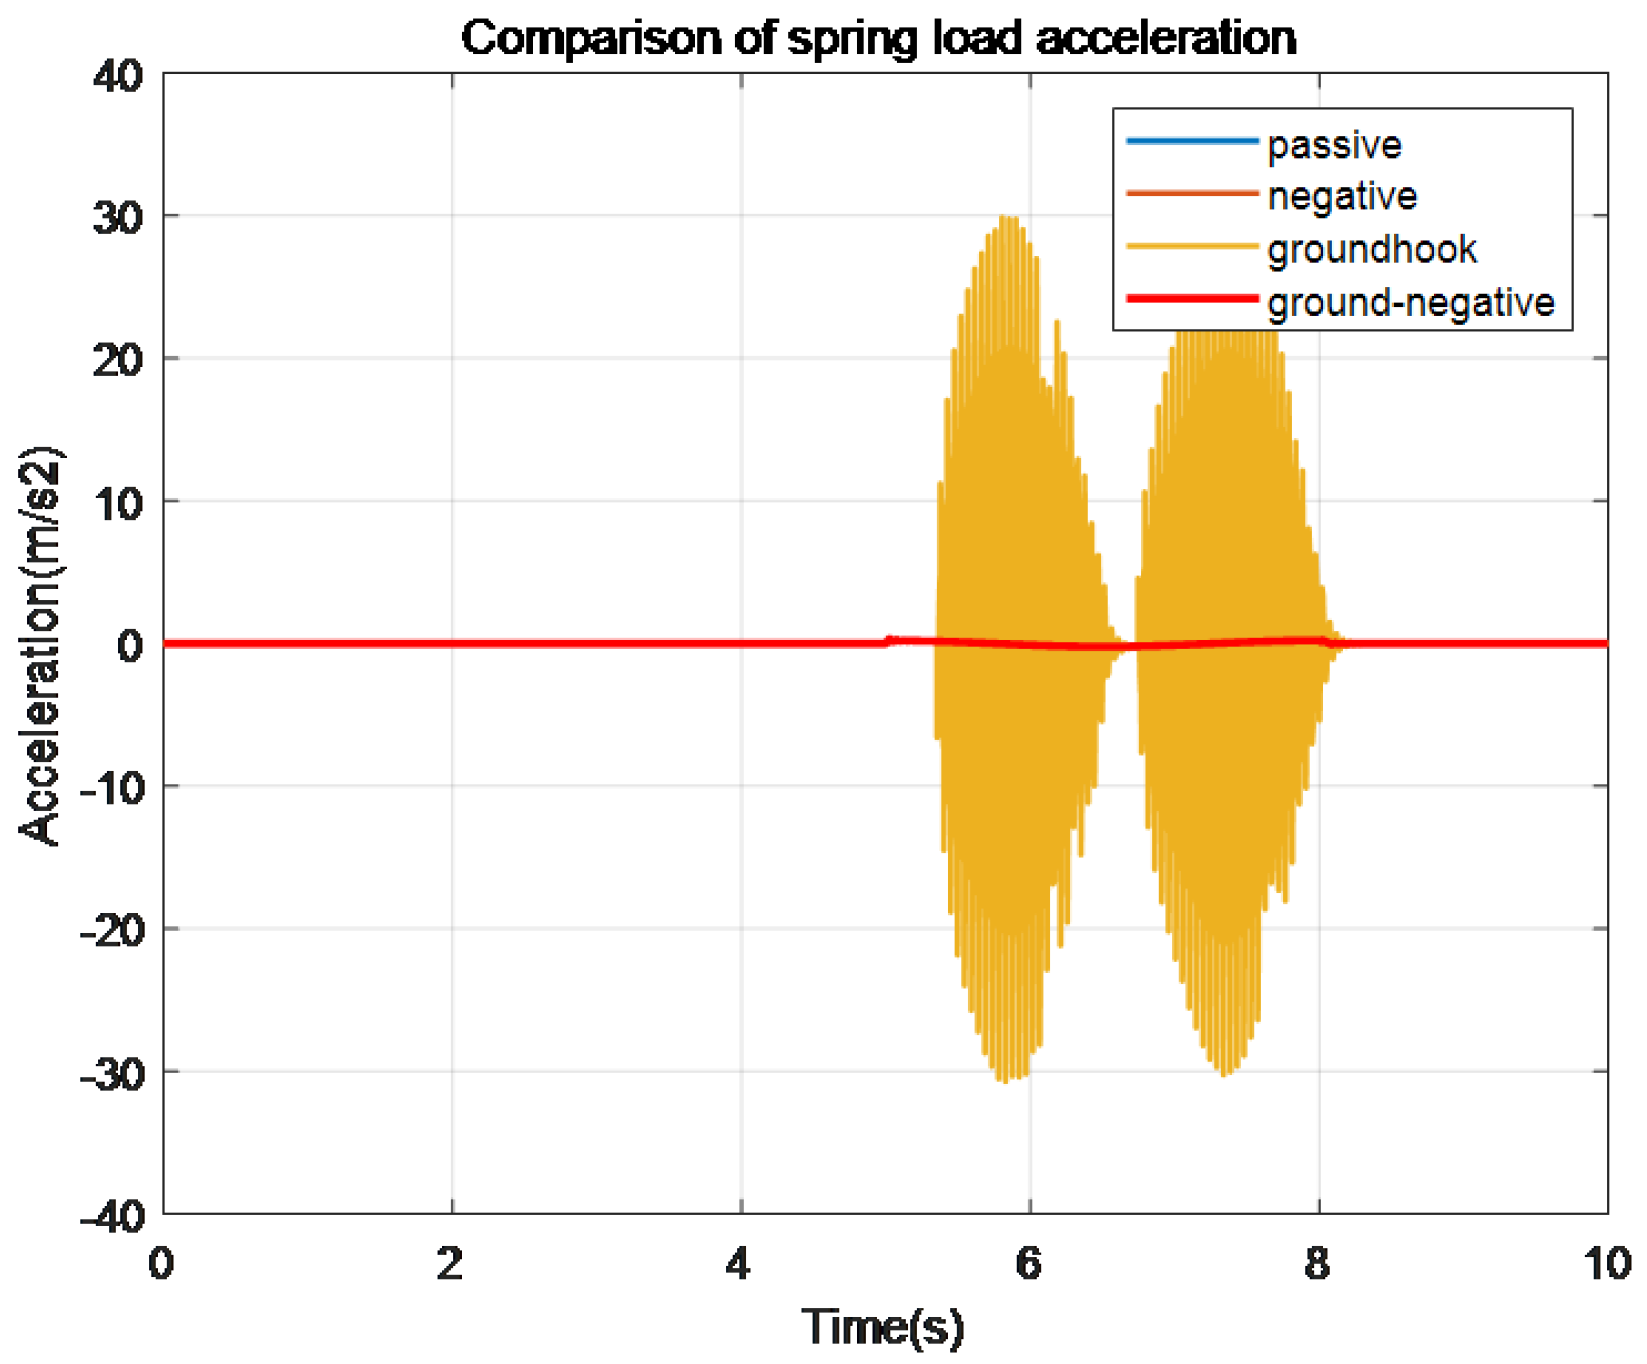
Figure 9.
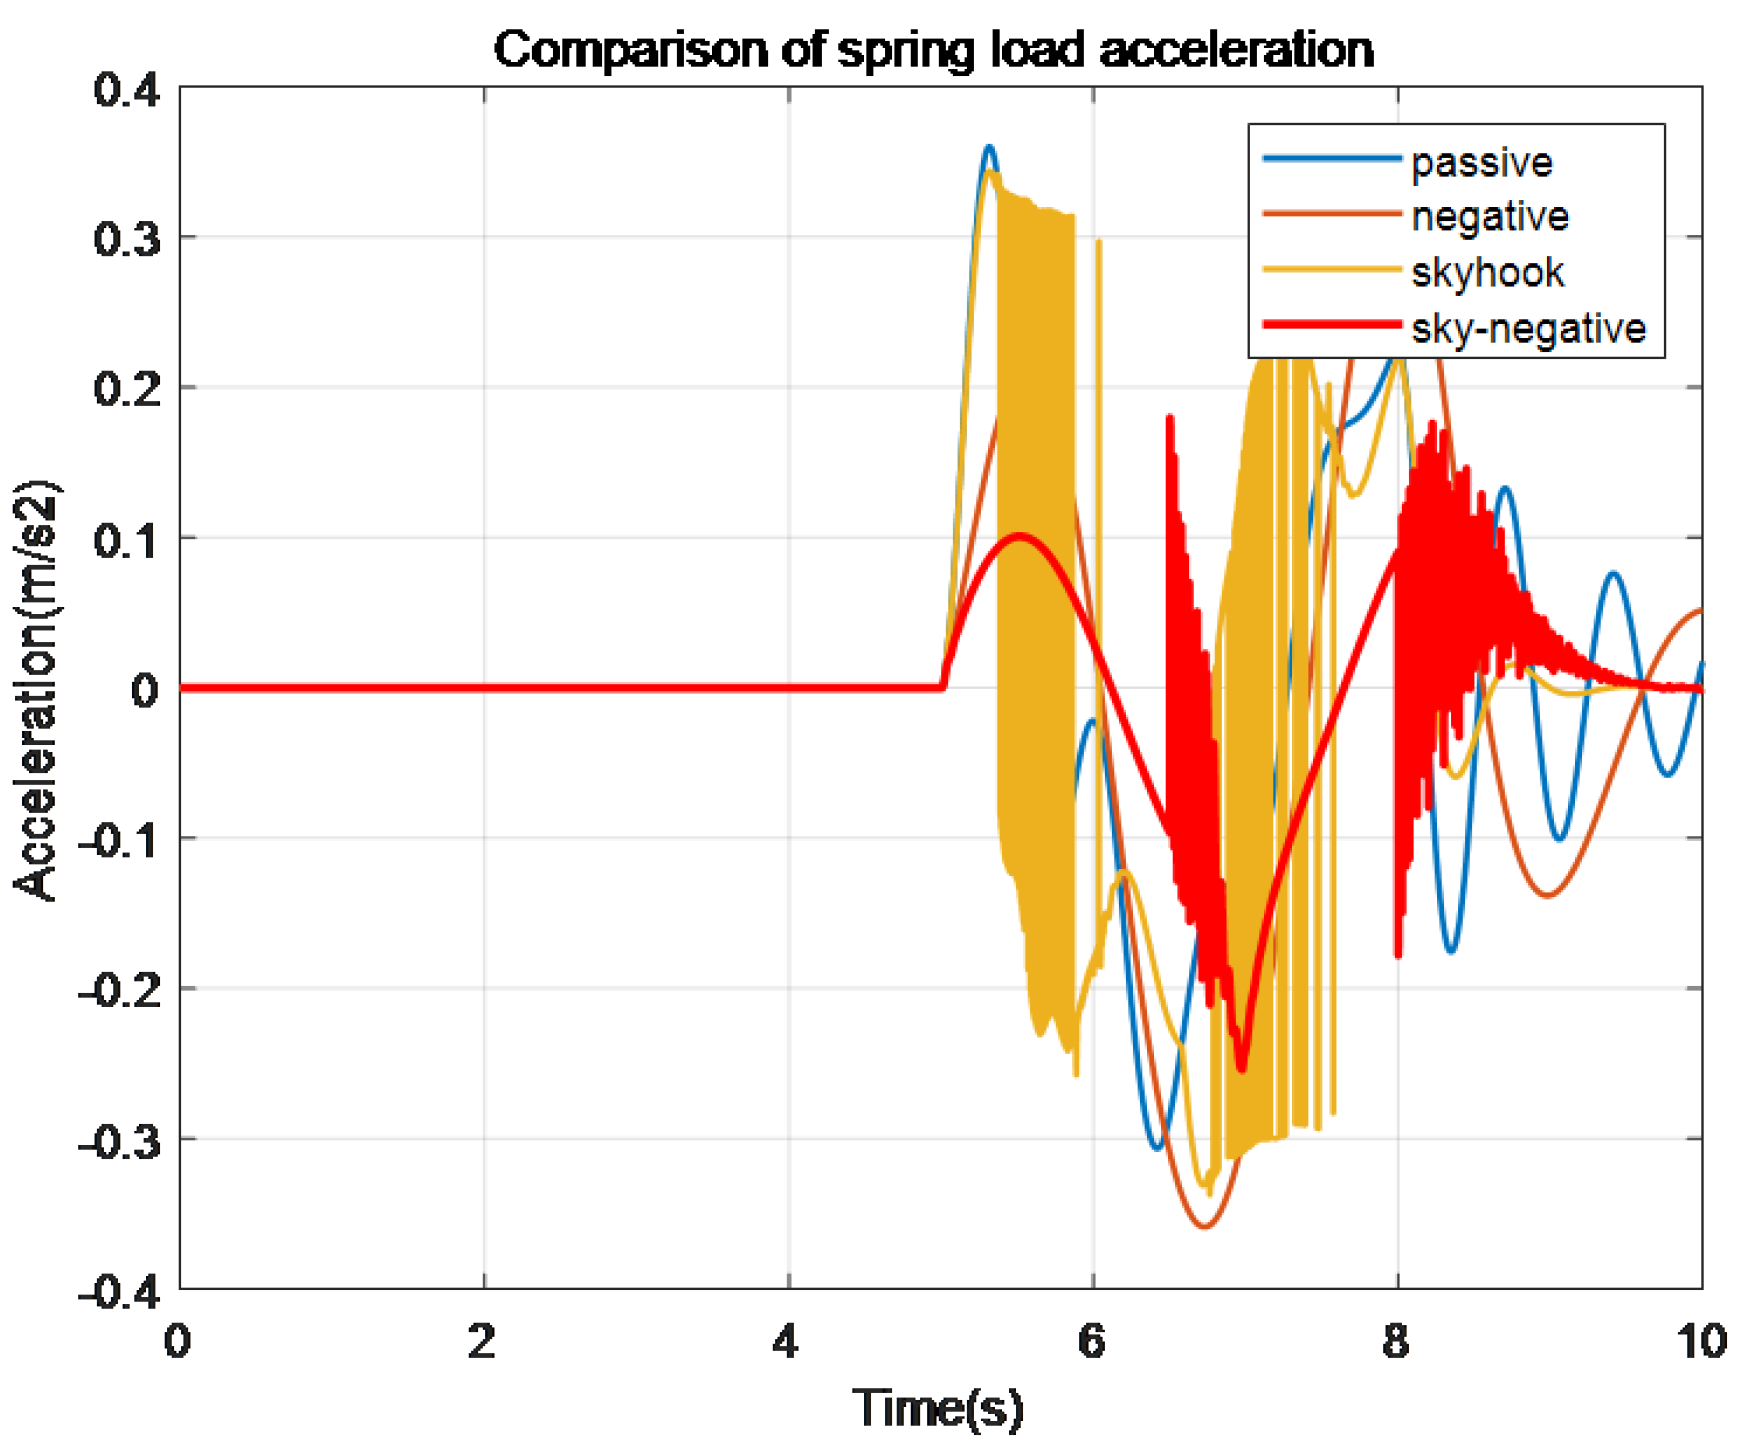
Comparison of spring load acceleration.
Figure 9.
Comparison of spring load acceleration.
Figure 10.
Comparison of spring load speed.
Figure 10.
Comparison of spring load speed.
Figure 11.
Comparison of spring load acceleration.
Figure 11.
Comparison of spring load acceleration.
Figure 12.
Comparison of spring load displacement.
Figure 12.
Comparison of spring load displacement.
Figure 13.
Comparison of spring load speed.
Figure 13.
Comparison of spring load speed.
Figure 14.
Comparison of spring load acceleration.
Figure 14.
Comparison of spring load acceleration.
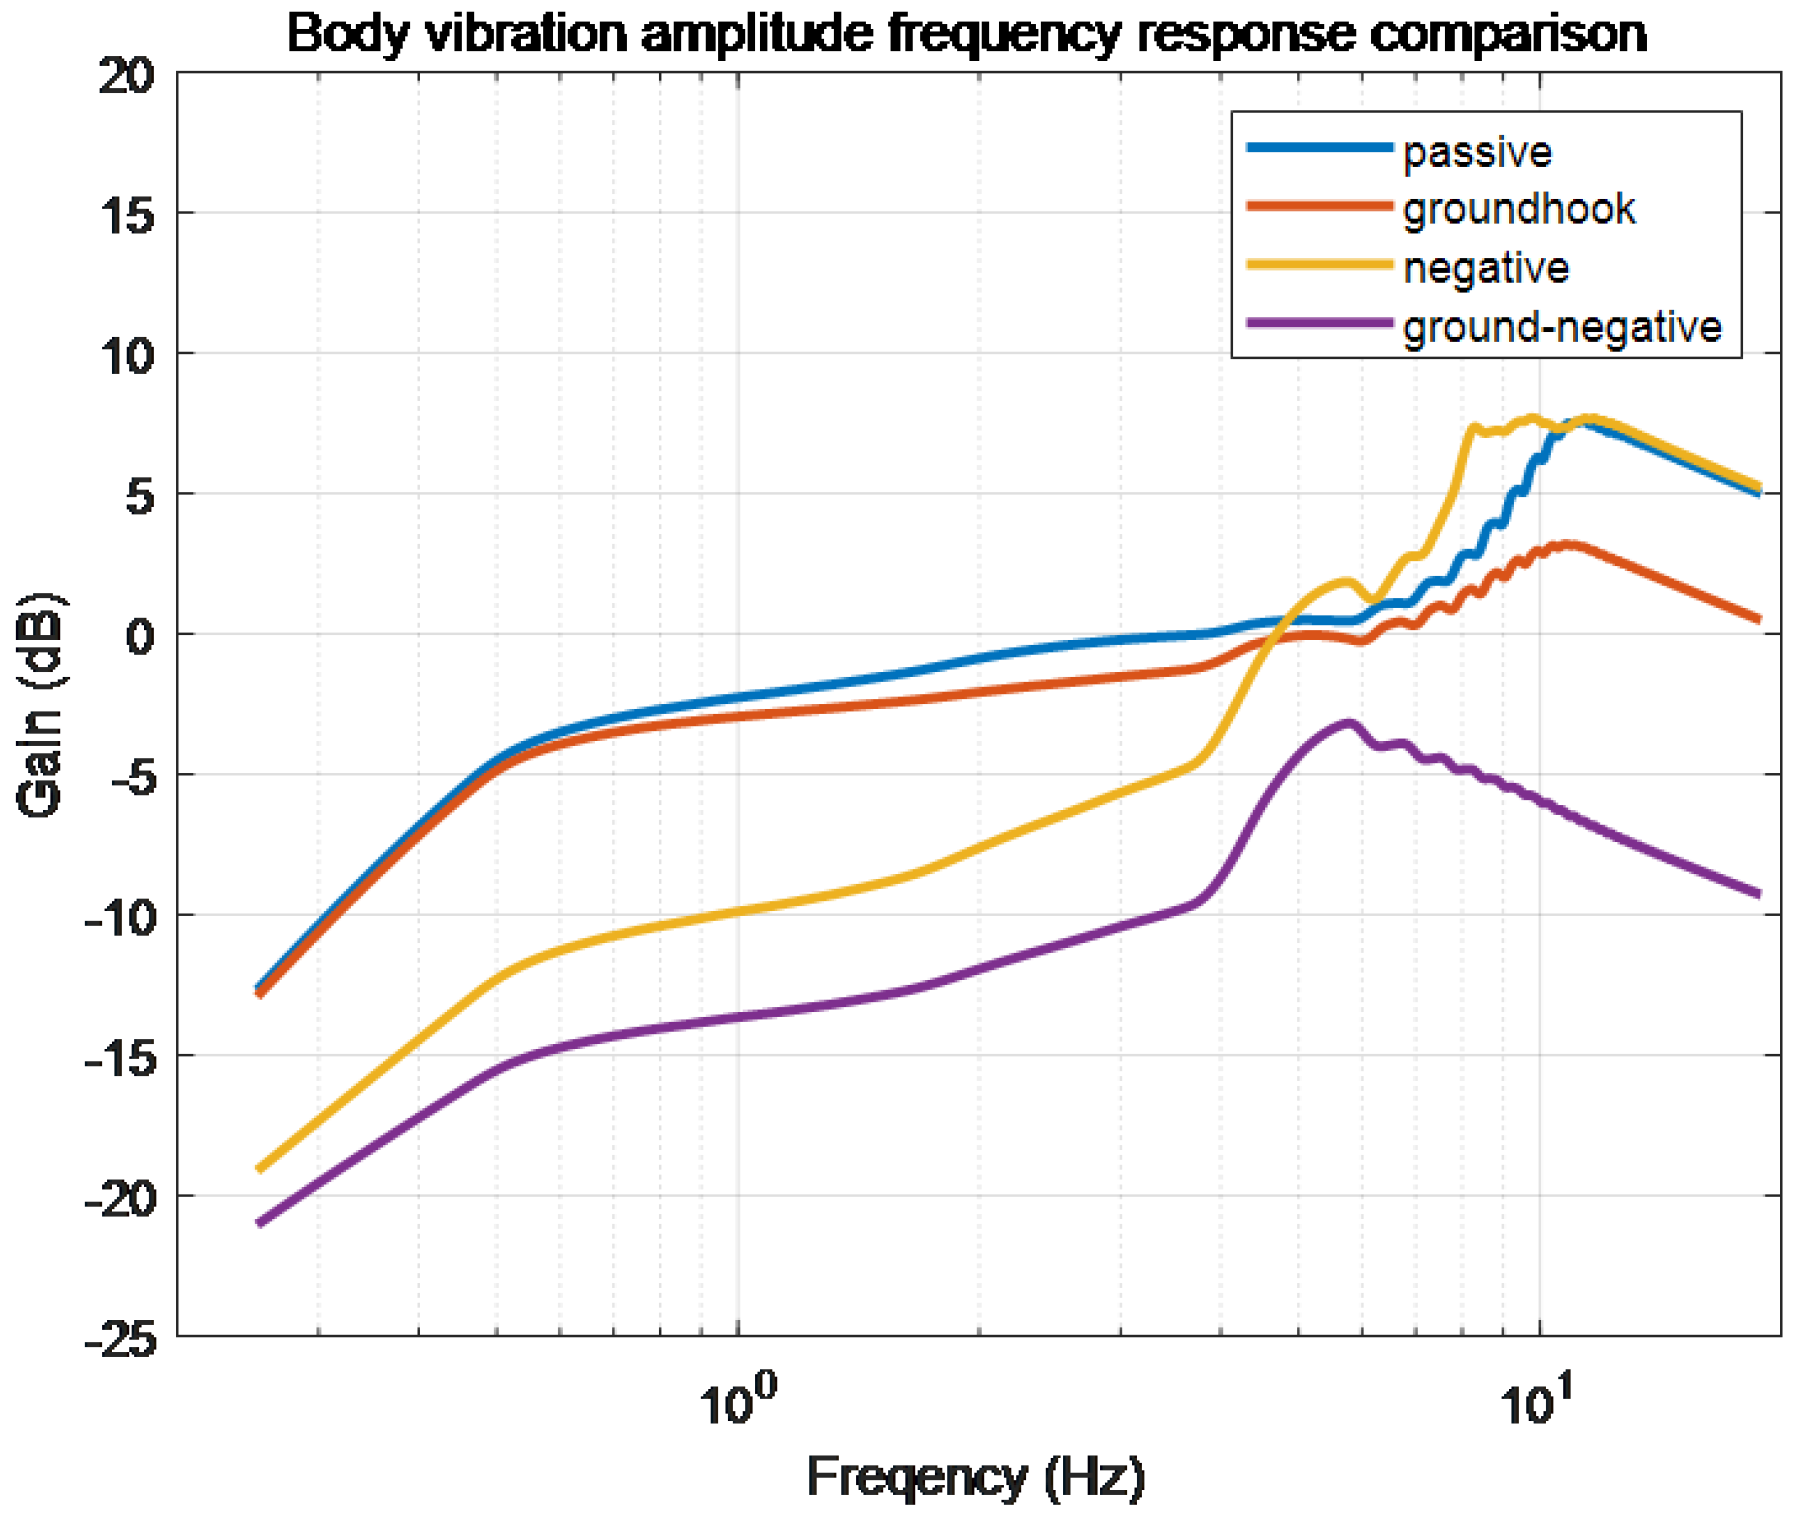
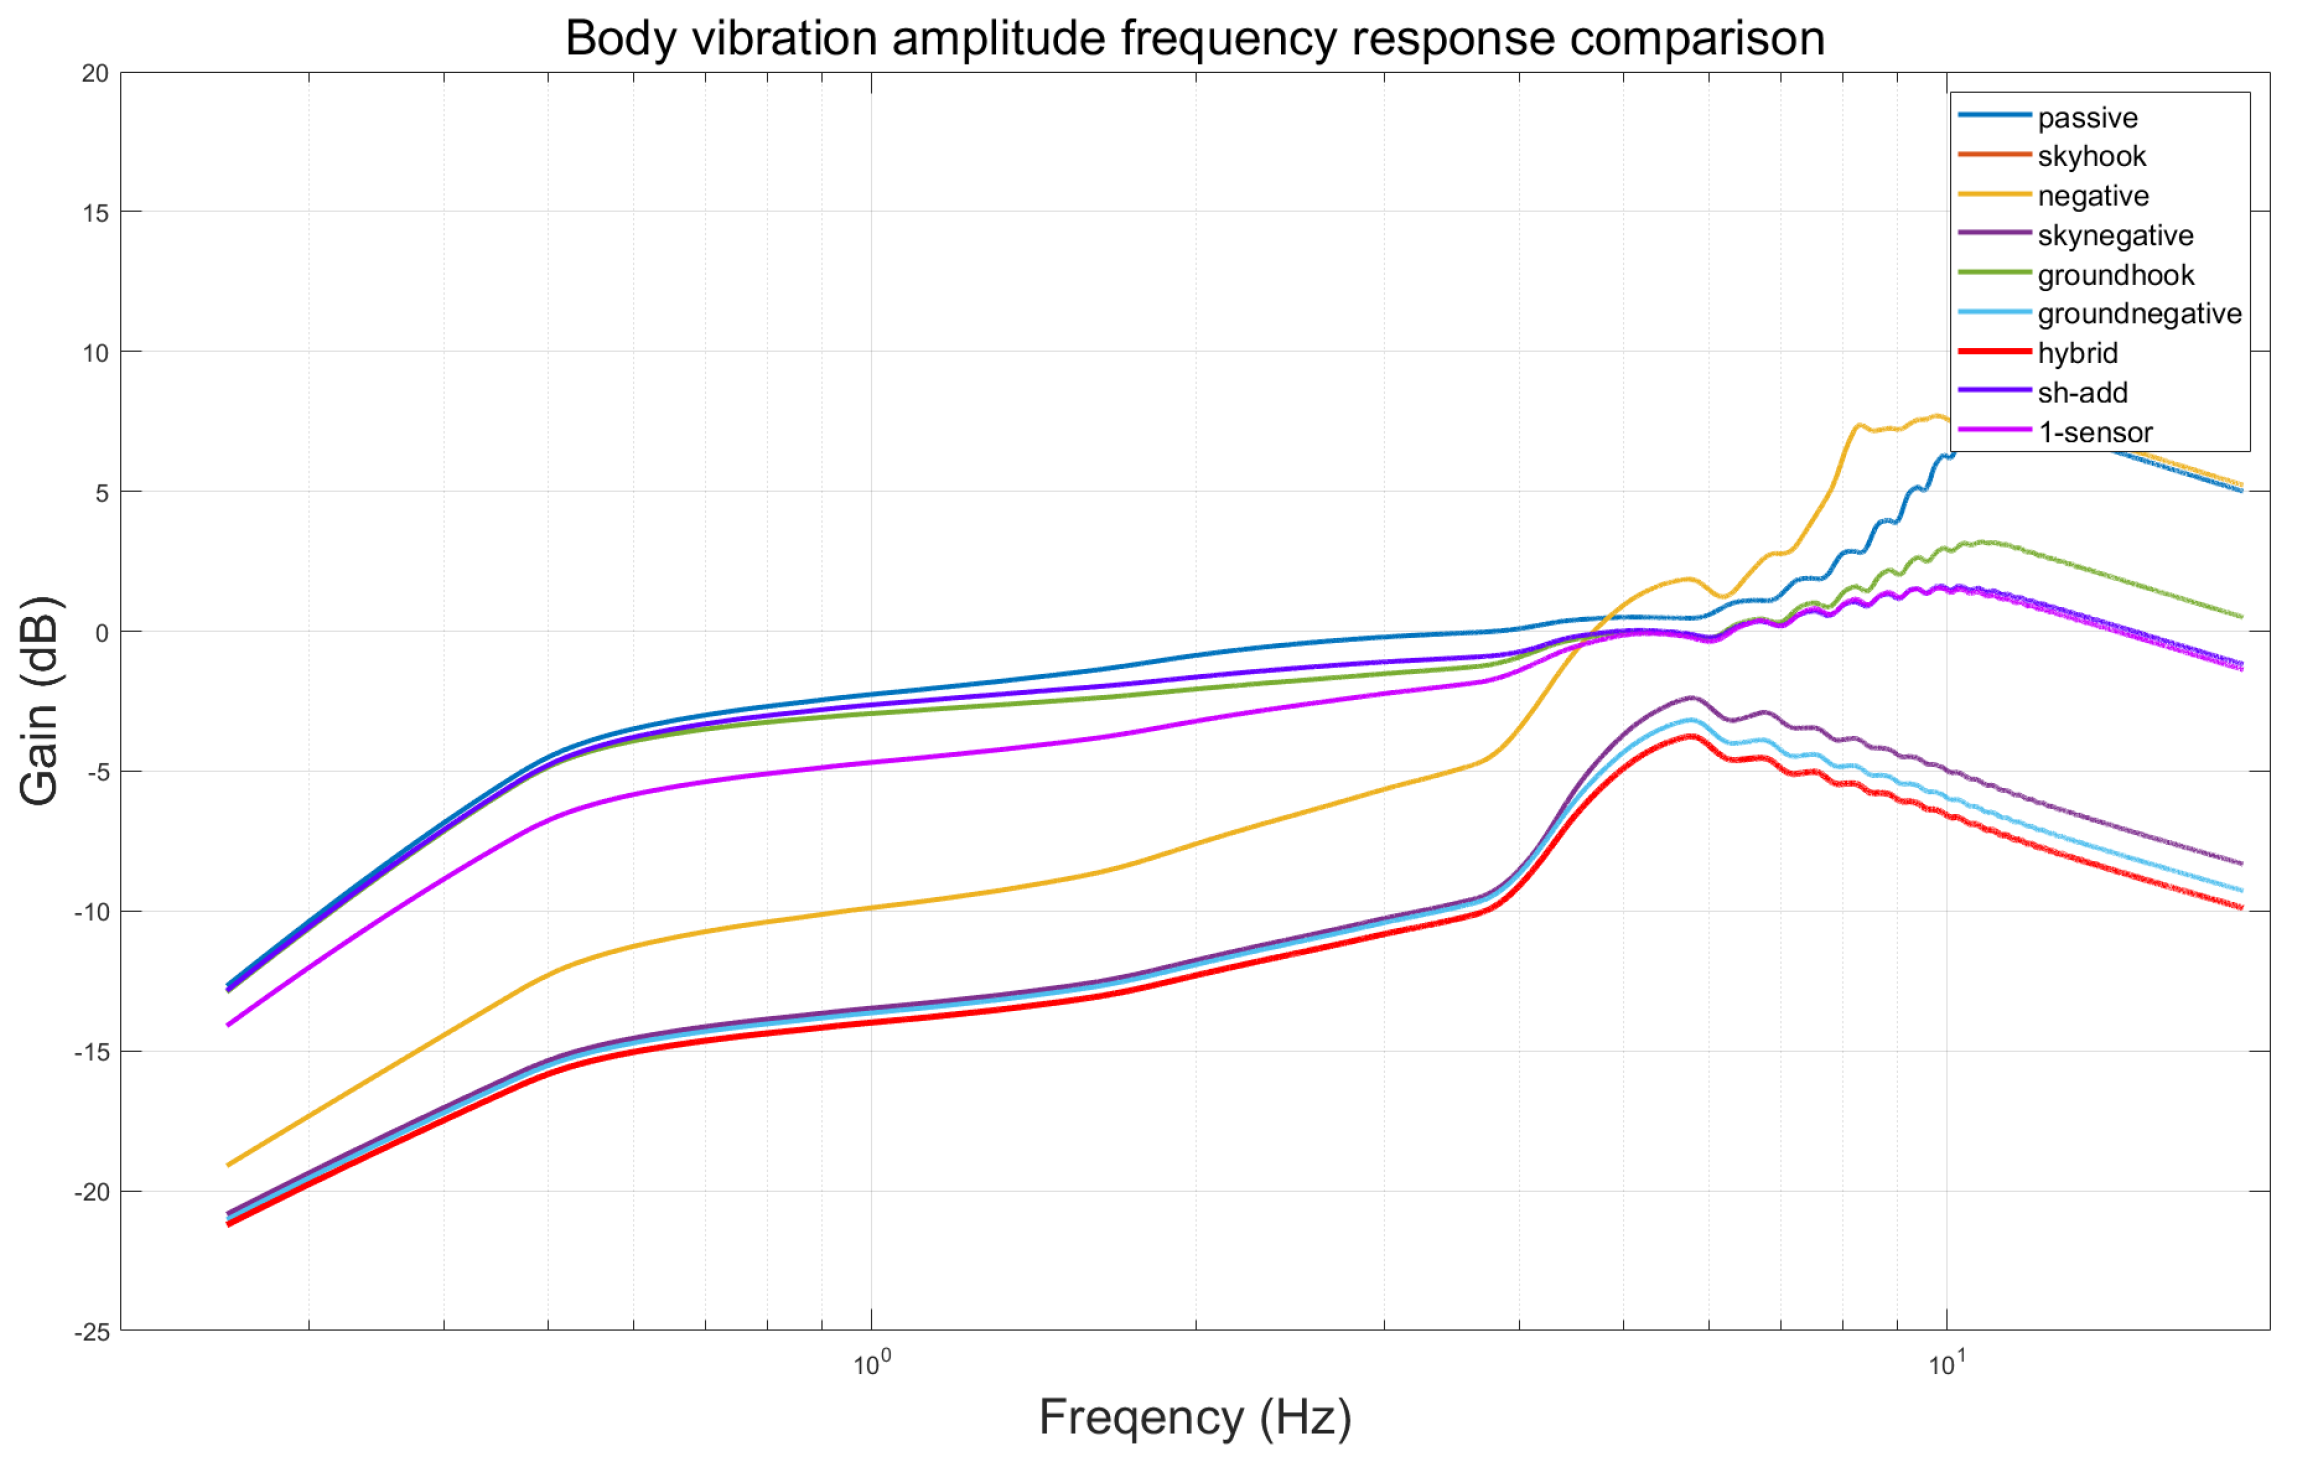
Figure 15.
Comparison of frequency response of body vibration amplitude.
Figure 15.
Comparison of frequency response of body vibration amplitude.
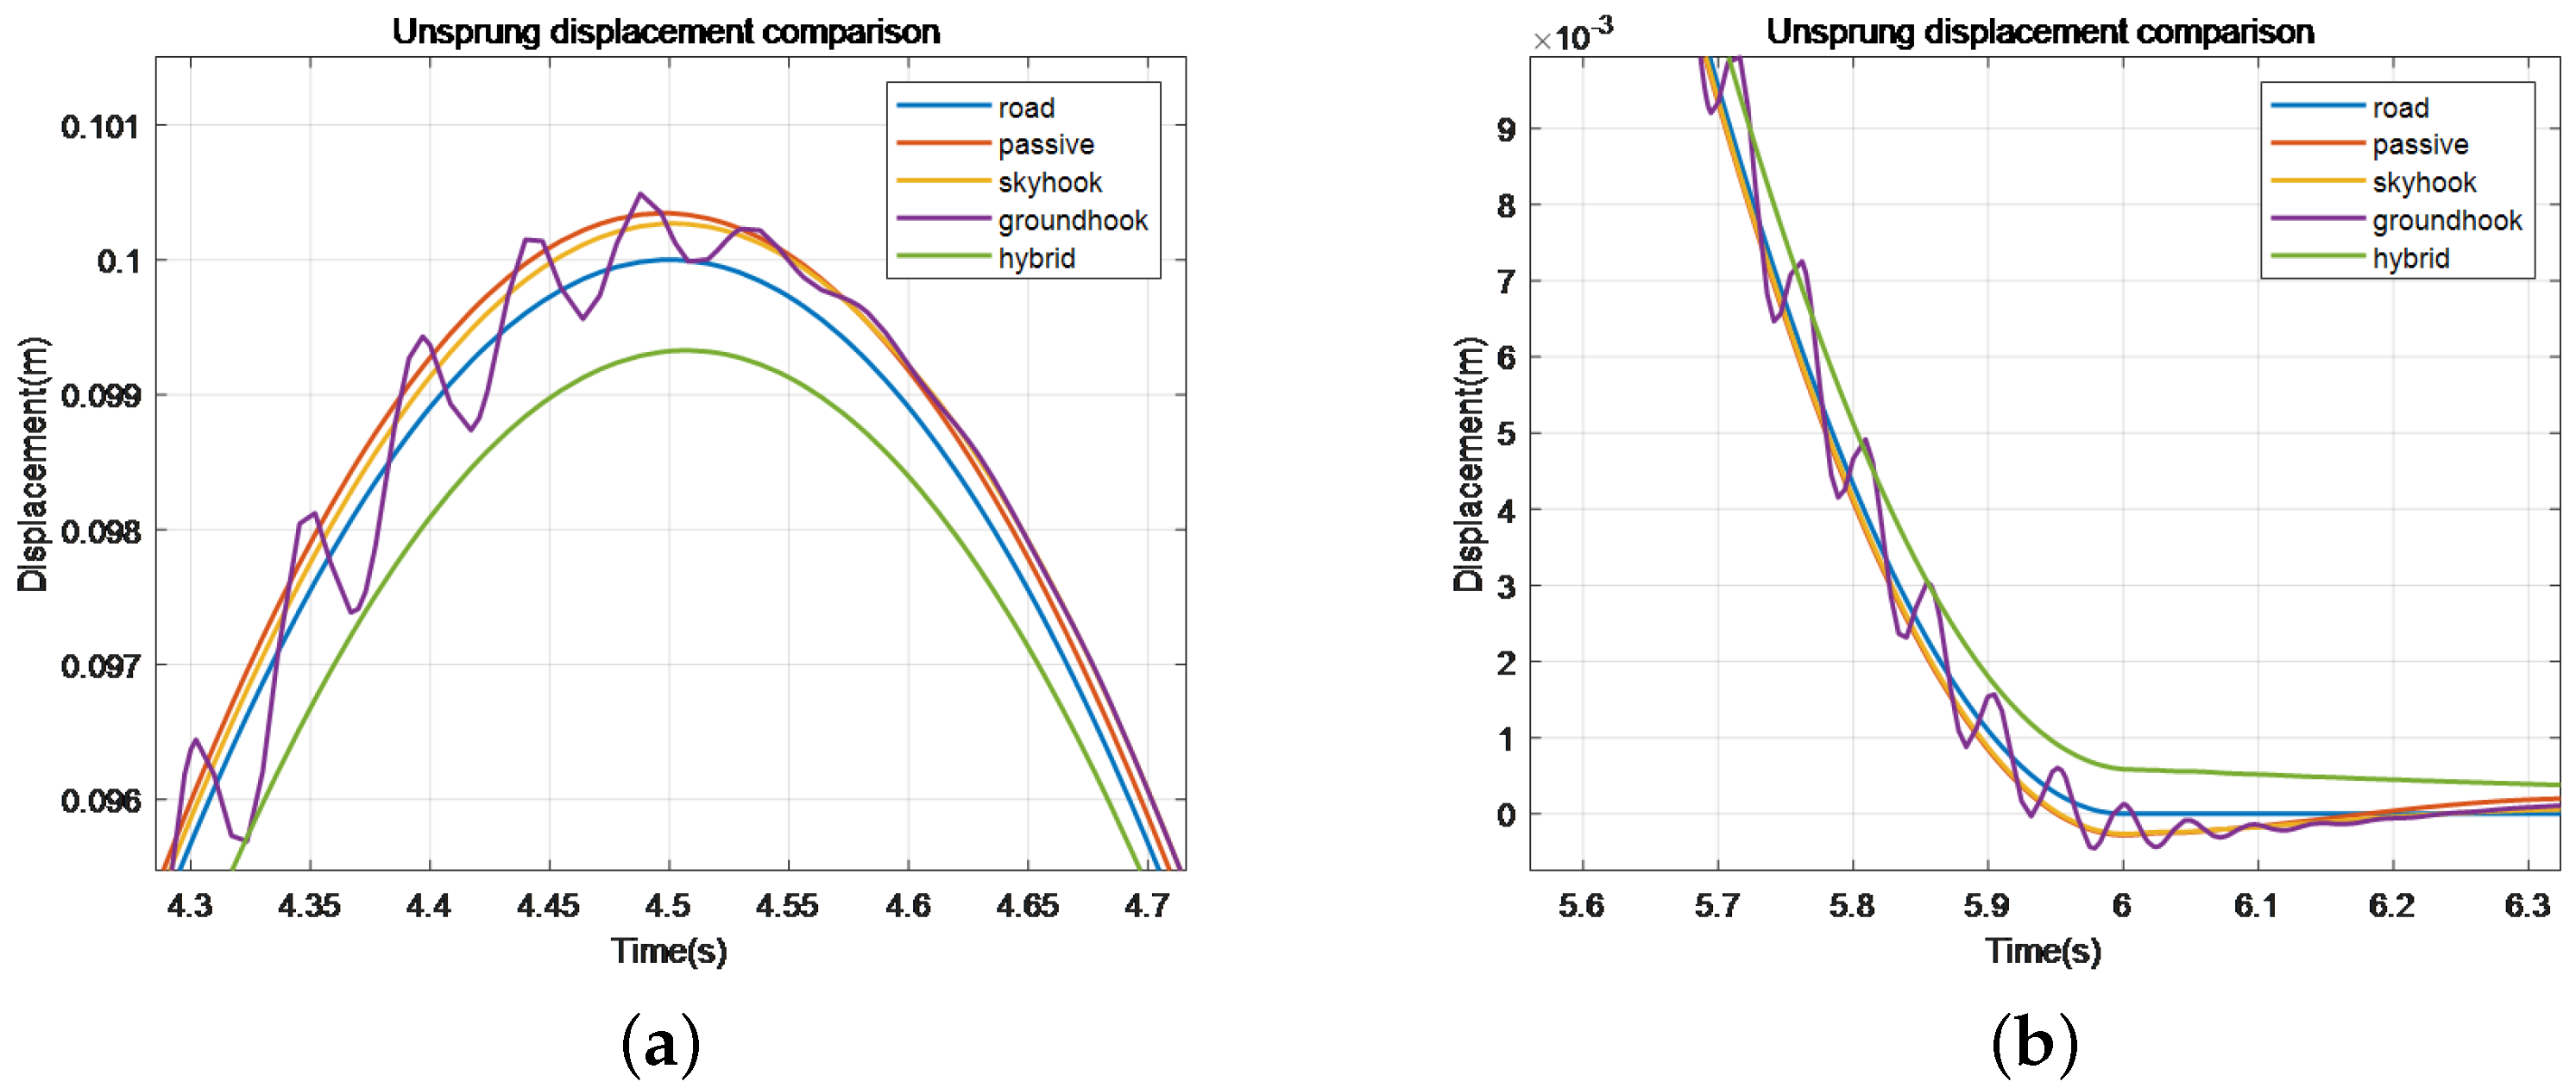
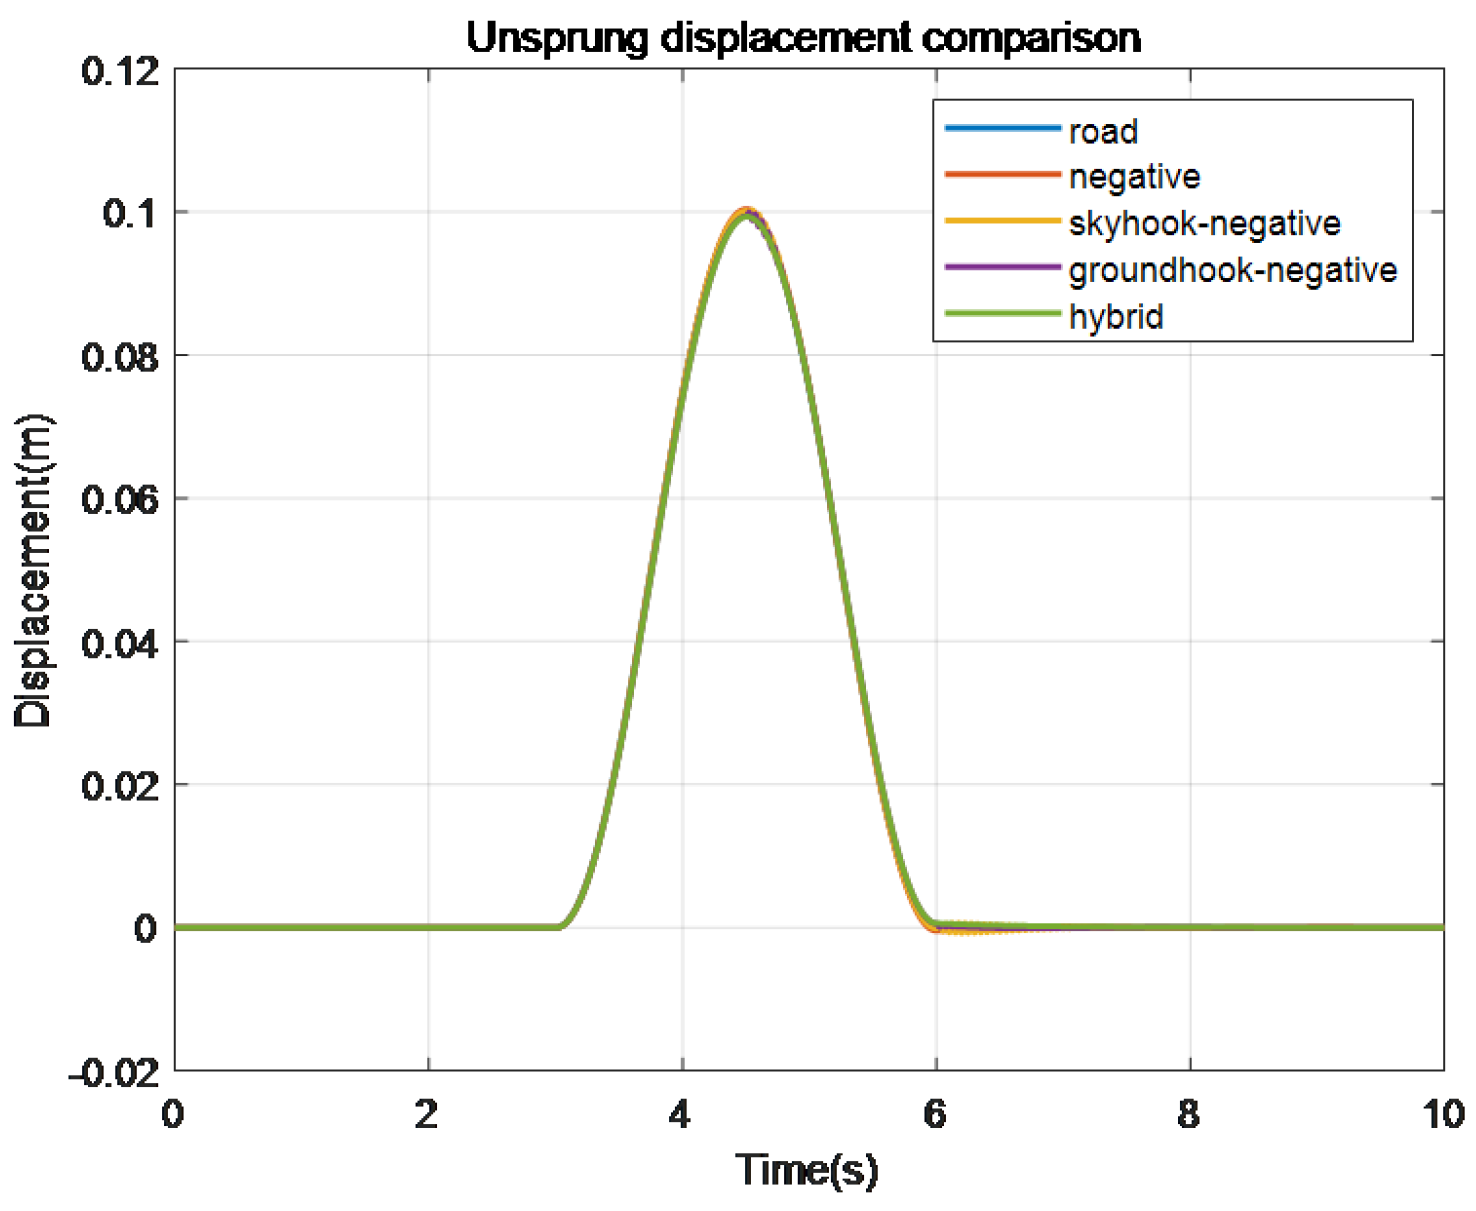
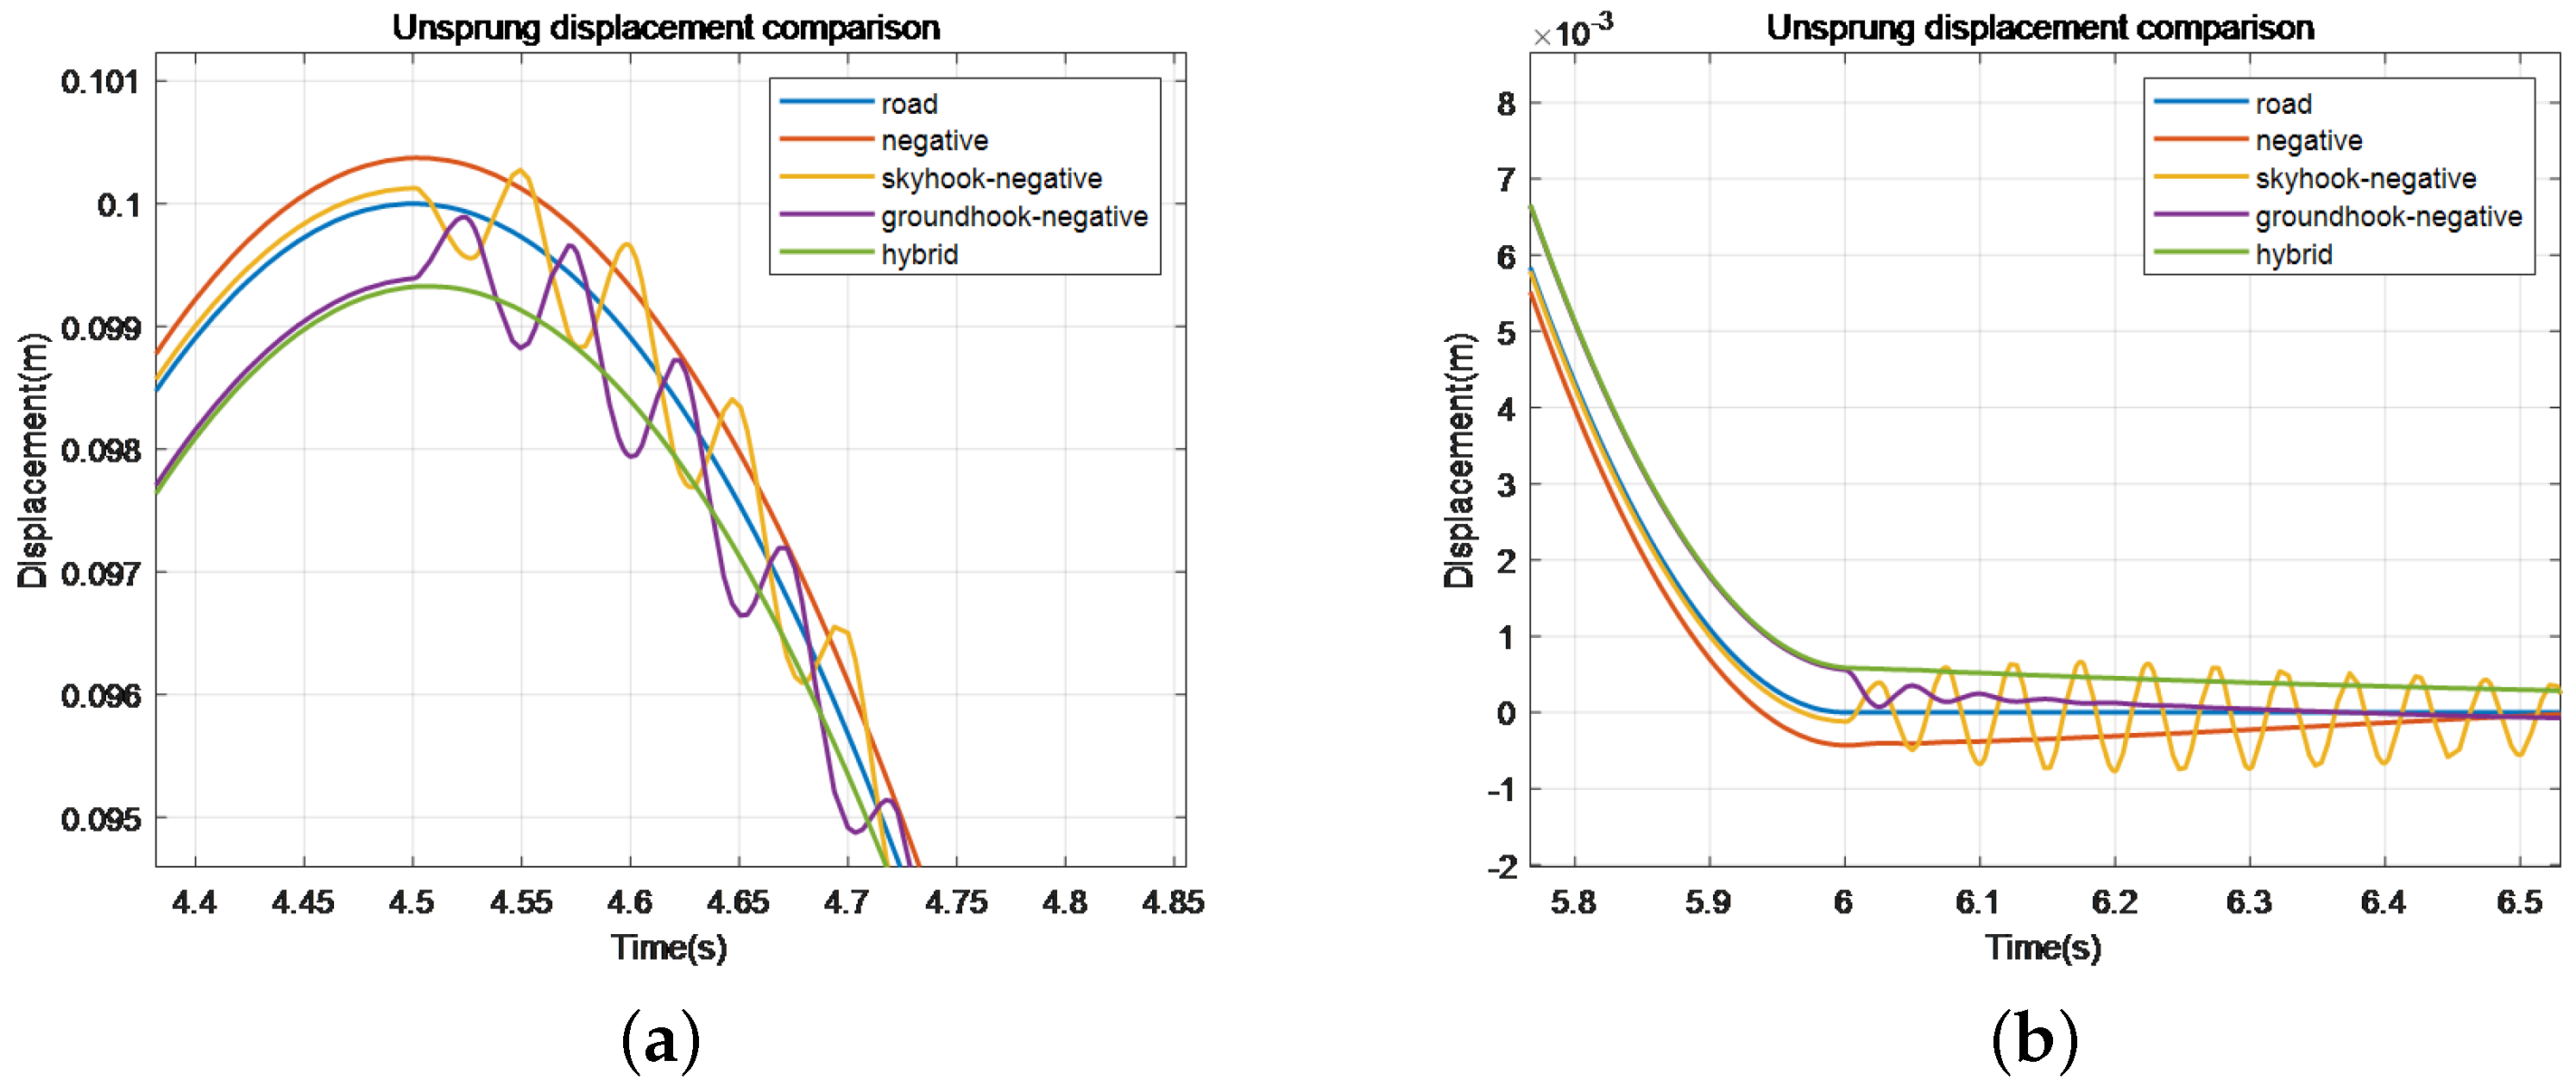
Figure 16.
Comparison of unsprung load displacement of different control methods.
Figure 16.
Comparison of unsprung load displacement of different control methods.
Figure 17.
Comparison of wheel dynamic deformation by different control methods.
Figure 17.
Comparison of wheel dynamic deformation by different control methods.
Figure 18.
Comparison of spring load displacement.
Figure 18.
Comparison of spring load displacement.
Figure 19.
Comparison of spring load speed.
Figure 19.
Comparison of spring load speed.
Figure 20.
Comparison of spring load acceleration.
Figure 20.
Comparison of spring load acceleration.
Figure 21.
Comparison of frequency response of body vibration amplitude.
Figure 21.
Comparison of frequency response of body vibration amplitude.
Figure 22.
Comparison of spring load displacement of different control methods. (a) Represents the original method, while (b) represents the negative stiffness method.
Figure 22.
Comparison of spring load displacement of different control methods. (a) Represents the original method, while (b) represents the negative stiffness method.
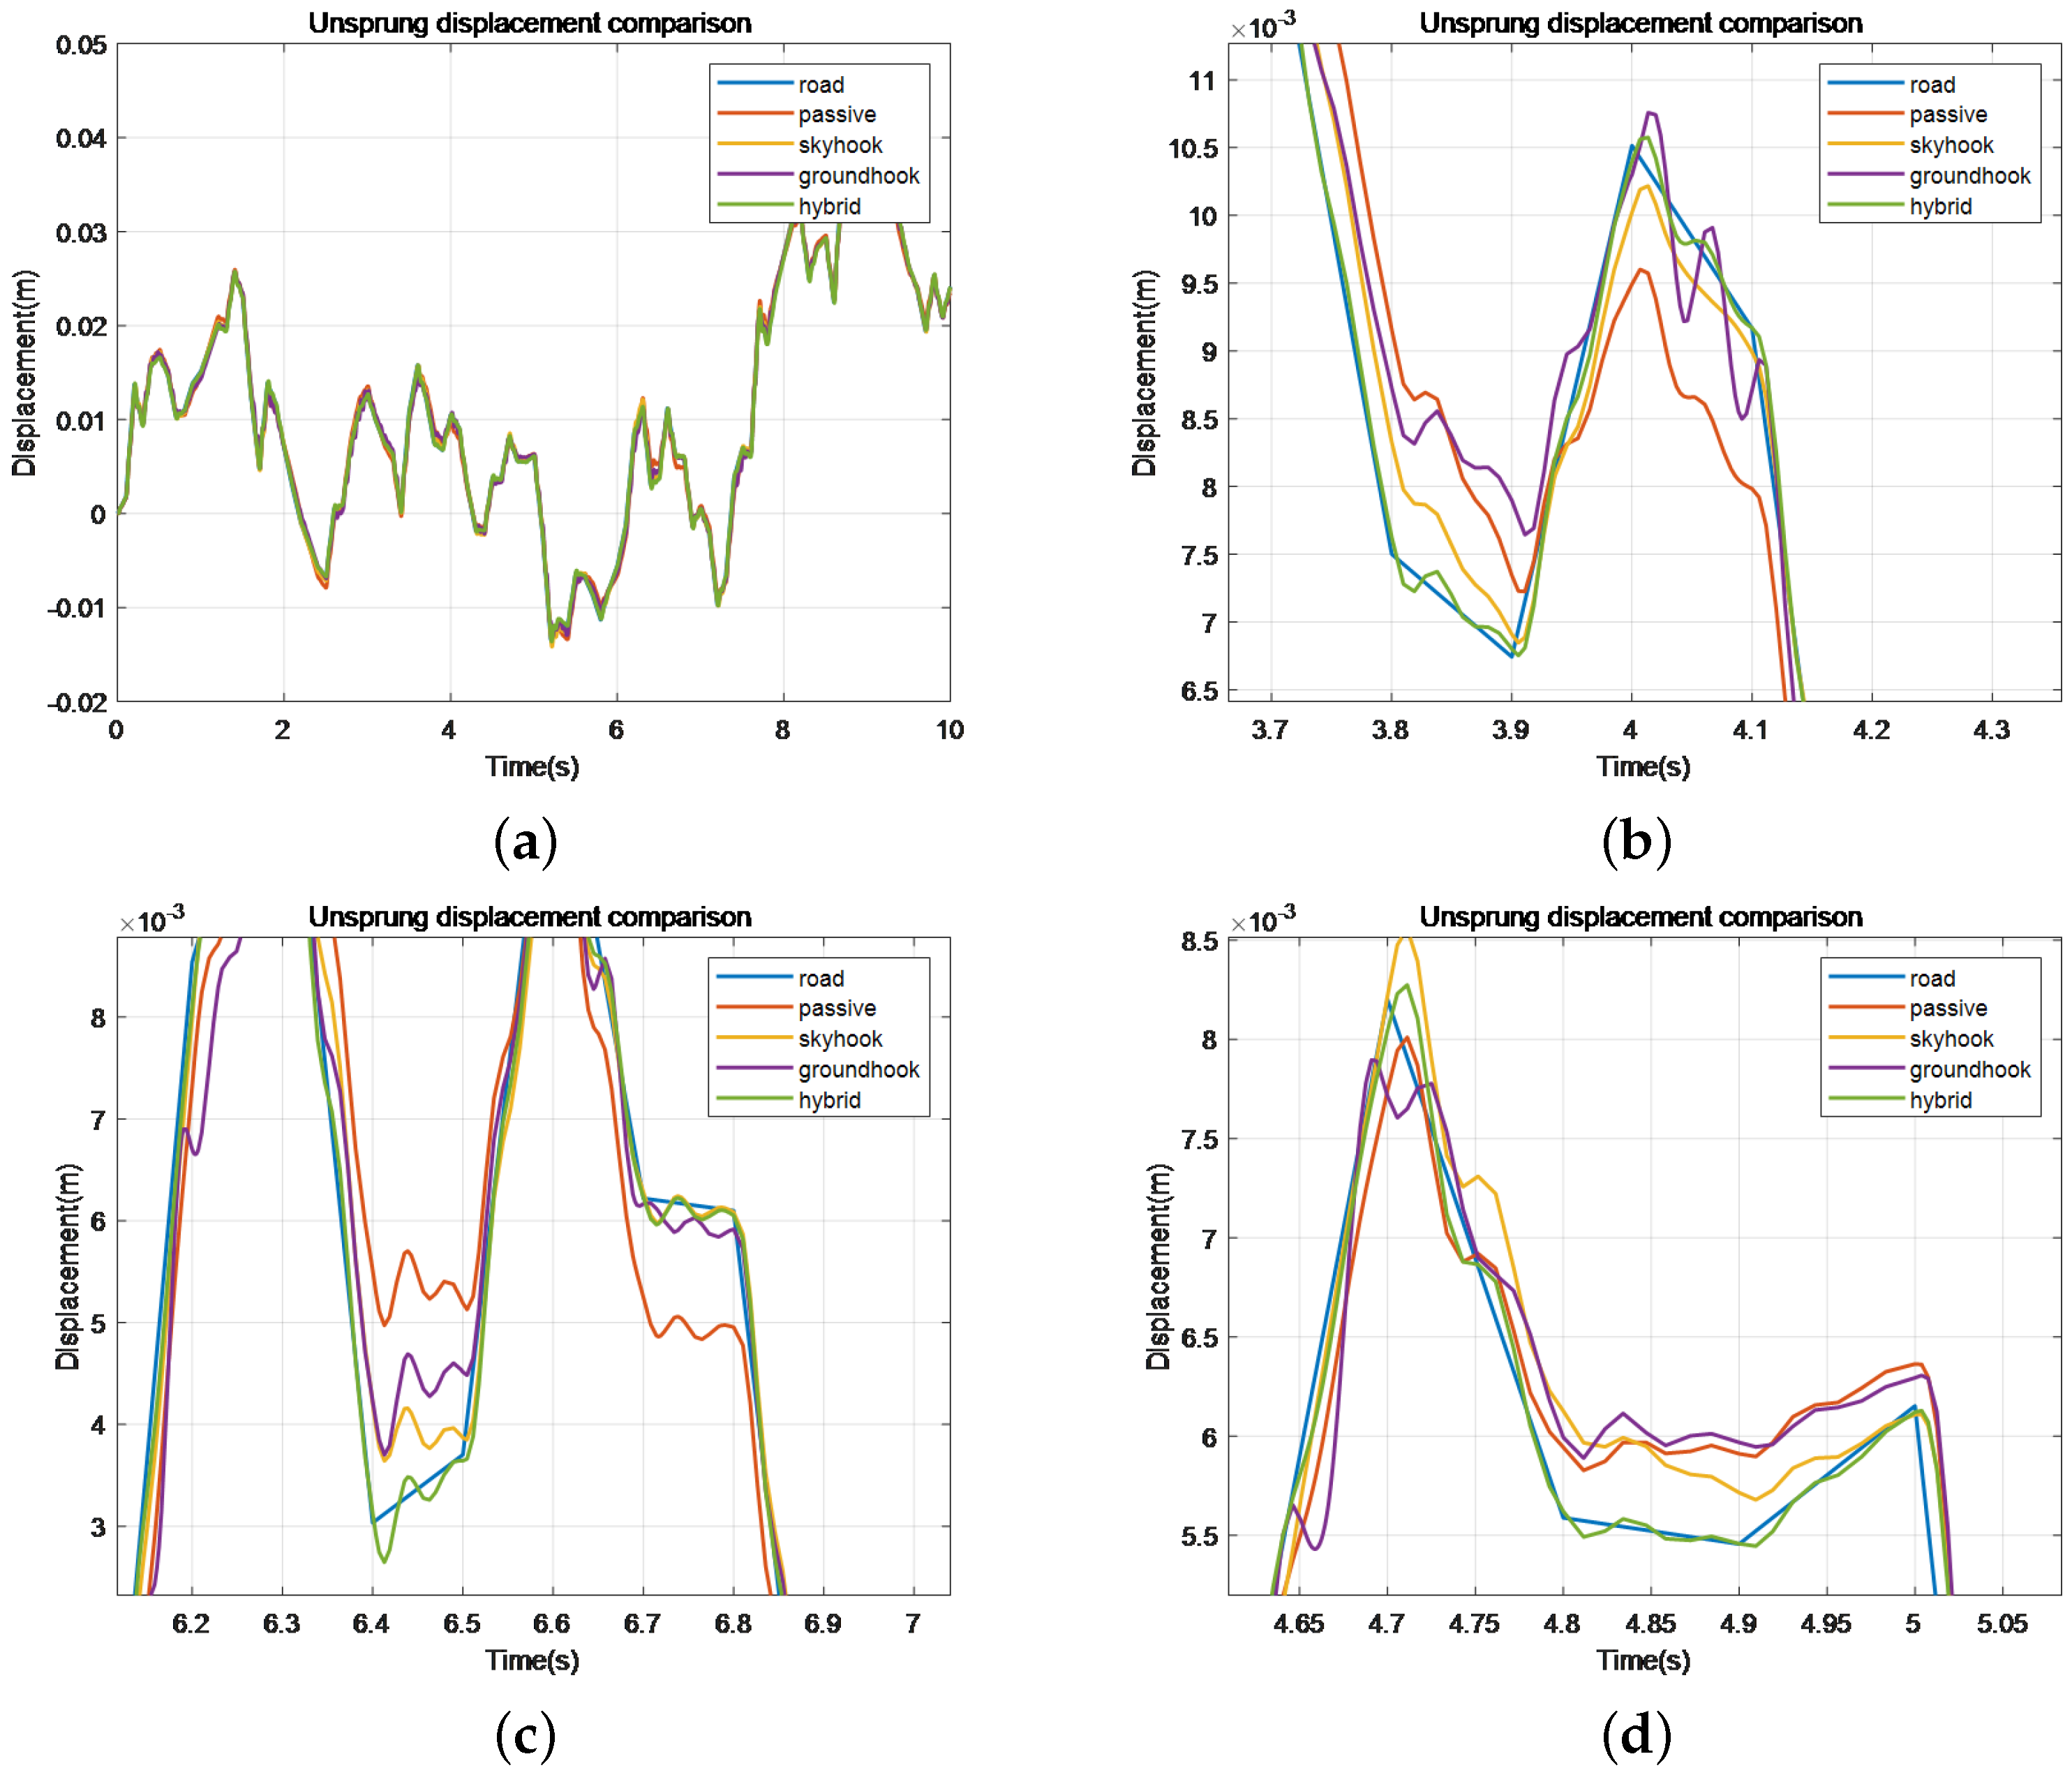
Figure 23.
Enlarge part. Figures (b–d) are magnified views of specific regions within (a). Figures (f–h) are magnified views of specific regions within (e).
Figure 23.
Enlarge part. Figures (b–d) are magnified views of specific regions within (a). Figures (f–h) are magnified views of specific regions within (e).
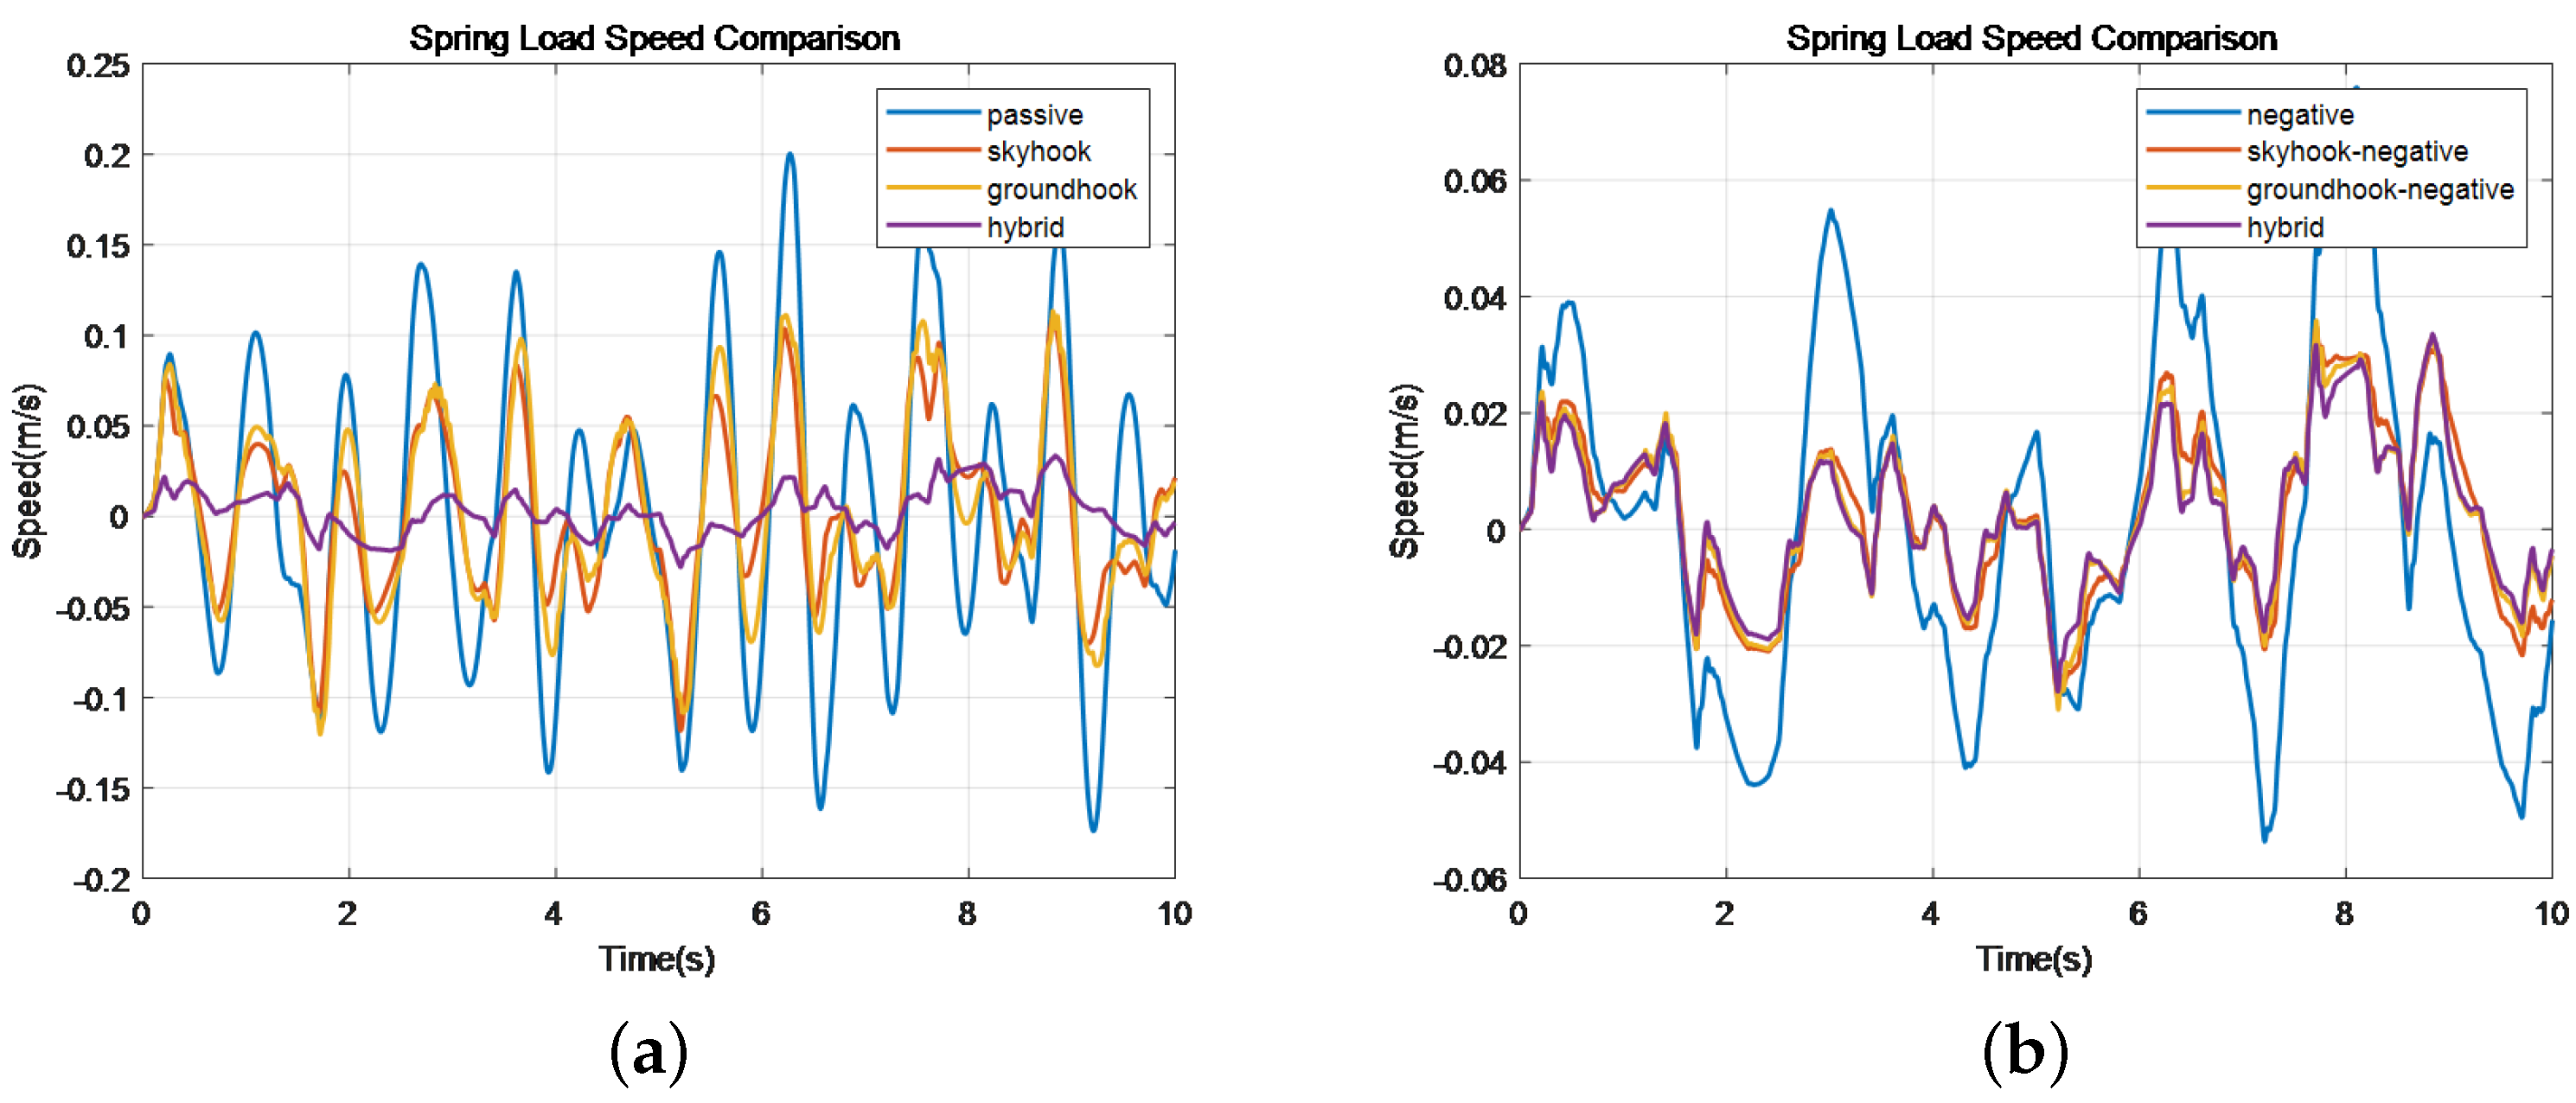
Figure 24.
Comparison of spring load speed of different control methods. (a) Represents the original method, while (b) represents the negative stiffness method.
Figure 24.
Comparison of spring load speed of different control methods. (a) Represents the original method, while (b) represents the negative stiffness method.
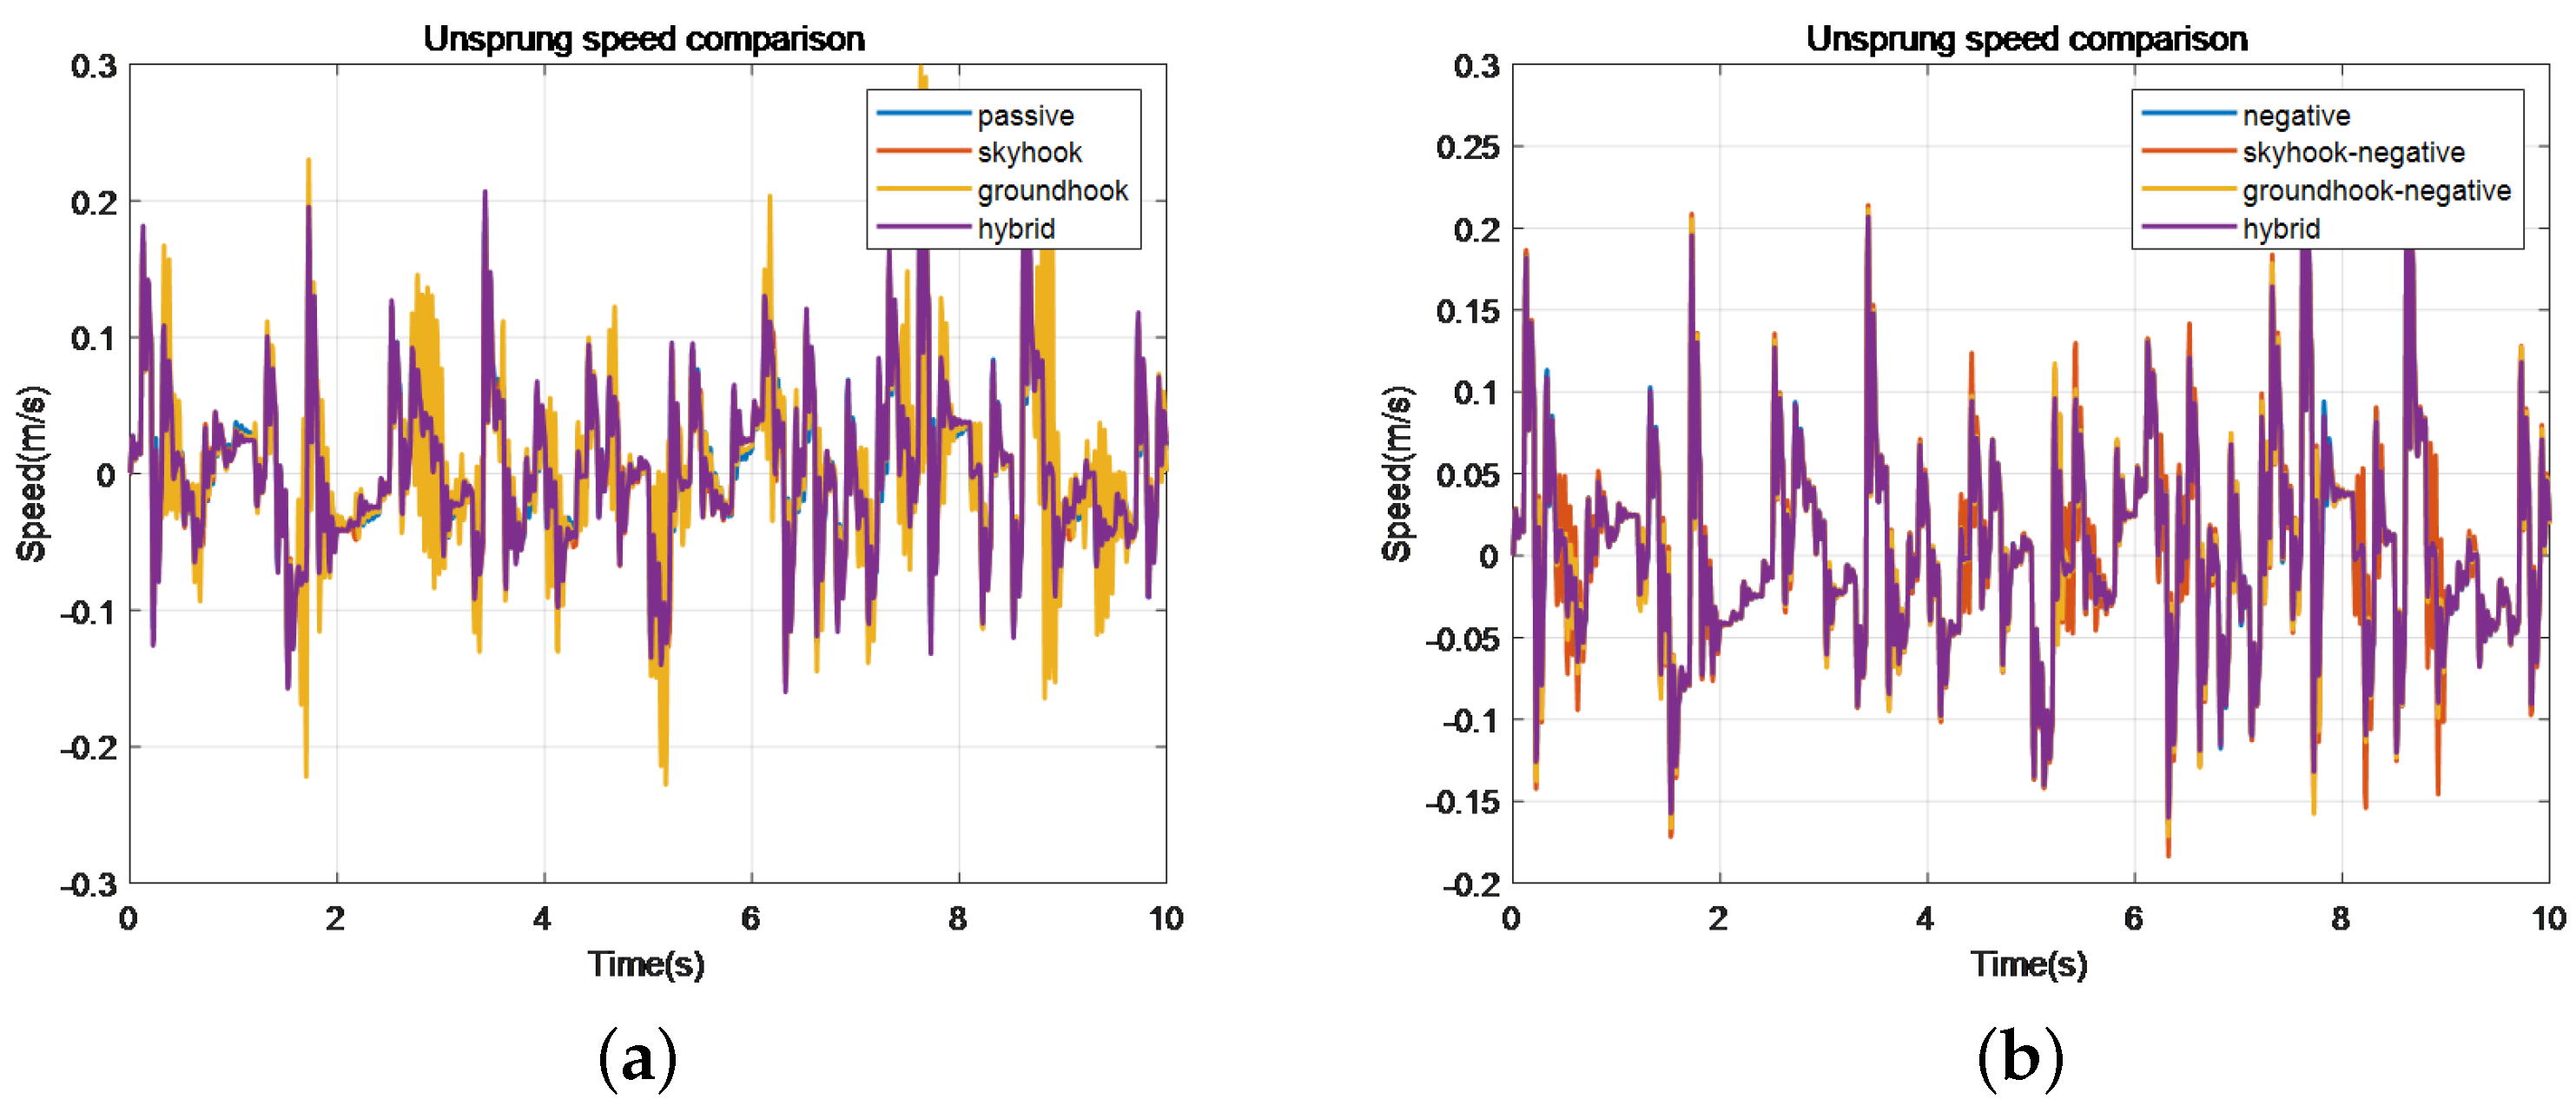
Figure 25.
Comparison of different control methods for unsprung load speed. (a) Represents the original method, while (b) represents the negative stiffness method.
Figure 25.
Comparison of different control methods for unsprung load speed. (a) Represents the original method, while (b) represents the negative stiffness method.
Figure 26.
Comparison of spring load acceleration of different control methods. (a) Represents the original method, while (b) represents the negative stiffness method.
Figure 26.
Comparison of spring load acceleration of different control methods. (a) Represents the original method, while (b) represents the negative stiffness method.
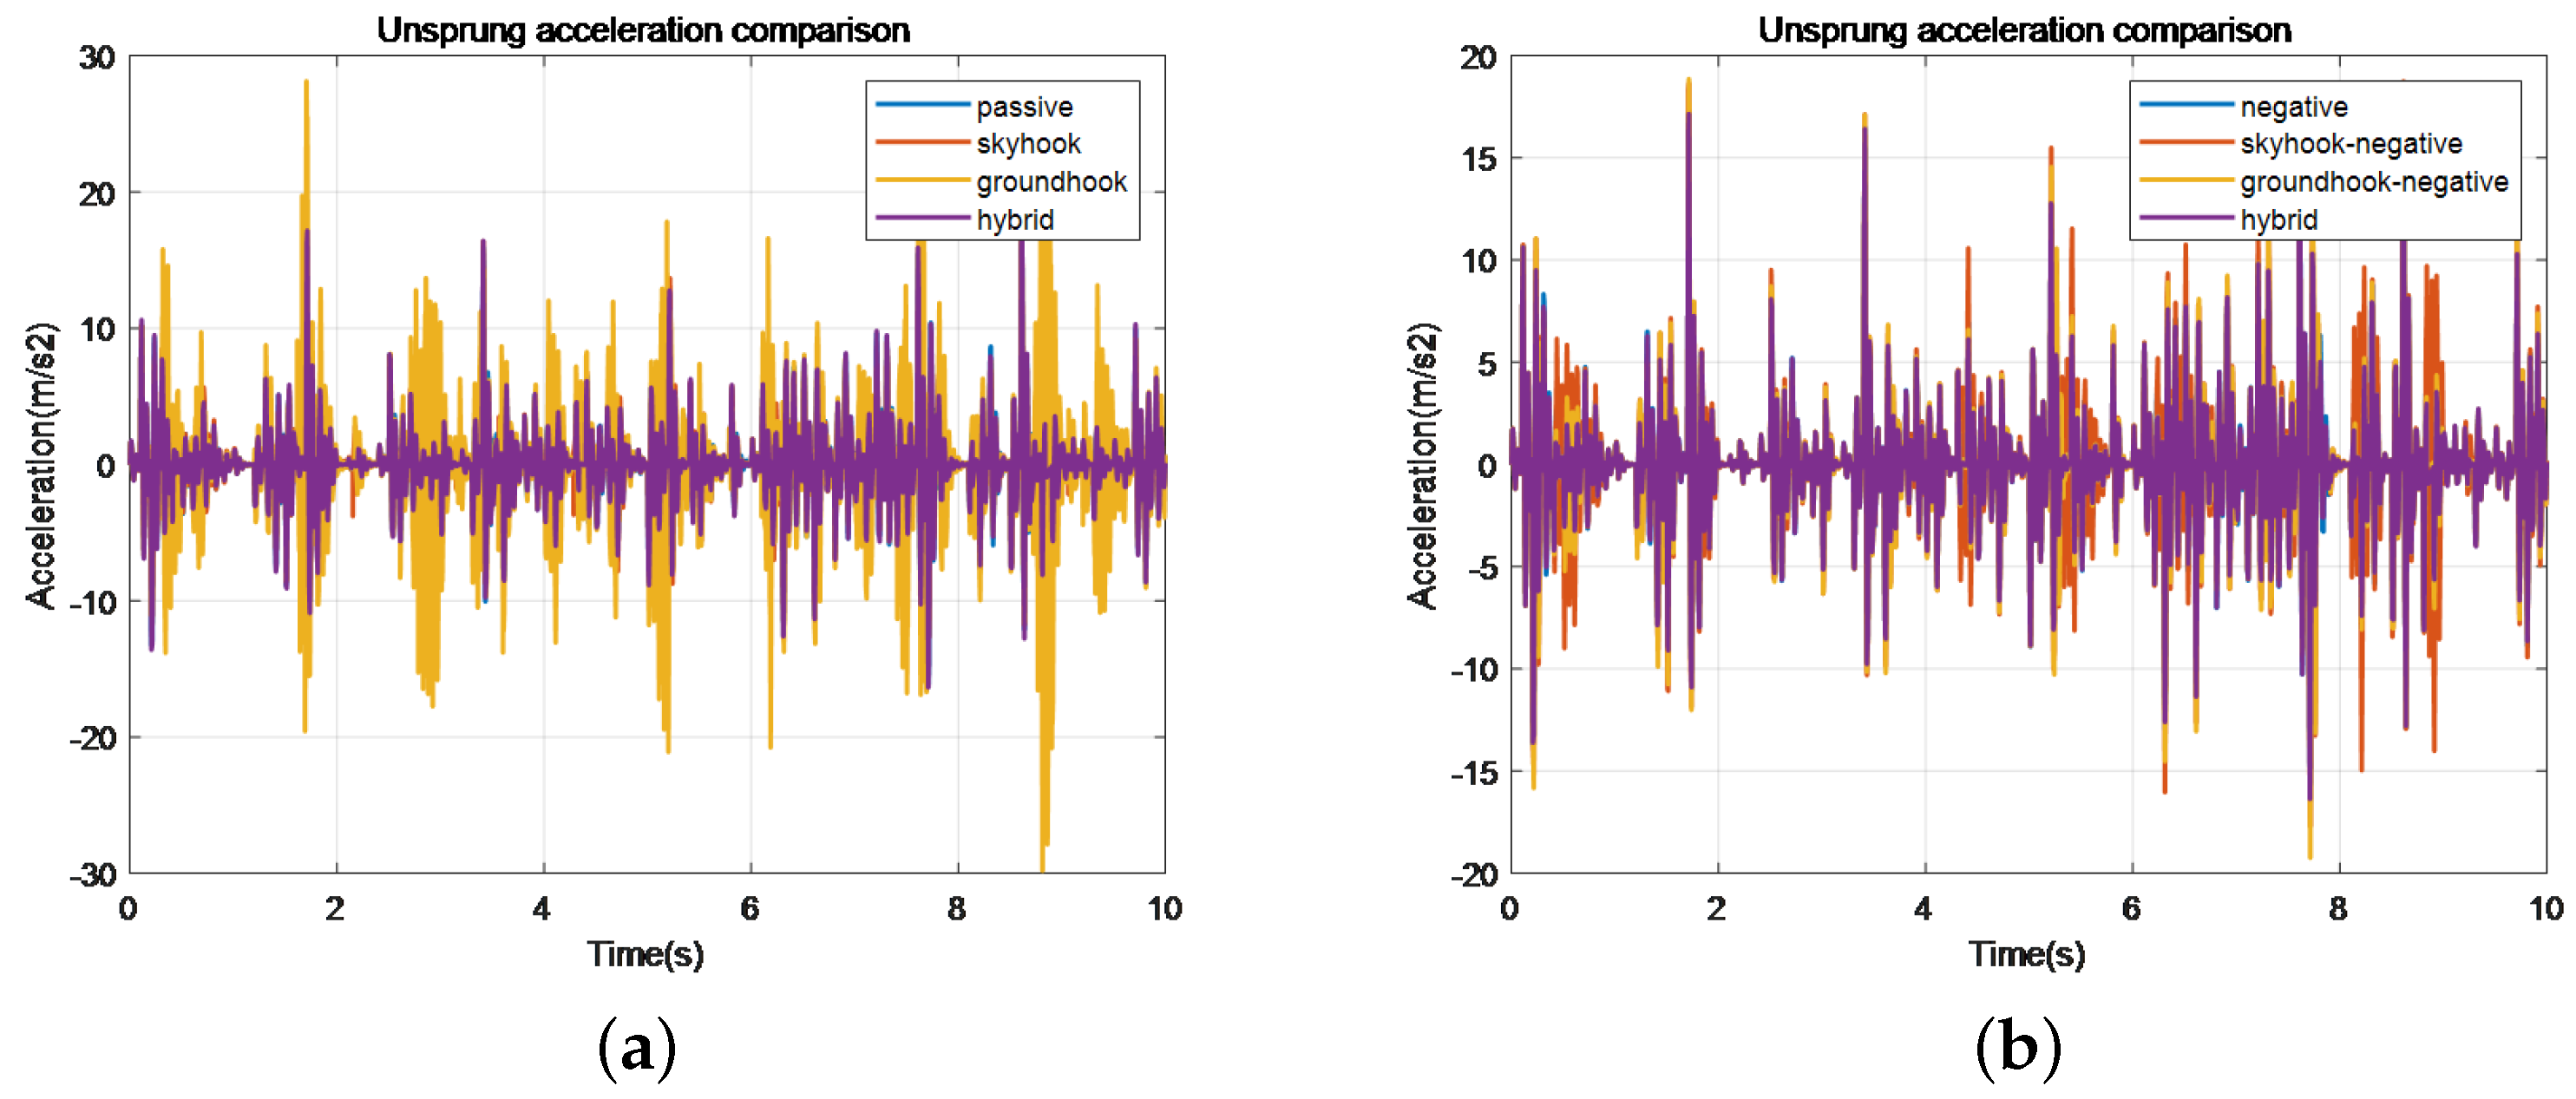
Figure 27.
Comparison of unsprung acceleration of different control methods. (a) Represents the original method, while (b) represents the negative stiffness method.
Figure 27.
Comparison of unsprung acceleration of different control methods. (a) Represents the original method, while (b) represents the negative stiffness method.
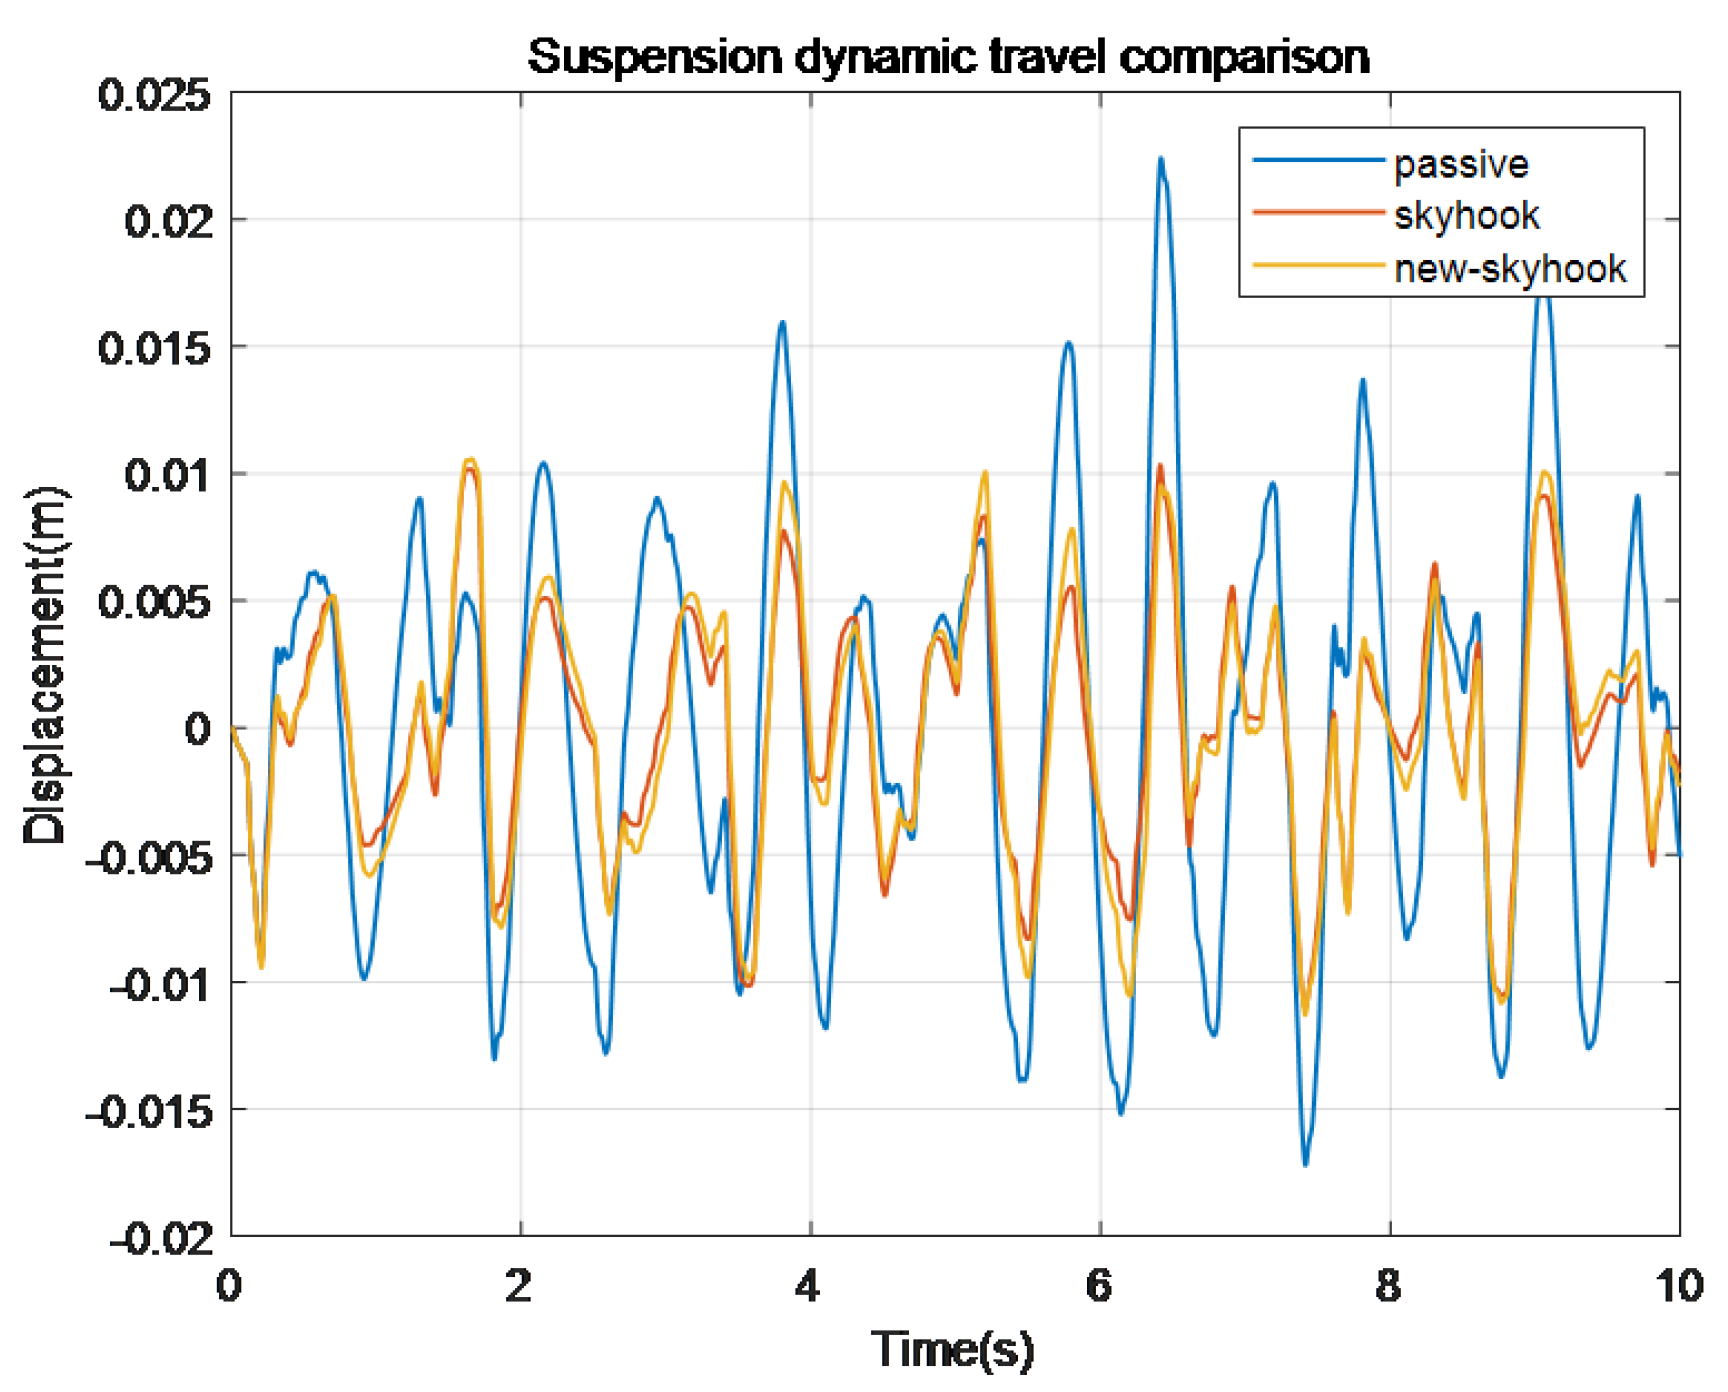
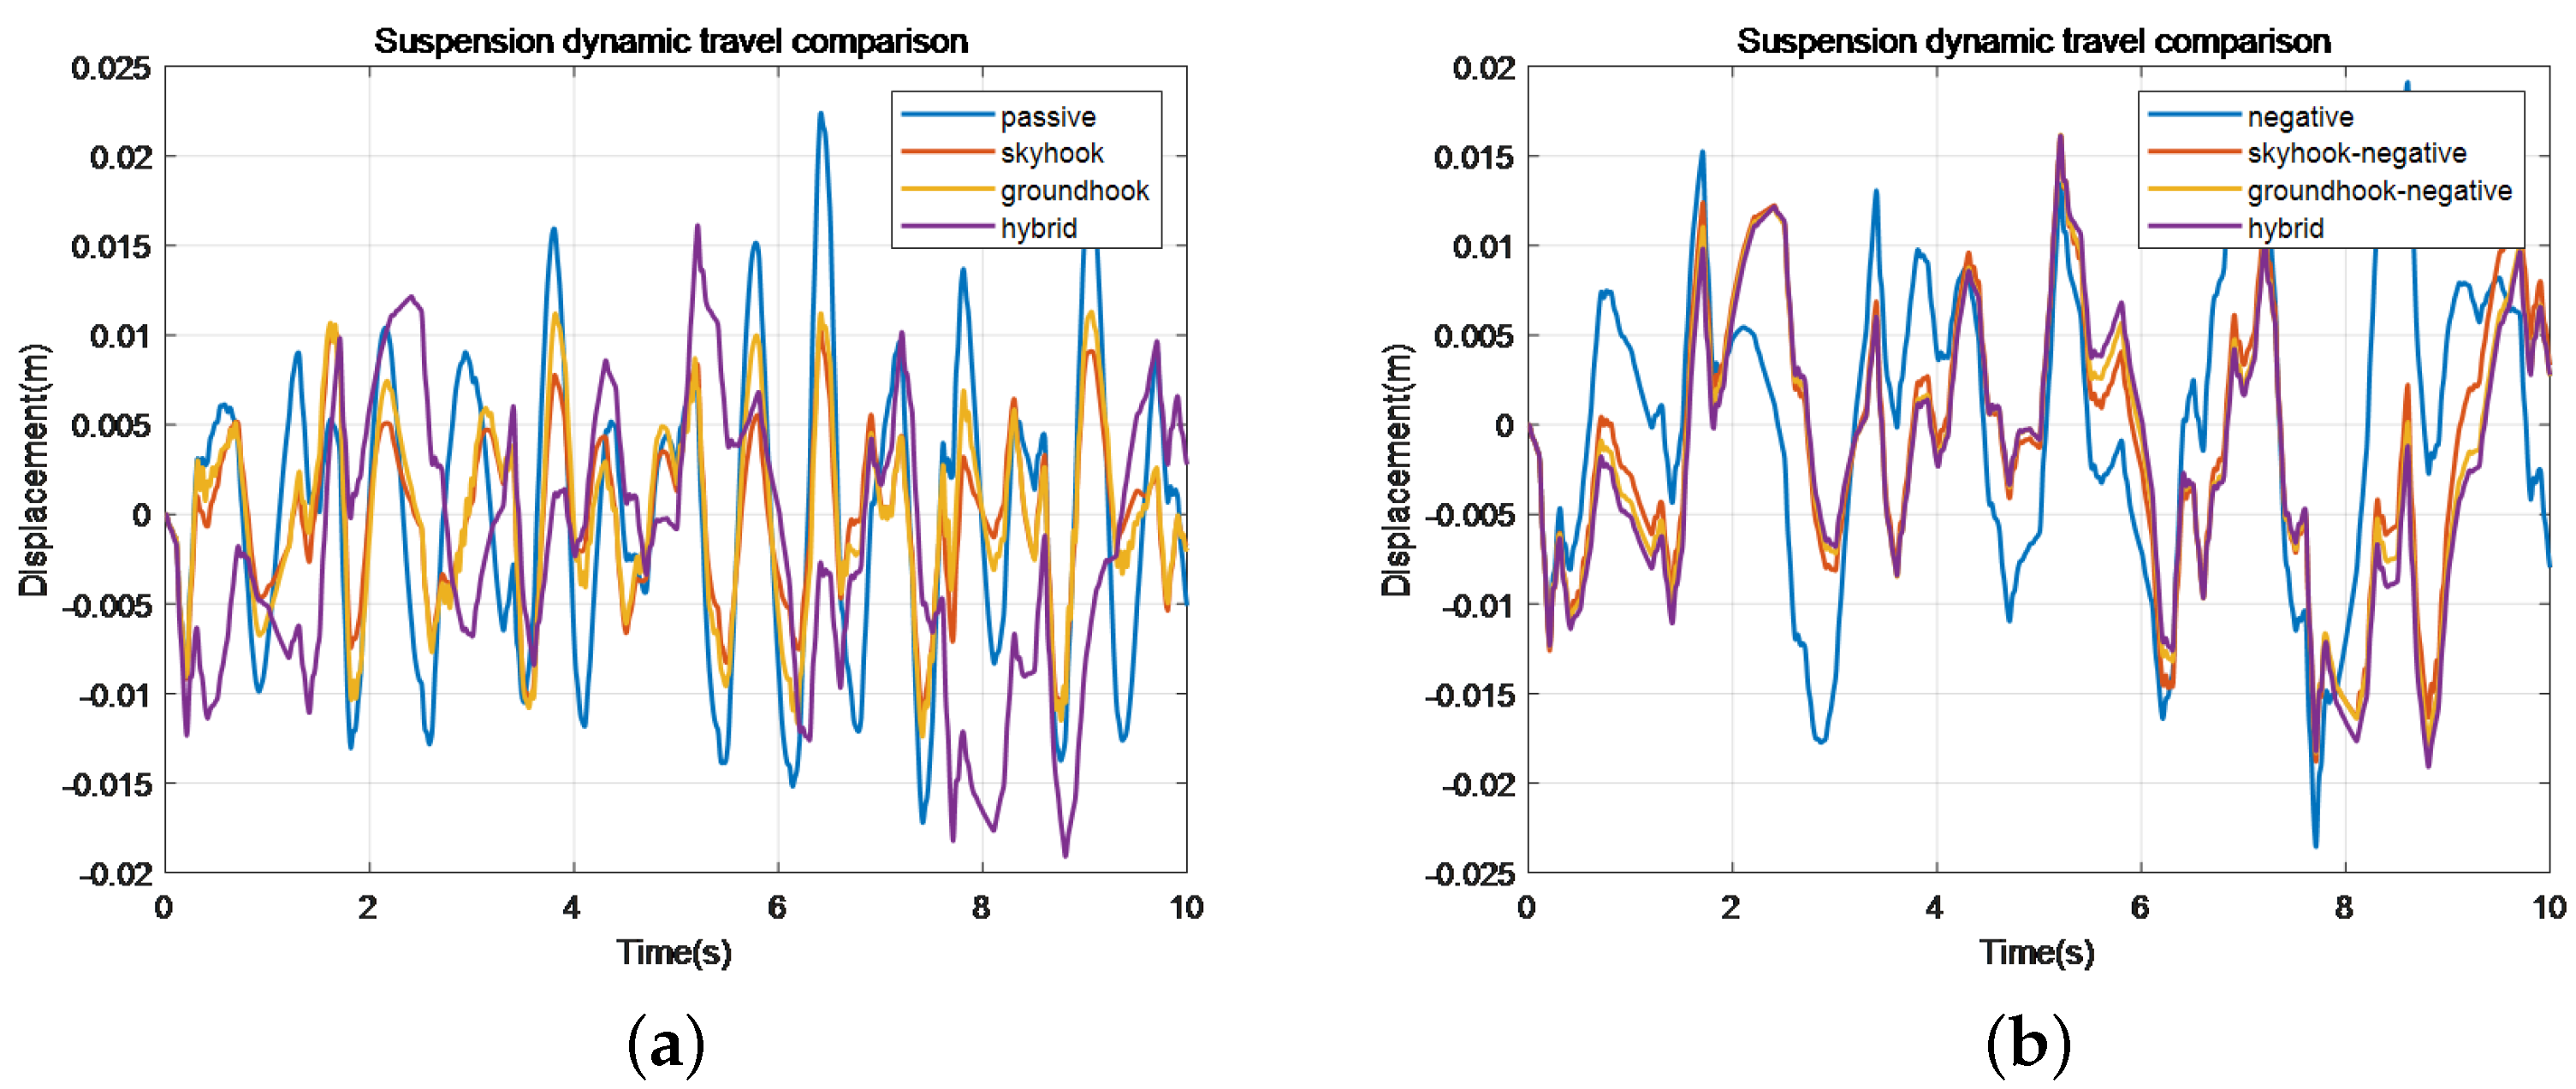
Figure 28.
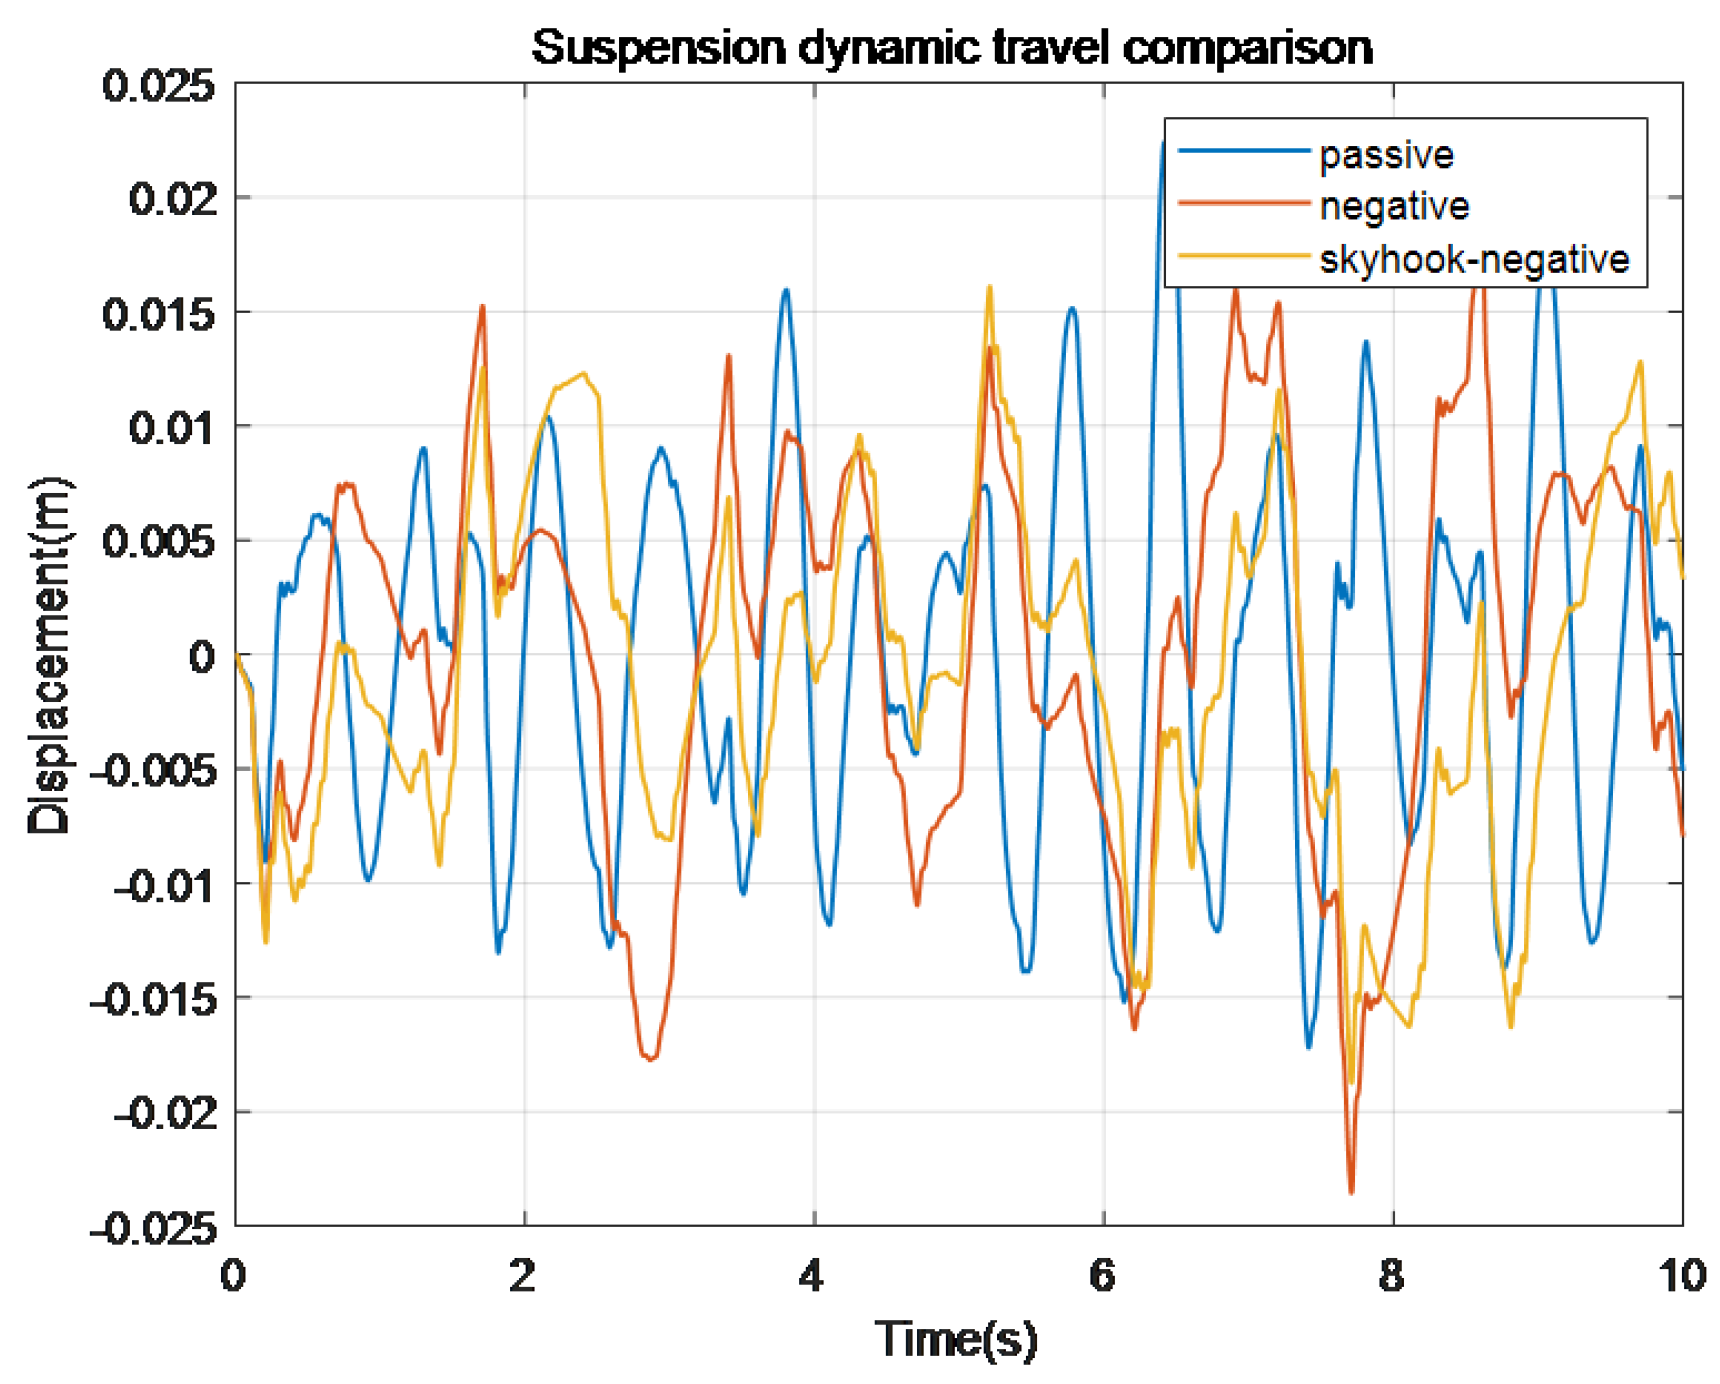
Comparison of suspension dynamic travel by different control methods. (a) Represents the original method, while (b) represents the negative stiffness method.
Figure 28.
Comparison of suspension dynamic travel by different control methods. (a) Represents the original method, while (b) represents the negative stiffness method.
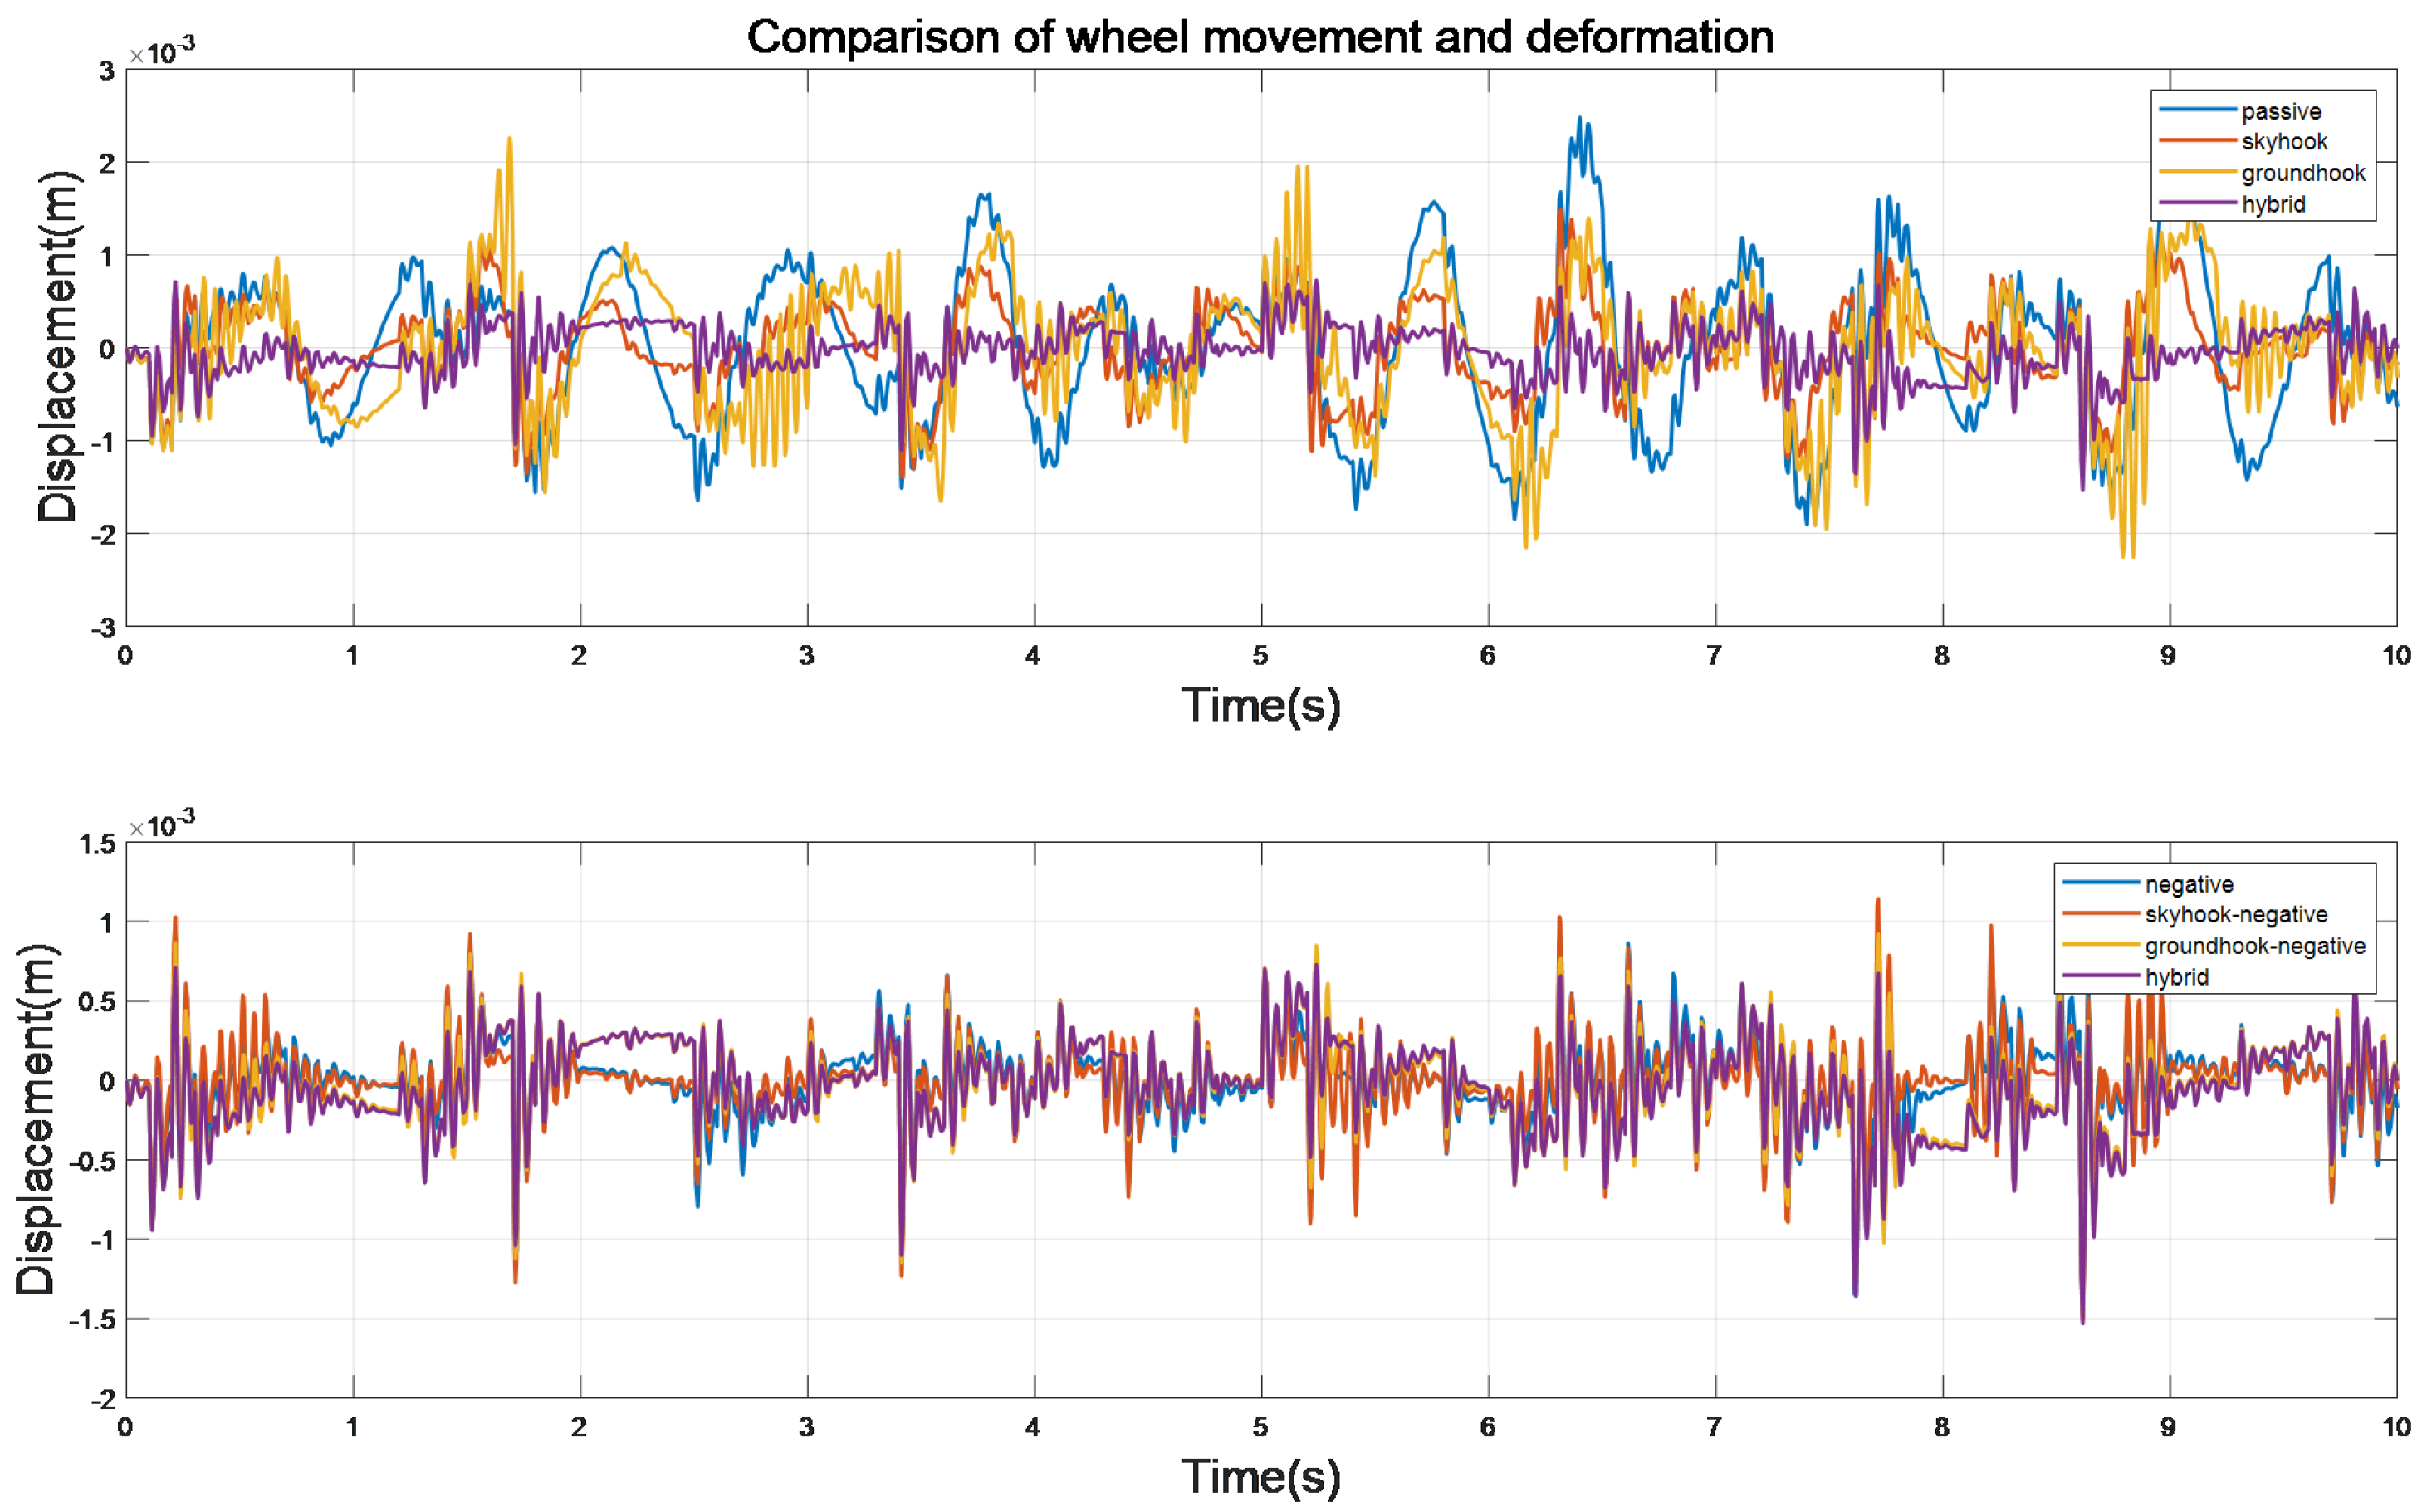
Figure 29.
Comparison of wheel dynamic deformation by different control methods.
Figure 29.
Comparison of wheel dynamic deformation by different control methods.
Figure 30.
Comparison of spring load displacement of different control methods. (a) Represents the original method, while (b) represents the negative stiffness method.
Figure 30.
Comparison of spring load displacement of different control methods. (a) Represents the original method, while (b) represents the negative stiffness method.
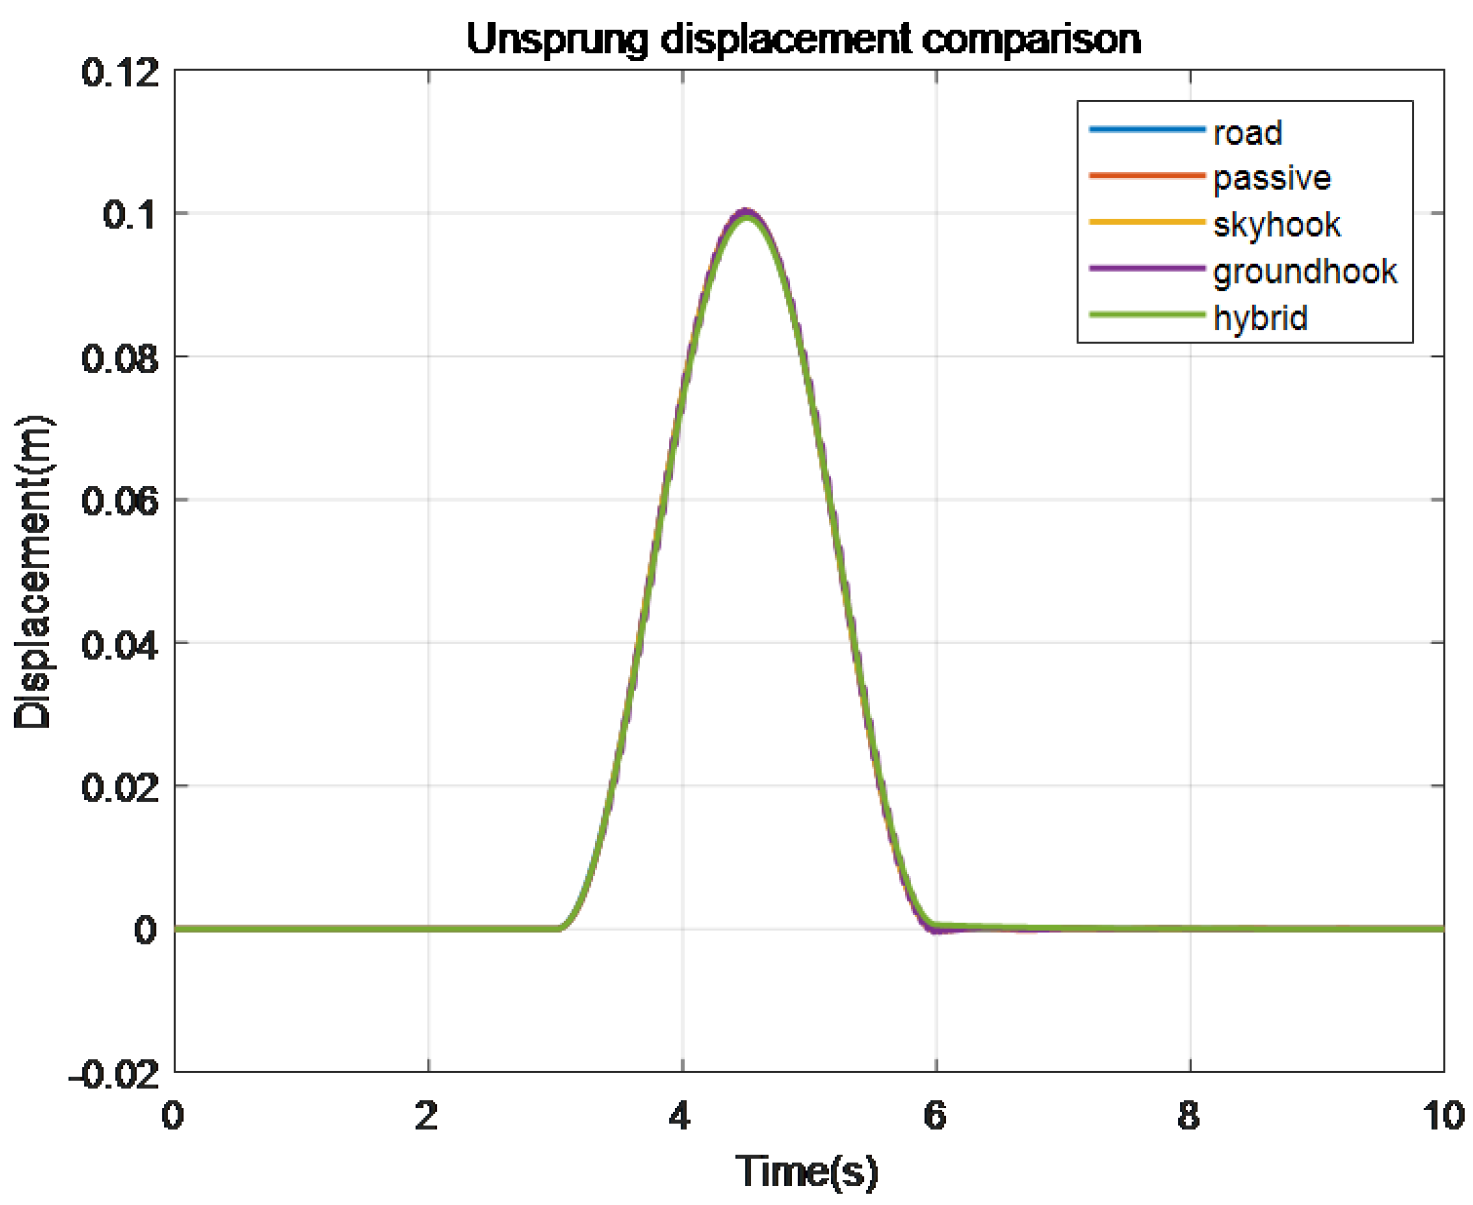
Figure 31.
Comparison of unsprung load displacement of different control methods I.
Figure 31.
Comparison of unsprung load displacement of different control methods I.
Figure 32.
Comparison of spring load displacement of different control methods about local dynamic plot (a,b).
Figure 32.
Comparison of spring load displacement of different control methods about local dynamic plot (a,b).
Figure 33.
Comparison of unsprung load displacement of different control methods II.
Figure 33.
Comparison of unsprung load displacement of different control methods II.
Figure 34.
Comparison of spring load displacement of different control methods about local dynamic plot (a,b).
Figure 34.
Comparison of spring load displacement of different control methods about local dynamic plot (a,b).
Figure 35.
Comparison of frequency response of body vibration amplitude.
Figure 35.
Comparison of frequency response of body vibration amplitude.
Table 1.
Results of each index.
Table 1.
Results of each index.
| Methods | Displacement | Speed | Acceleration |
|---|
|
RMS
|
Optimization
|
RMS
|
Optimization
|
RMS
|
Optimization
|
|---|
| Passive | 0.0154 | —— | 0.0851 | —— | 0.7157 | —— |
| Skyhook | 0.0137 | 11.04% | 0.0538 | 36.78% | 0.4194 | 41.40% |
| Negative | 0.0158 | −2.60% | 0.0303 | 64.39% | 0.1534 | 78.57% |
| Sky-negative | 0.011 | 28.57% | 0.0157 | 81.55% | 0.0942 | 86.84% |
Table 2.
Various types of suspension dynamic travel indicators.
Table 2.
Various types of suspension dynamic travel indicators.
| Methods | General | Methods | Negative Stiffness |
|---|
| RMS/10−4 |
Optimization
|
RMS/10−4 |
Optimization
|
|---|
| Passive | 79 | —— | negative | 89 | —— |
| Skyhook | 51 | 35.44% |
| Groundhook | 56 | 29.11% | new-negative | 79 | 11.24% |
Table 3.
Table of root mean square values of wheel dynamic deformation.
Table 3.
Table of root mean square values of wheel dynamic deformation.
| Methods | Passive | Groundhook | Gro-Negative |
|---|
| RMS/10−4 | 7.90 | 7.70 | 7.61 |
Table 4.
Comparison of spring-loaded and unsprung displacement values.
Table 4.
Comparison of spring-loaded and unsprung displacement values.
| Methods | Spring Load Displacement | Unsprung Displacement |
|---|
|
RMS
|
Optimization
|
RMS
|
Optimization
|
|---|
| Passive | 0.02 | —— | 0.01 | —— |
| Skyhook | 0.01 | 10.39% | 0.01 | 0.0000% |
| Groundhook | 0.01 | 7.79% | 0.01 | 0.74% |
| Negative | 0.02 | −2.60% | 0.01 | 0.00% |
| S-Negative | 0.01 | 28.57% | 0.01 | 0.74% |
| G-Negative | 0.01 | 35.06% | 0.01 | 0.00% |
| Hybrid | 0.01 | 38.96% | 0.01 | 0.74% |
Table 5.
Comparison of spring-loaded and unsprung speed values.
Table 5.
Comparison of spring-loaded and unsprung speed values.
| Methods | Spring Load Speed | Unsprung Speed |
|---|
|
RMS
|
Optimization
|
RMS
|
Optimization
|
|---|
| Passive | 0.09 | —— | 0.06 | —— |
| Skyhook | 0.05 | 35.25% | 0.06 | 4.22% |
| Groundhook | 0.05 | 31.49% | 0.06 | 11.07% |
| Negative | 0.03 | 64.28% | 0.05 | 1.93% |
| S-Negative | 0.016 | 81.19% | 0.06 | 5.27% |
| G-Negative | 0.01 | 82.49% | 0.05 | 1.58% |
| Hybrid | 0.01 | 83.78% | 0.05 | 0.17% |
Table 6.
Comparison of spring load acceleration and unsprung load acceleration values.
Table 6.
Comparison of spring load acceleration and unsprung load acceleration values.
| Methods | Spring Load Acceleration | Unsprung Acceleration |
|---|
|
RMS
|
Optimization
|
RMS
|
Optimization
|
|---|
| Passive | 0.72 | —— | 3.02 | —— |
| Skyhook | 0.42 | 41.00% | 2.97 | −1.83% |
| Groundhook | 0.46 | 35.33% | 6.30 | 108.53% |
| Negative | 0.15 | 78.39% | 3.14 | 4.02% |
| S-Negative | 0.09 | 86.83% | 3.66 | 21.01% |
| G-Negative | 0.11 | 85.19% | 3.24 | 7.17% |
| Hybrid | 0.09 | 86.83% | 3.06 | 1.10% |
Table 7.
Comparison of the control effects of various control methods of suspension dynamic travel and wheel dynamic deformation.
Table 7.
Comparison of the control effects of various control methods of suspension dynamic travel and wheel dynamic deformation.
| Methods | Suspension Dynamic Travel | Wheel Movement Deformation |
|---|
|
RMS/10−4 |
Optimization
|
RMS/10−4 |
Optimization
|
|---|
| Passive | 82 | —— | 8.34 | —— |
| Skyhook | 54 | 34.15% | 4.99 | 40.13% |
| Groundhook | 61 | 25.61% | 8.27 | 0.86% |
| Negative | 93 | −13.41% | 2.54 | 69.59% |
| S-Negative | 82 | 0.00% | 2.51 | 69.87% |
| G-Negative | 80 | 2.44% | 2.89 | 65.29% |
| Hybrid | 81 | 1.22% | 2.83 | 66.01% |
Table 8.
Spring-loaded and unsprung acceleration indicators for various methods.
Table 8.
Spring-loaded and unsprung acceleration indicators for various methods.
| Methods | Spring Load Acceleration | Unsprung Acceleration |
|---|
|
RMS
|
Degree of Change
|
RMS
|
Degree of Change
|
|---|
| Passive | 0.13 | —— | 0.09 | —— |
| Skyhook | 0.24 | −84.62% | 3.46 | −3487.90% |
| Groundhook | 0.45 | −246.23% | 14.45 | −14,839.50% |
| Negative | 0.20 | −52.76% | 0.09 | −0.10% |
| S-Negative | 0.12 | 11.00% | 1.55 | −1500.73% |
| G-Negative | 0.10 | 19.84% | 0.89 | −824.61% |
| Hybrid | 0.90 | 31.77% | 0.09 | 1.45% |
