Article

The Propagation of Congestion on Transportation Networks Analyzed by the Percolation Process

1
Department of Electrical and Electronic Engineering, The Hong Kong Polytechnic University, 11 Yuk Choi Rd, Hung Hom, Hong Kong
2
Department of Logistics and Maritime Studies, The Hong Kong Polytechnic University, 11 Yuk Choi Rd, Hung Hom, Hong Kong
*
Author to whom correspondence should be addressed.
Mathematics 2024, 12(20), 3247; https://doi.org/10.3390/math12203247
Submission received: 3 September 2024 / Revised: 4 October 2024 / Accepted: 9 October 2024 / Published: 17 October 2024

Abstract

:
Percolation theory has been widely employed in network systems as an effective tool to analyze phase transitions from functional to nonfunctional states. In this paper, we analyze the propagation of congestion on transportation networks and its influence on origin–destination (OD) pairs using the percolation process. This approach allows us to identify the most critical links within the network that, when disrupted due to congestion, significantly impact overall network performance. Understanding the role of these critical links is essential for developing strategies to mitigate congestion effects and enhance network resilience. Building on this analysis, we propose two methods to adjust the capacities of these critical links. First, we introduce a greedy method that incrementally adjusts the capacities based on their individual impact on network connectivity and traffic flow. Second, we employ a Particle Swarm Optimization (PSO) method to strategically increase the capacities of certain critical links, considering the network as a whole. These capacity adjustments are designed to enhance the network’s resilience by ensuring it remains functional even under conditions of high demand and congestion. By preventing the propagation of congestion through strategic capacity enhancements, the transportation network can maintain connectivity between OD pairs, reduce travel times, and improve overall efficiency. Our approach provides a systematic method for improving the robustness of transportation networks against congestion propagation. The results demonstrate that both the greedy method and the PSO method effectively enhance network performance, with the PSO method showing superior results in optimizing capacity allocations. This research is crucial for maintaining efficient and reliable mobility in urban areas, where congestion is a persistent challenge, and offers valuable insights for transportation planners and policymakers aiming to design more resilient transportation infrastructures.

1. Introduction

The transportation system, as one of the critical infrastructures, facilitates human activities. With increasing travel demand, traffic congestion is one of the most important concerns, which deteriorates the system’s efficiency significantly. How traffic flow leads to traffic congestion is usually modelled based on two perspectives. The macroscopic view describes traffic dynamics at the aggregate level through fluid dynamics theory. Lu and Osorio [1] formulated a stochastic node model for the analytical probabilistic vehicular traffic network and coupled it with a stochastic link transmission model for urban network optimization. Lu and Osorio [2] also extended previous stochastic formulations based on Newell’s simplified theory of kinematic waves. By tracking transient probabilities of only two boundary states, the model achieves constant complexity independent of link attributes like length. Also, microscopic studies focus on individual behaviors and their interactions [3]. Furthermore, significant advancements in deep supervised learning have led to the development of sophisticated neural networks, such as transformer architectures and graph convolutional networks, that capture complex spatio-temporal dependencies in traffic data. One notable advancement is the application of transformer architectures to traffic prediction [4,5,6,7,8,9].
Recent theoretical advances in network science have considerably contributed to understanding the behavior of transportation networks. Percolation theory [10] has been frequently employed to characterize the structure, functionality, and resilience of network systems. Based on the analysis of city traffic real data, it is found that the city-level traffic can be considered as a percolation-like transition [11]. There are many unsolved problems in the relation between many traffic parameters (volume and routing choice) and the system percolation properties [12]. Reliability, vulnerability, and resilience of the network are the most important concepts [13]. It also provides new methods to analyze these indexes.
The transportation network is a network or graph in geographic space, describing an infrastructure that permits and constrains movement or flow. One of the interesting questions is how flow influences a transportation network. In Figure 1, demand would generate flow in the network. However, too much demand also causes congestion to block flow.
Despite the application of percolation theory in network science to understand structural properties and resilience [10,11], there is a lack of research integrating percolation processes with the dynamics of traffic demand and congestion. While analytic models, such as macroscopic traffic flow models based on fluid dynamics and kinematic wave theory [1,2], have been developed to describe traffic dynamics and predict congestion, they often assume idealized conditions and may not capture the stochastic nature of congestion propagation in complex networks. Also, the deep learning-based approaches primarily focus on forecasting traffic states based on historical data and may not explicitly model the underlying mechanisms of congestion spread and network resilience.
Inspired by this idea, the volume property of the traffic network is added to the percolation process. We propose a network performance index using the percolation process. In this study, link failure is simulated using a percolation model which progressively removes links from the network, which is similar to [14]. The impact is usually measured as the links are gradually removed. In this study, the interaction between demand and network will be analyzed. This study fills the gap by introducing a novel approach that integrates percolation theory with traffic demand reassignment to analyze congestion propagation and enhance network resilience. The key contributions of this study are as follows:
(1)
Percolation-Based Congestion Propagation with Demand Interaction: We extend traditional percolation processes by incorporating the volume property of traffic networks, allowing us to simulate how congestion propagates through the network, and, correspondingly, how the traffic flow is reassigned.
(2)
Identification of Critical Links through Percolation Analysis: By utilizing the percolation process, we identify the most critical links within the network whose disruption significantly impacts origin–destination (OD) pairs. This identification is crucial for targeted interventions to enhance network robustness.
(3)
Development of Capacity Adjustment Strategies: We propose a greedy algorithm that incrementally adjusts the capacities of critical links. This method is straightforward and computationally efficient, suitable for quick implementations. We further employ a Particle Swarm Optimization (PSO) algorithm to strategically increase the capacities of certain critical links. The percolation process with OD reassignment serves as the fitness function, allowing the PSO algorithm to effectively navigate the nonlinear and stochastic nature of traffic systems.

2. Congestion Propagation by Percolation Process

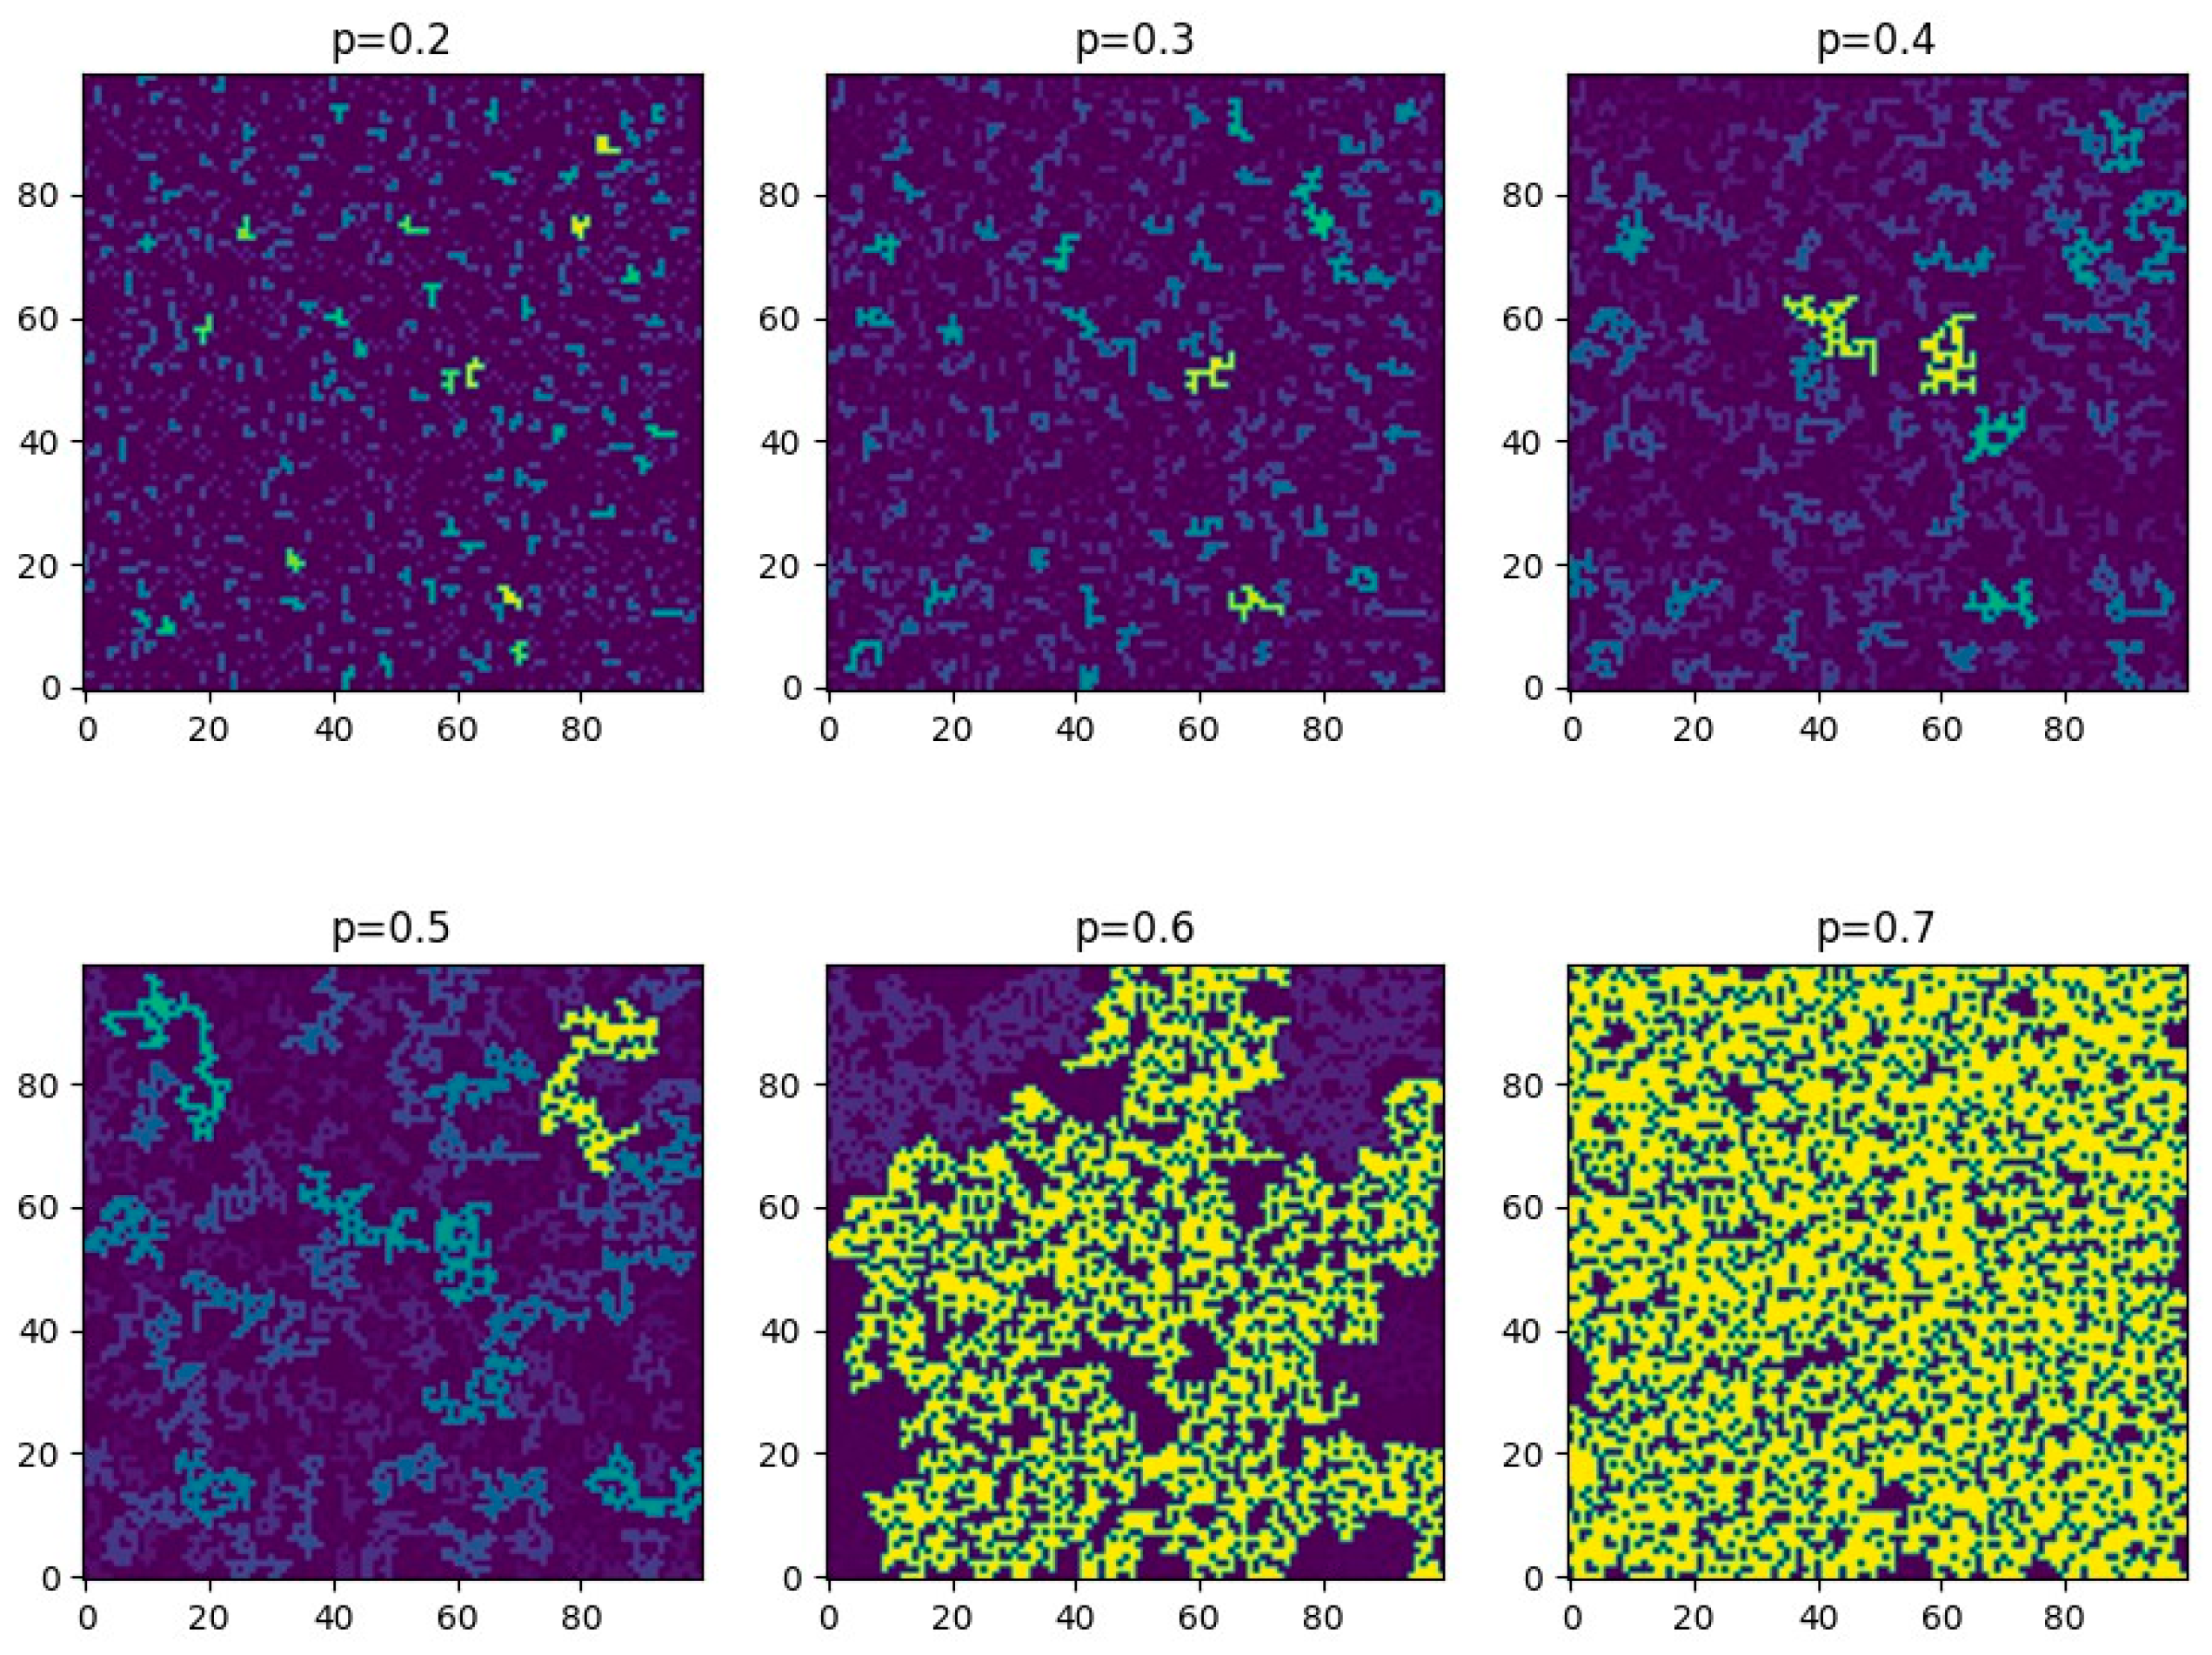
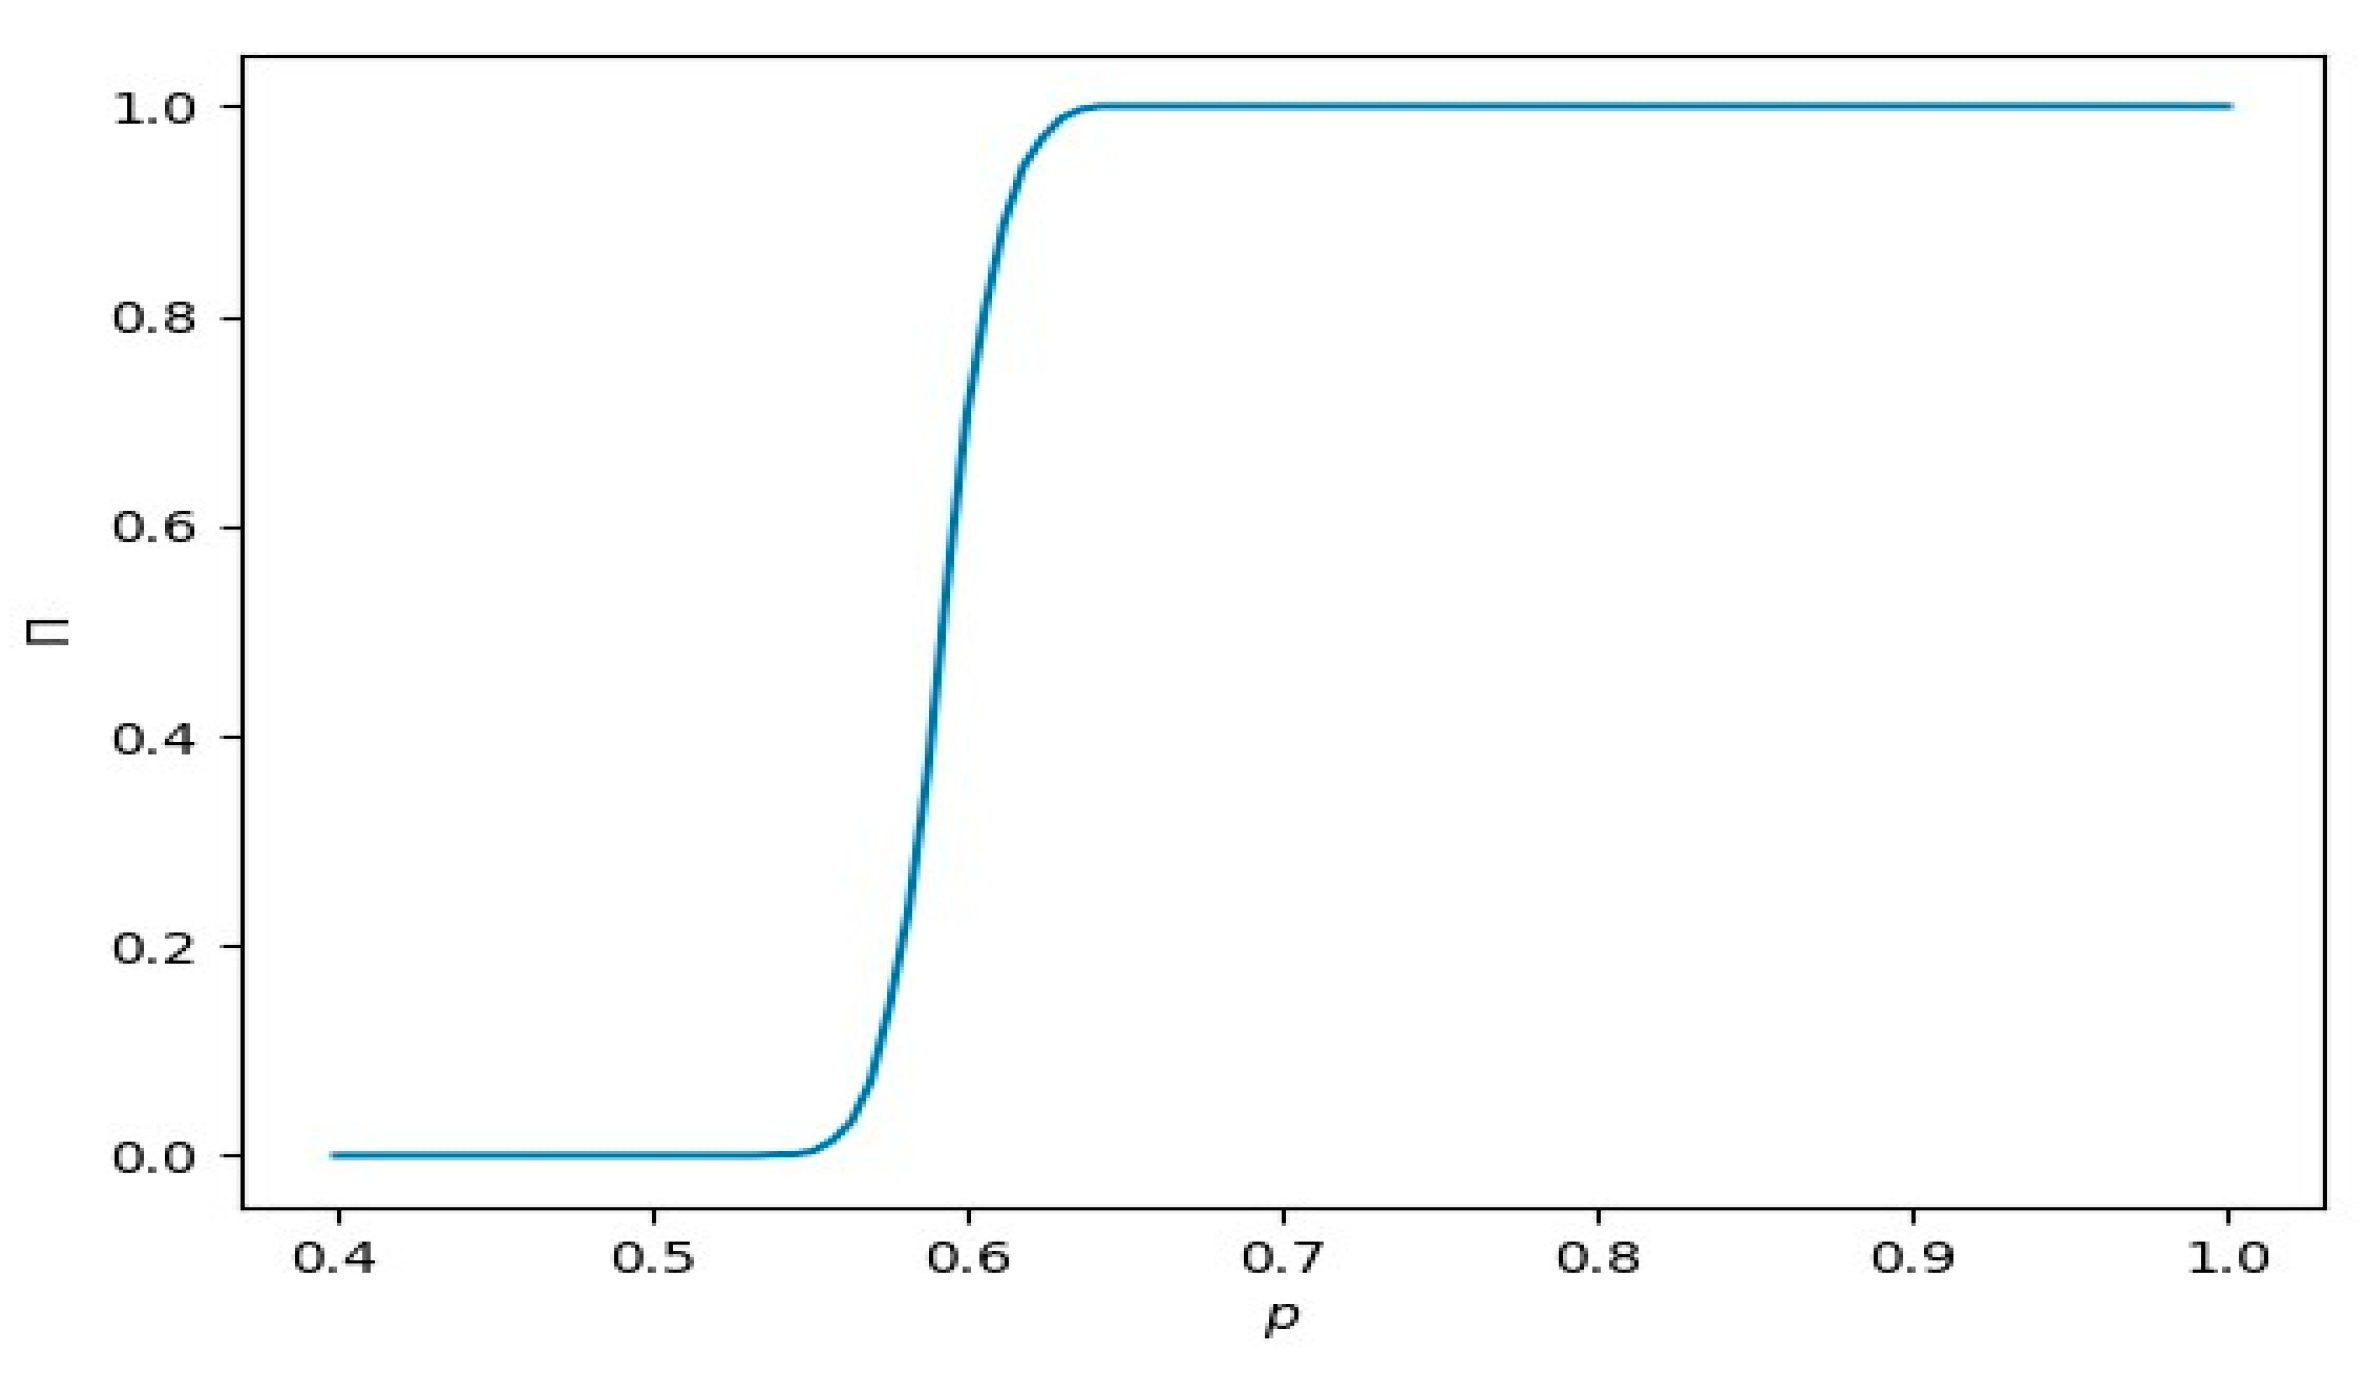
2.1. Preliminary of Percolation Process

Percolation studies the connectivity in an underlying random media such as a lattice or a random graph. In the textbook [15], percolation refers to the movement of fluids through porous materials. In the network area, the failure of a node/edge of the network is modelled by removal. The gradual removal of links can be understood as the percolation process.
When the removal of nodes/edges increases, the network undergoes a phase transition. In the transportation network, this phase transition refers to the dysfunction of the city. The threshold signifying this phase transition could represent many practical meanings, e.g., congestion. It can be found numerically by simulating the percolation process. In Figure 2, a 100 × 100 system is taken as an example to illustrate the process of percolation. Figure 2 is generated by first creating a matrix with values uniformly distributed between 0 and 1. This matrix is subsequently binarized by applying a threshold based on the percolation probability, wherein each cell’s value is compared against the probability to determine its binary state. Finally, clusters of adjacent cells sharing the same binary state are identified and labeled as connected regions.
With an increase in probability p , more points are connected and at last, a giant cluster is generated. Figure 3 shows that cluster size does not have a linear relationship with probability p .

2.2. Percolation Process for Transportation Network

The congestion propagation process is simulated using the percolation process, where congestion gradually spreads, causing an increasing number of links in the transportation network to lose functionality. Specifically, the degree of link congestion is represented by the volume and capacity ratio (V/C ratio). When the V/C ratio exceeds a critical threshold (denoted as p c ), the links become dysfunctional, thereby further exacerbating the network’s overall congestion.
Algorithm 1 details the procedure for finding the critical point ( p c ) where the network performance would drop dramatically. When the threshold value ρ increases, more links whose quality is below ρ are removed, and hence the number of influenced demand increases. Based on the percolation theory, the relation between the number of influenced demand and removed links is nonlinear.
Algorithm 1. Percolation Process
Require:  G V ,   E .
Require: Demand OD.
Ensure: Number of unaffected demand ( α ).
1: Initialize link volume based on OD.
2: Initialize link quality based on 1 V C .
3: for  p = 0 ;   p < 1 ;   p + = 0.1  do
4: Remove the links whose quality is lower than p .
5: Calculate unaffected OD number in the current network.
6: Add unaffected OD number to α .
7: end for
8: return  α .

2.3. Percolation Process for Transportation Network with Reassignment

In Section 2.2, the volume of remaining links does not change when some links are broken during the percolation process. However, demand should be redistributed in the pruned network. As the network changes, demand should generate a new flow pattern in each iteration. The interaction between demand and network is considered in the classic percolation process. The whole procedure is encompassed in Algorithm 2.
Algorithm 2. Percolation Process with Reassignment
Require:  G V ,   E .
Require: Demand OD.
Ensure: Number of unaffected demand ( α ).
1: Initialize link volume based on OD.
2: Initialize link quality based on 1 V C .
3: for  p = 0 ;   p < 1 ;   p + = 0.1  do
4: Remove the links whose quality is lower than p .
5: Incremental assignment on the current network; (Reassignment)
6: Assess each link quality.
7: Calculate unaffected OD number in the current network.
8: Add unaffected OD number to α .
9: end for
10: return  α .
The reassignment is implemented here by incremental assignment. Incremental assignment is a process in which fractions of traffic volumes are assigned in steps. In each step, a fixed proportion of total demand is assigned, based on an all-or-nothing assignment. After each step, link travel times are recalculated based on link volumes. When there are many increments used, the flows may resemble an equilibrium assignment. Link travel time is calculated by one of the most commonly used link performance functions: the Bureau of Public Roads (BPR) curve. Link travel times are estimated as a function of the volume-to-capacity ratio [16]:
T f = T o × 1 + α × V C β
where T f is link travel time; T o is free-flow travel time; V is assigned traffic volume; C is the link capacity; α and β are volume/delay coefficients whose values are typically determined empirically. Here, α and β are set as 0.15 and 4.0, respectively, the same as found in the literature [16].
In each iteration of the percolation process, the link quality needs to be estimated again because the link volume has changed. Therefore, Algorithm 2 would give a different spreading process compared with Algorithm 1.

3. Network Reconfiguration by Analysis of Percolation Process

In Section 2, the process of congestion spreading and its impact on demand is simulated using the percolation process, which allowed us to identify the most critical links. Building on this analysis, this study further employs the greedy method and the particle swarm optimization (PSO) method to increase the capacities of these identified critical links, thereby enhancing the robustness of the transportation network against congestion propagation.

3.1. Greedy Method

The greedy strategy involves the following steps to mitigate the impact of congestion on travel demand. First, the percolation process is used to identify the links that have the greatest impact on demand during congestion propagation. Then, the capacities of these critical links are increased.
The underlying idea of the greedy approach is to prioritize increasing the capacities of the most critical links to prevent potential failures. This greedy strategy is detailed in Algorithm 3. However, it is important to note that simply increasing the capacities of the most critical links may not yield the optimal solution, as demand is also subject to dynamic changes.
Algorithm 3. Greedy Strategy to Adjust Lane Capacity
Require:  G V ,   E .
Require: Demand OD.
Ensure: Unaffected demand ( α ).
1: Find the most critical links by executing the percolation process with reassignment (Algorithm 1).
2: Enlarge capacity of these most critical links.
3: Obtain the amount of unaffected demand in the adjusted network by Algorithm 1.
4: return  α .

3.2. Particle Swarm Optimization (PSO) Method

Particle swarm optimization, first introduced by [17], places a number of particles in the search space of the problem. Each particle evaluates the fitness value at its current location and then determines its movement through individual experience and group information [18].
The percolation process with demand reassignment in Section 2.2 gives us a way to evaluate network performance under congestion or high-demand conditions. Therefore, we employ it as the fitness evaluation function in the PSO method. The increments of all link capacities are treated as decision variables, with the optimization objective being to enhance network performance with the minimum possible capacity increments. The parameters used in the PSO algorithm are as follows: the swarm size (number of particles) is set to 120, and the algorithm runs for 300 iterations. The acceleration coefficients, both social and cognitive, are set to 0.5. The flow chart is illustrated in Figure 4.

4. Numerical Experiments

The numerical experiments are conducted to answer two questions: (i) How does the traffic network behave under congestion propagation when simulated using the Percolation Process without Reassignment versus with Reassignment? (ii) How can the network be adjusted to enhance its robustness?

4.1. Simulated Traffic Network

The Sioux Falls network is used in our experiments and is widely used in many publications. The network is directed and consists of 24 vertices and 76 edges, where each vertex also represents an origin–destination vertex. Reference [16] first introduced the network. Later, the network was adapted as a benchmark in many publications, including [19,20,21,22,23]. The simulations and computations are performed on a workstation equipped with an Intel Core i9 processor and 32 GB RAM.

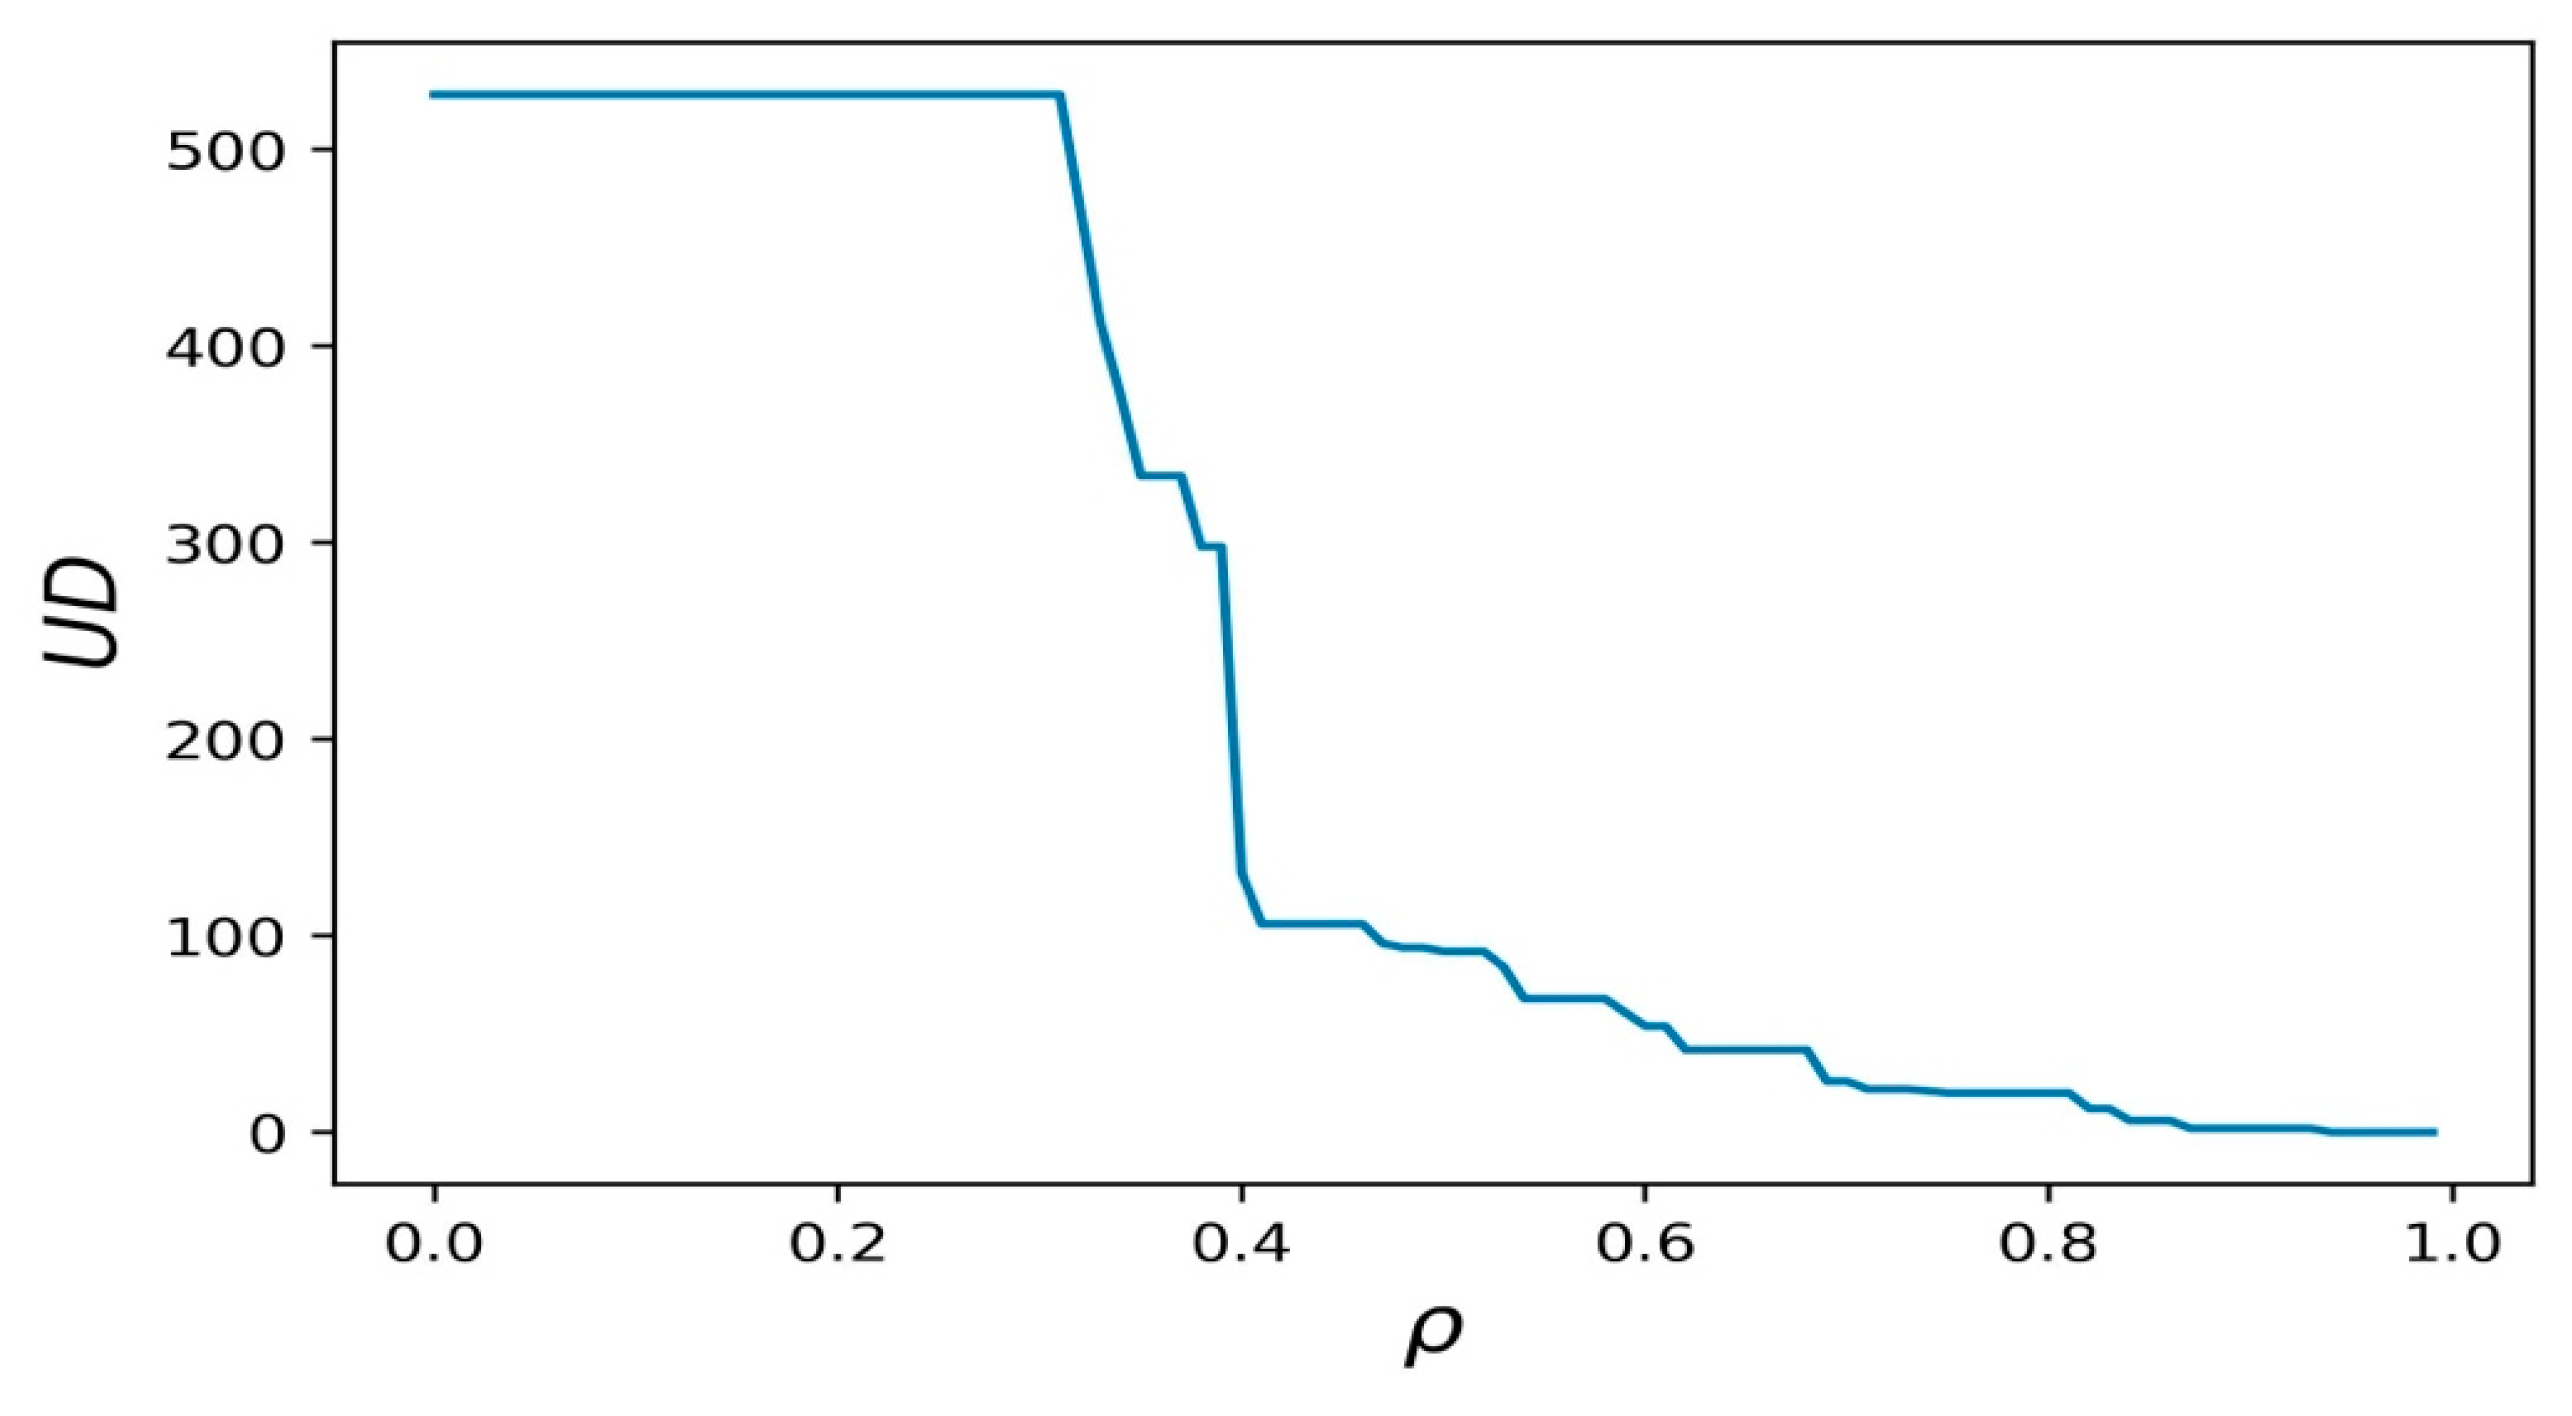
4.2. Congestion Propagation via Percolation Process

4.2.1. Numerical Results of Percolation Process Without Reassignment

The introduced Algorithm 1 is tested in the Sioux Falls network. Figure 5 shows which links are removed under certain ρ and many links are removed at p = 0.4 . Similarly, Figure 6 shows that the huge drop in unaffected demand happens around p = 0.4 .
The network performance we care about is the area covered by the blue curve in Figure 6. This refers to the number of unaffected demands during the whole percolation process. A larger area shows that the network could handle demand even in very congested cases.

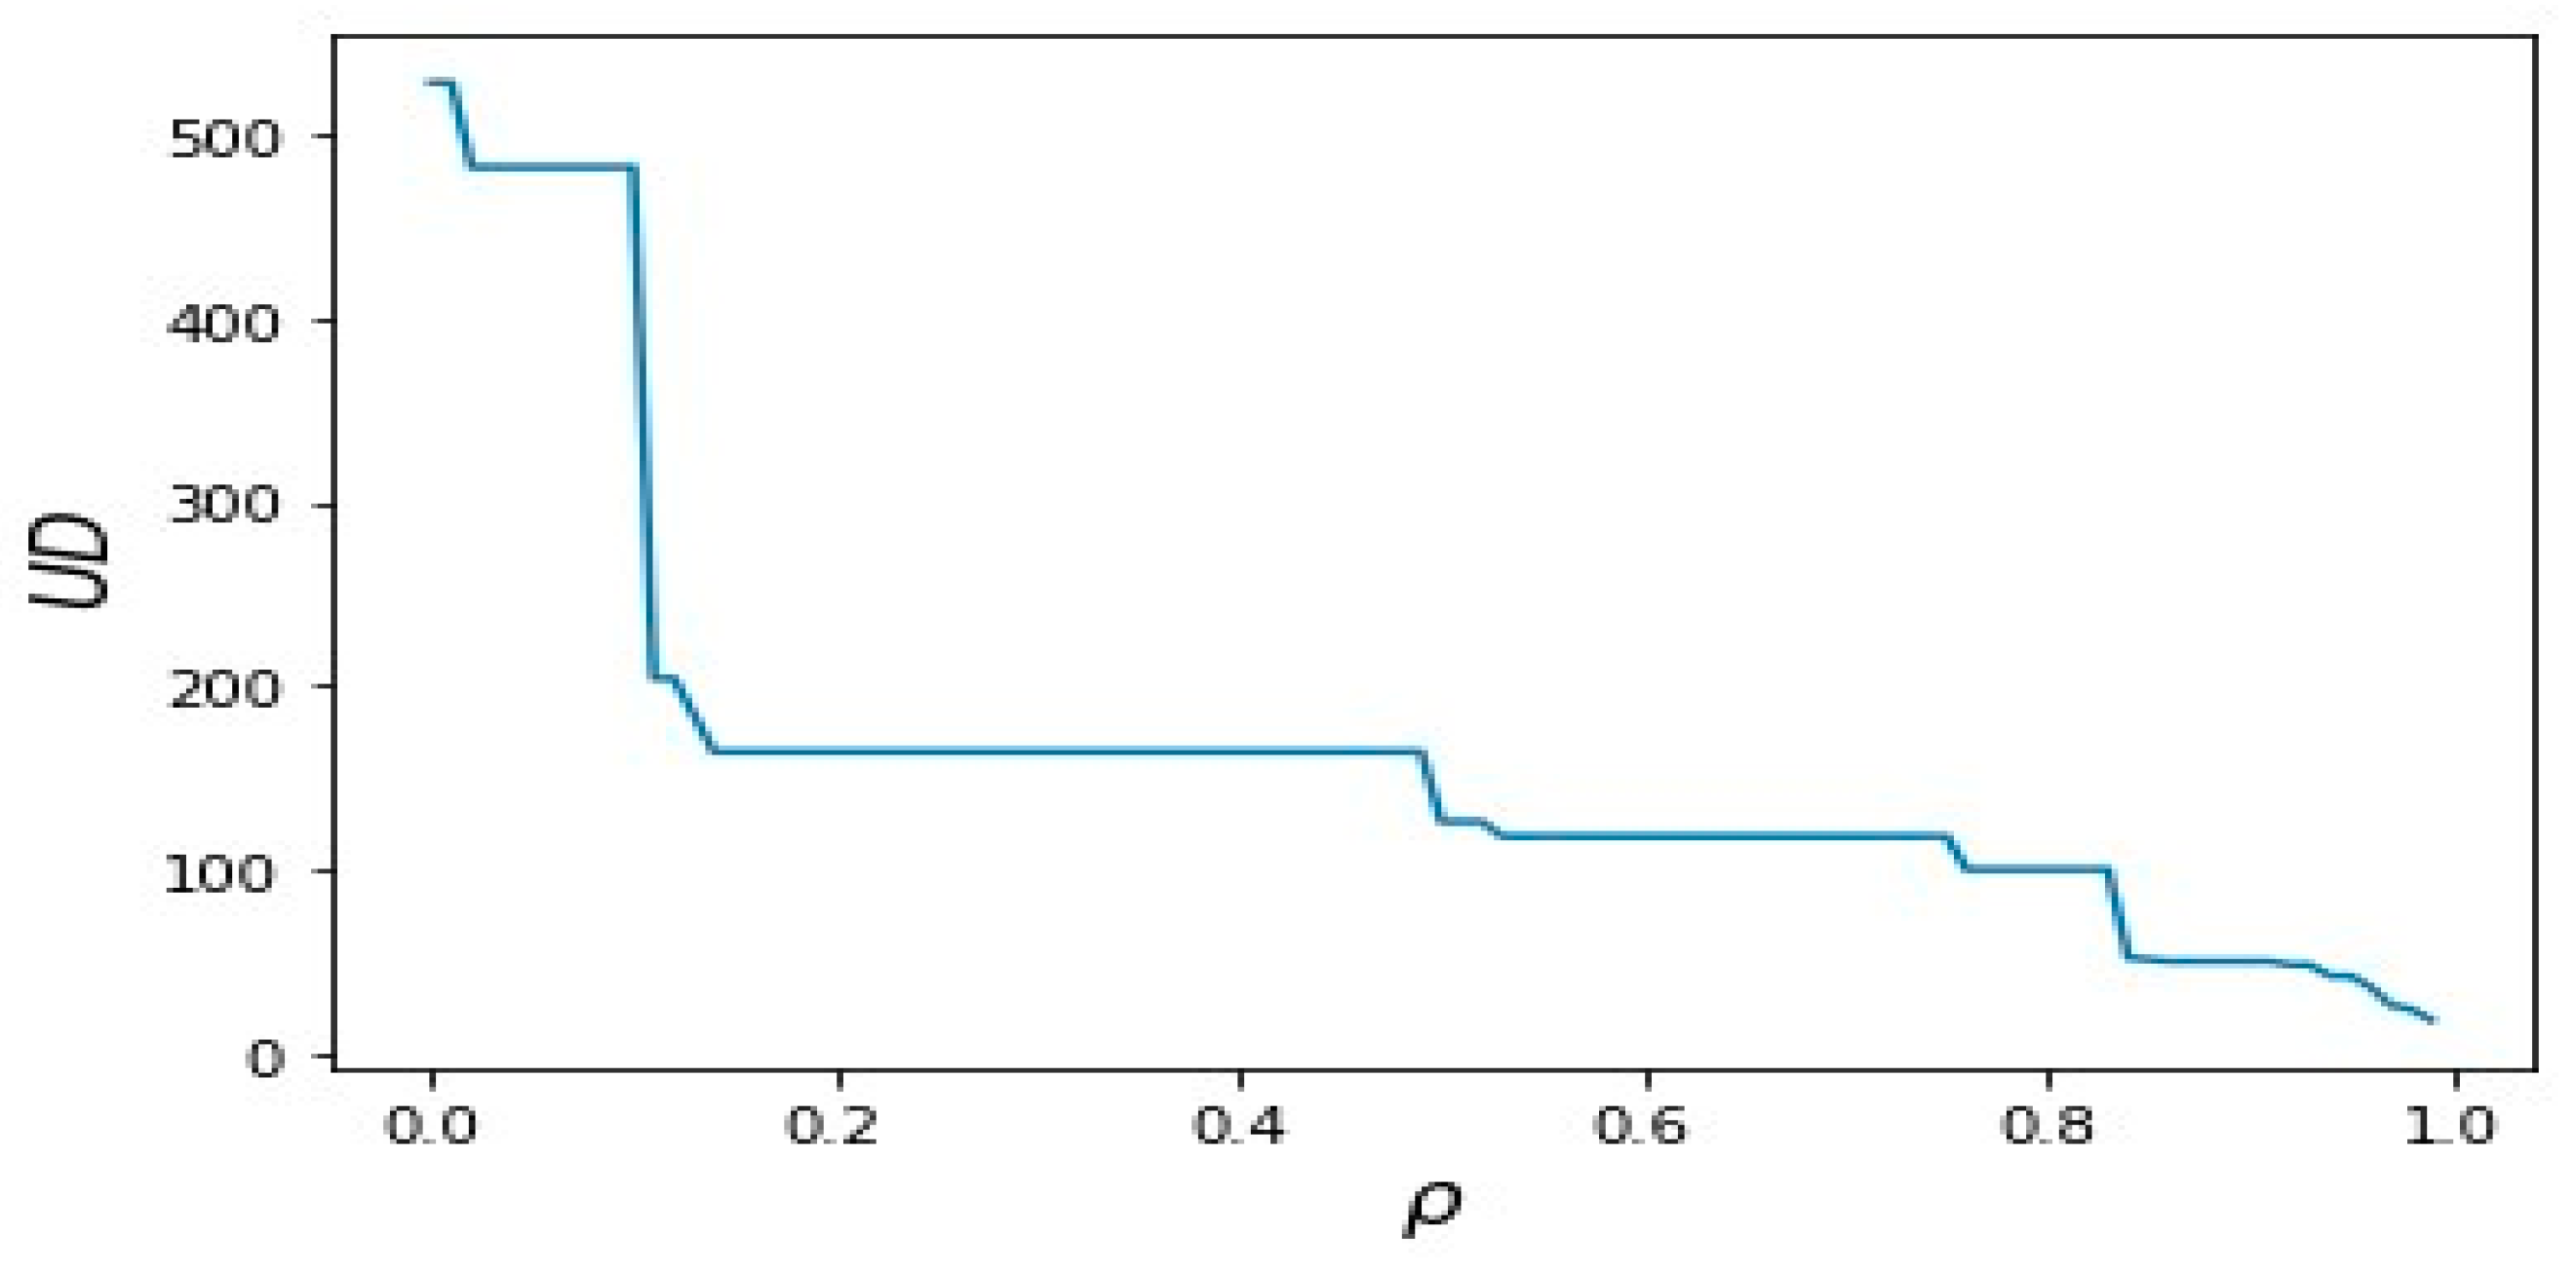
4.2.2. Numerical Results of Percolation Process with Reassignment

The introduced Algorithm 2 was also tested in the Sioux Falls network. Figure 7 shows which links are removed under certain p . It shows that the huge drop in unaffected demand happens very early in Figure 8. Since the remaining links must deal with all demand, the congestion level of the remaining links becomes higher. The sequence of link removal in Figure 7 is clearly different from the result of Algorithm 1.

4.2.3. Comparison between the Percolation Process Without Reassignment and the Percolation Process with Reassignment

By comparing Figure 6 and Figure 7, it is evident that under the Percolation Process with Reassignment, the curve representing the amount of unaffected demand drops more rapidly at lower percolation rates. This is more reasonable because, although some links in the network have lost functionality, the origin–destination (OD) pairs still need to find new paths, thereby increasing the burden on other links. Consequently, subsequent experiments will focus on the process with reassignment.

4.3. Network Adjustment

4.3.1. Network Adjustment Using the Greedy Method

The result of using this strategy is shown in Figure 8. Compared with Figure 7, the area of UD becomes larger after adjusting some road capacities. However, the greedy strategy could not choose the best links to improve the performance. Moreover, it could not decide the amount of increment.

4.3.2. Network Adjustment Using the PSO Method

Figure 9 shows the results of adjusting network capacities using the PSO method, demonstrating that the adjusted network can maintain unaffected demand even when the percolation rate reaches 0.4. Figure 10 illustrates the network structure under congestion propagation. Compared with Figure 5, we can observe that more links are retained in Figure 10, indicating an improvement in robustness.

4.3.3. Comparison of the Greedy Method and the PSO Method

By comparing Figure 8 and Figure 9, we observe that the PSO method mitigates congestion propagation more effectively than the greedy method. Note that despite its superior performance in enhancing network robustness, the PSO method may involve higher computational complexity and longer computation time. Therefore, while the PSO method offers better results, it is important to consider the trade-off between optimization quality and computational efficiency when choosing the appropriate method for practical applications.

5. Conclusions

This study explores the use of percolation theory to simulate congestion propagation in traffic networks, where congestion is evaluated by the V/C ratio. Additionally, the simulation process is enhanced by considering demand reassignment and changes in the network structure during percolation. Using this evaluation method, we can identify critical links, increase the capacities of the most critical links through a greedy strategy, and adjust the capacities of certain links using PSO to improve the network’s robustness against congestion spread. However, there are some limitations to this study. One key limitation is that percolation theory, being an abstract mathematical model, may not fully capture the complexities of real-world congestion propagation. In reality, traffic networks are influenced by a wide range of dynamic factors, such as driver behavior, weather conditions, and unexpected events, which are not fully accounted for in the current model. The simplified assumptions of percolation theory may, therefore, limit its accuracy in simulating large-scale traffic networks with complex interactions. Future work will focus on testing and validating the model in larger and more realistic scenarios, gradually incorporating more real-world complexities to improve its accuracy. Further research will also explore the integration of percolation theory with other traffic flow theories to develop a more comprehensive and robust model. Additionally, we plan to investigate more advanced optimization algorithms to more effectively allocate network resources, further enhancing the network’s resilience to congestion. Ultimately, these improvements aim to contribute to the development of more practical traffic management systems capable of addressing the complex challenges of future urban traffic.

Author Contributions

Conceptualization, J.C. and Y.W.; methodology, J.C.; software, J.C.; validation, J.C.; writing—original draft preparation, J.C.; writing—review and editing, J.C. and Y.W.; visualization, Y.W. All authors have read and agreed to the published version of the manuscript.

Funding

This research was funded by The Hong Kong Polytechnic University internal grants (Project number P0051369).

Data Availability Statement

The original contributions presented in the study are included in the article, further inquiries can be directed to the corresponding author.

Conflicts of Interest

The authors declare no conflicts of interest.

References

  1. Lu, J.; Osorio, C. On the analytical probabilistic modeling of flow transmission across nodes in transportation networks. Transp. Res. Rec. 2022, 2676, 209–225. [Google Scholar] [CrossRef]
  2. Lu, J.; Osorio, C. Link transmission model: A formulation with enhanced compute time for large-scale network optimization. Transp. Res. Part B Methodol. 2024, 185, 102971. [Google Scholar] [CrossRef]
  3. Lighthill, M.J.; Whitham, G.B. On kinematic waves I. Flood movement in long rivers. Proc. R. Soc. London. Ser. A. Math. Phys. Sci. 1955, 229, 281–316. [Google Scholar]
  4. Gong, J.; Liu, Y.; Li, T.; Chai, H.; Wang, X.; Feng, J.; Deng, C.; Jin, D.; Li, Y. Empowering Spatial Knowledge Graph for Mobile Traffic Prediction. In Proceedings of the 31st ACM International Conference on Advances in Geographic Information Systems, Hamburg, Germany, 13–16 November 2023; Volume 13, pp. 1–11. [Google Scholar]
  5. Ding, Y.; Zhang, W.; Zhou, X.; Liao, Q.; Luo, Q.; Ni, L.M. FraudTrip: Taxi fraudulent trip detection from corresponding trajectories. IEEE Internet Things J. 2020, 8, 12505–12517. [Google Scholar] [CrossRef]
  6. Wang, F.; Xin, X.; Lei, Z.; Zhang, Q.; Yao, H.; Wang, X.; Tian, Q.; Tian, F. Transformer-based spatio-temporal traffic prediction for access and metro metworks. J. Light. Technol. 2024, 42, 5204–5213. [Google Scholar] [CrossRef]
  7. Yang, H.; Zhang, X.; Li, Z.; Cui, J. Region-level traffic prediction based on temporal multi-spatial dependence graph convolutional network from GPS data. Remote Sens. 2022, 14, 303. [Google Scholar] [CrossRef]
  8. Yang, H.; Li, Z.; Qi, Y. Predicting traffic propagation flow in urban road network with multi-graph convolutional network. Complex Intell. Syst. 2024, 10, 23–35. [Google Scholar] [CrossRef]
  9. Li, T.; Alhilal, A.; Zhang, A.; Hoque, M.A.; Chatzopoulos, D.; Xiao, Z.; Li, Y.; Hui, P. Driving big data: A first look at driving behavior via a large-scale private car dataset. In Proceedings of the 2019 IEEE 35th International Conference on Data Engineering Workshops (ICDEW), Macao, China, 8–12 April 2019; pp. 61–68. [Google Scholar]
  10. Stauffer, D.; Aharony, A. Introduction to Percolation Theory; Taylor & Francis: Abingdon, UK, 2018. [Google Scholar]
  11. Ganin, A.A.; Kitsak, M.; Marchese, D.; Keisler, J.M.; Seager, T.; Linkov, I. Resilience and efficiency in transportation networks. Sci. Adv. 2017, 3, 1701079. [Google Scholar] [CrossRef]
  12. Hamedmoghadam, H.; Jalili, M.; Vu, H.L.; Stone, L. Percolation of heterogeneous flows uncovers the bottlenecks of infrastructure networks. Nat. Commun. 2021, 12, 1254. [Google Scholar] [CrossRef]
  13. Gu, Y.; Fu, X.; Liu, Z.; Xu, X.; Chen, A. Performance of transportation network under perturbations: Reliability, vulnerability, and resilience. Transp. Res. Part E Logist. Transp. Rev. 2020, 133, 101809. [Google Scholar] [CrossRef]
  14. de Domenico, M.; Solé-Ribalta, A.; Gómez, S.; Arenas, A. Navigability of interconnected networks under random failures. Proc. Natl. Acad. Sci. USA 2014, 111, 8351–8356. [Google Scholar] [CrossRef]
  15. Hunt, A.; Ewing, R.; Ghanbarian, B. Percolation Theory for Flow in Porous Media; Springer: Berlin/Heidelberg, Germany, 2014. [Google Scholar]
  16. Gore, N.; Arkatkar, S.; Joshi, G.; Antoniou, C. Modified bureau of public roads link function. Transp. Res. Rec. 2023, 2677, 966–990. [Google Scholar] [CrossRef]
  17. Kennedy, J.; Eberhart, R. Particle swarm optimization. In Proceedings of the ICNN’95-International Conference on Neural Networks, Perth, WA, Australia, 27 November–1 December 1995; Volume 4, pp. 1942–1948. [Google Scholar]
  18. Poli, R.; Kennedy, J.; Blackwell, T. Particle swarm optimization: An overview. Swarm Intell. 2007, 1, 33–57. [Google Scholar] [CrossRef]
  19. Morlok, E.K. Development and Application of a Highway Network Design Model; Federal Highway Administration: Washington, DC, USA, 1973; p. 1. [Google Scholar]
  20. LeBlanc, L.J.; Morlok, E.K.; Pierskalla, W.P. An efficient approach to solving the road network equilibrium traffic assignment problem. Transp. Res. 1975, 9, 309–318. [Google Scholar] [CrossRef]
  21. Suwansirikul, C.; Friesz, T.L.; Tobin, R.L. Equilibrium decomposed optimization: A heuristic for the continuous equilibrium network design problem. Transp. Sci. 1987, 21, 254–263. [Google Scholar] [CrossRef]
  22. Chakirov, A.; Fourie, P.J. Enriched sioux falls scenario with dynamic and disaggregate demand. Arbeitsberichte Verk. Und Raumplan. 2014, 978. [Google Scholar] [CrossRef]
  23. Hackl, J.; Adey, B.T. Estimation of traffic flow changes using networks in networks approaches. Appl. Netw. Sci. 2019, 4, 28. [Google Scholar] [CrossRef]
Figure 1. Network attribute. OD refers to origin–destination.
Mathematics 12 03247 g001
Figure 2. Plot of the clusters in a system for various values of p .
Mathematics 12 03247 g002
Figure 3. Number of giant clusters ( n ) and p .
Mathematics 12 03247 g003
Figure 4. The flow chart of PSO-based method with Percolation Process with Reassignment as the fitness function.
Mathematics 12 03247 g004
Figure 5. The network status under different p .
Mathematics 12 03247 g005
Figure 6. Network performance evaluated by percolation process without reassignment.
Mathematics 12 03247 g006
Figure 7. Network performance evaluated by percolation process with reassignment.
Mathematics 12 03247 g007
Figure 8. Performance on the adjusted network using the greedy method.
Mathematics 12 03247 g008
Figure 9. Performance on the adjusted network using the PSO method.
Mathematics 12 03247 g009
Figure 10. Network status under different p .
Mathematics 12 03247 g010
Disclaimer/Publisher’s Note: The statements, opinions and data contained in all publications are solely those of the individual author(s) and contributor(s) and not of MDPI and/or the editor(s). MDPI and/or the editor(s) disclaim responsibility for any injury to people or property resulting from any ideas, methods, instructions or products referred to in the content.

