Article

Exploiting Cross-Scale Attention Transformer and Progressive Edge Refinement for Retinal Vessel Segmentation

1
Shenzhen Institute of Advanced Technology, Chinese Academy of Sciences, Shenzhen 518055, China
2
Schole of Nursing, The Hong Kong Polytechnic University, Hong Kong SAR 999077, China
3
ROAS Thrust, The Hong Kong University of Science and Technology (Guangzhou), Guangzhou 511400, China
4
Department of Ophthalmology, Shenzhen University, Shenzhen 518055, China
5
Guangdong Provincial Key Laboratory of Computer Vision and Virtual Reality Technology, Shenzhen Institute of Advanced Technology, Chinese Academy of Sciences, Shenzhen 518055, China
*
Authors to whom correspondence should be addressed.
Mathematics 2024, 12(2), 264; https://doi.org/10.3390/math12020264
Submission received: 12 November 2023 / Revised: 13 December 2023 / Accepted: 16 December 2023 / Published: 13 January 2024
(This article belongs to the Topic AI and Data-Driven Advancements in Industry 4.0)

Abstract

:
Accurate retinal vessel segmentation is a crucial step in the clinical diagnosis and treatment of fundus diseases. Although many efforts have been presented to address the task, the segmentation performance in challenging regions (e.g., collateral vessels) is still not satisfactory, due to their thin morphology or the low contrast between foreground and background. In this work, we observe that an intrinsic appearance exists in the retinal image: among the dendritic vessels there are generous similar structures, e.g., the main and collateral vessels are all curvilinear, but they have noticeable scale differences. Based on this observation, we propose a novel cross-scale attention transformer (CAT) to encourage the segmentation effects in challenging regions. Specifically, CAT consumes features with different scales to produce their shared attention matrix, and then fully integrates the beneficial information between them. Such new attention architecture could explore the multi-scale idea more efficiently, thus realizing mutual learning of similar structures. In addition, a progressive edge refinement module (ERM) is designed to refine the edges of foreground and background in the segmentation results. Through the idea of edge decoupling, ERM could suppress the background feature near the blood vessels while enhancing the foreground feature, so as to segment vessels accurately. We conduct extensive experiments and discussions on DRIVE and CHASE_DB1 datasets to verify the proposed framework. Experimental results show that our method has great advantages in the Se metric, which are 0.88–7.26% and 0.81–7.11% higher than the state-of-the-art methods on DRIVE and CHASE_DB1, respectively. In addition, the proposed method also outperforms other methods with 0.17–2.06% in terms of the Dice metric on DRIVE.

1. Introduction

A retinal image is a direct assistance medium for non-invasive diagnosis, and retinal vessel segmentation is an important basis in the clinical diagnosis of retinal degenerative disease. The morphological variations in retinal vessels are closely related to various diseases, including diabetes, hypertension, and so on [1,2,3]. Manual vessel segmentation is time-consuming and laborious, and the results are also easily affected by expert experience. Hence, it is required but challenging for developing automatic vessel segmentation in clinical medical diagnosis to reduce human labor.
In the past decades, automatic retinal vessel segmentation has become a hot research task, and numerous methods have been proposed for addressing this problem with promising performances. These methods can be roughly divided into traditional methods and deep-learning-based methods. Traditional methods have been investigated for a long time, including filtering-based methods [4,5], model-based methods [6,7], tracking-based methods [8,9], and machine-learning-based methods [10,11]. Mendonca and Campilho [4] first extract vascular centerlines and apply vessel width related filters for vessel filling. Similarly, Zhang et al. [5] use hand-crafted filters for vessel enhancement and then perform threshold processing to segment vessels. Al-Diri et al. [6] also employ a generalized morphological order filter on vessel centerlines and utilize an active contour model to capture vessel edges. And Yang et al. [7] propose an improved region-based level set model to segment vessels, which consumes gray-scale retinal image and vascular-enhanced image. With the development of machine learning, support vector machines [10] and the AdaBoost classifier [11] have been applied in some early supervised methods to achieve better performance. These methods generally utilize shallow fitting from handcrafted features for classification/segmentation.
Recently, Convolutional Neural Networks (CNNs) have achieved impressive performance on retinal vessel segmentation. They design diverse and ingenious deep networks to extract high-dimensional features, which further regress the probability that pixels belong to vessels. These methods either emphasize the discrimination and generalization ability of the deep model or focus on the morphological characteristics of retinal vessels.
Alom et al. [12] design a recurrent and residual convolutional unit to serve as the basic block to improve the discrimination of UNet [13], which is one of the most widely used deep learning frameworks in medical image analysis. To heighten important vascular features and suppress meaningless background features, Guo et al. [14] replace the deepest convolution operation of UNet with a spatial attention module for adaptive feature refinement. Additionally, Li et al. [15] leverage a similar idea to strengthen the input features. Considering the effective performance of spatial and channel attention, Wang et al. [16] and Mou et al. [17] integrate the dual attention module into their network to extract attention-aware features. For the morphological analysis, Mou et al. [18] consider the connectivity of vessels and propose a post-processing algorithm to obtain more complete vascular tree. To achieve accurate segmentation in the presence of noise, Nazir et al. [19] take advantage of the deep learning architecture to promote the cervical cytoplasm and nucleus segmentation. And a denoising variational auto-encoder network is proposed by Araújo et al. [20] to refine the segmentation results. Furthermore, Shin et al. [21] propose a vessel graph network, which combines graph neural network and CNN for joint learning to extract both global and local features.
In addition to the above methods, transformer-based neural networks have recently attracted great interest in diverse medical imaging tasks. Transformers first achieved huge success in natural language processing by capturing the long-range dependence of an input sequence via a self-attention mechanism. Dosovitskiy et al. [22] make it effectively adapt to vision tasks, which further expand the development of medical image analysis. Chen et al. [23] propose Trans-UNet to integrate a transformer and U-shaped network for medical image segmentation. To reduce the computational complexity and improve the applicability of processing high-resolution images, Liu et al. [24] utilize the shifted window technique to improve the generalization of transformer. Furthermore, Cao et al. [25] combine shifted window with UNet and construct a pure transformer-based network (i.e., Swin-UNet). Huang et al. [26] design a global transformer block to preserve detailed information and a relation transformer block to explore dependencies among lesions and other fundus tissues. To combine the advantages of the general UNet architecture and transformer, the transformer-UNet framework is popular in Li et al. [27], Shen et al. [28], Lin et al. [29]. Li et al. [27] significantly reduce the computational cost in vessel segmentation by proposing a grouping structure of convolution and transformer. Shen et al. [28] introduce the squeeze-excitation transformer into UNet for retinal vessel segmentation. Furthermore, Lin et al. [29] adopt a dual-branch Swin transformer with UNet architecture to capture the feature representations of different semantic scales. The great potential of transformer and the advantages of the transformer-based UNet framework have been presented in these methods. By taking these into account, we propose a cross-scale attention transformer into the Swin-UNet framework. Our network retains the superior feature learning ability of transformer and promotes the feature fusion of different scales in retinal vessels.
Given an input image, the transformer network first divides it into patches by a predefined scale, e.g., 4 × 4 pixel grid. Then all patches are flattened into a sequence and embedded into high-dimensional features with shared weights. Therefore, the self-attention block can consume the sequence features for correlation learning. In retinal vessel segmentation, the goal is to accurately segment the foreground, including main and collateral vessels. Due to their thin morphology or the low contrast between foreground and background, most approaches are limited in their ability to segment vessels in challenging regions. We observe a momentous situation that the dendritic vessels have a great number of similar structures but with different scales. For example, the main and collateral vessels are both curvilinear, but their widths are significantly different. Therefore, transformer with one fixed patch scale has natural limitations for retinal vessel segmentation.
In order to better exploit the attention mechanism to aggregate vessel features with similar structures but different scales, a simple idea is to adopt a multi-scale scheme. Lin et al. [29] propose a dual-scale transformer UNet for medical image segmentation. They split the input image into different patches with two sizes, and apply two transformer encoders to the different scales, respectively. Nevertheless, such a dual-scale scheme with different encoders is too complex to efficiently fuse features of different scales, resulting in the inability to fully benefit from similar structures.
Based on the above observations, we propose a Cross-scale Attention Transformer, noted CAT, to serve as the basis block in the UNet architecture. CAT consumes features with different patch scales to produce their shared attention matrix and then integrates the beneficial information between them. Such a design makes full use of the characteristics of the dendritic structure in retinal images, encouraging the features with different scales to benefit from each other. Consequently, the proposed CAT can locate and separate more collateral vessels while maintaining the segmentation effect of main vessels. In addition, CAT is more lightweight than the dual-scale scheme.
Moreover, there are typically misclassifications in the edge of foreground and background as the scale differences between main and collateral vessels. To alleviate this problem, we further propose a progressive edge refinement module, called ERM. We adopt the deep-supervision scheme in the proposed network and apply ERM in the multiple supervision layers. Inspired by gradient-based edge detection, we can generate an edge map from the prediction map in each ERM. And we utilize a simple but effective operation to decouple the edge map into a foreground edge map and a background edge map. The decoupled edge maps are then used to suppress background features and enhance vessel features in subsequent layers. Therefore, the ultimate prediction map can be refined progressively to improve the segmentation effect.
In summary, the main contributions of this work are as follows:
  • Cross-scale Attention Transformer (CAT) is proposed as the basic unit in the transformer UNet. CAT fully exploits the dense similar structures with different scales in a retinal image and effectively fuses the features to improve the vessel segmentation performance.
  • A progressive edge refinement module (ERM) is designed to refine the edges of foreground and background in the segmentation results. ERM can suppress non-vessel features and enhance vessel features, and then progressively refine the prediction mask.
  • Comprehensive experiments and discussions are carried out to verify the effectiveness of the proposed method. The vessel segmentation performance outperforms the state-of-the-art methods on public retinal datasets.
The rest of this paper is as follows. We detail our methods in Section 2 and evaluate the experimental results in Section 3. In Section 4, we further discuss our innovations. Finally, the conclusion is arranged in Section 5.

2. Materials and Methods

In this section, we first overview our framework and then expatiate the proposed cross-scale attention transformer (CAT) and progressive edge refinement module (ERM). Finally, the detailed configurations of the network are given.

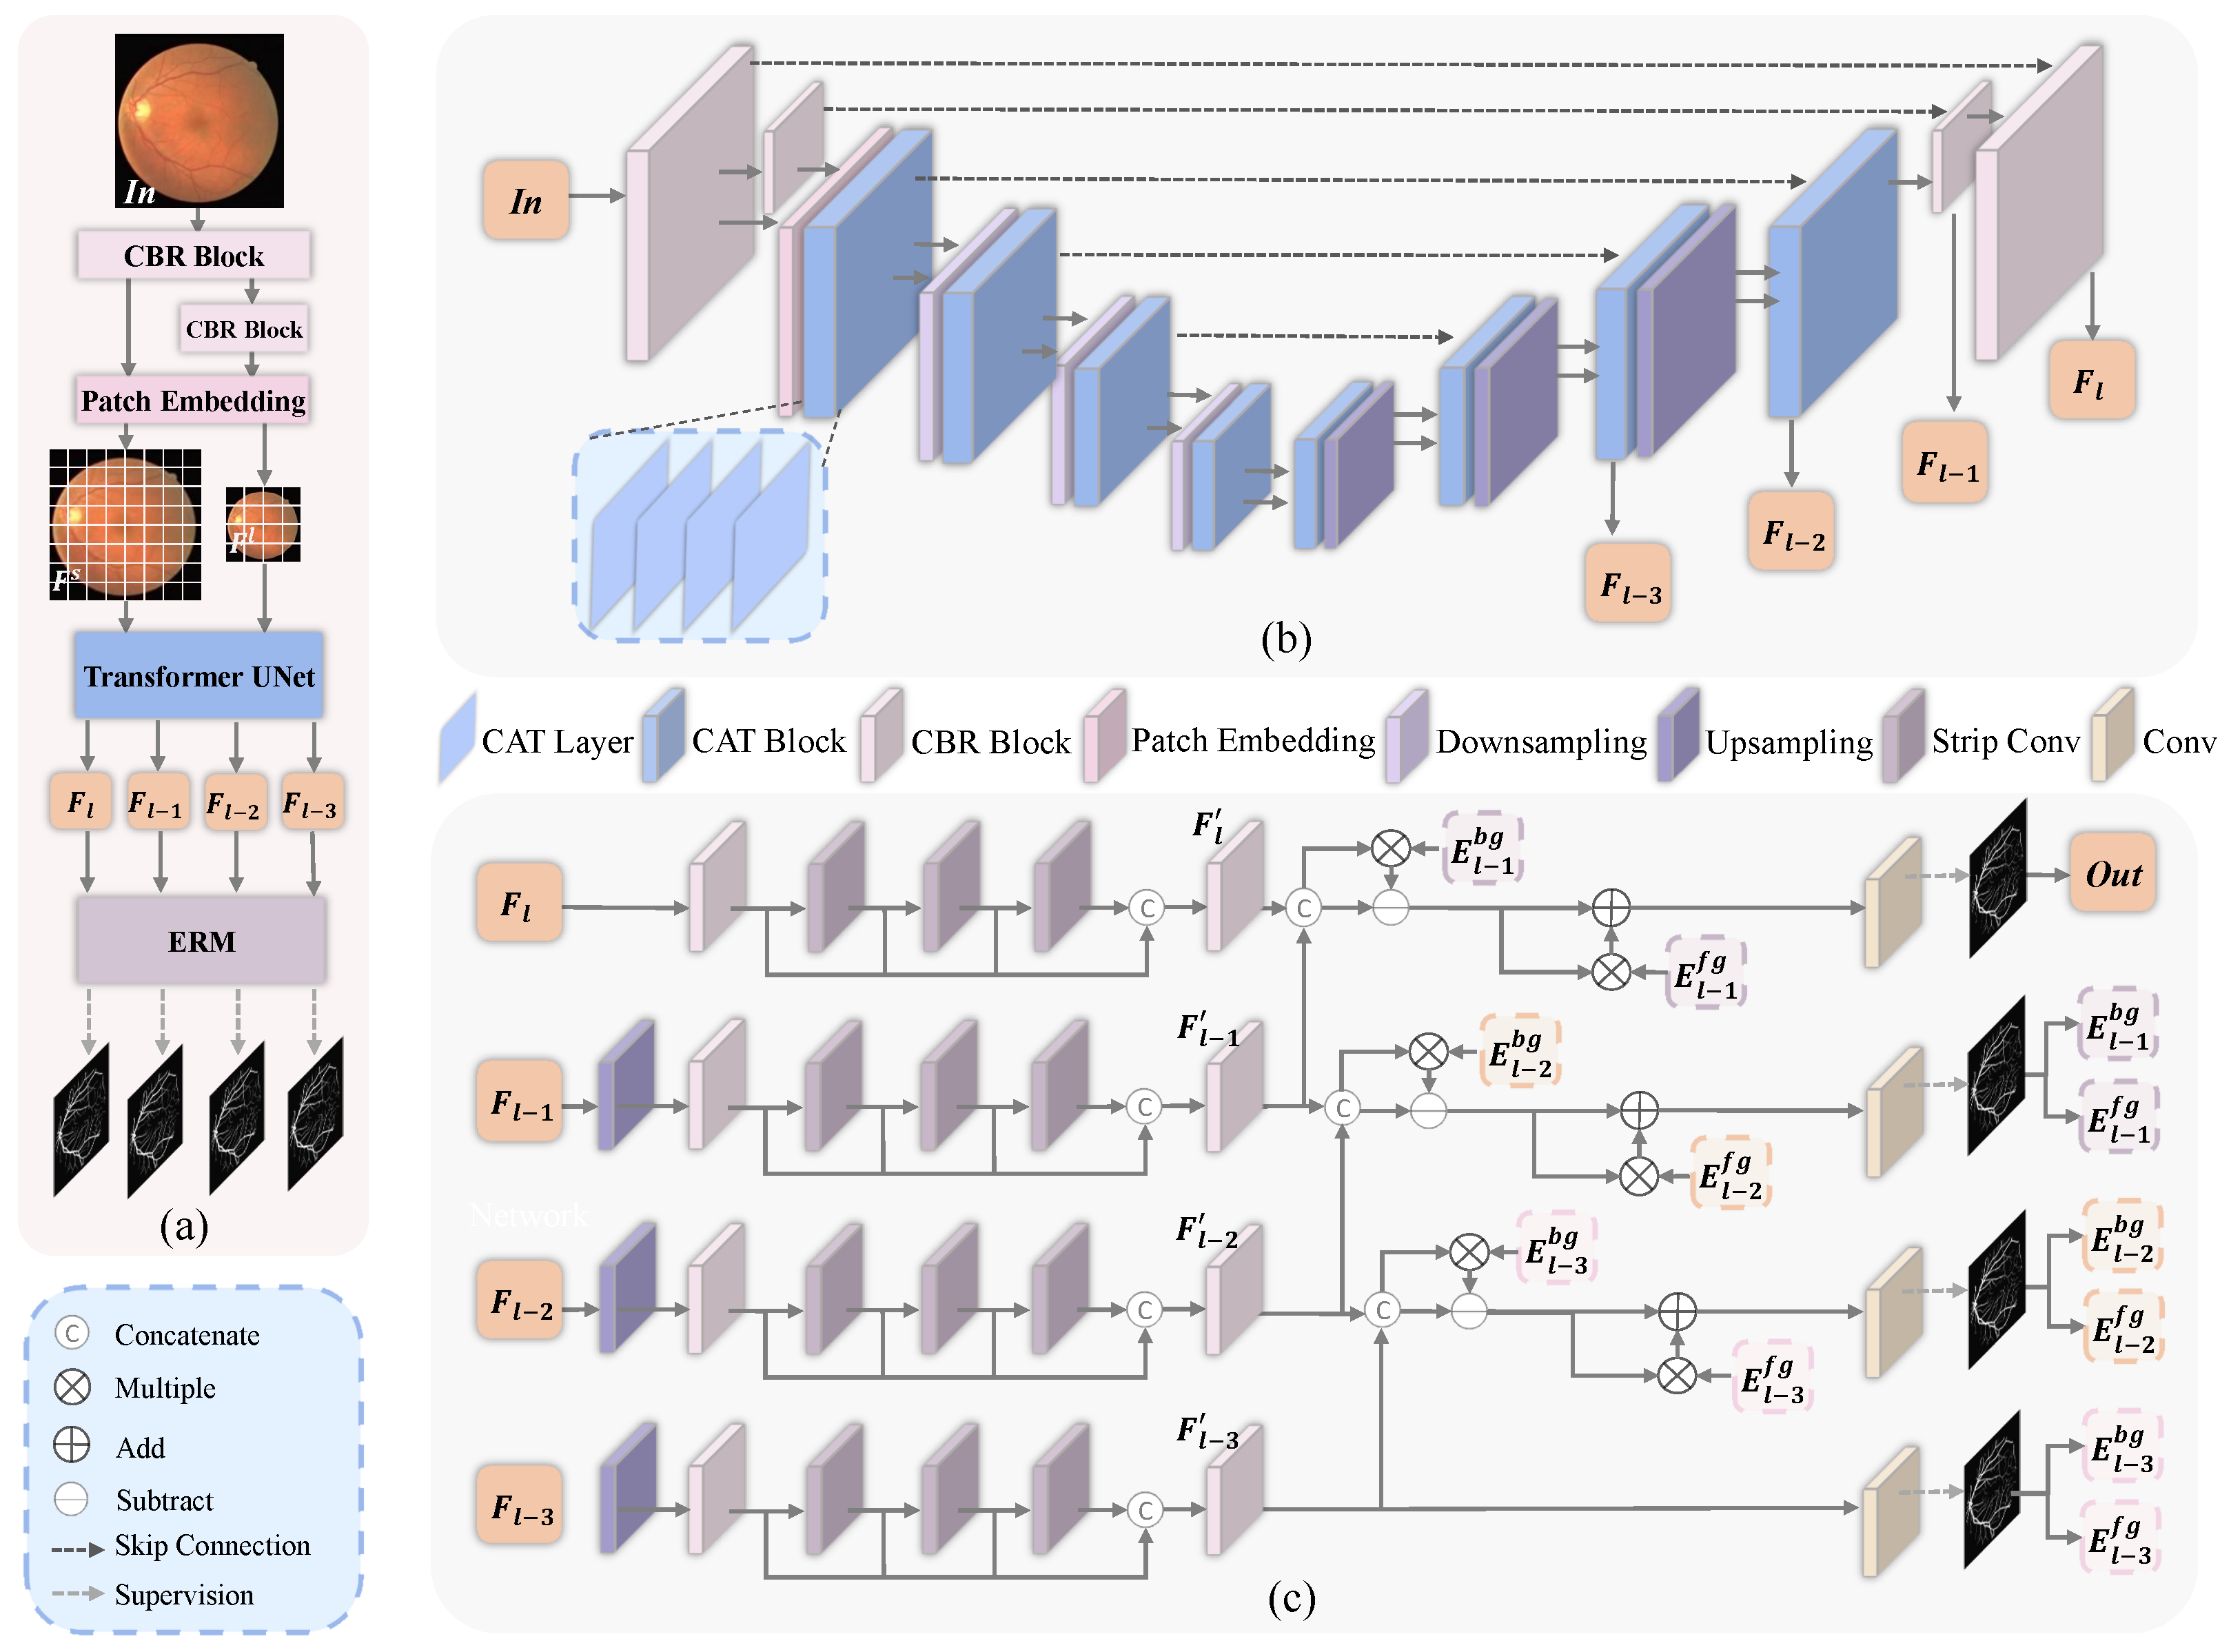
2.1. Framework Overview

The diagram of our method is shown in Figure 1. We denote the input image size as H × W . As the patch embedding [22] with size 4 × 4 in transformer UNet downsamples the image size to H 4 × W 4 , directly using a 4 × upsampling operator in the decoder will lose a lot of shallow features [29]. So we first perform two layers of CBR blocks (i.e., Convolution, Batch Normalization, and ReLU activation) and one downsampling layer to obtain the low-level features F 1 R H × W × 32 and F 2 R H 2 × W 2 × 64 (32 and 64 are the feature dimensions). In this way, we can utilize CBR blocks also in the decoder to gradually generate the prediction maps.
For the multi-scale features construction, we find using the outputs of the former CBR layers can smooth the transition from convolutional layers to transformer layers. Therefore, we adopt patch embedding with size 4 × 4 on both the features F 1 and F 2 to produce different scale features F s and F l (the index is omitted here for a better representation). And we visualize them in the detailed network structure of Figure 1a for intuitive understanding. Such two scale features are fed into the subsequent CAT blocks for cross-scale feature learning and interaction.
The proposed transformer UNet framework in Figure 1b is mainly composed of CAT blocks. In each block, there are multiple CAT layers cascaded together. Maxpooling and bilinear interpolation serve as the downsampling and upsampling operations, respectively. The details of CAT are given in a later subsection.
In the decoder, we can obtain the output features before regressing the prediction maps. A deep-supervision scheme is adopted here for better semantic learning. Specifically, the features of the last four layers with sizes of H 8 × W 8 , H 4 × W 4 , H 2 × W 2 , and H × W are selected for multiple supervisions. As shown in Figure 1a, we introduce ERM into the deep-supervision layers to refine the edges in the prediction maps. ERM consumes the prediction map of the higher layer to suppress background features and enhance vessel features to purify each output representation. So the ultimate output can be refined progressively to improve the segmentation effect. The details of ERM are given in a later subsection.

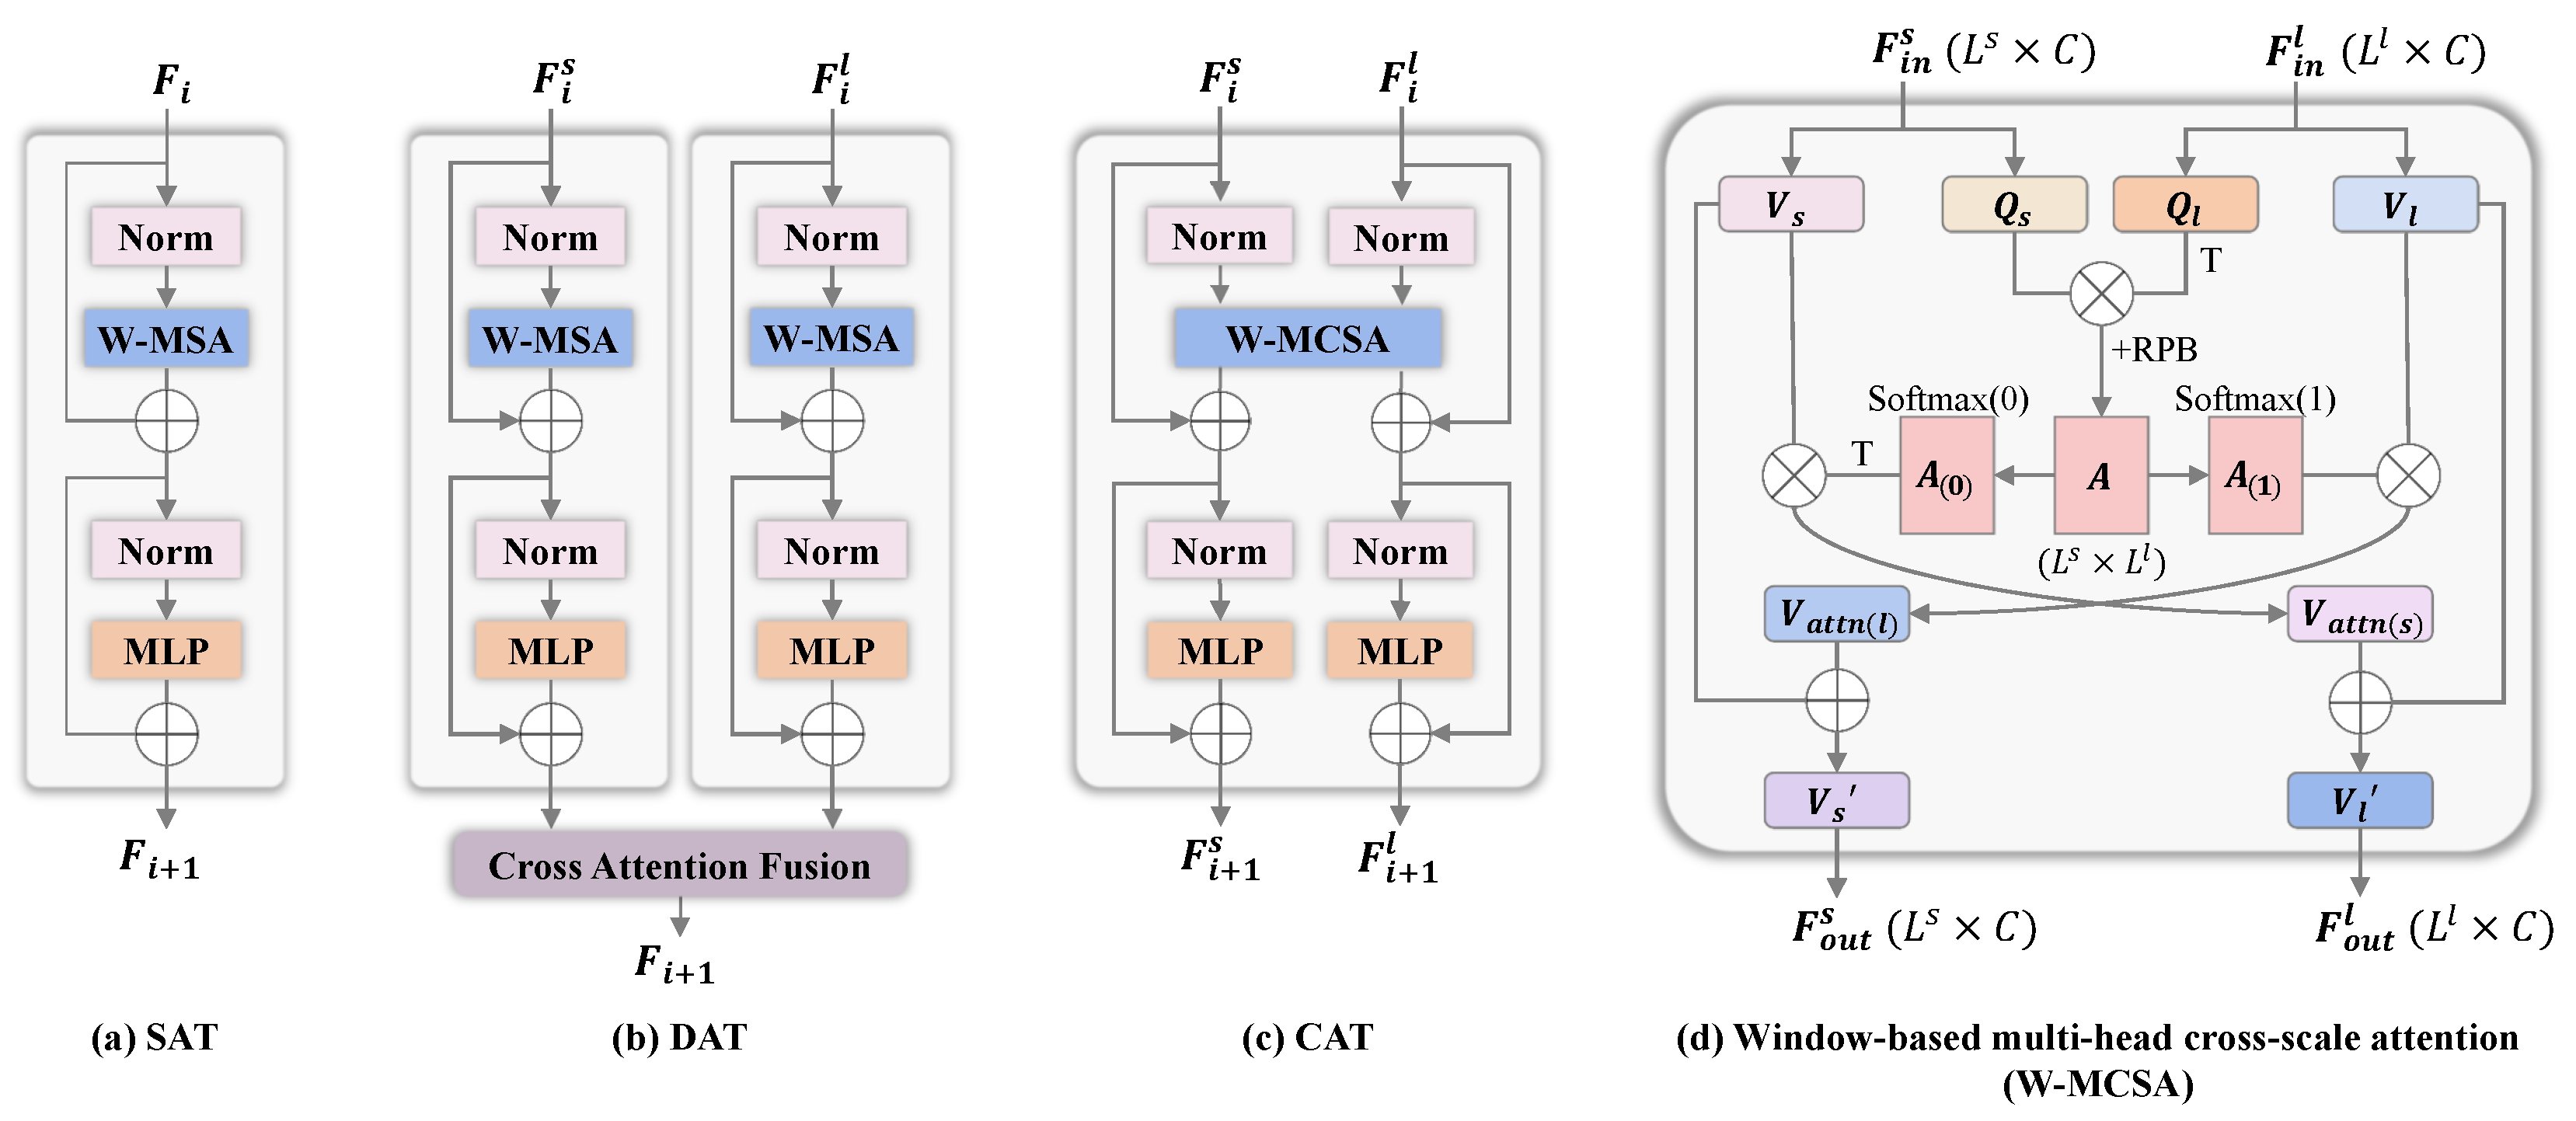
2.2. Cross-Scale Attention Transformer

In this subsection, we will elaborate on the proposed CAT for retinal vessel segmentation. For a clear comparison, we first briefly introduce the native self-attention transformer, which is referred to as Single-scale Attention Transformer (SAT), and Dual-scale Attention transformer (DAT).
SAT is widely utilized in the early transformer UNet frameworks [23,24], which consist of several SAT blocks. In each block, the feature input to i t h layer can be denoted as F i R L × C (C is the feature dimension). SAT is mainly composed of Norm, W-MSA, and MLP with GELU activation. As shown in Figure 2a, SAT can be formalized as
F ^ i = W M S A ( N o r m ( F i ) ) + F i , F i + 1 = M L P ( N o r m ( F ^ i ) ) + F ^ i .
Based on the multi-scale idea, Lin et al. [29] propose DAT to extract the coarse and fine-grained feature representations of different semantic scales. They first perform patch embedding with two sizes to yield different scale features, which can be denoted as F s R L s × C (small-scale) and F l R L l × C (large-scale). They further apply two naive transformer encoders on the features, i.e., F s and F l are fed into different SAT layers, respectively. And a cross-attention fusion (CAF) module is followed to aggregate the features. As shown in Figure 2b, DAT can be written as
F i + 1 = C A F ( S A T ( F i s ) , S A T ( F i L ) ) .
According to previous observation that there are dense similar structures with different scales in retinal images, multi-scale learning is a natural idea to exploit this characteristic. DAT is a simple and feasible scheme for cross-scale learning. However, the scheme that only performing cross-attention after independent single-scale attention is too complex to efficiently integrate features of different scales, resulting in the inability to fully benefit from similar structures. Therefore, we propose CAT in the transformer UNet framework for retinal vessel segmentation. CAT also consumes features F s and F l but achieves attentional feature aggregation in each transformer layer. This is possible due to the newly designed W-MCSA, which is utilized to replace the W-MSA in SAT for cross-scale feature interaction. As shown in Figure 2c, CAT can be written as
F ^ i s , F ^ i l = W M C S A ( N o r m ( F i s ) , N o r m ( F i l ) ) , F i + 1 s = M L P ( N o r m ( F ^ i s ) ) + F ^ i s , F i + 1 l = M L P ( N o r m ( F ^ i l ) ) + F ^ i l .
Apparently, CAT can conduct cross-scale attention interactions and produce fused dual-scale features F i + 1 s and F i + 1 l in only one transformer layer. So we can cascade multiple CAT layers to gradually extract high-dimensional representations to take full advantage of similar structure information at different scales.
The details of W-MCSA are also shown in Figure 2d. For the input dual-scale features F i n s R L s × C and F i n l R L l × C , the traditional way is applying several weight matrices W R C × D to transform F i n s and F i n l to query, key and value features, respectively. In our W-MCSA, it only calculates the query and value vectors of the dual-scale features. The form can be written as
Q s , V s = F i n s W Q s , F i n s W V s , Q l , V l = F i n l W Q l , F i n l W V l .
Then we skillfully utilize a single attention matrix A L s × L l to formulate the cross-scale feature similarity. The form can be written as
A = Q s Q l D + R P B ,
where RPB means relative position bias proposed in [24]. Then we perform Softmax normalization along different dimensions of A to generate attention weights of F i n s to F i n l or F i n l to F i n s . Therefore, the calculation of key features can be economized but efficient cross-attention is also realized. The attentional features can be formalized as
V s = S o f t m a x ( A , 1 ) V l + V s , V l = S o f t m a x ( A , 0 ) V s + V l ,
where the numbers in Softmax mean the dimensions for normalization. And we also include their respective value features to keep feature consistency. Finally, projection matrices are applied to produce the interacted features F o u t s and F o u t l .
It is worth noting that the above cross-attention is applied in a window to balance the receptive field and efficiency, and the attention calculation adopts the multi-head scheme. The architectures of W-MCSA and CAT are ingenious and such design cleverly combines the dual-scale features and attention mechanism. So compared to SAT and DAT, the proposed CAT is more robust and efficient in fusing cross-scale similar structure information. We will discuss the impacts in Section 3.5.

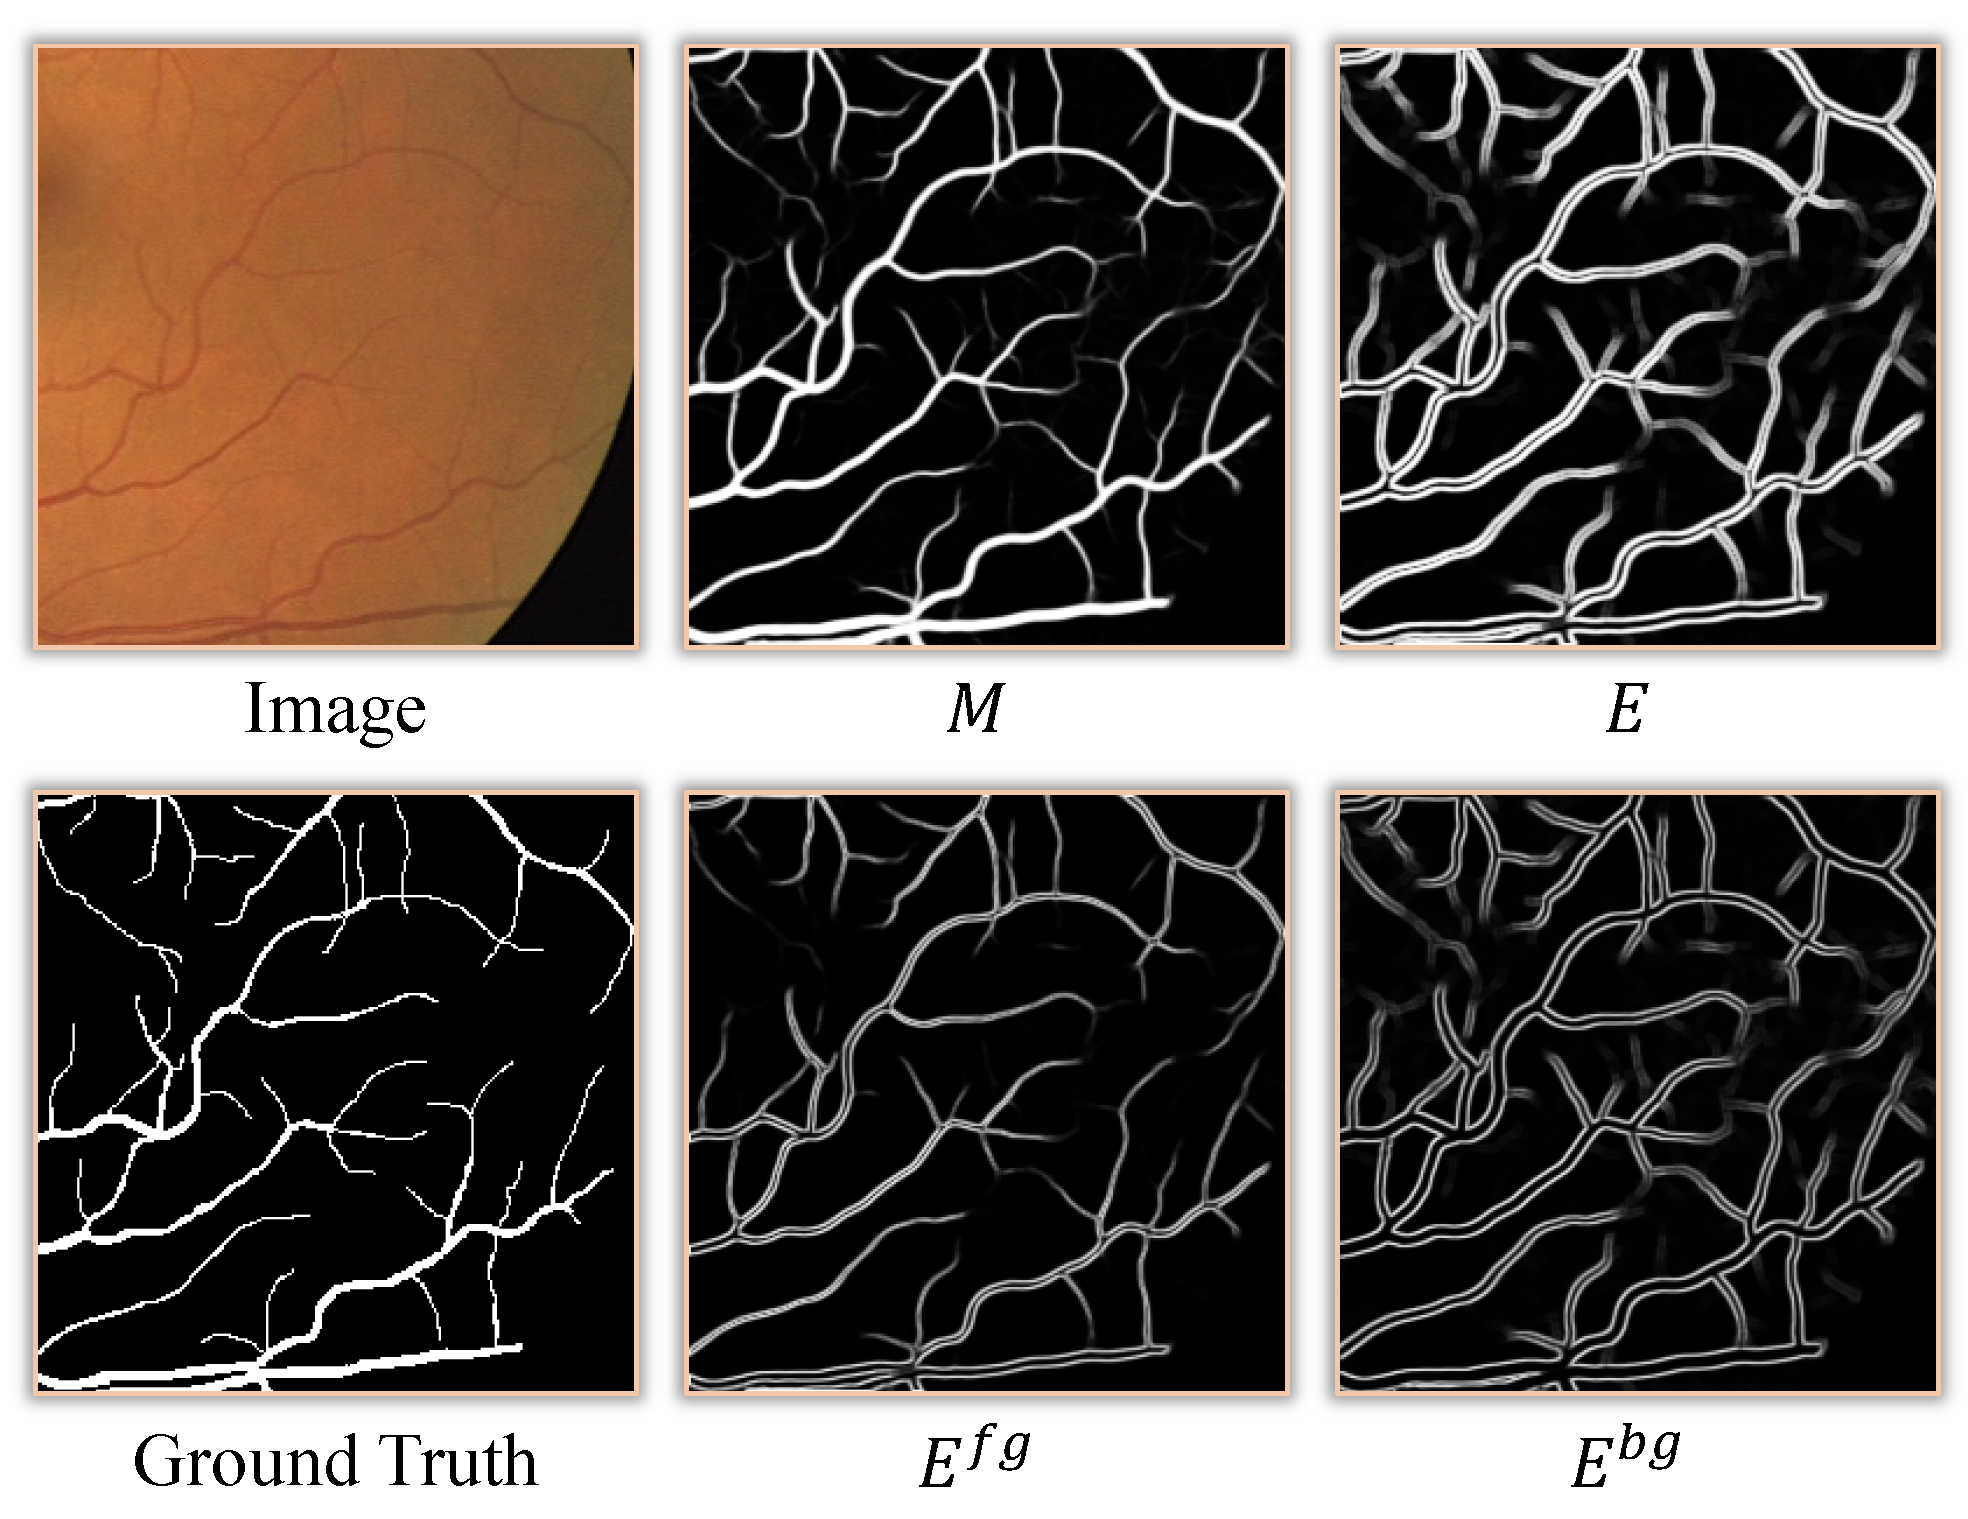
2.3. Edge Refinement Module

In this section, we will introduce the proposed ERM for edge refinement. As the fine-grained foreground of the vessel mask, there is typically misclassifications in the edges of the segmentation results. Based on the idea of edge decoupling, we further propose ERM integrated with the deep-supervision scheme.
As shown in Figure 1c, we select the last four layers in the decoder for multiple supervisions. The features are F l 3 R H 8 × W 8 × 8 C , F l 2 R H 4 × W 4 × 4 C , F l 1 R H 2 × W 2 × 2 C and F l R H × W × C , respectively, and we upsample them to the size of H × W . In each layer, several blocks of strip convolutions, e.g., horizontal, vertical, left diagonal, and right diagonal, are applied to extract shallow morphology features for better vessel prediction. And dense connections are performed to aggregate these features to enrich the representations. The connected and transformed features can be denoted as F l 3 , F l 2 , F l 1 , F l R H × W × C . Edge refinement is expected before regressing feature F to prediction map M R H × W (index is omitted here).
Therefore, for the feature F l of the l t h layer, ERM first generates a soft edge map E l 1 R H × W based on the prediction map M l 1 of the adjacent layer. This operation is implemented through gradient calculation in a 3 × 3 kernel inspired by edge detection. By analyzing the edge map E l 1 , we find that the salient pixels in E l 1 include not only vessel pixels but also background pixels. Thus, we further design a simple but effective approach to excavating the edge map. Specifically, we decouple the edge map E l 1 to a foreground edge map E l 1 f g and a background edge map E l 1 b g through element-wise multiplication based on M l 1
E l 1 f g = M l 1 · E l 1 , E l 1 b g = ( 1 M l 1 ) · E l 1 .
Such that E l 1 f g expresses the vessel pixels near the background, and E l 1 b g expresses the non-vessel pixels near the foreground. An illustration is shown in Figure 3 to clarify the decoupled edge maps. By doing this, ERM can perform feature repressing and enhancement accordingly. The form can be expressed as
F ^ l = B R ( C a t ( F l , F l 1 ) ( 1 E l 1 b g ) ) , F l = B R ( F ^ l ( 1 + E l 1 f g ) ) ,
where F l is the refined feature for subsequent vessel prediction, BR means Batch Normalization and ReLU activation. We also concatenate the feature F l 1 of the adjacent layer. After these attentive operations, ERM suppresses the unexpected background edge features by element-wise subtraction and enhances the foreground edge features by element-wise addition. The module is cascaded to the adjacent layers in the deep-supervision. So the ultimate prediction map can be refined progressively to improve the segmentation result.

2.4. Network Details

The proposed CAT and ERM are integrated into the transformer UNet framework. We implement the network with two CBR blocks and four CAT blocks for feature extraction in different resolutions. Each CAT block is composed of four CAT layers. The window size of W-MCSA in CAT is set to 32 × 32 to balance the receptive field and efficiency. As dual-scale features are produced in the last CAT layer of the decoder, we upsample them to the same resolution and concatenate them as the input of the latter CNN layers. The last four layers are conducted for deep supervision with ERM, and the final output prediction map serves as the vessel segmentation result in the inference stage.

3. Results

In this section, we perform comprehensive experiments on public datasets to verify the effectiveness of our method. Then quantitative and qualitative results are presented to evaluate the segmentation performance of our framework. Finally, we further explore the effect of our innovations through an ablation study.

3.1. Datasets

This work is evaluated on two widely-used datasets, including DRIVE [30] and CHASE_DB1 [31]. DRIVE dataset has 40 color retinal images, including seven abnormal pathology cases. And it is fixedly split into two sets for training and testing, respectively. The training set contains only one manual segmentation of an ophthalmologist, while two manual annotations have been applied by two different observers in the testing set. Following many existing methods [32,33,34], the manual annotation of the first observer is used as the ground truth for training and evaluation. The spatial resolution of each image in the dataset is 584 × 565. And we uniformly crop the training images into patches with a size of 256 × 256. In addition, the dataset also provides the Field Of View (FOV) masks.
The CHASE_DB1 dataset contains 28 color fundus images from both the left and right eyes of 14 children. To be consistent with previous methods, the first 20 images are used for training and the remaining are for testing. Each image has different manual annotations from two experts. For a fair comparison with other methods, manual annotations of the first expert are taken as ground truth in the experiments. The spatial resolution of each image is 999 × 960. Due to the high resolution of the original images in the dataset, we crop them into patches with a size of 384 × 384 as the network input. The FOV masks of CHASE_DB1 dataset are not provided, we generate them by a simple threshold filtering according to Boudegga et al. [35].

3.2. Implementation Details

Regarding the data preprocessing, we first convert color fundus images to gray images. Then we normalize the gray images to a standard normal distribution and re-scale them to image space. In addition, Contrast Limited Adaptive Histogram Equalization (CLAHE) [36] and gamma correction are also employed to enhance image contrast. Finally, we perform data augmentation, e.g., image flip, random rotation, and random zoom, to improve the robustness and prevent overfitting during training.
We adopt the PyTorch framework to conduct all the experiments on a PC with Intel Xeon E5 CPU, 64GB RAM, and an NVIDIA RTX 3090 GPU. During the training, the initial learning rate is set to 0.0005 for both DRIVE and CHASE_DB1. To dynamically adjust the training process, we utilize the multi-step decay strategy to update the learning rate. The batch size is set to 2, and the maximal epoch is 150. Moreover, we use the Adam algorithm as the training optimizer.
The loss function of our network is the class-weighted binary cross-entropy loss L B C E , which is defined as
L B C E = 1 N j = 0 N ( y j l o g y j + ( 1 y j ) l o g ( 1 y j ) )
where N denotes the number of pixels of each image. y denotes the ground truth label, and y represent the prediction value. Class weights of 1.5 and 1 are found appropriate for vessel and non-vessel in our experiments. Since we employ a deep supervision scheme in the last four layers, L t o t a l can be written as:
L t o t a l = L ( G , M l 3 ) + L ( G , M l 2 ) + L ( G , M l 1 ) + L ( G , M l )
where L denotes the BCE loss L B C E , G is the ground truth mask, and M k is the prediction map of k t h layer.

3.3. Evaluation Metrics

To quantitatively compare with the state-of-the-art methods, we use the standard evaluation metrics, including Accuracy (Acc), Dice, the area under curve (AUC), Sensitivity (Se), and Specificity (Sp). Acc measures the overall performance of the segmentation results. Dice (also called F1-score) is to evaluate the network performance in an imbalance binary segmentation task. For binary segmentation of retinal vessels, positive and negative are classified as vessel pixels and background pixels, respectively. Therefore, Se and Sp represent the segmentation accuracy of the vessel and background pixels, respectively. Furthermore, the receiver operating characteristic curve (ROC) reflects the trade-off between sensitivity and specificity, and the area under the curve (AUC) is used to comprehensively assess the capability of network classification.

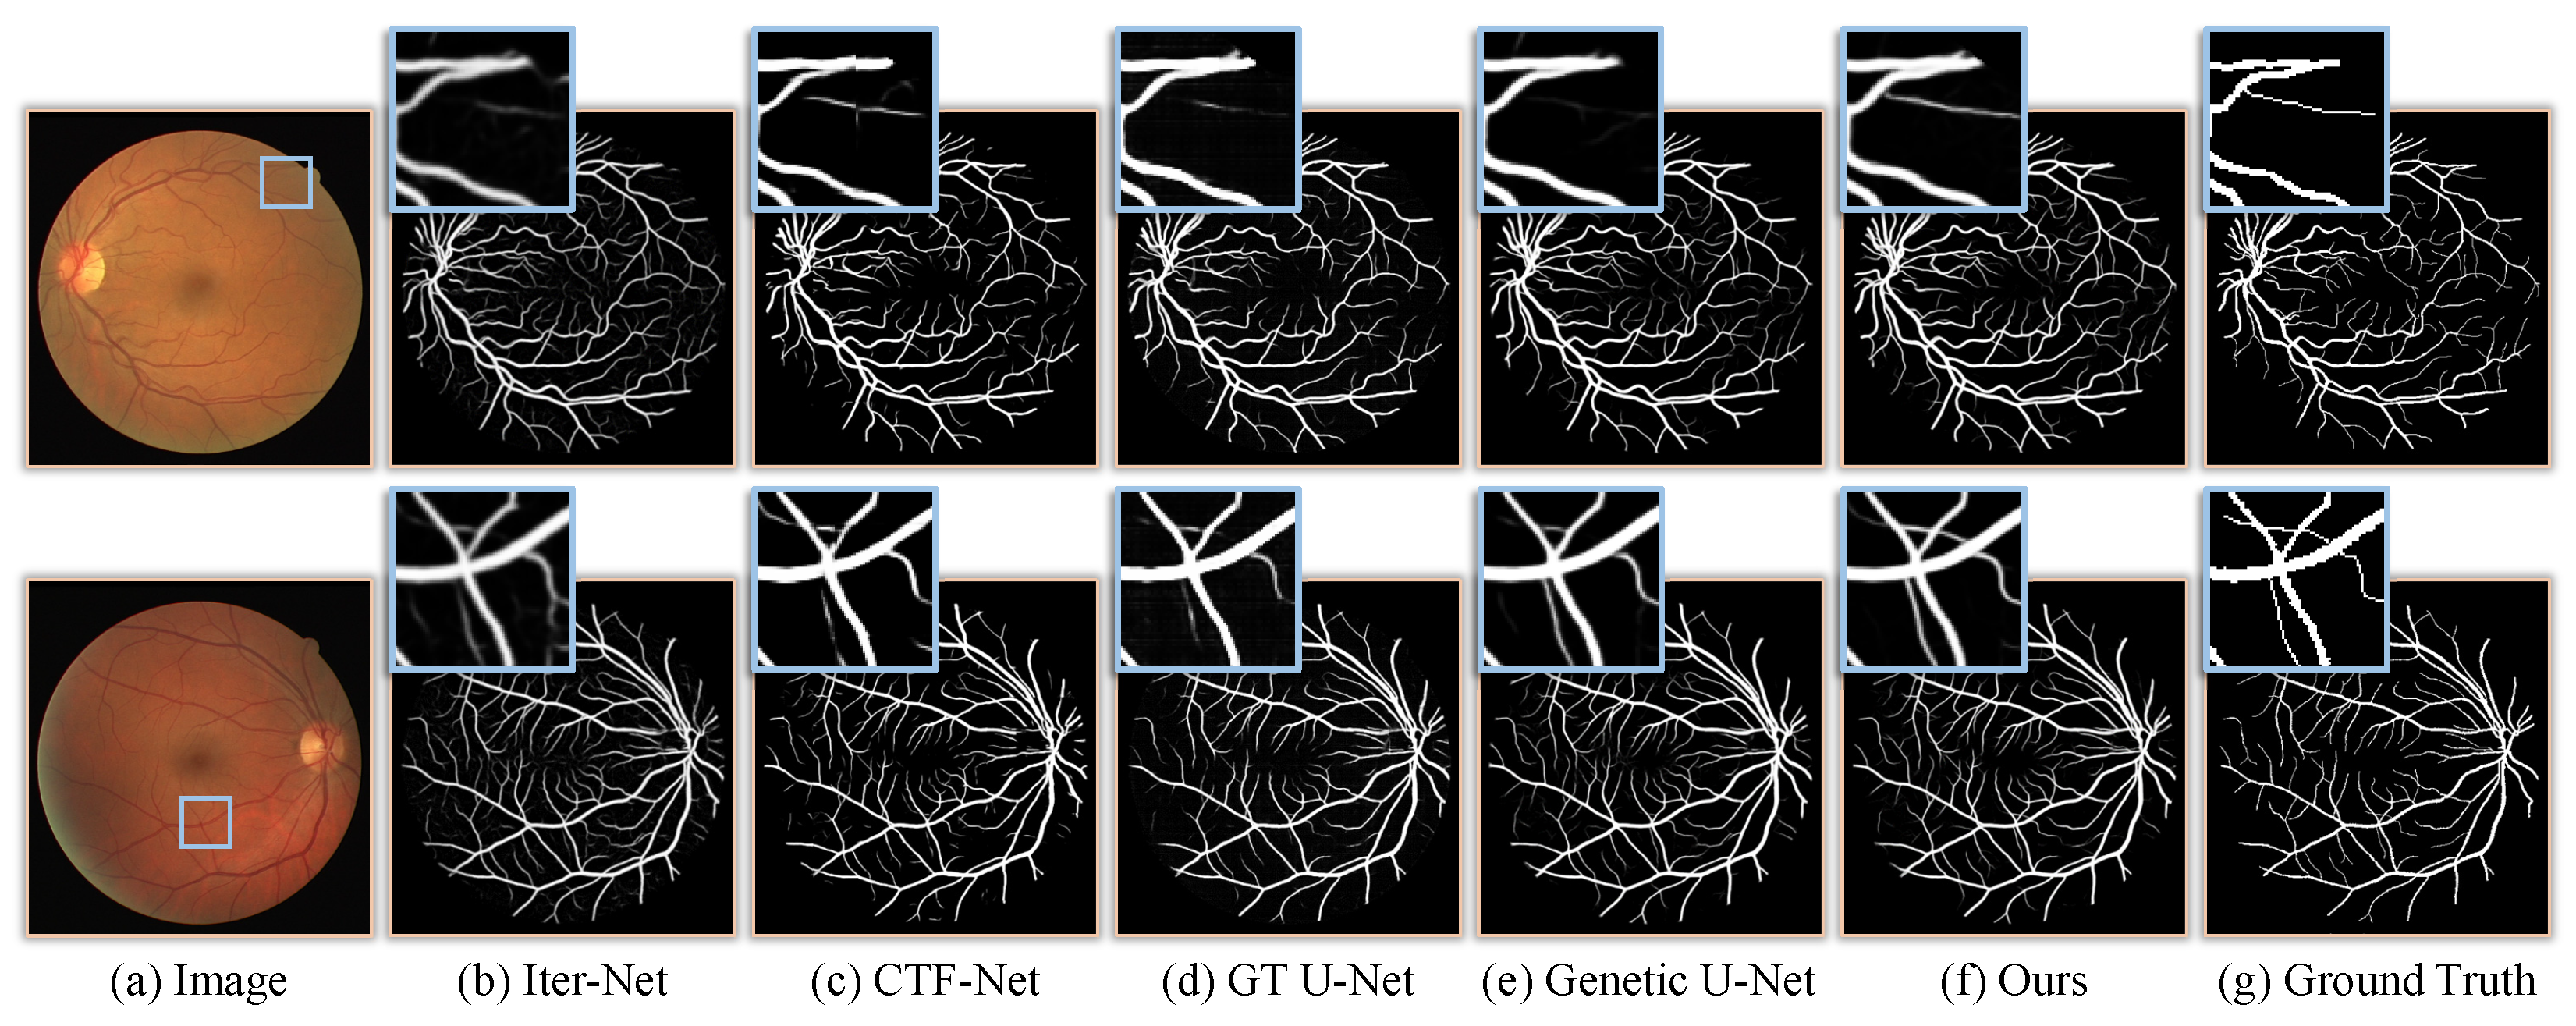
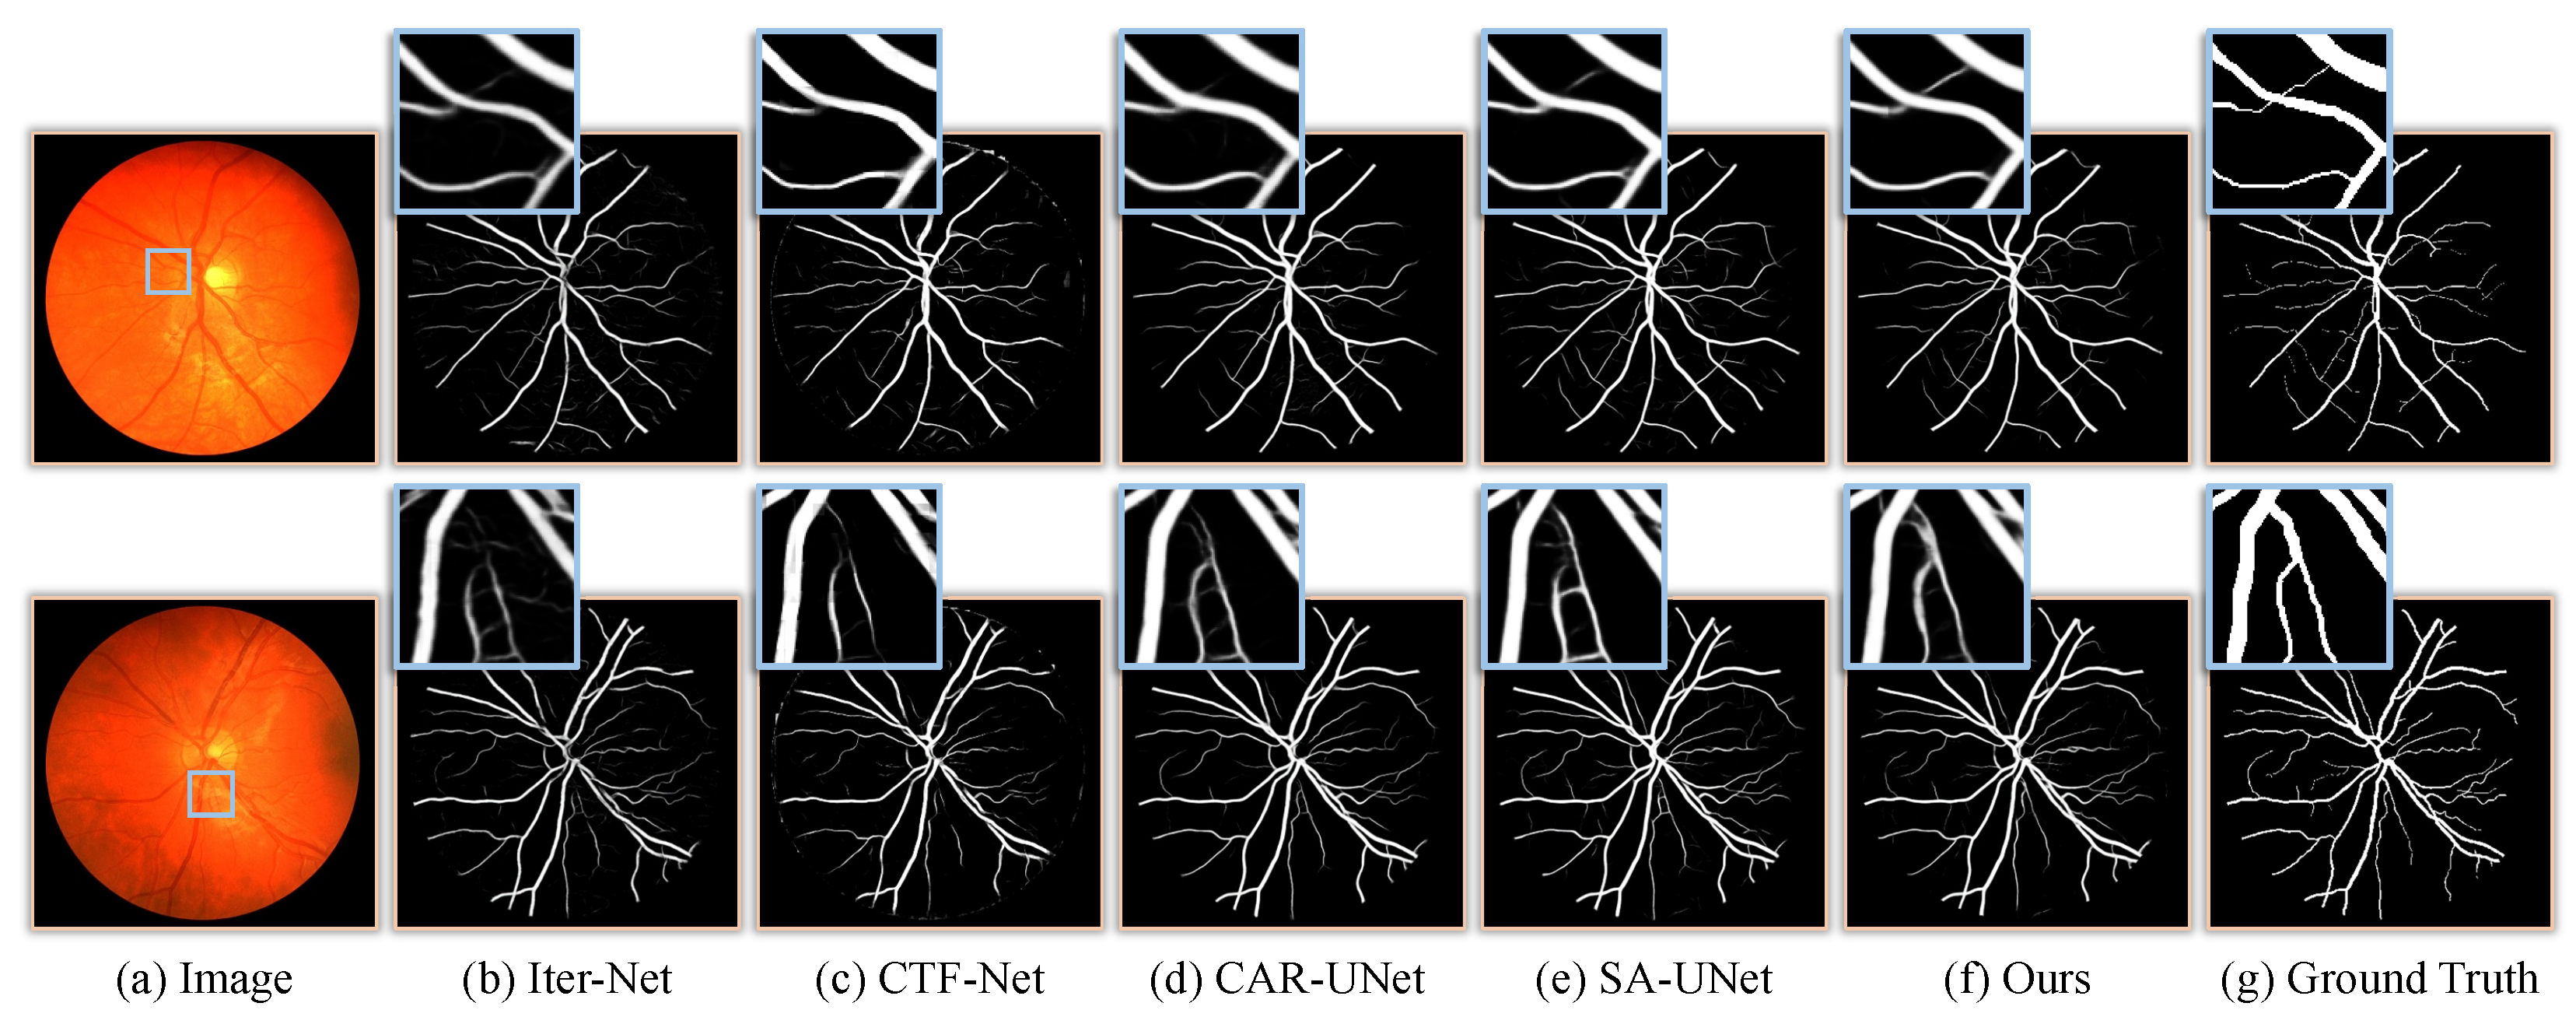
3.4. Results and Comparisons
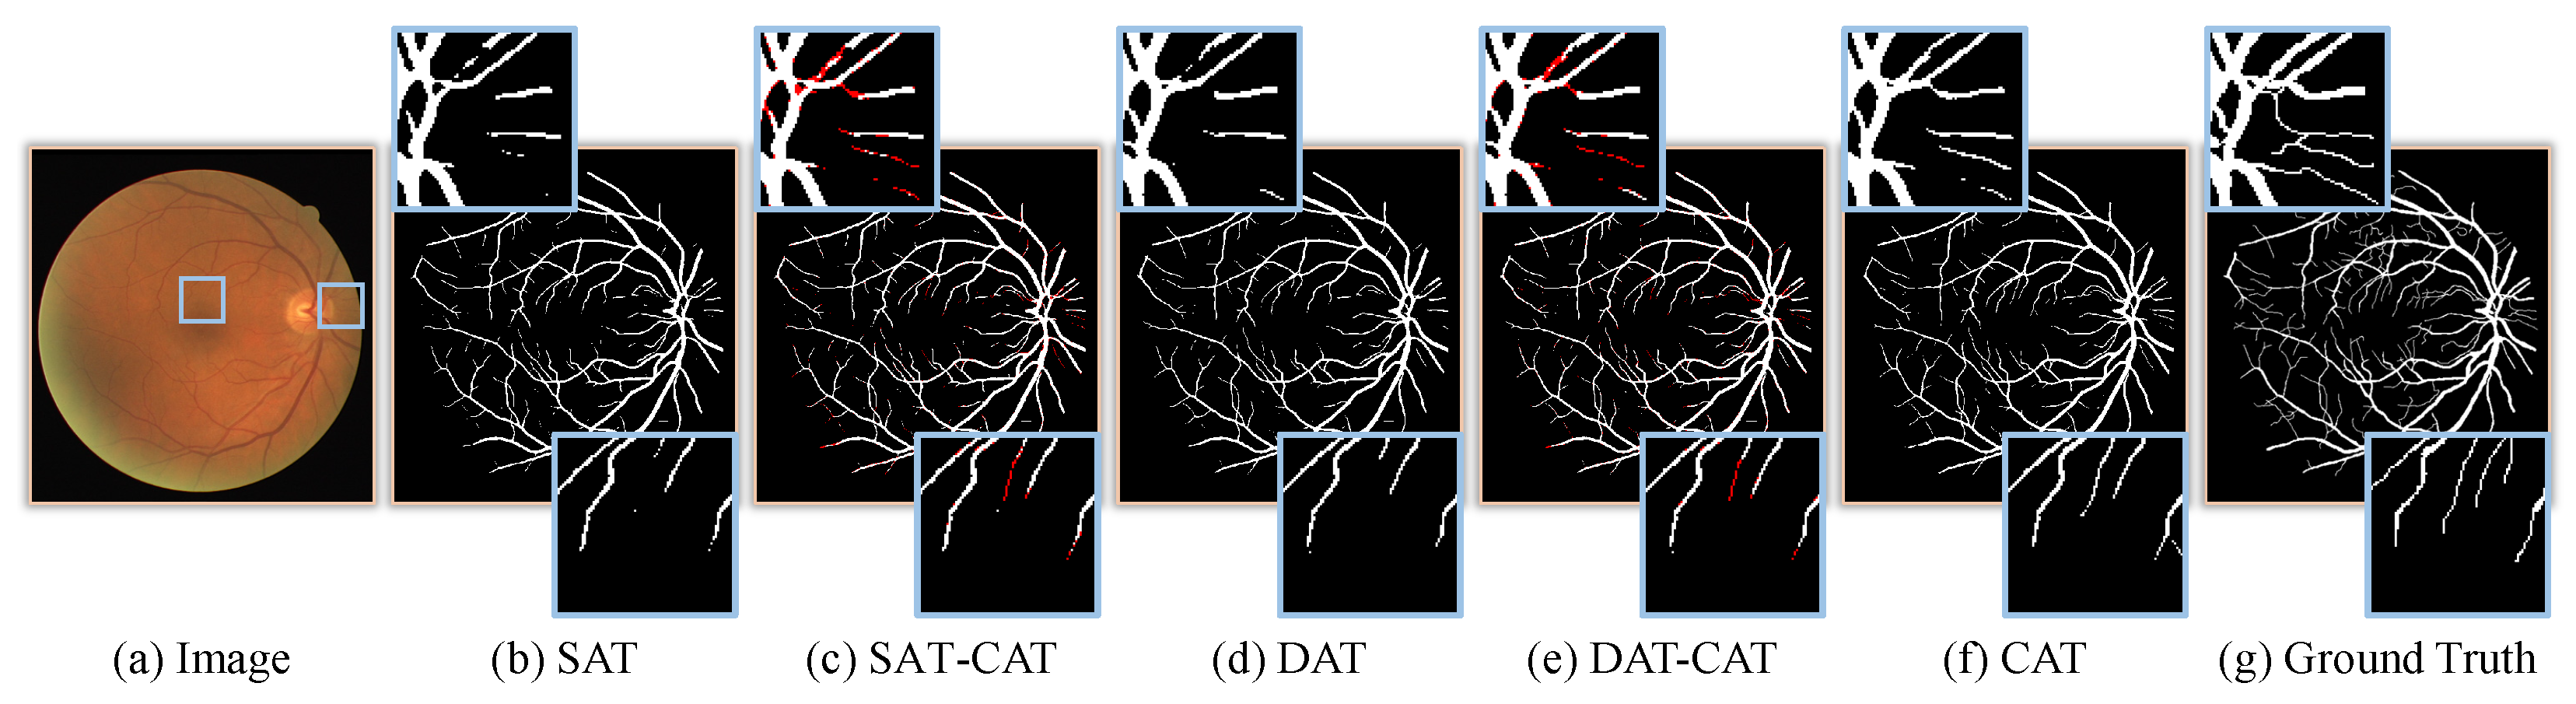
Compared Methods: To demonstrate the superiority of the proposed method, we collect many state-of-the-art approaches as competitors, including CNN-based methods (e.g., SA-UNet [14], CTF-Net [33]) and transformer-based methods (e.g., GT U-Net [27], GT-DLA-dsHFF [37]). Moreover, we also compare our network against two methods based on the multi-scale features (i.e., Dual E-Unet [38] and SCS-Net [39]), and two edge-aware methods (i.e., BEFD-UNet [40], DE-DCGCN-EE [41]). For SA-UNet [14], GT U-Net [27], Iter-Net [32], CTF-Net [33], CAR-UNet [34], and Genetic U-Net [42], we generate their segmentation results based on the released codes by the authors. And the results of other compared methods are directly from the corresponding papers.
Quantitative Comparisons:Table 1 and Table 2 report the quantitative results of our network and compared methods. For the DRIVE dataset, our quantitative results of Acc, Dice, AUC, Se, and Sp are 97.05%, 83.33%, 98.87%, 84.68%, and 98.26%, respectively. Compared with all other methods, the proposed model achieves the best results in Dice, AUC and Se, while producing a comparable score in other metrics. Specifically, SGL [43] achieves the highest Se among the competitors, but our method is still 0.88% higher than it. And our result is also 0.17% higher than it in Dice, while maintaining almost the same Acc, AUC, and Sp. In terms of the metric Sp, although CAR-UNet [34] achieves the highest score among all the compared methods, its other metrics are all lower than our method, especially for Dice and Se, which are 0.8% and 3.33% lower, respectively. Overall, our method has great advantages in Dice and Se, which are 0.17–2.06% and 0.88–7.26% higher than other methods, respectively. As described in the definitions of Dice and Se, these improvements indicate that our method is more capable of segmenting vessels in challenging regions. More importantly, our proposed model fulfills such superiority while achieving the best balance among the evaluation metrics compared to the state-of-the-art methods.
Regarding the CHASE_DB1 dataset in Table 2, we can find that our method achieves the best Acc score of 97.66% and the best Se score of 86.59% among all methods. The most significant improvement is Se, which measures the accuracy of vessel segmentation, outperforming other methods by at least 0.86%. Thus, it means that our model can correctly localize and segment more vessel pixels. Since the vessel region occupied less than 10% of the whole image, Dice which denotes the degree of overlap between the predictions and the ground truth is more susceptible to the background. Although DE-DCGCN-EE [41] obtains the optimal Dice, our method takes the second rank and our Dice score (82.36%) is very close to the best one (82.61%). In contrast, our method has a Se improvement of 2.59% over DE-DCGCN-EE, demonstrating that our model has more ideal performance in the classification of vessel pixels. SA-UNet [14] adopts a spatial attention module for adaptive feature refinement, thereby achieving the highest AUC. Nevertheless, compared to SA-UNet, our model achieves improvements of 0.86%, 0.83%, 0.11%, 0.07% on Se, Dice, Acc, and Sp.
Visual Comparisons: Apart from the quantitative results, we also present the visual comparisons against other methods in Figure 4 and Figure 5. Specifically, we visualize the retinal vessel segmentation results produced by our network and state-of-the-art methods in terms of two test cases. As shown in Figure 4, the collateral vessels in the results of Iter-Net [32], GT U-Net and Genetic U-Net are seriously missing or misclassified. CTF-Net [33] utilizes deep coarse-to-fine supervision network to refine segmentation and segments more collateral vessels than others. However, there are still broken vessels in CTF-Net. Therefore, the existing methods have difficulty segmenting the collateral vessels in challenging regions. The results are either completely without collateral vessels or with segmented broken vessels. Nevertheless, our predicted segmentation map has the same complete collateral vessels as the Ground Truth. As visualized in Figure 5, Iter-Net, CTF-Net, and CAR-UNet have poor segmentation performance at collateral vessels or the intersection of vessels. Although SA-UNet obtains better vessel probability in the prediction map than Iter-Net, CTF-Net, and CAR-UNet, it still has the problem of misclassification. However, our proposed model can effectively alleviate this limitation. It means that our model can exactly locate and segment more collateral vessels while maintaining the segmentation effect of the main vessels.
Parameters and FLOPs: For a fair comparison, we also count the network parameters and the FLOPs when inferring a test retinal image. The results are listed in Table 3. The method utilizing CNN is lighter, with fewer parameters and FLOPs. Transformer networks typically contain more parameters than CNNs. Especially since our method introduces cross-scale learning, we have achieved the maximum number of parameters. However, thanks to the window-based attention structure [25], our network has FLOPs that are lower than the other two transformer-based methods.

3.5. Ablation Study

To further verify the effectiveness of major components of our network, we perform ablation experiments on the DRIVE dataset. To do so, we first take a U-shaped framework (denoted as transformer UNet) based on the transformer block as the basic architecture in this experiment. Then, SAT, DAT, and CAT are respectively used as the transformer block to compare their segmentation capabilities. Then we add ERM to these three variants to evaluate the effect of ERM. The experimental results have been summarized in Table 4. And the visual comparisons of the segmentation results are presented in Figure 6.
As shown in Table 4, compared to SAT and DAT, CAT achieves 97.01% on Acc, 82.99% on Dice, 98.79% on AUC, and 83.73% on Se, which outperforms SAT by an improvement of 0.11%, 0.81%, 0.19%, and 1.64%, respectively. The most remarkable improvement is Se, indicating that the CAT can significantly improve the sensitivity of the network on multi-scale features. Although the Sp of 98.30% in CAT is lower, the disadvantage is negligible. And in Figure 6c, we can further compare and analyze the difference between the segmentation results of CAT and SAT through the red part. We find that the segmentation effect of main vessels in CAT is more complete than in SAT, while more collateral vessels are segmented. Furthermore, CAT is 0.08%, 0.55%, 0.13%, and 0.87% higher than DAT in terms of Acc, Dice, AUC, and Se, respectively. The overall improvement means that compared with DAT, the cross-scale scheme designed in CAT can efficiently fuse the features with similar structures to improve vessel segmentation performance in challenging regions. As visualized in Figure 6e, the patches at the top and the bottom prove that CAT is able to better identify collateral vessels or microvessels in challenging regions. In conclusion, CAT can segment more collateral vessels or microvessels than SAT and DAT in challenging regions while maintaining the segmentation effect of the main vessels.
To explore the effect of ERM, we conduct the experiments with three different configurations, which are the SAT with ERM, the DAT with ERM, and the CAT with ERM. It can be observed in Table 4 that SAT with ERM achieves improvements of 0.1%, 0.56%, 0.14%, 0.41% on Acc, Dice, AUC, and Se compared to SAT while showing a comparable score on Sp. After adding ERM based on the previous experiment of DAT variation, all of the five performance indicators have been increased. The overall improvement in performance metrics proves that the progressive refinement of the prediction map is beneficial to alleviate the edge-blurring problem. In particular, CAT with ERM produces SOTA results on almost all metrics. Specifically, it outperforms CAT by an improvement of 0.04%, 0.34%, 0.08%, and 0.95% in terms of Acc, Dice, and Se. Although it is not as good as CAT in Sp, it still produces close and comparable scores. More importantly, the performance of three experiments of SAT, DAT, and CAT are improved after adding ERM respectively. It demonstrates that the proposed ERM can provide supplementary information for high-level features, thereby further promoting retinal vessel segmentation.

4. Discussion

4.1. The Effect of Input Patch Size

It is a common operation to crop the input image into square patches in a transformer network. A large patch size leads to faster inference time but more memory consumption. We adjust the input patch to multiple sizes to explore the performance of our method under different hardware and demand scenarios. Specifically, we consider five different patch sizes, and they are 384 × 384, 256 × 256, 192 × 192, 128 × 128, and 96 × 96. The results on DRIVE dataset are shown in Figure 7.
We can see that the results of Acc and Sp are almost unchanged for different input patch sizes on the DRIVE dataset. As the patch size becomes larger, Dice and Se gradually increase. The reason behind this is that small patches ignore rich cross-scale similar structures. For the Se metric, the highest score is obtained when the patch size is 256 × 256. Therefore, we empirically select 256 × 256 as the input patch size for the DRIVE dataset.

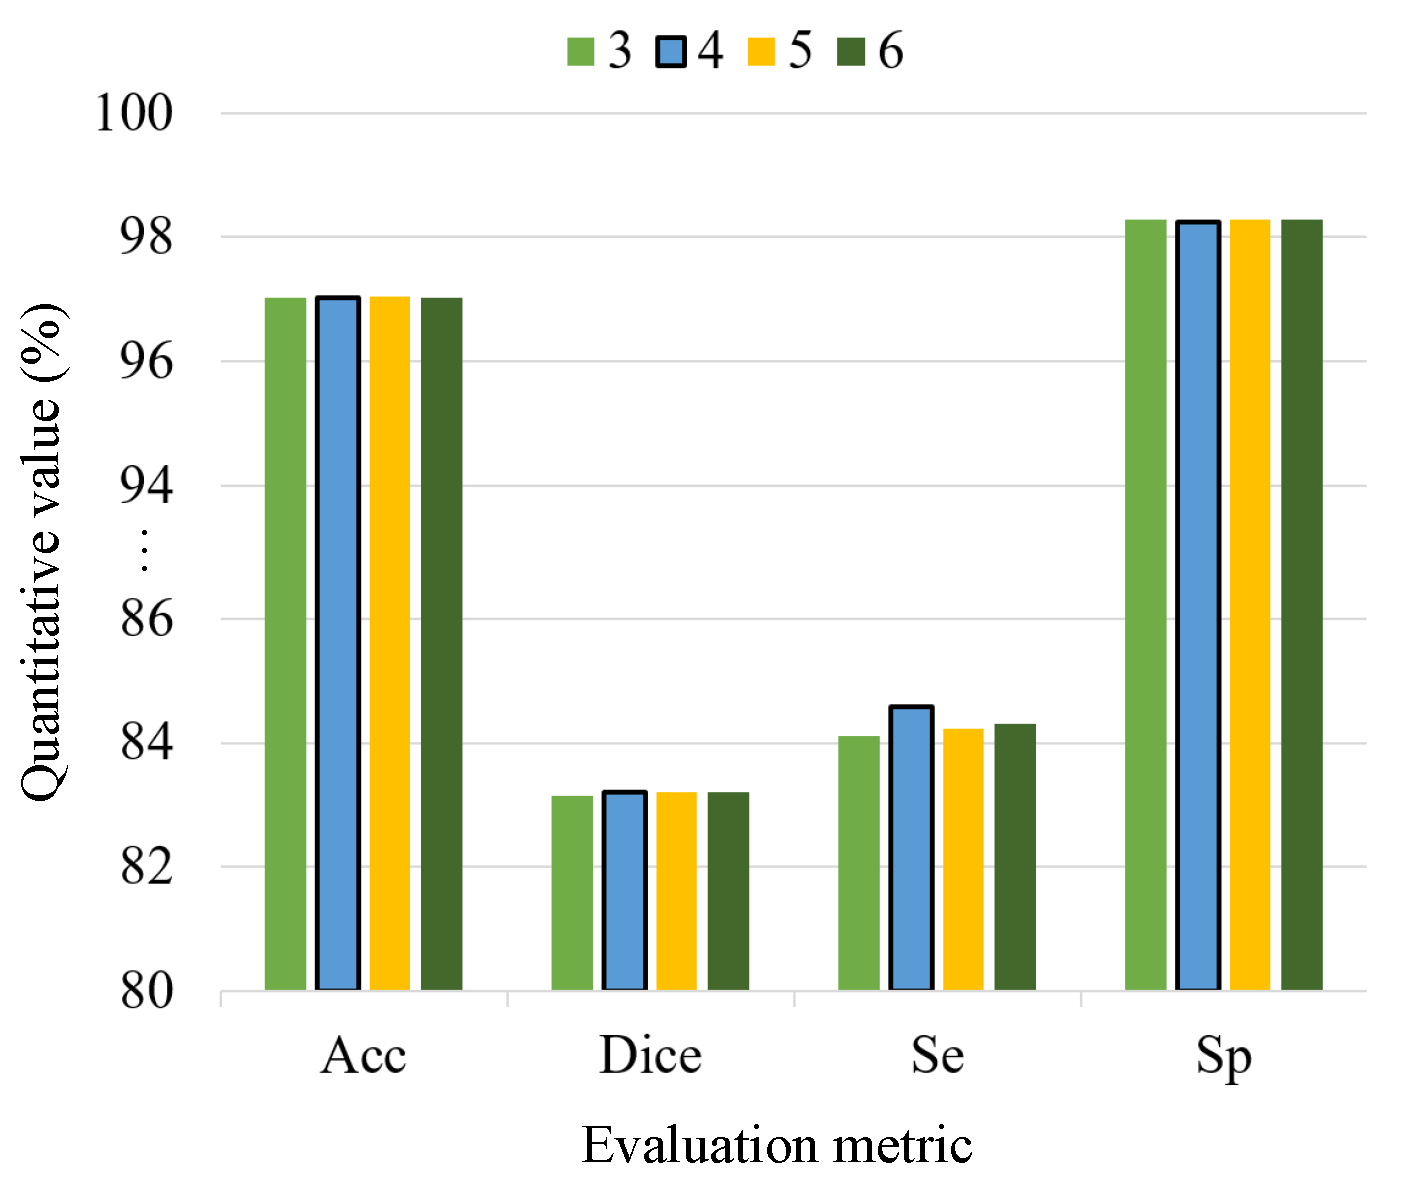
4.2. The Effect of CAT Layers

In order to verify the ability of cross-scale learning of the proposed CAT, we conduct experiment with different numbers of CAT layers in each transformer block. Specifically, our network has four transformer blocks in the encoder, and we consider four settings on the number of CAT layers in the transformer blocks. The four settings are [4, 4, 8, 8], [4, 4, 4, 4], [2, 2, 4, 4], and [2, 2, 2, 2].
Table 5 reports the quantitative results of our network with different numbers of CAT layers in the transformer blocks. Apparently, the number of network parameters and the training time is increased when we use a large number of CAT layers. From these quantitative results, we can find that the setting with [4, 4, 4, 4] has the largest Acc, Dice, and Se scores, and its Sp score (98.26%) is also close to the best one (98.27%). Hence, we empirically set the numbers of CAT layers in the transformer blocks as [4, 4, 4, 4].

4.3. The Effect of Deep-Supervision Layers

Deep-supervision schemes [45] have been widely used to boost the training of intermediate layers and mitigate gradient disappearance. Motivated by this, we adopt the deep-supervision scheme and further integrate ERM into the multiple supervision layers to progressively refine the prediction map. To evaluate the performance of ERM more thoroughly, we adjust the number of deep-supervision layers for training to analyze the effects. Note that the number of ERMs will also change when selecting a different number of deep-supervision layers.
As shown in Figure 8, there are no obvious performance differences in terms of the Acc, Dice, and Sp scores when the numbers of deep supervision layers are three, four, five, and six. Only for the Se metric, we find that the best effect is obtained when the number of supervision layers is four. Hence, we empirically design four deep-supervision layers with ERMs in our method.

5. Conclusions

The method proposed in this paper has two major innovative components: Cross-scale Attention Transformer (CAT) and progressive Edge Refinement Module (ERM). CAT explores a novel cross-scale attention mechanism in transformer UNet to integrate multi-scale features with similar structures in a retinal image. ERM is designed to decouple the edge map to enhance vessel features and suppress background features in multiple supervision layers. These two novel structures encourage the network to enhance the cross-scale learning ability and refine the vessel edges progressively. Experimental results on two public datasets have shown the effectiveness of the proposed method and the superior segmentation performance on collateral vessels.

Author Contributions

Conceptualization, Y.Y.; methodology, software and visualization, Y.Y. and Y.Z.; validation, Y.Y., Y.Z. and L.Z.; investigation, Y.Q.; resources, L.C.; writing—original draft preparation, Y.Y.; writing—review and editing, Y.Z. and L.Z.; supervision and funding acquisition, L.C. and Y.Q. All authors have read and agreed to the published version of the manuscript.

Funding

This research was funded by the National Key Research and Development Program under grant number 2022YFB4703500; National Natural Science Foundation of China (NSFC) General Project grant number 62072452; Shenzhen Science and Technology Program grant number JCYJ20200109115627045 and JCYJ20220818101401003; International Scientific and Technological Cooperation Foundation of Shenzhen, GJHZ20200731095005016; and in part by the Regional Joint Fund of Guangdong grant number 2021B1515120011.

Data Availability Statement

The data presented in this study are openly available in [DRIVE] at [10.1109/TMI.2004.825627] [30], and [CHASE_DB1] at [10.1109/TBME.2012.2205687] [31]. The code of this work is released on https://github.com/Yuanggyy/Retinal-vessel-segmentation (accessed on 13 December 2023).

Conflicts of Interest

The authors declare no conflict of interest.

References

  1. Wong, T.Y.; Mitchell, P. Hypertensive retinopathy. N. Engl. J. Med. 2004, 351, 2310–2317. [Google Scholar] [CrossRef] [PubMed]
  2. Patton, N.; Aslam, T.; MacGillivray, T.; Pattie, A.; Deary, I.J.; Dhillon, B. Retinal vascular image analysis as a potential screening tool for cerebrovascular disease: A rationale based on homology between cerebral and retinal microvasculatures. J. Anat. 2005, 206, 319–348. [Google Scholar] [CrossRef] [PubMed]
  3. Zhu, C.; Zou, B.; Zhao, R.; Cui, J.; Duan, X.; Chen, Z.; Liang, Y. Retinal vessel segmentation in colour fundus images using extreme learning machine. Comput. Med. Imaging Graph. 2017, 55, 68–77. [Google Scholar] [CrossRef] [PubMed]
  4. Mendonca, A.; Campilho, A. Segmentation of retinal blood vessels by combining the detection of centerlines and morphological reconstruction. IEEE Trans. Med. Imaging 2006, 25, 1200–1213. [Google Scholar] [CrossRef]
  5. Zhang, J.; Dashtbozorg, B.; Bekkers, E.; Pluim, J.P.W.; Duits, R.; ter Haar Romeny, B.M. Robust retinal vessel segmentation via locally adaptive derivative frames in orientation scores. IEEE Trans. Med. Imaging 2016, 35, 2631–2644. [Google Scholar] [CrossRef]
  6. Al-Diri, B.; Hunter, A.; Steel, D. An active contour model for segmenting and measuring retinal vessels. IEEE Trans. Med. Imaging 2009, 28, 1488–1497. [Google Scholar] [CrossRef]
  7. Yang, J.; Lou, C.; Fu, J.; Feng, C. Vessel segmentation using multiscale vessel enhancement and a region based level set model. Comput. Med. Imaging Graph. 2020, 85, 101783. [Google Scholar] [CrossRef]
  8. Yin, Y.; Adel, M.; Bourennane, S. Retinal vessel segmentation using a probabilistic tracking method. Pattern Recognit. 2012, 45, 1235–1244. [Google Scholar] [CrossRef]
  9. Roychowdhury, S.; Koozekanani, D.D.; Parhi, K.K. Iterative vessel segmentation of fundus images. IEEE Trans. Biomed. Eng. 2015, 62, 1738–1749. [Google Scholar] [CrossRef]
  10. Ricci, E.; Perfetti, R. Retinal blood vessel segmentation using line operators and support vector classification. IEEE Trans. Med. Imaging 2007, 26, 1357–1365. [Google Scholar] [CrossRef]
  11. Lupascu, C.A.; Tegolo, D.; Trucco, E. FABC: Retinal vessel segmentation using AdaBoost. IEEE Trans. Inf. Technol. Biomed. 2010, 14, 1267–1274. [Google Scholar] [CrossRef]
  12. Alom, M.Z.; Yakopcic, C.; Hasan, M.; Taha, T.M.; Asari, V.K. Recurrent residual U-Net for medical image segmentation. J. Med. Imaging 2019, 6, 014006. [Google Scholar] [CrossRef] [PubMed]
  13. Ronneberger, O.; Fischer, P.; Brox, T. U-net: Convolutional networks for biomedical image segmentation. In Proceedings of the International Conference on Medical Image Computing and Computer-Assisted Intervention, Munich, Germany, 5–9 October 2015; Springer: Berlin/Heidelberg, Germany, 2015; pp. 234–241. [Google Scholar]
  14. Guo, C.; Szemenyei, M.; Yi, Y.; Wang, W.; Chen, B.; Fan, C. Sa-unet: Spatial attention u-net for retinal vessel segmentation. In Proceedings of the 25th International Conference on Pattern Recognition (ICPR), Milan, Italy, 10–15 January 2021; IEEE: Piscataway, NJ, USA, 2021; pp. 1236–1242. [Google Scholar]
  15. Li, X.; Jiang, Y.; Li, M.; Yin, S. Lightweight attention convolutional neural network for retinal vessel image segmentation. IEEE Trans. Ind. Inform. 2020, 17, 1958–1967. [Google Scholar] [CrossRef]
  16. Wang, C.; Xu, R.; Zhang, Y.; Xu, S.; Zhang, X. Retinal vessel segmentation via context guide attention net with joint hard sample mining strategy. In Proceedings of the 2021 IEEE 18th International Symposium on Biomedical Imaging (ISBI), Nice, France, 13–16 April 2021; IEEE: Piscataway, NJ, USA, 2021; pp. 1319–1323. [Google Scholar]
  17. Mou, L.; Zhao, Y.; Fu, H.; Liu, Y.; Cheng, J.; Zheng, Y.; Su, P.; Yang, J.; Chen, L.; Frangi, A.F.; et al. CS2-Net: Deep learning segmentation of curvilinear structures in medical imaging. Med. Image Anal. 2021, 67, 101874. [Google Scholar] [CrossRef] [PubMed]
  18. Mou, L.; Chen, L.; Cheng, J.; Gu, Z.; Zhao, Y.; Liu, J. Dense dilated network with probability regularized walk for vessel detection. IEEE Trans. Med. Imaging 2019, 39, 1392–1403. [Google Scholar] [CrossRef] [PubMed]
  19. Nazir, N.; Sarwar, A.; Saini, B.S.; Shams, R. A robust deep learning approach for accurate segmentation of cytoplasm and nucleus in noisy pap smear images. Computation 2023, 11, 195. [Google Scholar] [CrossRef]
  20. Araújo, R.J.; Cardoso, J.S.; Oliveira, H.P. A deep learning design for improving topology coherence in blood vessel segmentation. In Proceedings of the International Conference on Medical Image Computing and Computer-Assisted Intervention, Shenzhen, China, 13–17 October 2019; Springer: Berlin/Heidelberg, Germany, 2019; pp. 93–101. [Google Scholar]
  21. Shin, S.Y.; Lee, S.; Yun, I.D.; Lee, K.M. Deep vessel segmentation by learning graphical connectivity. Med. Image Anal. 2019, 58, 101556. [Google Scholar] [CrossRef]
  22. Dosovitskiy, A.; Beyer, L.; Kolesnikov, A.; Weissenborn, D.; Zhai, X.; Unterthiner, T.; Dehghani, M.; Minderer, M.; Heigold, G.; Gelly, S.; et al. An image is worth 16 × 16 words: Transformers for image recognition at scale. arXiv 2020, arXiv:2010.11929. [Google Scholar]
  23. Chen, J.; Lu, Y.; Yu, Q.; Luo, X.; Adeli, E.; Wang, Y.; Lu, L.; Yuille, A.L.; Zhou, Y. Transunet: Transformers make strong encoders for medical image segmentation. arXiv 2021, arXiv:2102.04306. [Google Scholar]
  24. Liu, Z.; Lin, Y.; Cao, Y.; Hu, H.; Wei, Y.; Zhang, Z.; Lin, S.; Guo, B. Swin transformer: Hierarchical vision transformer using shifted windows. In Proceedings of the IEEE/CVF International Conference on Computer Vision, Montreal, BC, Canada, 11–17 October 2021; pp. 10012–10022. [Google Scholar]
  25. Cao, H.; Wang, Y.; Chen, J.; Jiang, D.; Zhang, X.; Tian, Q.; Wang, M. Swin-unet: Unet-like pure transformer for medical image segmentation. arXiv 2021, arXiv:2105.05537. [Google Scholar]
  26. Huang, S.; Li, J.; Xiao, Y.; Shen, N.; Xu, T. RTNet: Relation transformer network for diabetic retinopathy multi-lesion segmentation. IEEE Trans. Med. Imaging 2022, 41, 1596–1607. [Google Scholar] [CrossRef] [PubMed]
  27. Li, Y.; Wang, S.; Wang, J.; Zeng, G.; Liu, W.; Zhang, Q.; Jin, Q.; Wang, Y. Gt u-net: A u-net like group transformer network for tooth root segmentation. In Proceedings of the International Workshop on Machine Learning in Medical Imaging, Strasbourg, France, 27 September 2021; Springer: Berlin/Heidelberg, Germany, 2021; pp. 386–395. [Google Scholar]
  28. Shen, X.; Xu, J.; Jia, H.; Fan, P.; Dong, F.; Yu, B.; Ren, S. Self-attentional microvessel segmentation via squeeze-excitation transformer Unet. Comput. Med. Imaging Graph. 2022, 97, 102055. [Google Scholar] [CrossRef] [PubMed]
  29. Lin, A.; Chen, B.; Xu, J.; Zhang, Z.; Lu, G.; Zhang, D. Ds-transunet: Dual swin transformer u-net for medical image segmentation. IEEE Trans. Instrum. Meas. 2022, 71, 1–15. [Google Scholar] [CrossRef]
  30. Staal, J.; Abràmoff, M.D.; Niemeijer, M.; Viergever, M.A.; Van Ginneken, B. Ridge-based vessel segmentation in color images of the retina. IEEE Trans. Med. Imaging 2004, 23, 501–509. [Google Scholar] [CrossRef] [PubMed]
  31. Fraz, M.M.; Remagnino, P.; Hoppe, A.; Uyyanonvara, B.; Rudnicka, A.R.; Owen, C.G.; Barman, S.A. An ensemble classification-based approach applied to retinal blood vessel segmentation. IEEE Trans. Biomed. Eng. 2012, 59, 2538–2548. [Google Scholar] [CrossRef] [PubMed]
  32. Li, L.; Verma, M.; Nakashima, Y.; Nagahara, H.; Kawasaki, R. Iternet: Retinal image segmentation utilizing structural redundancy in vessel networks. In Proceedings of the IEEE/CVF Winter Conference on Applications of Computer Vision, Snowmass Village, CO, USA, 1–5 March 2020; pp. 3656–3665. [Google Scholar]
  33. Wang, K.; Zhang, X.; Huang, S.; Wang, Q.; Chen, F. Ctf-net: Retinal vessel segmentation via deep coarse-to-fine supervision network. In Proceedings of the 2020 IEEE 17th International Symposium on Biomedical Imaging (ISBI), Iowa City, IA, USA, 3–7 April 2020; IEEE: Piscataway, NJ, USA, 2020; pp. 1237–1241. [Google Scholar]
  34. Guo, C.; Szemenyei, M.; Hu, Y.; Wang, W.; Zhou, W.; Yi, Y. Channel attention residual u-net for retinal vessel segmentation. In Proceedings of the ICASSP 2021-2021 IEEE International Conference on Acoustics, Speech and Signal Processing (ICASSP), Toronto, ON, Canada, 6–11 June 2021; IEEE: Piscataway, NJ, USA, 2021; pp. 1185–1189. [Google Scholar]
  35. Boudegga, H.; Elloumi, Y.; Akil, M.; Bedoui, M.H.; Kachouri, R.; Abdallah, A.B. Fast and efficient retinal blood vessel segmentation method based on deep learning network. Comput. Med. Imaging Graph. 2021, 90, 101902. [Google Scholar] [CrossRef]
  36. Setiawan, A.W.; Mengko, T.R.; Santoso, O.S.; Suksmono, A.B. Color retinal image enhancement using CLAHE. In Proceedings of the International Conference on ICT for Smart Society, Orlando, FL, USA, 10–12 October 2013; IEEE: Piscataway, NJ, USA, 2013; pp. 1–3. [Google Scholar]
  37. Li, Y.; Zhang, Y.; Liu, J.Y.; Wang, K.; Zhang, K.; Zhang, G.S.; Liao, X.F.; Yang, G. Global transformer and dual local attention network via deep-shallow hierarchical feature fusion for retinal vessel segmentation. IEEE Trans. Cybern. 2022, 53, 5826–5839. [Google Scholar] [CrossRef]
  38. Wang, B.; Qiu, S.; He, H. Dual encoding u-net for retinal vessel segmentation. In Proceedings of the International Conference on Medical Image Computing and Computer-Assisted Intervention, Shenzhen, China, 13–17 October 2019; Springer: Berlin/Heidelberg, Germany, 2019; pp. 84–92. [Google Scholar]
  39. Wu, H.; Wang, W.; Zhong, J.; Lei, B.; Wen, Z.; Qin, J. Scs-net: A scale and context sensitive network for retinal vessel segmentation. Med. Image Anal. 2021, 70, 102025. [Google Scholar] [CrossRef]
  40. Zhang, M.; Yu, F.; Zhao, J.; Zhang, L.; Li, Q. BEFD: Boundary enhancement and feature denoising for vessel segmentation. In Proceedings of the International Conference on Medical Image Computing and Computer-Assisted Intervention, Lima, Peru, 4–8 October 2020; Springer: Berlin/Heidelberg, Germany, 2020; pp. 775–785. [Google Scholar]
  41. Li, Y.; Zhang, Y.; Cui, W.; Lei, B.; Kuang, X.; Zhang, T. Dual encoder-based dynamic-channel graph convolutional network with edge enhancement for retinal vessel segmentation. IEEE Trans. Med. Imaging 2022, 41, 1975–1989. [Google Scholar] [CrossRef]
  42. Wei, J.; Zhu, G.; Fan, Z.; Liu, J.; Rong, Y.; Mo, J.; Li, W.; Chen, X. Genetic u-net: Automatically designed deep networks for retinal vessel segmentation using a genetic algorithm. IEEE Trans. Med. Imaging 2022, 41, 292–307. [Google Scholar] [CrossRef]
  43. Zhou, Y.; Yu, H.; Shi, H. Study group learning: Improving retinal vessel segmentation trained with noisy labels. In Proceedings of the International Conference on Medical Image Computing and Computer-Assisted Intervention, Strasbourg, France, 27 September–1 October 2021; Springer: Berlin/Heidelberg, Germany, 2021; pp. 57–67. [Google Scholar]
  44. Wang, D.; Haytham, A.; Pottenburgh, J.; Saeedi, O.; Tao, Y. Hard attention net for automatic retinal vessel segmentation. IEEE J. Biomed. Health Inform. 2020, 24, 3384–3396. [Google Scholar] [CrossRef] [PubMed]
  45. Lee, C.Y.; Xie, S.; Gallagher, P.; Zhang, Z.; Tu, Z. Deeply-supervised nets. In Proceedings of the Artificial Intelligence and Statistics, PMLR, San Diego, CA, USA, 9–12 May 2015; pp. 562–570. [Google Scholar]
Figure 1. Overview of the proposed method. (a) The detailed network structure, mainly used for the visualization of cross-scale feature construction. (b) The architecture of transformer UNet, in which Cross-scale Attention Transformer (CAT) serves as the basic unit. (c) Illustration of the Edge Refinement Module (ERM), which integrates with the deep-supervision scheme.
Mathematics 12 00264 g001
Figure 2. Comparisons of the proposed CAT with other transformer architectures. SAT, DAT, and CAT mean Single-scale Attention Transformer, Dual-scale Attention Transformer, and Cross-scale Attention Transformer, respectively. SAT consists of Layer Normalization (Norm), Window-based Multi-head Self-attention (W-MSA), and MLP with GELU activation. DAT consists of two SAT layers and a Cross-Attention Fusion module. CAT is similar to DAT but introduces a newly designed Window-based Multi-head Cross-scale Attention (W-MCSA) to replace W-MSA and Cross-Attention Fusion module.
Mathematics 12 00264 g002
Figure 3. An illustration to represent edge decoupling on the prediction map M. E, E f g , E b g are the edge map, foreground edge map, and background edge map, respectively. Given an input image patch, the proposed network will generate the prediction maps for multiple supervision. Based on the prediction map M of the adjacent layer, ERM first generates a soft edge map E. After that, the edge map E is decoupled into the foreground edge map E f g and the background edge map E b g . E f g expresses the vessel pixels near the background, and E b g expresses the non-vessel pixels near the foreground.
Mathematics 12 00264 g003
Figure 4. Segmentation results of the DRIVE dataset.
Mathematics 12 00264 g004
Figure 5. Segmentation results of the CHASE_DB1 dataset.
Mathematics 12 00264 g005
Figure 6. Segmentation results of different transformer blocks. SAT-CAT and DAT-CAT mark the differences between their results and ours. The differences are highlighted in red.
Mathematics 12 00264 g006
Figure 7. The results of five patch sizes for training and testing. The horizontal axis means the side length of a square image patch. When the patch size is set to 256 × 256, the best overall results are obtained.
Mathematics 12 00264 g007
Figure 8. Comparisons with different deep-supervision layers. The best performance is observed when the number of deep-supervision layers is four.
Mathematics 12 00264 g008
Table 1. Quantitative comparisons on the DRIVE dataset. The bold items are our results and the underlined items are the best results.
MethodYearAcc (%)Dice (%)AUC (%)Se (%)Sp (%)
Dual E-Unet [38]201995.6782.7097.7279.4098.16
Iter-Net [32]202095.7482.1898.1377.9198.31
CTF-Net [33]202095.6782.4197.8878.4998.13
BEFD-UNet [40]202097.0182.6798.6782.1598.45
HANet [44]202095.8182.9398.2379.9198.13
SA-UNet [14]202196.9882.6398.6482.1298.40
GT U-Net [27]202195.4681.2796.9677.4298.09
SCS-Net [39]202196.9781.8998.3782.8998.38
CAR-UNet [34]202196.9982.5398.5281.3598.49
SGL [43]202197.0583.1698.8683.8098.34
GT-DLA-dsHFF [37]202297.0382.5798.6383.5598.27
DE-DCGCN-EE [41]202297.0582.8898.6683.5998.26
Genetic U-Net [42]202297.0783.1498.8583.0098.43
Ours202397.0583.3398.8784.6898.26
Table 2. Quantitative comparisons on the CHASE_DB1 dataset. The bold items are our results and the underlined items are the best results.
MethodYearAcc (%)Dice (%)AUC (%)Se (%)Sp (%)
Dual E-Unet [38]201996.6180.3798.1280.7498.21
Iter-Net [32]202096.5580.7398.5179.7098.23
CTF-Net [33]202096.4882.2098.4779.4898.42
HANet [44]202096.7381.9198.8181.8698.44
SA-UNet [14]202197.5581.5399.0585.7398.35
CAR-UNet [34]202197.5180.9898.9884.3998.39
SCS-Net [39]202197.44-98.6783.6598.39
GT-DLA-dsHFF [37]202297.60-98.9284.4098.58
DE-DCGCN-EE [41]202297.6282.6198.9884.0098.56
Ours202397.6682.3698.7786.5998.42
Table 3. The network parameters and the FLOPs of the compared methods and ours. The FLOPs are calculated on a 256 × 256 image patch.
MethodParametersFLOPs
CAR-UNet [34]1.05 M2.10 M
Iter-Net [32]8.24 M16.48 M
SA-UNet [14]538.71 K1.07 G
CTF-Net [33]1.38 M3.43 G
Genetic U-Net [42]272.42 K8.23 G
GT U-Net [27]25.89 M55.32 G
DE-DCGCN-EE [41]14.11 M73.62 G
GT-DLA-dsHFF [37]26.09 M118.62 G
Ours291.56 M71.15 G
Table 4. Ablation results on DRIVE dataset. The underlined items are the best results.
FrameworkTransformer BlockERMMetrics
SATDATCATAcc (%)Dice (%)AUC (%)Se (%)Sp (%)
Transformer UNet 96.9082.1898.6082.0998.32
96.9382.4498.6682.8698.30
97.0182.9998.7983.7398.30
97.0082.7498.7482.5098.31
97.0182.9198.7783.3998.34
97.0583.3398.8784.6898.26
Table 5. Comparisons with different numbers of CAT layers. The parameters and training time are also provided. The underlined items are the best results.
CAT LayersParam.Acc (%)Dice (%)Se (%)Sp (%)Training Time
4 , 4 , 8 , 8 522.54 M97.0483.2884.4598.2710.13 h
4 , 4 , 4 , 4 291.56 M97.0583.3384.6898.267.78 h
2 , 2 , 4 , 4 284.32 M97.0383.2384.5198.266.93 h
2 , 2 , 2 , 2 168.83 M97.0383.2084.4198.266.03 h
Disclaimer/Publisher’s Note: The statements, opinions and data contained in all publications are solely those of the individual author(s) and contributor(s) and not of MDPI and/or the editor(s). MDPI and/or the editor(s) disclaim responsibility for any injury to people or property resulting from any ideas, methods, instructions or products referred to in the content.

