Article

SHARDA–ARAS: A Methodology for Prioritising Project Managers in Sustainable Development

by
Zenonas Turskis
1 and
Violeta Keršulienė
2,*
1
The Institute of Sustainable Construction, Faculty of Civil Engineering, Vilnius Gediminas Technical University, 03224 Vilnius, Lithuania
2
Department of Law, Business Management Faculty, Vilnius Gediminas Technical University, 10223 Vilnius, Lithuania
*
Author to whom correspondence should be addressed.
Mathematics 2024, 12(2), 219; https://doi.org/10.3390/math12020219
Submission received: 10 November 2023 / Revised: 28 December 2023 / Accepted: 5 January 2024 / Published: 9 January 2024
(This article belongs to the Section Computational and Applied Mathematics)

Abstract

:
In sustainable economic development, top-level human capital, especially project management, is paramount. This article integrates the Systematic Hierarchical Attribute Ratio Delphic Rating (SHARDA) method and the Additive Ratio Rating (ARAS) method as a robust framework for identifying and training project managers. The research draws on a diverse panel of experts against the United Nations Sustainable Development Goals (SDGs) backdrop, emphasising stakeholder engagement and transparency in the decision-making processes. This study investigates the complexity of multi-criteria decision-making (MCDM) methods and focuses on SWARA and ARAS methods. These methodologies comprehensively improve the decision-making process, considering a range of subjective criteria. The extended and modified hierarchical SWARA method helps us understand each measure’s importance, while the ARAS method simplifies ranking and selection based on performance ratios. The research methodology seamlessly integrates these methods to form the SHARDA–ARAS methodology that addresses the challenging task of selecting project managers for sustainable development. This methodology guarantees a systematic and inclusive decision-making process, incorporating stakeholder perspectives seamlessly aligned with global sustainability goals. The studio’s innovation is wrapped in the synthesis of SWARA and ARAS into the SHARDA–ARAS methodology, presenting a nuanced and effective tool for project manager selection. Promoting an interconnected and holistic approach that contributes to sustainable development emphasises the methodology’s ability to balance economic, environmental, and social aspects. Thus, the article provides an invaluable method for organisations seeking global sustainable economic development.

1. Introduction

In today’s global landscape, the convergence of economic growth and technological progress underscores the critical role of high-quality human capital in ensuring sustainable development. Achieving sustainability, particularly in cleaner production, demands a multifaceted decision-making process influenced by numerous subjective criteria [1,2]. Effective management is pivotal in shaping sustainable development worldwide, necessitating the selection, development, and evaluation of project managers with the requisite skills.
MCDM methods are valuable for considering alternative courses of action, yet they often yield varying rankings. Sustainable economic development is now a global priority, closely aligned with the United Nations Sustainable Development Goals (SDGs) [3]. Effective leadership catalyses driving sustainable development on a global scale. Recent global crises have underscored the imperative of economic sustainability [4] and increasing scrutiny of corporate governance and environmental impact [5].
Sustainability assessments have evolved over the past two decades to encompass economic, environmental, social, and institutional considerations [6,7]. At the organisational level, entities acknowledge their impact on the environment and society, highlighting the importance of integrating sustainability principles into business practices [8]. In this context, managers with specific attributes emerge as critical guides for responsible decision making, innovation, and ethical practices, all contributing to sustainable economic development [9].
Decision makers require a robust methodology to address the intricacies of this issue, ensuring a comprehensive and transparent decision-making process. It requires a method that seamlessly integrates algorithms, applied mathematics, complex variables, decision theory, decision analysis, engineering mathematics, and interdisciplinary mathematics, all of which play pivotal roles in MCDM while simultaneously acknowledging the subjective nature of criteria weights [10,11,12].
Trust, ethical decision-making, and open stakeholder communication are integral to this process [13].
Transparency and fairness are indispensable for credibility and trust [14,15]. To achieve this, engaging stakeholders through surveys, interviews, workshops, or expert panels is essential for constructing a robust and inclusive decision-making process that fully aligns with their interests and values [16,17]. The goal is to balance a systematic framework and stakeholders’ viewpoints with techniques such as surveys, interviews, workshops, or expert panels facilitating stakeholder engagement in criteria weighting [18]. This holistic evaluation transcends mere cost considerations and incorporates external perspectives, thus achieving a comprehensive and equitable assessment [19].
The SHARDA methodology offers a systematic framework that accommodates stakeholders’ viewpoints, ultimately ensuring an equitable and robust decision-making process. It underscores the importance of valuing stakeholder input and considering their perspectives, which in turn garners their buy-in and support [20,21]. This article highlights the critical role played by algorithms, applied mathematics, complex variables, decision theory, decision analysis, engineering mathematics, and interdisciplinary mathematics in the holistic approach of selecting and developing project managers with the requisite skills for sustainable economic development. It introduces the Systemic Hierarchical Attribute Ratio Delphic Assessment (SHARDA) methodology as a valuable and integrated framework for informed and objective decision-making.

2. Literature Review

As decision makers delve into the MCDM problems, they must recognise the evolved methodologies to address complex decision scenarios. MCDM provides a systematic framework for evaluating alternatives based on multiple criteria, a necessity in today’s intricate decision-making. The research exploration focuses on two notable MCDM methods: the SWARA and the ARAS. These methods enable decision-makers to handle subjective criteria comprehensively. SWARA aids in discerning the importance of each criterion, while ARAS facilitates the ranking and selection of optimal choices based on effectiveness ratios.

2.1. Multiple Criteria Decision Making (MCDM)

In decision making, rationality is a fundamental goal, characterised by critical attributes that persist throughout the process:
  • Goal orientation: A steadfast focus on achieving intended goals.
  • Relevant and objective information: Using objectively evaluated, pertinent information as the bedrock of decision making.
  • Systematic and structured approach: Adherence to a clear, systematic, and organised action plan guided by methodical rules comprehensible to non-participants.
The decision-making process encompasses several stages: problem identification, preference construction, alternative evaluation, and optimal course selection. In the context of formal analysis for decision-making problems, three primary categories are considered [22,23]:
  • Normative analysis: Focuses on the ideal decision-making approach.
  • Descriptive analysis: Explores how decision makers make real-world decisions.
  • Prescriptive analysis: Examines methods to enhance the decision-making process.

2.2. A Brief Summary of MCDM Methods

MCDM is a well-established field that encompasses Multi-Attribute Decision Making (MADM) and Multi-Objective Decision Making (MODM) [24]. It aims to make optimal decisions by considering multiple viewpoints and criteria. The MCDM process involves interconnected steps, including problem definition and identification of critical characteristics. Decision makers set clear goals, identify alternatives, and develop criteria based on requirements and priorities. The field of MCDM has made significant advancements, offering decision makers a range of techniques. Decision-making techniques derived from MCDM facilitate systematic analysis and evaluation of alternatives. Stakeholders prioritise criteria aligning with the company’s vision, offering benefits, promoting transparency, and facilitating structured decision making. According to Zadeh [25], it is challenging for conventional quantification to reasonably express overtly complex or hard-to-define situations. Hence, the notion of a linguistic variable is necessary in such cases. Regular review and updating of criteria are essential.
Method selection in MCDM requires careful consideration of the problem. Scholars have proposed various MCDM approaches, including WSM [26], ELECTRE [27], SAW [28], DEA [29], AHP [30,31,32], ANP [33], TOPSIS [34], PROMETHEE [35,36], and VIKOR [37], among others. Fuzzy sets [38,39,40,41] effectively handle uncertainty and capture vagueness.
While scholars often prefer complex problem-solving models and their extensions, relying on fictitious case studies or inputs from other studies, decision makers lean towards simple and efficient methods for complex problems, and there is a tendency to refrain from using any method. The paper presents a generic MCDM model that illustrates fundamental concepts and steps.

2.3. Weighting Methods in MCDM: A Concise Overview

The debate surrounding objectivity versus subjectivity in weighting methods encompasses philosophical and methodological dimensions. While proponents argue for objective criteria, the weights assigned often prove to be subjective and context-dependent.
From a philosophical standpoint, individuals’ values and criteria importance is subjective due to personal experiences and beliefs. Different perspectives, priorities, and preferences can lead to varying assessments and weights.
Incorporating experts and stakeholders with domain knowledge is crucial for evaluating criteria and facilitating informed, though subjective, decision making. Recognising subjectivity in weighting criteria is vital for decision makers, as subjective methods consider preferences and judgments. Subjective weighting methods may require more time and consensus among decision makers, but provide transparent explanations of weight determination. Involving experts and stakeholders allows for a comprehensive assessment, yielding a deeper understanding of the problem and potential solutions.
Examples of subjective methods include swing weighting, graphical weighting, pairwise comparison (e.g., AHP), Delphi [42], nominal group technique, simple multi-attribute rating technique (SMART) [43], and others such as the eigenvector method, AHP [31,32], ANP [33], FARE [44], SWARA [45], and additional methods.
A comparative study by Eckenrode [46] examined six subjective methods for assessing criteria weights—Ranking, rating, three paired comparison methods (Partial I, Partial II, and Complete), and successive comparisons—and found no significant differences.
On the other hand, objective weighting methods offer computational efficiency, deriving criteria weights mathematically, independent of decision makers’ preferences. Notable objective methods include:
  • Mean weight [47]: Distributes weights evenly among all criteria when information is scarce or lacks decision-maker input.
  • Standard deviation [48]: Assigns weights based on the standard deviations of criteria values, giving smaller weights to similar criteria values.
  • Statistical variance procedure: Determines weights based on the statistical variance of information.
  • Entropy method [49,50]: Objectively assigns weights based on criterion value entropy, with lower entropy indicating higher importance.
  • Criteria importance through inter-criteria correlation (CRITIC): Utilises correlation analysis to measure each criterion’s value [50].
While objective methods offer computational efficiency, subjective methods consider decision makers’ preferences transparently [51]. Studies have shown different weights generated by these methods, indicating the need to consider the specific context and goals.
In summary, decision makers face the challenge of balancing objectivity and subjectivity in weighting criteria, with various methods available to address different contexts and preferences.
Building upon the rich foundation of MCDM methods, the research introduces SHARDA methodology. SHARDA stands as a significant evolution, seamlessly integrating the strengths of SWARA and ARAS into a unified framework.

3. Materials and Methods

This study pioneers a distinctive research approach to foster stakeholder engagement in the intricate realm of sustainable economic development decision making. The methodology intertwines qualitative and quantitative research designs, leveraging primary and secondary data sources to attain a nuanced and comprehensive perspective. This study outlines a new research approach for stakeholder engagement in sustainable economic development decision making. The methodology combines qualitative and quantitative data to integrate stakeholder perspectives into the criteria weighting process, enhancing decision-making integrity.
  • Study design: The research design artfully combines qualitative and quantitative methodologies, each playing a distinct yet synergistic role in the investigation. Through its exploratory nature, qualitative research delves into the intricacies of stakeholder perceptions and experiences. Concurrently, quantitative research lends to a structured, numerical framework, allowing for rigorous analysis and measurement.
  • Qualitative research design: The qualitative component involves an exploratory research design, facilitating a deeper understanding of stakeholder perspectives. This design uses in-depth interviews, workshops, and expert panels to uncover nuanced insights, motivations, and contextual factors influencing decision making in sustainable economic development.
  • Quantitative research design: The quantitative arm employs a descriptive research design, systematically quantifying and analysing specific aspects of the decision-making process. Surveys form a crucial instrument in this phase, generating structured data that can be statistically analysed to derive meaningful patterns, correlations, and trends.
  • Data collection: A structured Delphi process encompassing surveys, interviews, workshops, and expert panels to acquire stakeholder input. The qualitative data collection methods contribute rich, qualitative insights, while surveys offer a quantifiable dataset, combining to provide a holistic understanding of stakeholder perspectives.
  • Criteria weight determination: Introducing the SHARDA method, the research adopts a hierarchical approach to systematically evaluate the relative importance of criteria and sub-criteria. This method provides a structured and transparent process for stakeholders to assign weights, ensuring a robust foundation for decision making. Evaluation of choice options performance and analysis: The ARAS method is applied quantitatively to assess project manager performance and determine optimality. This approach utilizes effectiveness ratios and offers a quantitative lens to the decision-making process, enabling precise comparisons among alternatives.
Validation and analysis: Experts critically examine factors influencing decision outcomes in the validation and analysis phase. The SHARDA method is rigorously tested through expert opinions and benchmarking practices, ensuring its validity, reliability, and relevance in sustainable economic development. Sample selection: The study includes stakeholders from diverse groups relevant to sustainable economic development. The selection of experts is based on considerations of relevance, expertise, and active involvement, ensuring a representative and comprehensive set of perspectives. Table 1 presents the experts’ qualifications and additional conditions. Ethical considerations: Adherence to ethical guidelines is paramount. The research team ensures informed consent, confidentiality, and a profound respect for the rights of participants. The study is conducted in full compliance with ethical regulations governing research involving human participants, upholding the highest standards of ethical conduct. The study emerges as a systematic approach for selecting and developing project managers in sustainable economic development. What sets the proposed methodology apart is its resilience against rank reversals and its ability to quantify the direct ratio of each considered choice concerning the optimal (Pareto) solution.

3.1. A Generic MCDM Model

A distinguishing feature of SHARDA is its emphasis on stakeholder involvement and transparency. The research recognises that decisions with far-reaching impacts require diverse perspectives. SHARDA ensures a comprehensive decision-making process that aligns seamlessly with global sustainability objectives.
By crafting a narrative that seamlessly transitions from the broader MCDM environment to the specifics of SHARDA, decision makers can follow a logical progression, understanding the context and significance of the introduced methodology.
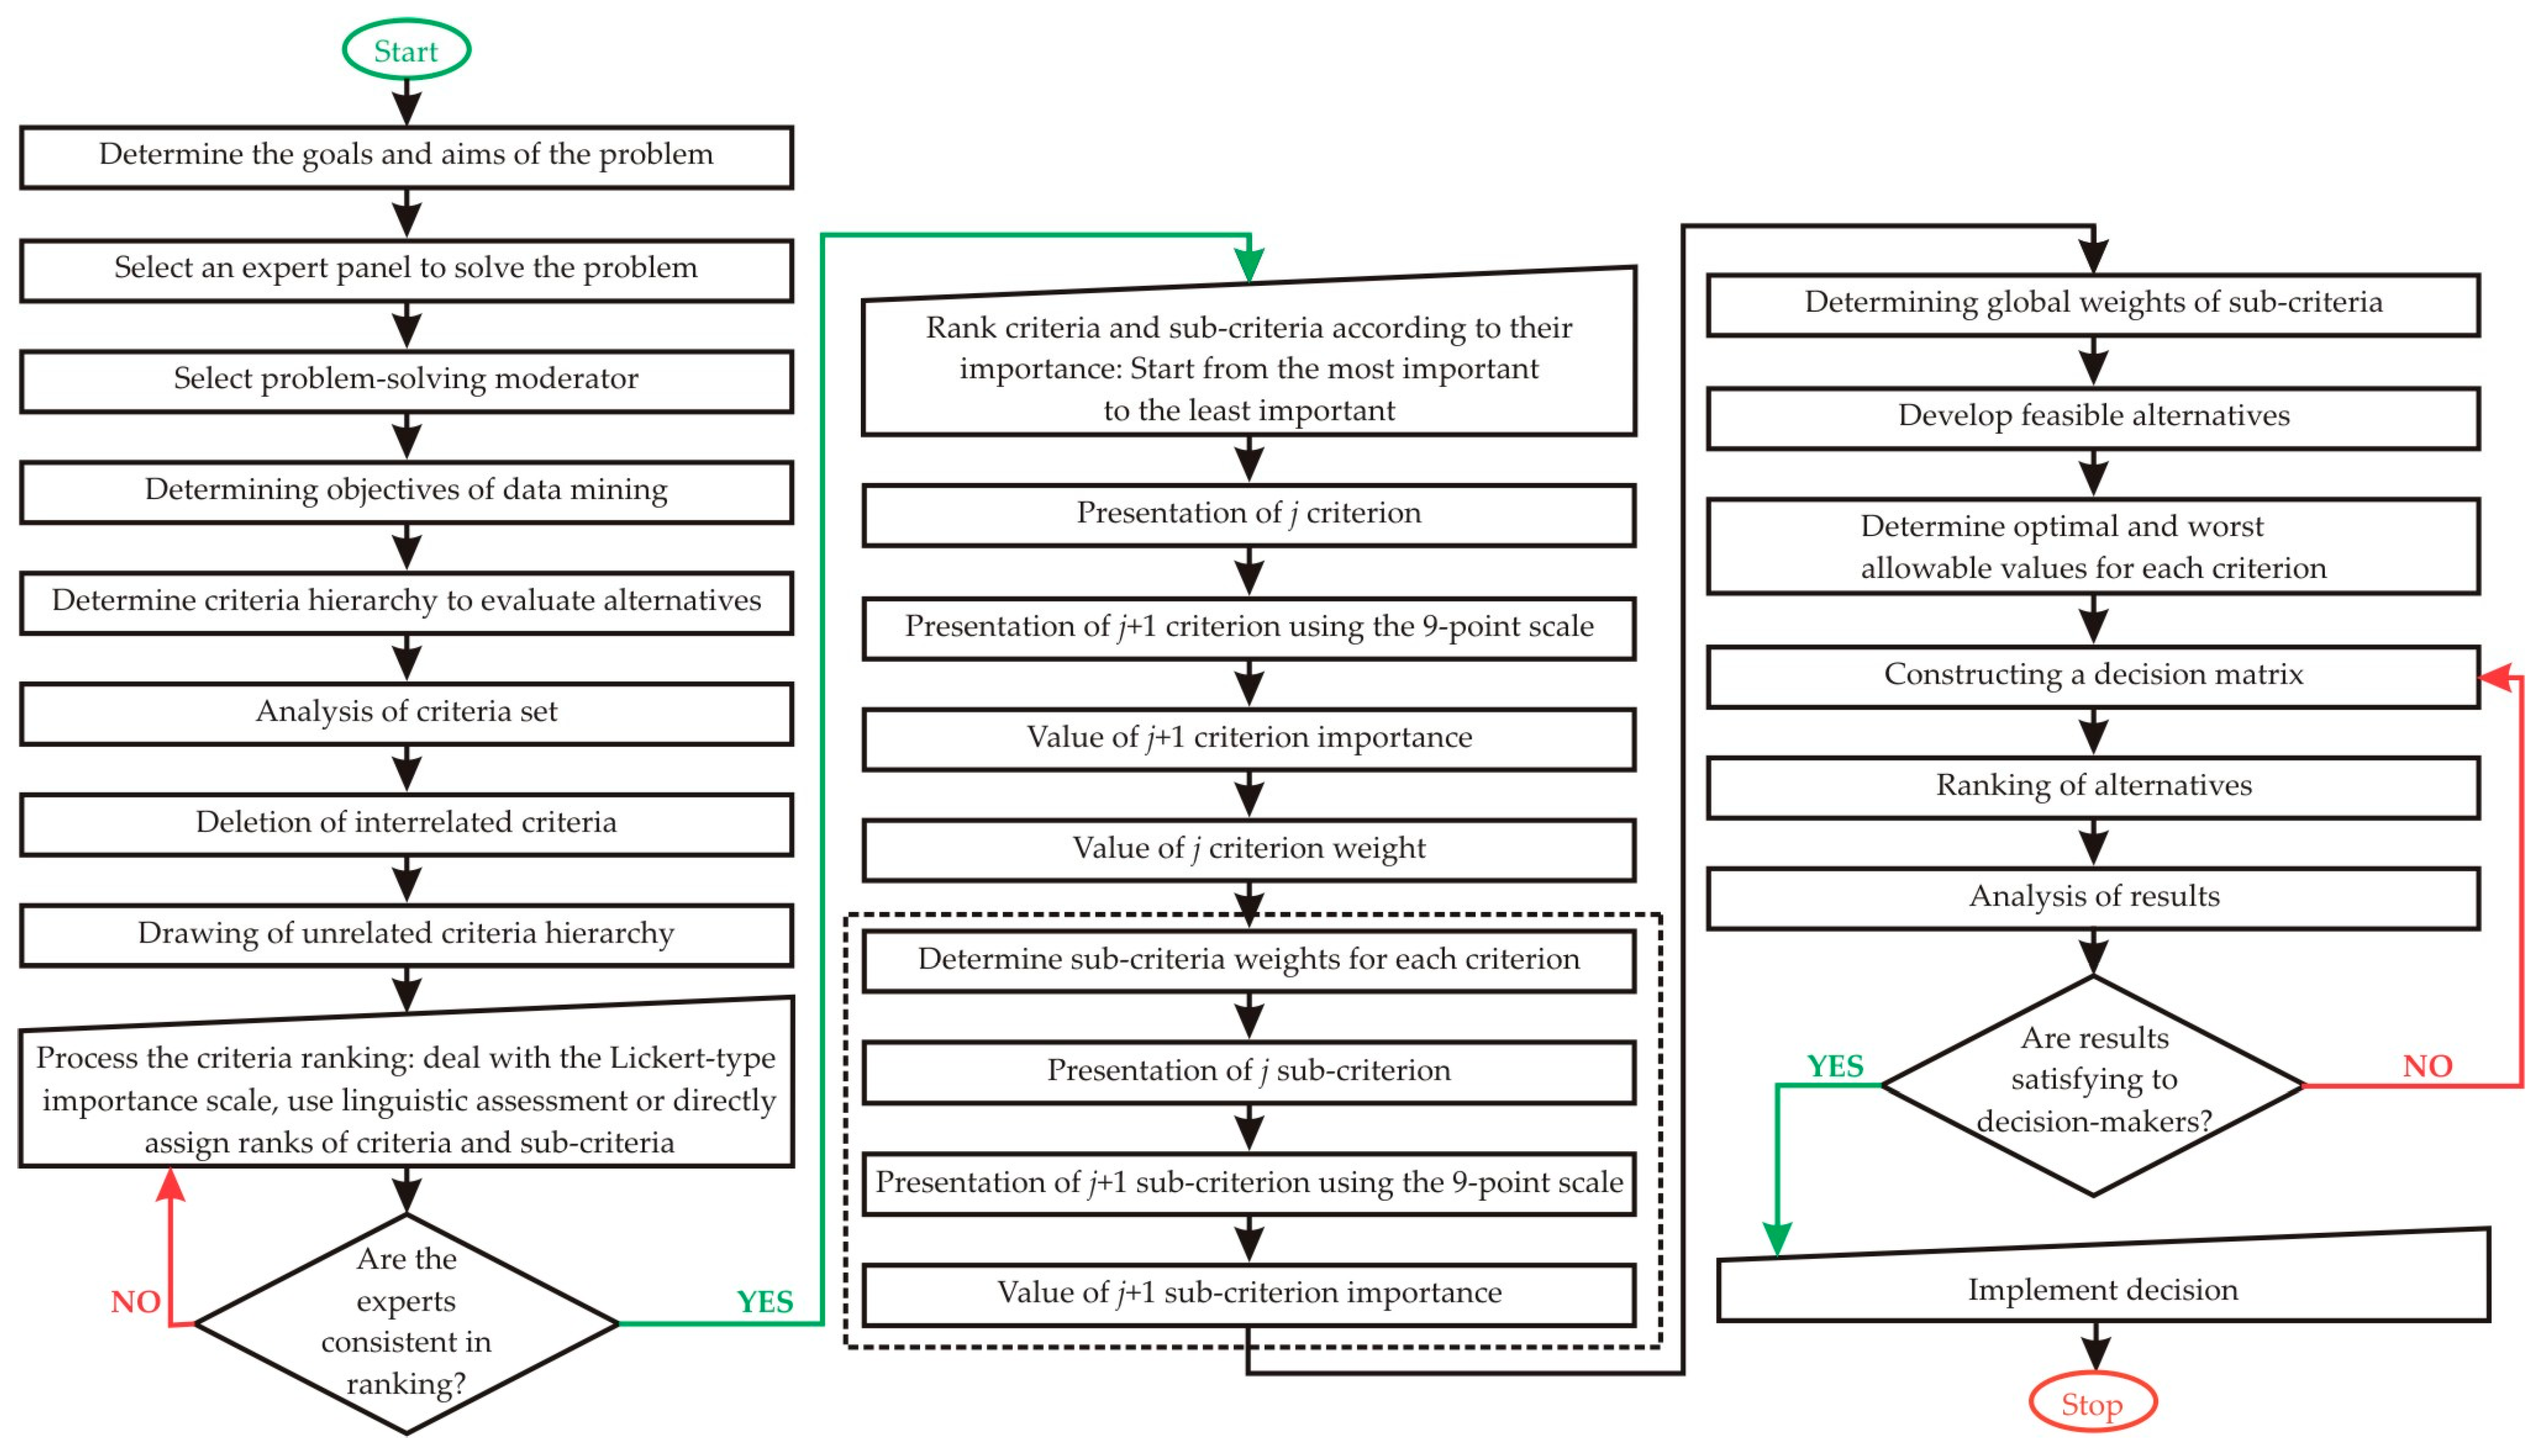
In the realm of MCDM, the generic model (Figure 1) offers a systematic approach to decision making. The generic MCDM model emphasises problem definition, criteria identification, alternative generation, evaluation, and sensitivity analysis for optimal decision outcomes. The expert panel process involves a structured and collaborative approach guided by a neutral moderator or facilitator. The moderator plays a crucial role in guiding the process and ensuring productive exchanges of ideas among panel members. The panel provides expertise and knowledge to determine criteria weights and values through discussions, assessments, and consensus building.
The main steps include:
  • Moderator’s presentation: Introduction of the decision problem, objectives, and criteria.
  • Problem domain definition: Examine problem characteristics, considering alternatives, attributes, constraints, and relevant factors.
  • Discussion and knowledge sharing: Panel members’ meetings and expertise sharing on criteria importance and relative weights.
  • Criteria and objectives identification: Specify and prioritise criteria and objectives.
  • Eliciting judgments and perspectives: Open discussions or structured exercises elicit panel members’ judgments and perspectives.
  • Determining criteria weights: The expert panel assigns relative weights, considering relevance, impact, feasibility, and trade-offs.
  • Weight criteria: Determine relative criterion importance by assigning weights.
  • Calculate overall scores: Multiply ratings by weights and sum up to obtain overall scores.
  • Define rating scale: Establish a quantified rating scale for assessing candidates’ proficiency levels.
  • Alternative generation: Create diverse options or courses of action.
  • Gather alternative information: Collect relevant alternative information through resumes, interviews, etc.
  • Evaluation against criteria: Assess each alternative’s performance using qualitative or quantitative techniques. Appoint evaluators, provide consistent instructions, and ensure information consistency.
  • Consensus building: The facilitator aggregates opinions and judgments to reach a consensus on criteria, weights, and values.
  • Aggregate evaluations and calculate scores: Combine evaluations and calculate overall scores, considering criteria and their weights.
  • Analysis, validation, and decision making: Analyse results, validate with real-world data or expert opinions, and make the final decision for implementation.
By adhering to these steps, decision makers effectively analyse and evaluate alternatives, facilitating informed decisions and successful implementation.
Using the SHARDA method, stakeholders assembled a diverse expert panel for a Delphi study, evaluating project managers’ characteristics in sustainable economic development. Table 1 summarises the expert qualifications and additional conditions they meet.
With their respective qualifications and additional conditions, these experts form a diverse panel capable of evaluating project managers for sustainable project implementation using the SHARDA method.
The experts using the Delphic process formed the two-level criteria set helpful for solving the considered problem (Table 2).
The hierarchical structure enables more detailed analysis and an assessment of project managers’ strengths and weaknesses, facilitating informed decision making in selecting and developing project managers for sustainable economic development initiatives.

3.2. Enhancing the SWARA Method with the Delphic Process for Criteria Weight Determination in Group MCDM–SHARDA (Systemic Hierarchical Attribute Ratio Assessment) Method

Decision makers in MCDM, more than traditional attribute weights, are needed to adequately represent varying attribute significance, as these weights are typically assigned based on expert preferences. In 2010, the stepwise weighted valuation ratio analysis (SWARA) methodology was introduced to address this issue in initial dispute resolution. Decision makers in sustainable economic development require systematic approaches for determining criteria weights and evaluating choices. It led to the emergence of the SHARDA method, which integrates a hierarchical structure and the expanded SWARA technique.
Main steps in the SHARDA method:
  • Decision-making process using SHARDA: Involves assembling an expert panel, ensuring anonymity in their opinions, and employing the Delphic process to gather expert opinions and achieve consensus.
  • Problem definition and hierarchy: Decision makers define the problem, identify relevant criteria, and establish a hierarchical structure.
  • Enhanced SWARA for criteria: Decision makers utilise the SWARA method to evaluate criteria weights.
  • Enhanced SWARA for sub-criteria: Decision makers utilise the SWARA method to evaluate sub-criteria weights within each criterion group.
  • Weight assignment for criteria groups and aggregating expert opinions: Relative weights are assigned to criteria groups, considering project requirements and priorities. Expert opinions are combined to determine criteria weights at each hierarchy level.
  • Evaluation of candidate qualifications: Candidates are evaluated based on specific criteria such as leadership abilities, technical expertise, communication skills, adaptability, and ethical and social responsibility.
  • Criteria values normalisation: Criteria values are normalised using standard scaling techniques.
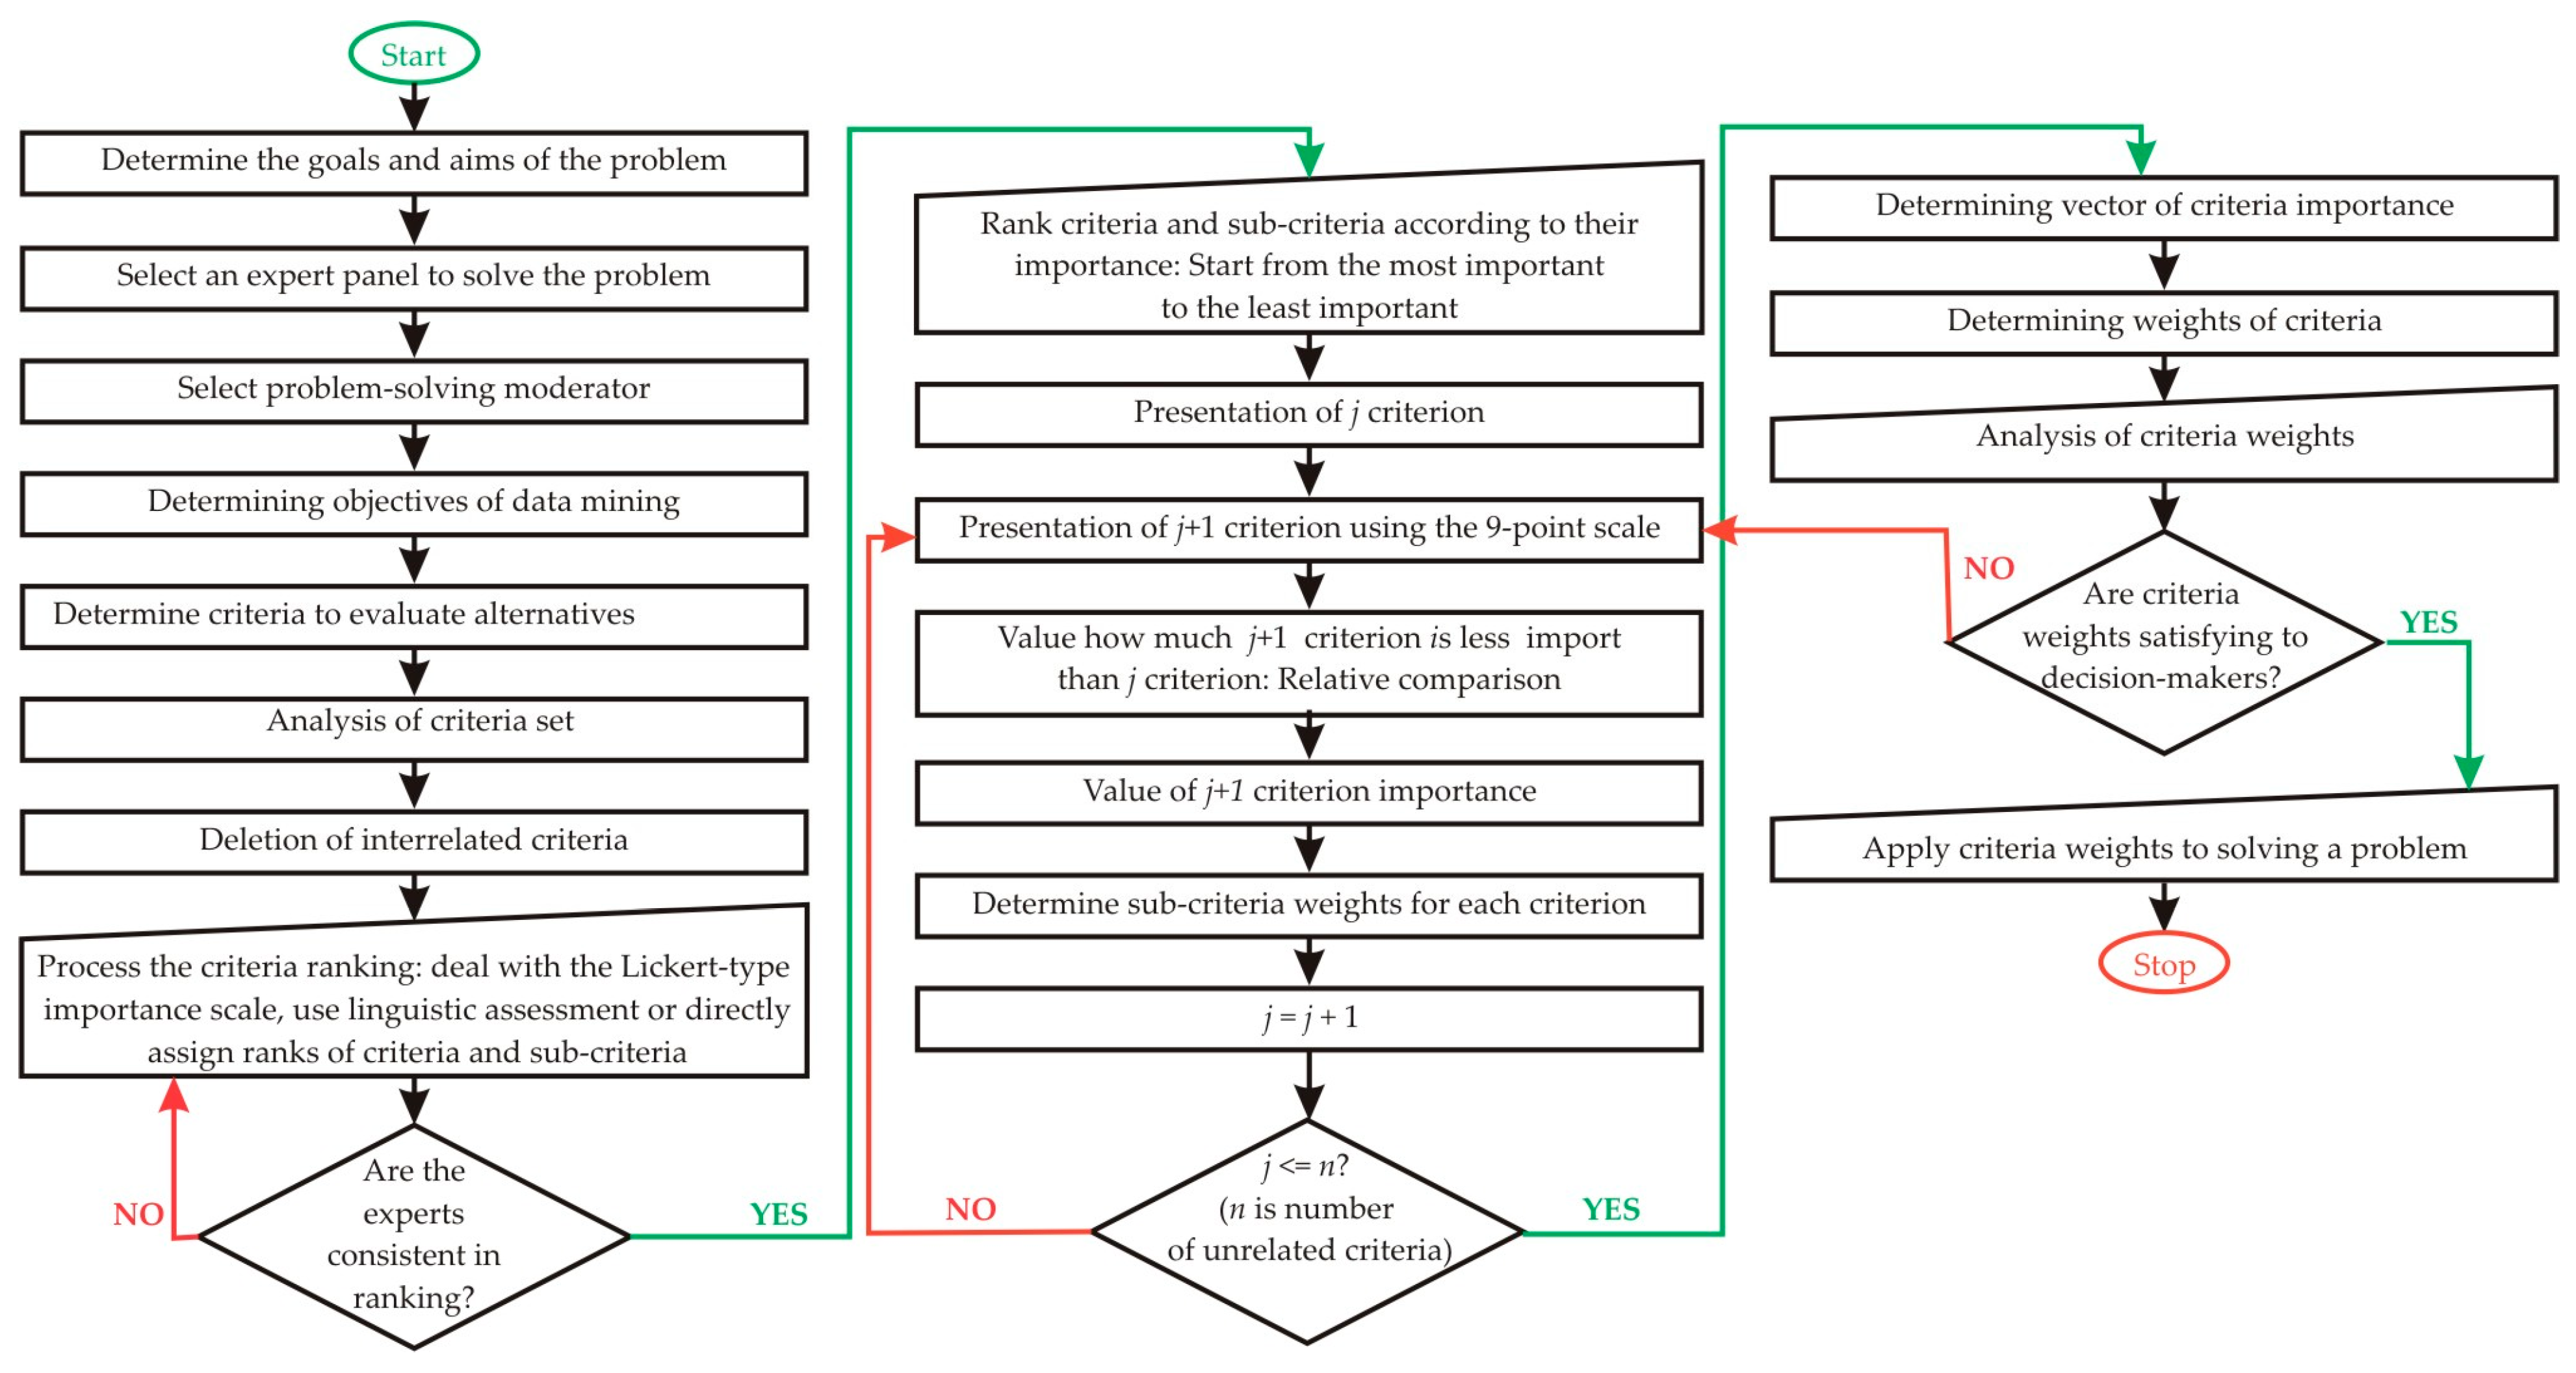
Criteria weight determination using the expanded SWARA method (Figure 2): The SWARA method offers a systemic process to determine criteria consequences. It starts with defining the decision problem and identifying the evaluation criteria. Criteria weights aid decision makers in further analyses, such as ranking alternatives or evaluating options.
Criteria weight calculation:
Decision makers assign criteria weights at the highest hierarchy level. Firstly, the moderator ranks criteria and sub-criteria in descending importance order. For this study, the authors selected the Eckenrode rating technique based on criteria importance ratings ( r i ) (Table 3).
Each of the experts rates all criteria in the given hierarchy level:
r k i .
The k is k = 1 , , l .
The l is the number of experts.
The moderator calculates sums of given importance ratings to each criterion r k i and the sum of ratings given to all criteria importance in the considered hierarchy level, and then divides geomeans of ratings R j   given to each criterion by the sum of ratings given to all criteria importance P .
R j = k = 1 l r k j n   j = 1 ,   n ¯
P = j = 1 n R j
t j = R j P
n is the number of criteria in the considered hierarchy level, and t j is the relative significance of the criterion. It helps to assign ranks to all criteria in the regarded hierarchy level and rank criteria in descending order according to their importance level.
Each decision maker assigns criterion importance s 1 to the first criterion x 1 , where j = 1 :
v 1 = 1 ; s 1 = 1 .
The coefficient s   s j + 1 helps to determine the importance ratio of criterion j + 1 compared to criterion j :
s j + 1 = s j + 1 s j .
Decision makers determine the importance level of each criterion determined using the Equation (6):
v j + 1 = v j s j + 1 .
Decision makers determine the relative importance weights of each criterion calculated using Equation (7):
q j = v j j = 1 n v j .
The moderator calculates the sums of assigned coefficients s j + 1 for each criterion S j , and then for all criteria S g .
S j = l = 1 p s j ;
S g = j n S j .
Equation (10) helps to calculate criteria weights:
w j = S j S g .
In the second stage, decision makers prepare tables for calculating criteria weights using the expanded SWARA method (Table 2 and Table 3), which show calculation results). These tables allow experts to determine criteria weights based on group ranks established through the SWARA process (Table 4).
For instance, the expert must evaluate criterion x5 as the least significant or at least as equally significant as criterion x4, and criterion x1 must be assessed as the most significant or equally significant as criterion x2. Each of the experts first presents essential criteria. The most significant criterion is rank 1, and the least significant criterion is rank 5. The basis of the overall ranks of the expert group is the sum values of ranks. According to the calculations by applying SWARA, group criteria and weights were established, as shown in Table 4, Table 5, Table 6, Table 7, Table 8 and Table 9. The SHARDA method’s application of the SWARA method results in group criteria and weights, enhancing objectivity and transparency throughout the decision-making process.
Relative importance scale for the expanded SWARA method:
The authors introduce a new scale to estimate criteria weights based on their relative importance compared to other criteria (Table 5) in the expanded SWARA method.
The scale assigns values between 1.0 and 0.1 to reflect the relative importance of one criterion compared to the next. A higher value indicates a greater degree of importance.
The specific scale and values can be adjusted to suit the context of the decision problem and the decision maker’s preferences.
  • Ten-Point Likert-Type Relative Importance Scale:
A ten-point Likert-type relative importance scale (Table 3) assesses managers’ qualitative skills in various decision-making contexts. This scale allows decision makers or experts to express their agreement or disagreement with the importance of specific skills exhibited by managers, facilitating nuanced evaluations.
The SHARDA method introduces a systematic approach that combines a hierarchical structure with the expanded SWARA technique for criteria weight determination, particularly in sustainable economic development contexts. It addresses limitations, enhances objectivity, and contributes to sustainable development objectives by providing a structured approach for criteria weight determination and decision making. It promotes transparency, consensus building, and documentation throughout the process.
The scale provides a structured and systematic approach to evaluating the relative importance of different qualitative skills exhibited by managers. When using this scale, decision makers or experts assign a score from 1 to 10 to each skill based on their perception of its importance. The assigned scores enable a more nuanced understanding of the importance and impact of each skill, facilitating informed decision-making processes related to the assessment and development of managerial capabilities.
Establish reference points: Identify reference points within the range corresponding to the qualitative categories. Determine specific numerical values for each qualitative category that best reflect their qualitative distinctions. For example:
  • Excellent: Assign a numerical value of 9–10, indicating a high level of knowledge.
  • Good: Assign a numerical value of 7–8, indicating above-average knowledge.
  • Average: Assign a numerical value of 5–6, indicating an average level of knowledge.
  • Below Average: Assign a numerical value of 3–4, indicating below-average knowledge.

3.3. Additive Ratio Assessment (ARAS) Method in Multiple Criteria Decision-Making

The additive ratio assessment (ARAS) method is essential in multiple criteria decision-making (MCDM). It effectively addresses the complex task of ranking and selecting the most suitable alternative when faced with multiple options. This method is precious in sustainable decision-making scenarios, where it considers the interplay between profits and losses, ensuring sound and informed decision analysis.
Historically, MCDM problems have involved ranking a finite number of decision alternatives, each characterised by a distinct set of criteria. This multifaceted nature of decision-making calls for robust methodologies. Bernoulli laid the groundwork for advanced MCDM methods by working on additive utility functions. At the same time, further research has explored the challenges of achieving consensus among group decision-makers [52], underscoring the collective nature of decision-making processes.
When applied to sustainable decision making, the ARAS method focuses on effectiveness ratios related to profits and losses. It directly correlates the utility function value with an alternative’s relative efficiency, influenced by the interplay between the values and weights of critical criteria within a given project.
A vital advantage of the ARAS method is its ability to provide accurate and reliable results while mitigating the occurrence of rank reversal phenomena, a common issue in MCDM problems. It ensures that each alternative’s performance is assessed relative to the best attainable performance, resulting in a robust and equitable evaluation process.
The ARAS method comprises a systematic sequence of steps to facilitate the decision-making process:
  • Problem definition: It begins with a clear and comprehensive definition of the decision problem, including criteria and objectives.
  • Criteria weights determination: Decision makers assign weights to the criteria based on their relative importance.
  • Normalisation with sum of solution values: A normalisation procedure transforms the initial data into normalised scores.
  • Ratio assessment: The next step involves the calculation of the additive ratio for each alternative.
  • Rank alternatives: Alternatives are subsequently ranked based on their ratio scores, simplifying the complex decision-making process.
The heart of the decision-making process is the creation of a decision-making matrix (DMM), encapsulating the preferences for potential alternatives evaluated across multiple criteria. This foundational matrix ensures a fair and robust decision-making process in various contexts [53].
Decision makers populate the DMM with preferences for m possible choices (rows) evaluated on n significant criteria (columns):
X = x o 1 x o j x o n x i 1 x i j x i n x m 1 x m j x m n ;   i = 0 , m ¯ ; j = 0 , n ¯ .
m is the number of alternatives, n is the number of criteria describing each option, x i j represents the performance value of i alternative in terms of the j criterion, and x o j is the optimal value of the j criterion.
When decision makers do not know the optimal value for a criterion, they can approximate it using Equation (12):
x o j = max   x ij value   of   qualitative   scale   used   to   assess   criterion ,   o r   x o j = 1.2 max i   x i j ,   i f   max i   x i j   i s   u n k n o w n   p r e f e r a b l e   q u a n t i t a t i v e   v a l u e   x o j = min   x i j value   of   qualitative   scale   used   to   assess   criterion ,   o r   x o j = 0.8 min i   x i j ,   if mix i   x i j   i s   u n k n o w n   p r e f e r a b l e   q u a n t i t a t i v e   v a l u e  
The performance values x i j and criteria weights w j are typical entries of the DMM. Experts determine the criteria system and the initial values and weights of the criteria.
Decision makers could normalise the criteria values using the ratio to the optimal value to facilitate meaningful comparisons. This normalisation process transforms the criteria values into dimensionless values within the range of [0, 1]. Normalisation enhances the comparability of criteria and enables practical assessments and evaluations across different criteria.
In the next stage, decision makers normalise the initial values of all criteria to obtain the normalised decision-making matrix X ¯ :
X ¯ = x ¯ o 1 x ¯ o j x ¯ o n x ¯ i 1 x ¯ i j x ¯ i n x ¯ m 1 x ¯ m j x ¯ m n ;   i = 0 , m ¯ ; j = 0 , n ¯ .
For criteria with preferable values as maxima, decision makers use the following normalisation procedure:
x ¯ i j = x i j i = o m x i j
For criteria with preferable values as minima, decision makers employ a two-stage normalisation procedure:
x i j = 1 x i j * ; x ¯ i j = x i j i = o m x i j .
The third stage involves constructing the normalised-weighted matrix, denoted as   X ^ . Decision makers calculate this matrix by assigning weights to the criteria. Experts and stakeholders determine the values of weights w j , typically falling within the range of   0 < w j < 1 . The sum of weights should satisfy the following conditions:
j = 1 n w j = 1 .
X ^ = x ^ o 1 x ^ o j x ^ o n x ^ i 1 x ^ i j x ^ i n x ^ m 1 x ^ m j x ^ m n ;   i = 0 , m ¯ ; j = 0 , n ¯ .
Subsequently, decision makers calculate the normalised–weighted values for each criterion   x ^ i j :
x ^ i j = x ¯ i j w j ;   i = 0 , m ¯ .
w j   is the weight (importance) of the j criterion, and x ¯ i   is the normalised rating of the j criterion.
Decision makers employ the optimality function, which calculates the utility degree of an alternative relative to the best alternative, to determine the priorities of other options. Decision makers determine the optimality function values as follows:
S i = j = 1 n x ^ i j ;   i = 0 , m ¯ .
S i   is the value of the optimality function of the i alternative.
Higher values of the optimality function correspond to preferable options.
Decision makers determine the utility degree of the alternative by comparing the analysed choice with the ideally best one, S0 (Pareto optimal solution). Equation (20) helps decision makers calculate the utility degree K i of an alternative a i :
K i = S i S o ;   i = 0 , m ¯ ,
S i   and S o   are the optimality criterion values obtained from Equation (19).
The values of K i fall within the interval [0, 1]. Decision makers can order these values in an increasing sequence, reflecting the desired order of precedence. The utility function values derived from this process enable decision makers to determine the complex relative efficiency of each potential alternative.

4. Results

The experts assessed the importance presented on a ten-point scale. The moderator presented the criteria groups in descending importance level as the expert panel determined in three rounds of the Delphic process. Table 1 in the first column represents the list of criteria and each expert’s importance assessment based on a nine-point Likert-type scale provided in the corresponding cells.
Experts in the next round used the scale (Table 5) to evaluate the importance of relative difference coefficients to determine the weights of criteria groups (Table 6).
In the following step, the experts use the SWARA method to evaluate sub-criteria weights within each criterion group (Table 7, Table 8 and Table 9).
Table 9 presents the summarised final importance of the sub-criteria.
All six experts assessed all sub-criteria (skills) for the 15 candidates using a ten-point Likert-type scale (Table 10).
The decision makers following the generic problem solution model started the ARAS method. They prepared an initial decision-making matrix based on Table 9 and Table 10 (Table 11). The criteria weights represent the higher-level factors or attributes essential in selecting and developing project managers in sustainable economic development (Table 11). Decision makers assigned each criterion a weight indicating its relative importance in decision making.
Sub-criteria ( x 11 x 53 ) are the sub-level factors or attributes that fall under each criterion. There are more specific considerations within each criterion.
q (local weights) values represent the local weights of the corresponding sub-criteria within their respective criteria. Local weights reflect how important each sub-criterion is concerning its parent criterion.
w (global weights) values represent the global weights of all sub-criteria. Global weights consider the importance of each sub-criterion within its parent criterion and the importance of the parent criterion in the overall decision-making process.
For criterion x 1 , there are three sub-criteria ( x 11 ,   x 12 ,   x 13 ). The local weights for these sub-criteria within x 1 are 0.35, 0.31, and 0.34, respectively.
The global weights for these sub-criteria (w) are 0.082, 0.073, and 0.08, respectively. These global weights consider the importance of the sub-criteria within x 1 and the importance of x 1 itself among all the criteria.
The SHARDA method helps to make informed decisions regarding the selection and development of project managers in sustainable economic growth, ensuring stakeholder involvement and transparency in the decision-making process.
Decision-makers following the ARAS method normalised the initial decision-making matrix (Table 12) (Equations (12)–(15)) and weighted it (Table 13) (Equations (16)–(18)). Table 13 presents problem solution results (optimality function’s values S i (Equation (19)) and the utility degree values K i   (Equation (20)).

5. Conclusions

This study emphasises the meticulous approach required for selecting and developing project managers, which is crucial for fostering sustainable economic development. The Systemic Hierarchical Attribute Ratio Delphic Assessment (SHARDA) method, complemented by the additive ratio assessment (ARAS) methodology, emerges as a pivotal tool. This tandem offers decision makers a systematic framework resistant to rank reversals, and quantifies each choice’s direct ratio concerning the optimal (Pareto) solution.
Advancement in MCDM for sustainable development: The SHARDA–ARAS methodology marks a notable advancement in multi-criteria decision making (MCDM). Tackling the complex task of selecting project managers for sustainable development, it provides a robust framework empowering decision makers to prioritise and evaluate candidates efficiently, aligning seamlessly with economic, environmental, and social sustainability considerations.
Alignment with UN SDGs and interdisciplinary mathematics: The research underscores the SHARDA–ARAS methodology’s alignment with the United Nations Sustainable Development Goals (SDGs). This alignment emphasises the significance of selecting proficient project managers who contribute actively to global objectives and promote interdisciplinary mathematics to facilitate sustainable development.
Recognition of interconnected sustainability dimensions: Acknowledging the interconnected nature of sustainability—encompassing economic, environmental, and social dimensions—the article emphasises the indispensable role of project managers. Their capacity to balance these intricate facets within decision-making processes underscored contributing to holistic, sustainable development.
Stakeholder involvement and ethical considerations: The SHARDA–ARAS approach emphasises stakeholder involvement, ensuring decision-making transparency and fairness. Including diverse perspectives enhances the integrity of the selection process, reinforcing the ethical importance of equitable decision making within sustainable development.
Adaptive decision making and global relevance: The SHARDA–ARAS methodology advocating adaptive decision making in a rapidly changing global situation acknowledges the need for flexibility in selecting project managers capable of navigating evolving challenges. The article underscores the global relevance of these methodologies, positioning them as invaluable tools for organisations operating across diverse regions and highlighting their significance in interdisciplinary mathematics.
Universality and future research directions: What truly sets the SHARDA–ARAS methodology apart is its universality. These methodologies transcend boundaries and demonstrate adaptability to address complex problems in various fields. The authors envisioned future research directions, considering the diligent preparation of fuzzy and grey versions of the SHARDA method. It showcases the versatility of these approaches in addressing varying degrees of uncertainty and vagueness, setting the stage for their continued refinement and application in specific case studies. The SHARDA–ARAS methodology emerges as an advanced mathematical tool, supporting interdisciplinary and sustainable decision making across diverse contexts.
Comparative analysis with MAMCA: An additional analysis with the MAMCA method emphasises the contextual considerations, goals, available resources, and stakeholder engagement in choosing between them. While MAMCA highlights multi-actor involvement, SHARDA provides a mathematically rigorous approach. The decision-making scenario should align with the unique requirements of each context, ensuring an optimal fit for the specific decision-making landscape.
This research presents a methodology for project manager selection. It underscores the broader implications for sustainable development, ethics, and interdisciplinary mathematics, positioning the SHARDA–ARAS methodology as a versatile and universal tool for nuanced decision making in an ever-evolving global situation.

Author Contributions

Conceptualisation, Z.T. and V.K.; methodology, Z.T. and V.K.; calculations, Z.T.; validation, Z.T. and V.K.; formal analysis, Z.T.; investigation, Z.T. and V.K.; resources V.K.; data curation, V.K.; writing—original draft preparation, Z.T. and V.K.; writing—review and editing, Z.T. and V.K.; visualisation, Z.T.; supervision, Z.T. All authors have read and agreed to the published version of the manuscript.

Funding

This research received no external funding.

Institutional Review Board Statement

The study did not require ethical approval.

Informed Consent Statement

Informed consent was obtained from all subjects involved in the study.

Data Availability Statement

All needed details are developed by the authors and presented in this article.

Conflicts of Interest

The authors declare no conflicts of interest. There are no funders. Therefore, the funders had no role in the study’s design, in the collection, analysis, or interpretation of data, in writing the manuscript, or in the decision to publish the results.

References

  1. Stanujkic, D.; Zavadskas, E.K.; Karabasevic, D.; Turskis, Z.; Keršulienė, V. New group decision-making ARCAS approach based on the integration of the SWARA and the ARAS methods adapted for negotiations. J. Bus. Econ. Manag. 2017, 18, 599–618. [Google Scholar] [CrossRef]
  2. Erdogan, S.A.; Šaparauskas, J.; Turskis, Z. Decision making in construction management: AHP and Expert Choice approach. Procedia Eng. 2017, 172, 270–276. [Google Scholar] [CrossRef]
  3. Nordén, B.; Avery, H. Global learning for sustainable development: A historical review. Sustainability 2021, 13, 3451. [Google Scholar] [CrossRef]
  4. Vuković, D.B.; Dekpo-Adza, S.; Khmelnitskiy, V.; Özer, M. Spillovers across the Asian OPEC+ Financial Market. Mathematics 2023, 11, 4005. [Google Scholar] [CrossRef]
  5. Wang, J.; He, Y. Assessing the Macroeconomic Consequences of External Financial Upheavals on China: A Caution of a Silicon Valley Bank’s Collapse. Axioms 2023, 12, 755. [Google Scholar] [CrossRef]
  6. Rejeb, A.; Rejeb, K.; Simske, S.; Keogh, J.G. Exploring Blockchain Research in Supply Chain Management: A Latent Dirichlet Allocation-Driven Systematic Review. Information 2023, 14, 557. [Google Scholar] [CrossRef]
  7. Tsalis, T.A.; Malamateniou, K.E.; Koulouriotis, D.; Nikolaou, I.E. New challenges for corporate sustainability reporting: United Nations’ 2030 Agenda for sustainable development and the sustainable development goals. Corp. Soc. Responsib. Environ. Manag. 2020, 27, 1617–1629. [Google Scholar] [CrossRef]
  8. Busu, C.; Busu, M. Research on the factors of competition in the green procurement processes: A case study for the conditions of Romania using PLS-SEM methodology. Mathematics 2021, 9, 16. [Google Scholar] [CrossRef]
  9. Ruano, M.; Huang, C.Y.; Nguyen, P.H.; Nguyen, L.A.T.; Le, H.Q.; Tran, L.C. Enhancing sustainability in Belize’s ecotourism sector: A fuzzy Delphi and fuzzy DEMATEL Investigation of Key Indicators. Mathematics 2023, 11, 2816. [Google Scholar] [CrossRef]
  10. Karami, S.; Mousavi, S.M.; Antucheviciene, J. Enhancing Contractor Selection Process by a New Interval-Valued Fuzzy Decision-Making Model Based on SWARA and CoCoSo Methods. Axioms 2023, 12, 729. [Google Scholar] [CrossRef]
  11. Goswami, S.S.; Behera, D.K.; Afzal, A.; Razak Kaladgi, A.; Khan, S.A.; Rajendran, P.; Subbiah, R.; Asif, M. Analysis of a robot selection problem using two newly developed hybrid MCDM models of TOPSIS-ARAS and COPRAS-ARAS. Symmetry 2021, 13, 1331. [Google Scholar] [CrossRef]
  12. Gómez Monge, R.; Galeana Figueroa, E.; Alfaro-García, V.G.; Merigó, J.M.; Yager, R.R. Variances and logarithmic aggregation operators: Extended tools for decision-making processes. Mathematics 2021, 9, 1892. [Google Scholar] [CrossRef]
  13. Taherdoost, H. Deep Learning and Neural Networks: Decision-making implications. Symmetry 2023, 15, 1723. [Google Scholar] [CrossRef]
  14. Deng, W.; Huang, T.; Wang, H. A Review of the key technology in a blockchain building decentralized trust platform. Mathematics 2023, 11, 101. [Google Scholar] [CrossRef]
  15. Martin, J.C.; Roman, C.; Vinan, C. An institutional trust indicator based on fuzzy logic and ideal solutions. Mathematics 2020, 8, 807. [Google Scholar] [CrossRef]
  16. Kyriakopoulos, G.L.; Sebos, I. Enhancing climate neutrality and resilience through coordinated climate action: Review of the synergies between mitigation and adaptation actions. Climate 2023, 11, 105. [Google Scholar] [CrossRef]
  17. Toljaga-Nikolić, D.; Todorović, M.; Dobrota, M.; Obradović, T.; Obradović, V. Project management and sustainability: Playing trick or treat with the planet. Sustainability 2020, 12, 8619. [Google Scholar] [CrossRef]
  18. Chang, S.C.; Lu, M.T.; Chen, M.J.; Huang, L.H. Evaluating the Application of CSR in the High-Tech Industry during the COVID-19 Pandemic. Mathematics 2021, 9, 1715. [Google Scholar] [CrossRef]
  19. Fuller, A.K.; Decker, D.J.; Schiavone, M.V.; Forstchen, A.B. Ratcheting up rigor in wildlife management decision making. Wildl. Soc. Bull. 2020, 44, 29–41. [Google Scholar] [CrossRef]
  20. Sandover, R.; Moseley, A.; Devine-Wright, P. Contrasting views of citizens’ assemblies: Stakeholder perceptions of public deliberation on climate change. Politics Gov. 2021, 9, 76–86. [Google Scholar] [CrossRef]
  21. Romero-Perdomo, F.; González-Curbelo, M.Á. Integrating multi-criteria techniques in life-cycle tools for the circular bioeconomy transition of agri-food waste biomass: A systematic review. Sustainability 2023, 15, 5026. [Google Scholar] [CrossRef]
  22. Bell, D.E.; Raiffa, H.; Tversky, A. Decision Making: Descriptive, Normative, and Prescriptive Interactions; Cambridge University Press: Cambridge, UK, 1988. [Google Scholar]
  23. Kleindorfer, P.R.; Kunreuther, H.C.; Schoemaker, P.J.H. Decision Sciences: An Integrative Perspective; Cambridge University Press: Cambridge, UK, 1993. [Google Scholar]
  24. Hwang, C.L.; Yoon, K.S. Multiple Attribute Decision Making- Methods and Applications, A State-of-the-Art Survey; Springer: New York City, NY, USA, 1981. [Google Scholar]
  25. Zadeh, L.A. Fuzzy sets. Inf. Control 1965, 8, 338–353. [Google Scholar] [CrossRef]
  26. Fishburn, P.C. Letter to the Editor—Additive Utilities with Incomplete Product Sets: Application to Priorities and Assignments. Oper. Res. 1967, 15, 537–542. [Google Scholar] [CrossRef]
  27. Roy, B. Classement et choix en présence de points de vue multiples. RAIRO-Oper. Res. -Rech. Opérationnelle 1968, 2, 57–75. [Google Scholar] [CrossRef]
  28. MacCrimmon, K.R. Decision-Making among Multiple-Attribute Alternatives: A Survey and Consolidated Approach, Memorandum; RM-4823-ARPA; The Rand Corporation: Santa Monica, CA, USA, 1968. [Google Scholar]
  29. Charnes, A.; Cooper, W.W.; Rhodes, E. Measuring the efficiency of decision making units. Eur. J. Oper. Res. 1978, 2, 429–444. [Google Scholar] [CrossRef]
  30. Miller, G.A. The magical number seven, plus or minus two: Some limits on our capacity for processing information. Psychol. Rev. 1956, 63, 81–97. [Google Scholar] [CrossRef]
  31. Miller, G.A. The magical number seven, plus or minus two: Some limits on our capacity for processing information. Psychol. Rev. 1994, 101, 343–352. [Google Scholar] [CrossRef]
  32. Saaty, T.L. A scaling method for priorities in hierarchical structures. J. Math. Psychol. 1977, 15, 234–281. [Google Scholar] [CrossRef]
  33. Saaty, T.L. The Analytic Hierarchy Process: Planning, Priority Setting, Resource Allocation; McGraw-Hill International Book Co.: New York City, NY, USA; London, UK, 1980. [Google Scholar]
  34. Saaty, T.L. Decision Making with Dependence and Feedback: The Analytic Network Process; RWS Publications: Pittsburgh, PA, USA, 1996. [Google Scholar]
  35. Brans, J.P.; Vincke, P. Note—A Preference Ranking Organisation Method: (The PROMETHEE Method for Multiple Criteria Decision-Making). Manag. Sci. 1985, 31, 647–656. [Google Scholar] [CrossRef]
  36. Brans, J.P.; Vincke, P.; Mareschal, B. How to select and how to rank projects: The PROMETHEE method. Eur. J. Oper. Res. 1986, 24, 228–238. [Google Scholar] [CrossRef]
  37. Opricovic, S. Multicriteria Optimization of Civil Engineering Systems. Ph.D. Thesis, Faculty of Civil Engineering, University of Belgrade, Belgrade, Serbia, 1998. [Google Scholar]
  38. Zadeh, L.A. Fuzzy logic and its application to approximate reasoning, Part I. Inf. Sci. 1975, 8, 199–249. [Google Scholar] [CrossRef]
  39. Zadeh, L.A. Fuzzy logic and its application to approximate reasoning, Part II. Inf. Sci. 1975, 8, 301–357. [Google Scholar] [CrossRef]
  40. Zadeh, L.A. Fuzzy logic and its application to approximate reasoning, Part III. Inf. Sci. 1975, 9, 43–80. [Google Scholar] [CrossRef]
  41. Bellman, R.E.; Zadeh, L.A. Decision-making in a fuzzy environment. Manag. Sci. 1970, 17, B-141–B-164. [Google Scholar] [CrossRef]
  42. Linstone, H.A.; Turoff, M. (Eds.) The Delphi Method: Techniques and Applications; Addison-Wesley: Reading, MA, USA, 1975. [Google Scholar]
  43. Edwards, W.; Barron, F.H. SMARTS and SMARTER: Improved simple methods for multiattribute utility measurement. Organ. Behav. Hum. Decis. Process. 1994, 60, 306–325. [Google Scholar] [CrossRef]
  44. Ginevičius, R. A new determining method for the criteria weights in multicriteria evaluation. Int. J. Inf. Technol. Decis. Mak. 2011, 10, 1067–1095. [Google Scholar] [CrossRef]
  45. Keršulienė, V.; Zavadskas, E.K.; Turskis, Z. Selection of rational dispute resolution method by applying new Step-wise Weight Assessment Ratio Analysis (SWARA). J. Bus. Econ. Manag. 2010, 11, 243–258. [Google Scholar] [CrossRef]
  46. Eckenrode, R.T. Weighting multiple criteria. Manag. Sci. 1965, 12, 180–192. [Google Scholar] [CrossRef]
  47. Jahan, A.; Bahraminasab, M.; Edwards, K.L. A target-based normalization technique for materials selection. Mater. Des. 2012, 35, 647–654. [Google Scholar] [CrossRef]
  48. Shannon, C.E. A mathematical theory of communication. Bell Syst. Tech. J. 1948, 27, 379–423. [Google Scholar] [CrossRef]
  49. Shannon, C.E.; Weaver, W. The Mathematical Theory of Information; University of Illinois Press: Urbana, IL, USA, 1949. [Google Scholar]
  50. Diakoulaki, D.; Mavrotas, G.; Papayannakis, L. Determining objective weights in multiple criteria problems: The CRITIC method. Comput. Oper. Res. 1995, 22, 763–770. [Google Scholar] [CrossRef]
  51. Schoemaker, P.J.; Waid, C.C. An experimental comparison of different approaches to determining weights in additive utility models. Manag. Sci. 1982, 28, 182–196. [Google Scholar] [CrossRef]
  52. Bernoulli, D. Specimen Theoriae Novae de Mensura Sortis,” Commentarii Academiae Scientiarum Imperialis Petropolitanae, Tomus V [Papers of the Imperial Academy of Sciences in Petersburg, Vol. V], 1738, pp. 175–192. Econometrica 1954, 22, 23–36. [Google Scholar] [CrossRef]
  53. Bell, D.E.; Keeney, R.L.; Raiffa, H. Conflicting Objectives in Decisions; John Wiley & Sons: Hoboken, NJ, USA, 1977; ISBN 978-0471995067. [Google Scholar]
Figure 1. The multiple criteria expert system for personnel selection (developed by the authors).
Mathematics 12 00219 g001
Figure 2. Determining the criteria weights using the expanded SWARA method (developed by the authors).
Mathematics 12 00219 g002
Table 1. The experts’ qualifications and additional conditions.
ExpertQualificationsAdditional Conditions
E1Project Management ExpertExtensive experience in project management methodologies and practicesFamiliarity with challenges and requirements of managing projects in sustainable development
Profound understanding of characteristics and competencies expected from project managers
E2Sustainable Development SpecialistExpertise in sustainable development principles, frameworks, and strategiesKnowledge of sustainability’s environmental, social, and economic aspects
Understanding of the role of project managers in integrating sustainable practices into project initiatives
E3Decision-Making and MCDA ExpertExpertise in decision-making processes and methodologiesFamiliarity with MCDA techniques and their application in evaluating criteria weights
Insights into the appropriateness and effectiveness of the SHARDA method in the given context
E4Academics and ResearchersSpecialisation in project management, sustainable development, or related disciplinesConducts research in project management and sustainable economic development
Theoretical knowledge and expertise in evaluating criteria and decision-making methodologies
E5Industry PractitionerPractical experience as a project manager or executive in organisations involved in sustainable economic developmentUnderstanding of challenges in selecting and developing project managers in this domain
Insights into the applicability and relevance of the SHARDA method in real-world scenarios
E6Stakeholder RepresentativeRepresents stakeholders such as government bodies, NGOs, or community representativesProvides a broader perspective on social and environmental dimensions of sustainable economic development
Offers insights into criteria that align with the interests and values of stakeholders
Table 2. Two-level criteria set.
Level 1 Level 2
Overall Criteria Sub-Criteria
x1Leadership Abilitiesx1.1Strategic Vision
x1.2Decision-Making Skills
x1.3Team Building and Motivation
x2Technical Expertisex2.1Industry Knowledge
x2.2Project Management Skills
x2.3Problem-Solving and Analytical Abilities
x3Communication Skillsx3.1Verbal and Written Communication
x3.2Active Listening
x3.3Stakeholder Engagement and Relationship Building
x4Adaptability and Flexibilityx4.1Ability to Manage Change
x4.2Resilience and Stress Management
x4.3Learning and Development Orientation
x5Ethical and Social Responsibilityx5.1Environmental Awareness
x5.2Social Impact Consideration
x5.3Ethical Decision Making
Table 3. The ten-point Likert-type relative importance scale (ri) for assessing managers’ qualitative skills.
Relative ImportanceDefinition
1Not Important: The skill is deemed unimportant or has no significant impact on managerial performance and effectiveness.
2Slightly Important: The skill has minimal importance and contributes only marginally to managerial performance and effectiveness.
3Somewhat Important: The skill holds some importance, but its contribution is relatively modest compared to other skills.
4Moderately Important: The skill possesses a moderate level of importance and has a noticeable impact on managerial performance and effectiveness.
5Important: The skill is essential and significantly affects managerial performance and effectiveness.
6Quite Important: The skill substantially influences managerial performance and effectiveness.
7Very Important: The skill is essential and is a significant factor in determining managerial performance and effectiveness.
8Extremely Important: The skill is critical in managerial performance and effectiveness.
9Absolutely Important: The skill comprehensively evaluates managerial performance and effectiveness.
10Most Critically Important: The skill is the most critically important and is statistically significant in assessing managerial performance and effectiveness.
Table 4. The six experts’ importance assessment of each criterion using the ten-point Likert-type relative importance scale (ri) (Table 3).
CriteriaE1E2E3E4E5E6MedianGeometric MeanRank
x1Leadership Abilities8.5989.5999.08.821
x2Technical Expertise98.58.5888.58.58.412
x3Communication Skills8888798.07.983
x4Adaptability and Flexibility878887.58.07.744
x5Ethical and Social Responsibility69.5766.06.06.06.655
Table 5. The pair-wise comparison nine-level importance ratio scale (developed by authors based on Saaty [44]).
Intensity of ImportancesDefinition
01.0Criterion j and j + 1 are equally essential or of equal significance
0.10.9Criterion i is slightly more important than criterion j + 1
0.20.8Criterion i is moderately more critical than criterion j + 1
0.30.7Criterion i is considerably more important than criterion j + 1
0.40.6Criterion i is significantly more critical than criterion j + 1
0.50.5Criterion i is substantially more critical than criterion j + 1
0.60.4Criterion i is very strongly more critical than criterion j + 1
0.70.3Criterion i is extremely more critical than criterion j + 1
0.80.2Criterion i is absolutely more important or most critically important compared to criterion j + 1
0.90.1Criterion i is of maximum importance compared to criterion j + 1
Table 6. The importance assessment (sj) (Table 5) of each criterion by the six experts.
CriteriaE1E2E3E4E5E6 v j q j
x111111111110.234
x210.910.80.90.90.90.9120.9140.214
x30.90.9110.911.00.9530.8670.203
x410.91110.81.00.9540.8210.192
x50.710.90.80.70.90.90.8350.6780.158
n—number of criteria; k—number of experts. ∑ =4.64 4.2801.000
Table 7. Importance assessment of sub-criteria by experts using the ten-point Likert-type relative importance scale (rj) (presents Table 3).
x1.1x1.2x1.3x2.1x2.2x2.3x3.1x3.2x3.3x4.1x4.2x4.3x5.1x5.2x5.3
E1987987987878989
E2879789899787798
E3798898787979877
E4887778978897789
E5979979799788897
E6798887887979778
514447475044384441524144484039
Geomean8.467.327.787.788.37.276.297.296.7038.656.87.297.946.636.38
∑Geomeans 23.6 23.3 20.28 22.7 20.9
q0.360.310.330.330.360.310.310.360.330.380.300.320.380.320.30
Rank132213312132123
Table 8. Importance assessment of sub-criteria (S-C) by experts (si) (Table 5).
x1.1x1.3x1.2x2.2x2.1x2.3x3.2x3.3x3.1x4.1x4.3x4.2x5.1x5.2x5.3
E110.90.9110.8111110.810.80.8
E2110.810.90.9110.8111110.9
E311110.90.910.80.8110.810.80.8
E410.80.811111110.80.8111
E5110.8111110.8111110.8
E6111110.810.80.8110.8111
65.75.365.85.465.65.265.85.265.650.3
s0.350.340.310.350.340.310.360.330.310.350.340.310.360.3300.31
Rank123123123123123
Table 9. Final importance of S-C.
Criteria
x1x2x3x4x5
w0.2340.2140.2030.1920.158
S-Cx1.1x1.2x1.3x2.1x2.2x2.3x3.1x3.2x3.3x4.1x4.2x4.3x5.1x5.2x5.3
q0.350.310.340.340.350.310.310.360.330.350.310.340.360.330.31
w0.0820.0730.0800.0730.0750.0660.0630.0730.0670.0670.0600.0650.0570.0520.049
Note: Using a ten-point scale, the values in the table represent the importance assessments of each criterion’s sub-criteria by the respective experts.
Table 10. Assessment of candidates’ skills by experts.
P1P2P3P4P5P6P7P8P9P10P11P12P13P14P15
x1.1 Strategic Vision
E1768668676886569
E2776876687696696
E3868787667897577
E4778968798786697
E5768776676996688
E6878667777786669
7.326.487.637.096.636.956.327.276.807.448.496.165.657.397.59
443946434042384441455137344546
x1.2 Decision-Making Skills
E1769778865897667
E2867776856699796
E3879877965889677
E4768878856796696
E5668676966987786
E6869777756798766
7.296.168.307.137.006.958.145.485.657.448.657.596.487.396.32
443750434242493334455246394538
x1.3 Team Building and Motivation
E1656868676898666
E2767666587696667
E3657777666886676
E4668868597797766
E5766766676986667
E6767767577797767
6.485.656.807.136.166.955.487.276.487.448.656.636.326.166.48
393441433742334439455240383739
x2.1 Industry Knowledge
E1799689866876866
E2777677875677897
E3689679966685877
E4779778875776998
E5898678966677686
E6779779775786767
6.987.788.466.327.168.308.146.485.486.637.326.137.617.396.80
424751384350493933404437464541
x2.2 Project Management Skills
E1968768668676657
E2857777666787766
E3968687576687657
E4857767667778666
E5967877766666766
E6858767667787766
8.495.487.486.986.637.165.976.166.636.487.296.806.485.656.32
513345424043363740394441393438
x2.3 Problem Solving and Analytical Abilities
E1666878876667766
E2576776886669797
E3665776866679676
E4586767897766796
E5667776976667887
E6576777877768767
5.486.635.977.166.826.638.167.276.326.326.167.596.987.396.48
334036434140494438383746424539
x3.1 Verbal and Written Communication
E1786668695696667
E2877676576797796
E3876787695587677
E4777668586698696
E5676676686786786
E6877667596697766
7.297.166.486.166.636.955.488.305.656.138.656.806.487.396.32
444339374042335034375241394538
x3.2 Active Listening
E1866667876876866
E2977857886677896
E3965766866687877
E4876857897778996
E5967868876676687
E6876657777787766
8.496.486.137.115.486.987.827.276.326.637.326.807.617.396.32
513937433342474438404441464538
x3.3 Stakeholder Engagement and Relationship Building
E1588766666766967
E2687776657777996
E3588786767665877
E4677867658776997
E5687776666867887
E6688767657776967
5.657.827.487.166.636.326.165.486.806.986.486.138.657.396.82
344745434038373341423937524541
x4.1 Ability to Manage Change
E1796667986897666
E2776776776679577
E3887587976899676
E4776667877796586
E5796676876987667
E6876667977798577
7.327.786.165.976.636.658.307.166.327.448.467.595.486.806.48
444737364040504338455146334139
x4.2 Resilience and Stress Management
E1676768679867566
E2577877687669677
E3687787669869556
E4598968798776666
E5686777678967667
E6587867779768667
5.487.806.807.636.637.326.327.278.307.446.167.595.655.976.48
334741464044384450453746343639
x4.3 Learning and Development Orientation
E1779668687676667
E2987776687775796
E3889587777676777
E4789668678775796
E5988776677676786
E6889667678785766
7.967.828.466.136.636.956.167.327.326.487.165.486.827.396.32
484751374042374444394333414538
x5.1 Environmental Awareness
E1668667676896669
E2667677787697596
E3677687577886677
E4667767688797597
E5567677776986688
E6567767677797569
5.656.167.166.326.637.006.137.326.807.448.656.485.487.397.59
343743384042374441455239334546
x5.2 Social Impact Consideration
E1686666878669866
E2677778887657897
E3785787977669876
E4676868887759996
E5677677977668687
E6686767777759767
6.167.486.136.806.637.138.147.327.166.325.488.467.617.396.48
374537414043494443383351464539
x5.3 Ethical Decision Making
E1986868866876567
E2976876877687656
E3887887957886567
E4976968868776656
E5886876976967666
E6986867767787656
8.657.656.168.166.636.958.146.136.807.447.296.485.655.486.32
524637494042493741454439343338
Note: The values in the table represent the experts’ assessment of each candidate’s skills (sub-criteria) using a ten-point Likert-type scale.
Table 11. Initial decision-making matrix.
Criteriax1x2x3x4x5
w0.2340.2140.2030.1920.158
S-Cx1.1x1.2x1.3x2.1x2.2x2.3x3.1x3.2x3.3x4.1x4.2x4.3x5.1x5.2x5.3
q0.350.310.340.340.350.310.310.360.330.350.310.340.360.330.31
w0.0820.0730.080.0730.0750.0660.0630.0730.0670.0670.060.0650.0570.0520.049
P0101010101010101010101010101010
P17.327.296.486.988.495.487.298.495.657.325.487.965.656.168.65
P26.486.165.657.785.486.637.166.487.827.787.87.826.167.487.65
P37.638.36.88.467.485.976.486.137.486.166.88.467.166.136.16
P47.097.137.136.326.987.166.167.117.165.977.636.136.326.88.16
P56.6376.167.166.636.826.636.636.636.636.636.636.636.636.63
P66.956.956.958.37.166.636.956.986.326.657.326.9577.136.95
P76.328.145.488.145.978.165.487.826.168.36.326.166.138.148.14
P87.275.487.276.486.167.275.487.167.277.327.327.326.87.166.8
P96.85.656.485.486.636.325.656.326.86.328.37.326.87.166.8
P107.447.447.446.636.486.326.136.636.987.447.446.487.446.327.44
P118.498.658.657.327.296.168.657.326.488.466.167.168.655.487.29
P126.167.596.636.136.87.596.86.86.137.597.595.486.488.466.48
P135.656.486.327.616.486.986.487.618.655.485.656.825.487.615.65
P147.397.396.167.395.657.397.397.397.396.85.977.397.397.395.48
P157.596.326.486.86.326.486.326.326.826.486.486.327.596.486.32
115.21115.97110.08116.98110111.36109.05115.19113.74114.7112.89114.4111.68114.53114.6
Table 12. Normalised decision-making matrix.
S-Cx1.1x1.2x1.3x2.1x2.2x2.3x3.1x3.2x3.3x4.1x4.2x4.3x5.1x5.2x5.3
w0.0820.0730.080.0730.0750.0660.0630.0730.0670.0670.060.0650.0570.0520.049
P00.0870.0860.0910.0850.0910.0900.0920.0870.0880.0870.0890.0870.0900.0870.087
P10.0640.0630.0590.0600.0770.0490.0670.0740.0500.0640.0490.0700.0510.0540.075
P20.0560.0530.0510.0670.0500.0600.0660.0560.0690.0680.0690.0680.0550.0650.067
P30.0660.0720.0620.0720.0680.0540.0590.0530.0660.0540.0600.0740.0640.0540.054
P40.0620.0610.0650.0540.0630.0640.0560.0620.0630.0520.0680.0540.0570.0590.071
P50.0580.0600.0560.0610.0600.0610.0610.0580.0580.0580.0590.0580.0590.0580.058
P60.0600.0600.0630.0710.0650.0600.0640.0610.0560.0580.0650.0610.0630.0620.061
P70.0550.0700.0500.0700.0540.0730.0500.0680.0540.0720.0560.0540.0550.0710.071
P80.0630.0470.0660.0550.0560.0650.0500.0620.0640.0640.0650.0640.0610.0630.059
P90.0590.0490.0590.0470.0600.0570.0520.0550.0600.0550.0740.0640.0610.0630.059
P100.0650.0640.0680.0570.0590.0570.0560.0580.0610.0650.0660.0570.0670.0550.065
P110.0740.0750.0790.0630.0660.0550.0790.0640.0570.0740.0550.0630.0770.0480.064
P120.0530.0650.0600.0520.0620.0680.0620.0590.0540.0660.0670.0480.0580.0740.057
P130.0490.0560.0570.0650.0590.0630.0590.0660.0760.0480.0500.0600.0490.0660.049
P140.0640.0640.0560.0630.0510.0660.0680.0640.0650.0590.0530.0650.0660.0650.048
P150.0660.0540.0590.0580.0570.0580.0580.0550.0600.0560.0570.0550.0680.0570.055
Table 13. Normalised–weighted decision-making matrix and problem solution results.
S-Cx1.1x1.2x1.3x2.1x2.2x2.3x3.1x3.2x3.3x4.1x4.2x4.3x5.1x5.2x5.3 K i Rank
P00.0070.0060.0070.0060.0070.0060.0060.0060.0060.0060.0050.0060.0050.0050.0040.0881.000O
P10.0050.0050.0050.0040.0060.0030.0040.0050.0030.0040.0030.0050.0030.0030.0040.0620.7004
P20.0050.0040.0040.0050.0040.0040.0040.0040.0050.0050.0040.0040.0030.0030.0030.0610.6898
P30.0050.0050.0050.0050.0050.0040.0040.0040.0040.0040.0040.0050.0040.0030.0030.0630.7082
P40.0050.0040.0050.0040.0050.0040.0040.0050.0040.0030.0040.0030.0030.0030.0030.0610.6879
P50.0050.0040.0040.0040.0050.0040.0040.0040.0040.0040.0040.0040.0030.0030.0030.0590.66712
P60.0050.0040.0050.0050.0050.0040.0040.0040.0040.0040.0040.0040.0040.0030.0030.0620.7013
P70.0040.0050.0040.0050.0040.0050.0030.0050.0040.0050.0030.0040.0030.0040.0030.0610.6945
P80.0050.0030.0050.0040.0040.0040.0030.0050.0040.0040.0040.0040.0030.0030.0030.0600.68310
P90.0050.0040.0050.0030.0050.0040.0030.0040.0040.0040.0040.0040.0030.0030.0030.0580.65515
P100.0050.0050.0050.0040.0040.0040.0040.0040.0040.0040.0040.0040.0040.0030.0030.0610.6946 = 7
P110.0060.0050.0060.0050.0050.0040.0050.0050.0040.0050.0030.0040.0040.0020.0030.0670.7551
P120.0040.0050.0050.0040.0050.0040.0040.0040.0040.0040.0040.0030.0030.0040.0030.0600.68211
P130.0040.0040.0050.0050.0040.0040.0040.0050.0050.0030.0030.0040.0030.0030.0020.0580.66014
P140.0050.0050.0040.0050.0040.0040.0040.0050.0040.0040.0030.0040.0040.0030.0020.0610.6946 = 7
P150.0050.0040.0050.0040.0040.0040.0040.0040.0040.0040.0030.0040.0040.0030.0030.0580.66113
Disclaimer/Publisher’s Note: The statements, opinions and data contained in all publications are solely those of the individual author(s) and contributor(s) and not of MDPI and/or the editor(s). MDPI and/or the editor(s) disclaim responsibility for any injury to people or property resulting from any ideas, methods, instructions or products referred to in the content.

