1. Introduction
1.1. Structural Health Monitoring
Structural health monitoring (SHM) is associated with the potential for significant safety, reliability, and economic benefits and motivated the need for developing this system. SHM is a technique for monitoring the dynamic and static properties caused by damage. The damage can be defined as changes in the properties of the material or the geometry of a structure that affect the overall performance of the structure.
The most common methods for damage detection are vibration-based damage identification methods. The methods can be tested in two different strategies which are model-based and non-model based. The model-based strategy consists in comparing a theoretical model with a measured model to identify the damage. The non-model based one consists in using signal processing algorithms to analyze the signal response in time and frequency domains. However, these methods have limitations. They require expensive devices, and it is hard to obtain data from a large-scale structure. Recently, non-contact methods were introduced, such as applying computer vision technology to measure vibration and deformation.
In this paper, a new method for obtaining dynamic data from a structure is proposed. These dynamic data can be used for vision-based techniques. The proposed vision-based monitoring system uses a video motion magnification method to extract the natural frequency of cantilever beams. It amplifies the video signal to reveal hidden small motions of the structure.
Furthermore, optimization techniques are used in a wide variety of ways to reduce time and cost when solving problems. Optimization techniques are used in various fields such as the economy, industry, energy, and transportation to efficiently use resources [
1,
2,
3]. Optimization is a technique that minimizes or maximizes the objective function of the problem to be solved by setting constraints. The problem to be solved is mathematically modeled, and the optimal solution is obtained through several algorithms. In order to monitor the health condition of the structure, some studies effectively inspect the sensor fault [
4] and the optimal sensor placement (OSP) [
5,
6,
7] whereby sensors are placed in the optimal position. In addition, other researchers apply machine learning to SHM [
8,
9], traditional optimization techniques to structures [
10,
11], or novel optimization techniques [
12,
13]. Novel optimization techniques are inspired by nature and humans, respectively, and other studies bio-inspired [
12,
14].
The cantilever beam is a structure with one side fixed and the other in a free form. Due to this structural characteristic, the cantilever beam is widely used for various architectural and engineering purposes and can be the basis of a structure; much research has been conducted on it. Research on cantilever beams [
10,
15,
16] in the context of SHM has demonstrated that the damage analysis of structures can be mathematically modeled and transformed into optimization problems. Additionally, these optimization problems can be effectively solved using algorithms, enabling the diagnosis of structural damage. This confirms that an optimization approach can be a novel solution to problems in the SHM field.
1.2. Vision-Based Structural Health Monitoring
Vision-based monitoring methods have been extensively applied to SHM to detect damage in a structure. In recent years, vision-based monitoring systems have been widely studied with the development of computers, computing technologies (computer vision, soft computing, etc.), and image sensors (motion capture cameras, high-speed cameras, stereo cameras, etc.) and have been applied to the SHM field.
Chen et al. [
17] identified the modal parameters by measuring cantilever beams and the dynamic responses of pipe structures through phase-based motion magnification methods as a study in the SHM field by applying computing. Also, a study [
18] used phase-based motion magnification with edge detection algorithms and blind source separation to measure the mode shape of building structures and cantilever beams. A stereo camera vision system was used to evaluate and inspect the state of large structures that make up complex structures. It could collect 3D full-field images and a study [
19] was conducted to obtain the operation shape of wind turbine blades using DIC (Digital Image Correlation) with stereo photogrammetry along with phase-based motion magnification methods. As such, the vision-based monitoring system is useful in terms of use and cost for inspecting the deformation and vibration of structures. In addition, it is evaluated as a promising technology in the SHM field because it has the potential to measure the overall dynamic responses of the structure. In this study, a vision-based monitoring system was introduced for SHM to acquire high-resolution data, and based on this, a more accurate analysis of the structure was attempted.
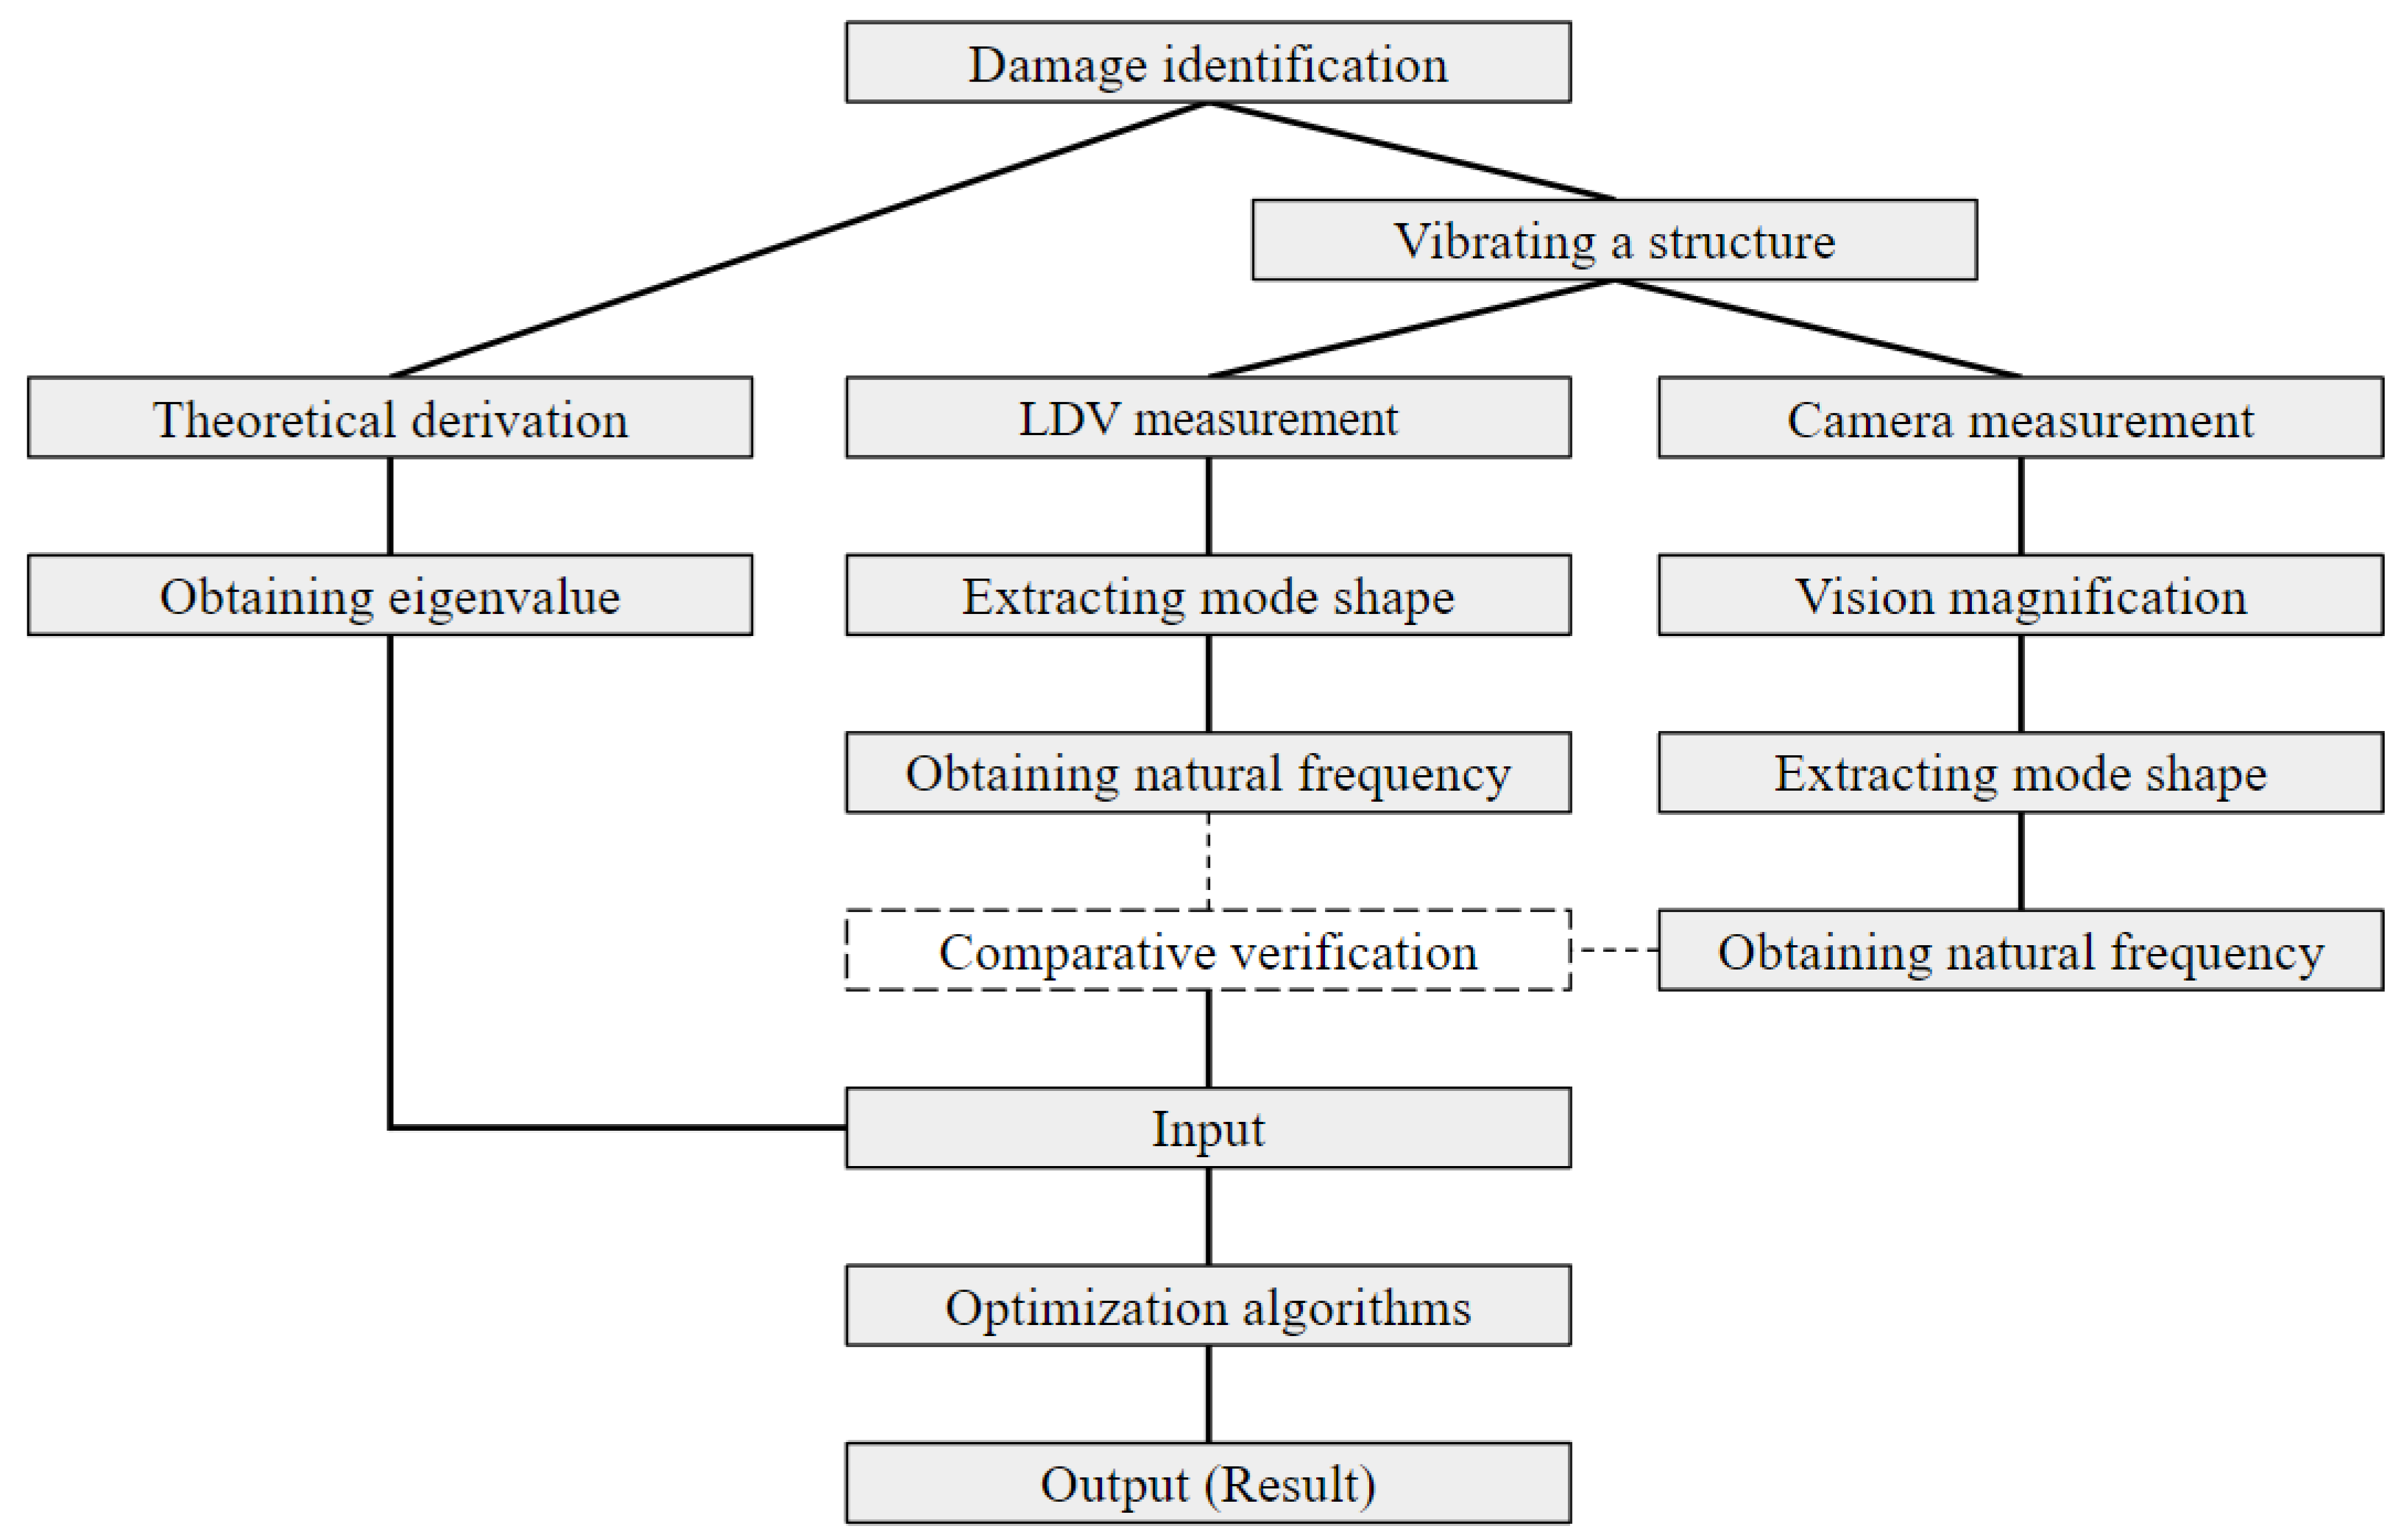
This paper is an extended work of our previous research [
10]. We propose an innovative SHM system to estimate and detect the damage in a cantilever beam using a vision-based monitoring system with phase-based motion magnification and bio-inspired optimization methods. Our previous work applied a real-value encoding genetic algorithm (GA). To improve the results of estimating the damage location and depth on the cantilever beams, different types of bio-inspired optimizers are compared to estimate more accurate locations and depth of the damage on the cantilever beam by optimizing the natural frequencies obtained from the proposed vision-based monitoring system. The overall flowchart of the proposed work is illustrated in
Figure 1.
The paper is organized as follows: 1. introduction of structural health monitoring using optimization methods and vision-based structural health monitoring; 2. overview of bio-inspired optimization methods, namely, genetic algorithm, particle swarm optimization, sea lion optimization, and coral reefs optimization; 3. estimation of damage detection in 2-bay structure using bio-inspired optimization methods; 4. introduction of phase-based motion magnification for the proposed vision-based monitoring system; 5. estimation of damage detection in beam structure using natural frequency obtained from the vision-based monitoring system; 6. results of the calculated damage location and magnitude in the beam structure using the proposed vision-based monitoring system with bio-inspired optimization methods.
2. Overview of Bio-Inspired Optimization
Bio-inspired optimization algorithms are a type of algorithms derived from natural processes and biological evolution. These algorithms utilize mechanisms observed in nature, such as selection, reproduction, mutation, and social behaviors, to find optimal solutions to complex problems. Bio-inspired optimization techniques are extensively applied across diverse fields such as environmental science, finance, engineering, and manufacturing, due to their flexibility and effectiveness in solving multi-dimensional and non-linear optimization problems. In this study, bio-inspired optimization techniques are applied to estimate the location and magnitude of damage in structures. The non-destructive testing methods for estimating the location with the magnitude of the damage in a structure is formulated as a global optimization problem. During the past decades, vibration parameters have been used for non-destructive structural-damage detection methods. By measuring the vibration parameters, such as natural frequency, mode shape, and damping of the structure, the damage in the structure can be localized and quantified, indicating the overall condition of the structure.
In general, the damage in a structure causes a reduction in the stiffness and an increase in the damping of the structure. These changes affect the mechanical properties of the structure causing a reduction in the natural frequencies and mode shape curvatures. Therefore, the changes in the vibration parameters between undamaged and damaged structures can be used to estimate the location and magnitude of the damage in the structure. Many researchers have applied optimization techniques for structural health monitoring (SHM) applications to estimate the damage using vibration parameters. However, the traditional optimization methods are time-consuming and inefficient when solving a large-scale optimization problem. With recent advances in soft-computing technologies, more efficient optimization algorithms have been introduced. In this paper, we apply one of the promising optimization methods which is a bio-inspired optimization method. The objective functions used in this paper consists in minimizing the natural frequencies measured from the proposed vision-based monitoring system and the natural frequencies calculated from an analytical model of a damaged structure.
Both swarm-based and evolutionary-based optimization techniques are included in bio-inspired optimization. Swarm-based optimization algorithms are inspired by the collective action observed in decentralized, self-organizing systems, such as bird flocks or fish schools. In contrast, evolutionary-based optimization algorithms are inspired by the principles of natural selection and genetic evolution.
In this section, we discuss several prominent bio-inspired optimization algorithms, such as genetic algorithms, particle swarm optimization, sea lion optimization, and coral reefs optimization. Particle swarm optimization and sea lion optimization fall under the swarm-based category, while genetic algorithms and coral reefs optimization fall under the evolutionary-based category. Each of these algorithms mimics a different natural process and has unique characteristics that make it suitable for different types of optimization problems.
2.1. Genetic Algorithms 1–4
Genetic algorithms (GAs) [
20,
21], one of the types of evolutionary-based optimization, are a kind of stochastic optimization technique inspired by the principles of natural evolution and heredity. A GA performs well in exploring complex optimization problems in parallel and globally and finding optimal solutions. Applying Darwin’s theory of natural selection, it goes through a process where good solutions survive, and bad solutions disappear in a set of candidate solutions. The GA goes through repetitive search processes to find the optimal solution. In the initialization phase, which is performed once, the GA randomly creates a set of individuals called chromosomes. At that time, each entity represents a point in the solution space. After that, the GA performs three important actions at each stage that imitate the genetic behavior of initialization, selection, crossover, and mutation. Each action mimics the genetic principle as follows:
Selection: Select an individual from the current group. This is the process of becoming the parent of the next generation, and preferably a good parent should be selected to produce offspring. The selection phase includes the roulette wheel selection, tournament selection, ranking-based selection, and elitism. Each method increases the likelihood of chromosomes being transmitted to future generations.
- –
In roulette wheel selection, the chromosomes are compared to each other to select the chromosome to be passed on to the next generation in the current set of objects. In the roulette wheel selection, the probability of selection for the ith chromosome is expressed mathematically as , where f is the fitness function, and N is the number of chromosomes present in a generation.
- –
Tournament selection produces a random number between 0 and 1 after randomly selecting two chromosomes. If this value is less than a threshold, choose the one with the higher fit, or choose the one with the lower fit.
- –
In ranking-based selection, chromosomes are selected based on their ranking rather than their fit. Ranking each chromosome in an individual set is performed, and the better the ranking, the better the probability of being selected.
- –
In elitism, some of the best chromosomes are selected (considering elitism rate ), and the selected chromosomes are passed on to the next generation without any change. This maintains good information and helps improve performance.
Crossover: The characteristics of the two solutions are crossed and partially combined to create one new characteristic. Methods of crossover include single-point, two-point, and uniform crossovers. The single point and two points refer to the number of intersections and the characteristics of the two chromosomes are combined based on each intersection. The unit generates a random number at each genetic factor location on the chromosome and intersects the characteristics between the two chromosomes compared to a threshold.
Mutation: In this phase, mutation is applied to some chromosomes probabilistically (considering mutation rate ) across the entire chromosome. Randomly changing the genetic factors of chromosomes to cause other harm allows the children to have features that are not present in the parents. This prevents the entire generation from converging to a local minimum.
| Algorithm 1: Genetic algorithm |
![Mathematics 12 02633 i001]() |
2.2. Particle Swarm Optimization
Swarm-based optimization is a type of mathematical optimization in which multiple optimizers exchange information to perform optimization. Compared to single-agent optimization, it requires more computational resources but is more likely to converge to the global optimum. One of the well-known algorithms in swarm-based optimization is particle swarm optimization (PSO), which was proposed in 1995 [
22]. PSO draws inspiration from the social behavior patterns seen in bird flocks and fish schools. The method finds the optimal solution by considering both the individual optimum found in each particle and the global optimum found in the entire swarm. In Heppner’s bird simulation [
23], the introduction of a two-dimensional comfield vector is proposed to model the dynamic behavior of the flock. Each agent within the simulation evaluates its current position
using
with a value of 0 when the current position is (100, 100).
| Algorithm 2: Particle swarm optimization (PSO) |
![Mathematics 12 02633 i002]() |
The optimal solution is determined by Equation (
1):
where
and
are the velocity and position of particle
i at point
t, “
” represents the optimal position discovered by particle
i to date, while
indicates the best position identified as the entire swarm. The decision to subtract or add
g with a random constant applied to
is determined by comparing
with
, where the
g is a weight parameter.
2.3. Sea Lion Optimization Algorithm
The sea lion optimization (SLnO) algorithm [
24], like PSO, is an optimization method inspired by swarm activity. SLnO is a metaheuristic optimization method modeled after the hunting behavior of sea lions. Sea lions utilize their whiskers to recognize the location of their prey, communicate with each other through vocalizations, and hunt in groups. These behaviors are mathematically modeled as follows to solve optimization problems effectively.
First, in the detection and tracking phase:
Equation (
2) indicates the distance between the sea lion
and the target prey
at point
t, where
is a random vector in
, which is multiplied by 2 to expand the solution area and assist in identifying the optimal solution efficiently. Equation (
3) represents the process of approaching the target prey, where
decreases linearly from 2 to 0.
Second, in the communication phase, when the sea lions detect their prey, they exchange information through vocalization. This behavior is modeled by Equation (
4) to enhance the algorithm’s performance by ensuring that all agents work together to find the optimal solution.
where
is the velocity of sound of the sea lion leader,
and
are the speeds of sound in water and air, respectively, each having values of
and
.
Third, the attack (hunting) phase is crucial for refining the search process and homing in on the optimal solution. This phase involves two main phases: a dwindling encircling technique and a circle updating position. In the dwindling encircling technique, the gradual encircling of the prey by sea lions is mathematically modeled. In Equation (
3), the value of
is decreased linearly from 2 to 0, which helps to narrow the search space around the prey. The circle updating position, where sea lions encircle and attack the prey from all directions, is mathematically modeled in Equation (
5).
where
m is a random number in
, and
is used because the sea lions swim along a circular path to hunt their prey.
Fourth, in the searching-for-prey phase, the exploration is diversified using a random value
to enhance the search for the global optimum. If
is smaller than 1, the position of the search agent is updated. If
is bigger than 1, a search agent is selected randomly. If the optimal solution is found, the SLnO algorithm ends.
| Algorithm 3: Sea lion optimization (SLnO) algorithm |
![Mathematics 12 02633 i003]() |
2.4. Coral Reefs Optimization Algorithm
The coral reefs optimization (CRO) [
25] algorithm is a novel combination of biological inspiration and meta-heuristic algorithm designed to solve complex optimization problems by simulating the natural processes of coral reef development and coral reproduction. Coral reefs, during their growth process, engage in a competitive struggle to occupy available space. This competition, combined with the unique reproductive mechanisms of corals, leads to the development of a robust and efficient optimization algorithm. The CRO algorithm models the reef as a grid (
) of size
. Each grid cell can host a coral (solution) or be empty. The initial proportion of occupied cells is denoted by
. Each coral has a corresponding health function
that denotes the objective function value of the optimization problem. The CRO algorithm simulates both sexual and asexual reproduction of corals:
Broadcast spawning (external sexual reproduction): A portion of corals are selected to release gametes into the water. These gametes combine to form larvae that try to settle on the reef.
Brooding (internal sexual reproduction): a portion of corals reproduce by internal mutation, producing larvae that are released into the water.
Larvae setting: Larvae attempt to settle in the reef. When a larva attempts to settle in a cell that is occupied, it replaces the existing coral if its health function has improved. Each larva has a limited number of attempts before being depredated.
Asexual reproduction (budding or fragmentation): The corals currently present in the reefs are sorted based on their health levels as determined by a certain criterion. A portion of the best corals replicate and attempt to establish themselves in various parts of the reef.
Depredation in polyp phase: with a small probability, the worst corals are removed from the reef, freeing up space for new corals.
| Algorithm 4: Coral reefs optimization (CRO) algorithm |
![Mathematics 12 02633 i004]() |
3. Estimation of Damage Detection in Two-Bay Truss Structure Using Bio-Inspired Optimization Methods
To verify the performance of each bio-inspired optimization methods, the eigenvalues of a two-bay truss structure were used for estimating the damaged elements. A two-bay truss is shown in
Figure 2. The numbers in the dotted circle indicate the element numbers, and the numbers with red arrows indicate the unconstrained degrees of freedom. To estimate and detect the damage in the truss structure, calculating all nine unconstrained DOF is not practical and not efficient. Therefore, only the first three unconstrained DOF were used for the damage detection. This two-bay truss structure had nine unconstrained degrees of freedom, and each element in the truss had the following characteristics: Young’s modulus of elasticity E = 70 GPa (70 × 109 N/m
2), Poisson’s ratio = 0.33, mass density = 2700 kg/m
3, and cross-sectional area A = 0.01 m
2. Three different cases for the truss structure were evaluated: (1) 50% damaged at element 7, (2) 20% damaged at element 10, and (3) 30% damaged at element 3, and 20% damaged at element 8.
The residual force method (RFM) is a powerful technique used to update finite element models by reducing the residuals between the predicted and observed results of a structure. The RFM specifically aims to adjust the mass and stiffness matrix so that the updated model accurately reflects the dynamic response of the structure subjected to various load conditions. The RFM involves the following steps:
Initial model analysis: solve the initial finite element model to obtain the modal properties including the natural mode shapes and frequencies.
Experimental data collection: measure the structure’s dynamic behavior under similar conditions.
Residual calculation: calculate the residual forces, which are the residuals between the predicted forces and those measured by the initial model.
Model updating: adjust the parameters of the stiffness matrices and mass stiffness matrices to minimize these residual forces, thereby improving the model’s accuracy.
The RFM analysis process for a finite-element two-bay truss structure is described in the following, including the relevant equations. During the examination of MDOF structural dynamic systems, the equation of motion is a fundamental aspect. This can be expressed by:
where
V is a vector represented by the product of two terms,
M and
K.
M is the mass matrix,
K is the stiffness matrix, and
z is the physical displacement vector. Equation (
6) can be rewritten for the
jth eigenvalue equation as Equation (
7):
where
is the eigenvalue, and
is the eigenvector for the normalized eigenvalue. In the finite element model of the structure, the overall stiffness can be represented as the aggregate of the expanded stiffness matrices of the individual elements. In the case of the damaged structure, the stiffness matrix is represented by the sum of element stiffness matrices multiplied by a parameter, and the equation is as follows:
where
n is the total number of elements,
is the expanded stiffness matrix of the
ith element, and
is the reduction parameter of the
ith element and has a value between zero and one. One means that an element is undamaged, and a value less than zero or one means that it is an element that is either completely or partially damaged. The equation for the eigenvalue used in the RFM can be derived from Equations (
7) and (
8) as follows:
where
is the residual force matrix with a size of
, where
n and
m are the number of elements and the number of modes, respectively. For the first mode,
can be expressed as follows:
The objective function with regard to the residual force matrix
R and the reduction parameter
can be written as
. Finally, the objective function is expressed by:
Assuming that damage leads to a loss of stiffness without affecting the mass, the two-bay truss structure analysis employed the residual force method and several optimization methods to analyze structural damage. This approach utilized modal vibration data, such as eigenvalues and eigenvectors. The modal analysis-based method offers several advantages:
Modal parameters are determined solely by the mechanical properties of the structures, making them less sensitive to environmental changes.
It can save the time and expense associated with damage monitoring.
The objective function for the optimization methods should be with respect to parameters associated with the physical characteristics and condition of the structure. Each parameter represents the decrease in stiffness of a specific element. The objective function includes a vector of residual forces that is expressed with regard to the stiffness matrix of the damaged structure.
The experiments on the two-bay truss structure with eigenvalues were conducted using a total of four test cases:
A 50% stiffness reduction at element 7
A 20% stiffness reduction at element 10
Multiple damage: a 30% stiffness reduction at element 3 and a 20% stiffness reduction at element 8
The cost function used in the verification for the damage detection using the bio-inspired optimization was defined as follows with reference to Equation (
9):
Equation (
12) was the cost function used for the optimization problem concerning a two-bay truss structure. Here,
m represents the number of mode shapes, indicating the shapes obtained from three different vibrations applied.
n denotes the number of elements constituting the two-bay structure, which was set to 11 as shown in
Figure 2. The parameter
, which we aimed to predict, was set as a list with a length of
n, where each element in the list was a real number ranging between zero and one.
These test cases were designed to evaluate the effectiveness of the optimization methods in detecting and quantifying structural damages. By analyzing the results from these diverse scenarios, the robustness and accuracy of the RFM could be thoroughly assessed. To apply the RFM to a two-bay truss structure, various optimization methods were employed, such as GA, PSO, SLnO, and CRO. Each of these optimization techniques offered unique advantages in minimizing the residual forces and adjusting the structural parameters to enhance the accuracy of the finite element model. By utilizing these methods, the efficiency and precision of the RFM process were significantly improved, leading to more reliable predictions of the structural behavior under various loading conditions.
The experiments applied the four optimization methods to the four test cases of the two-bay truss structure. The damage evaluation of the algorithm is shown in
Figure 3, and all algorithms performed well, resulting in similar performance graphs for all algorithms. Representatively, the performance graph for SLnO is illustrated in
Figure 3. The performance of each optimization method was evaluated based on the average error calculated for each element of the truss structure. The average error across all elements served as the performance metric. The average errors observed for each optimization method were shown in
Table 1:
The results indicated that optimization methods such as GA and PSO exhibited lower average errors compared to SLnO and CRO. This could be attributed to the relatively simple nature of the data and computations involved, allowing the simpler GA and PSO algorithms to perform better. The results suggested that bio-inspired optimization techniques could be applied to estimate and detect the damage in structures.
5. Estimation of Damage Detection in Beam Structure Using Natural Frequency and Rotational Spring Method
Rizos et al. [
28] represented damage as a rotational spring in a modal analysis for a cantilever beam having a rectangular cross-section as illustrated in
Figure 7. From the damage energy function, Diamarogonas and Paipetis [
29] defined the rotational spring constant K in the vicinity of the damaged section of the cantilever beam when lateral damage of uniform depth existed.
The damage energy function
describes the movement of the beam due to its geometry and material properties and is expressed by the following equation:
where
is the aspect ratio of the crack depth
a to the height of the beam’s cross-section
h. The stiffness factor
and the parameter
are defined by the following equations:
where
E is Young’s modulus,
I is the second moment of area,
is Poisson’s ratio,
h is the height of the beam’s cross-section,
is the function describing the movement of the beam as defined in Equation (
14),
w is the angular frequency defined as
, where
f is the frequency in hertz (Hz).
is the material’s density,
A is the cross-sectional area, and
L is the length of the beam. The stiffness factor
represents the beam’s resistance to deformation, factoring in the material’s elasticity, geometric properties, and the
function. The parameter
incorporates the effects of the material density, cross-sectional area, and other factors influencing the beam’s dynamic response.
To estimate the damage of the cantilever beam, the determinant of the matrix
M, which is essential for the analysis of the cantilever beam, must be calculated. The matrix
M is defined as:
where each sub-matrix represents different aspects of the beam’s dynamic response, incorporating both hyperbolic and trigonometric functions to model the beam’s behavior accurately.
6. Damage Detection Using Bio-Inspired Optimization Methods
This section represents the results of damage detection performance on the cantilever beams using bio-inspired optimization algorithms. This study investigated the application of four bio-inspired optimization algorithms for the damage detection in cantilever beams using natural frequencies obtained from the proposed vision-based monitoring system. As bio-inspired optimization algorithms, four different methods were used: GA, PSO, SLnO, and CRO. The experiments were conducted on two damaged cantilever beams of 255 mm and 300 mm, comparing the results obtained from GA in our previous research [
10] with the newly conducted results of PSO, SLnO, and CRO in this study.
The error called fitness function was calculated using Equation (
19). In this cost function,
represents the natural frequency of the beam with the actual crack, and
denotes the natural frequency predicted by the algorithms. The variable
n is the number of natural frequencies employed, which was set to three in this experiment. Equation (
20) is a constraint of the optimization problem for cantilever beams, where
L and
h are the total length and height of the cantilever beams, respectively. The
and
a to be estimated are illustrated in
Figure 7.
In the experiment, the parameters of the optimization algorithms were adjusted as shown in
Table 4. The epoch represents the number of iterations, and the population size is the number of candidate solutions used in one iteration. All parameters were determined experimentally, and the optimization was conducted in a Python environment. The complexity of bio-inspired optimization algorithms can be expressed as
, where
N represents the number of epochs,
P denotes the population size, and
f is the time taken to evaluate the fitness function, which varies between different algorithms.
6.1. Damage Detection for 255 mm Cantilever Beam
Experiments were conducted on a cantilever beam with dimensions
mm,
mm, and
mm. The actual damage was located from
mm to
mm with a depth
mm. The results for each optimization algorithm are provided in
Table 5.
6.2. Damage Detection for 300 mm Cantilever Beam
Experiments were conducted on a cantilever beam with dimensions
mm,
mm, and
mm. The actual crack was located from
mm to
mm with a depth
mm. The results for each optimization algorithm are shown in
Table 6.
6.3. Result Analysis
This study demonstrated that bio-inspired optimization algorithms could effectively detect damage in cantilever beams. The learning curves of the optimizers implemented for each cantilever beam are summarized in
Figure 8. As a result of the evaluated algorithms, the swarm-based optimization algorithm, CRO, achieved the lowest average error of 1.65% among other optimization algorithms, which demonstrated the best performance, as shown in
Table 7. It indicates that CRO is highly effective in accurately detecting damage for both crack location and depth in cantilever beams, outperforming other bio-inspired algorithms.


