Article

Nonlinear Dynamics of a General Stochastic SIR Model with Behavioral and Physical Changes: Analysis and Application to Zoonotic Tuberculosis

1
MAIS Laboratory, MAMCS Group, FST Errachidia, Moulay Ismail University of Meknes, P.O. Box 509, Errachidia 52000, Morocco
2
Department of Applied Mathematics, Faculty of Mathematics and Computer, Shahid Bahonar University of Kerman, Kerman 76169-14111, Iran
3
Department of Mathematics, Faculty of Science, King Khalid University, Abha 62529, Saudi Arabia
4
Laboratoire Interdisciplinaire de l’Universite’ Francaise d’Egypte (UFEID Lab), Universite’ Francaise d’Egypte, Cairo 11837, Egypt
5
Department of Mathematics and Engineering Physics, Faculty of Engineering, Mansoura University, Mansoura 35511, Egypt
*
Author to whom correspondence should be addressed.
Mathematics 2024, 12(13), 1974; https://doi.org/10.3390/math12131974
Submission received: 4 June 2024 / Revised: 21 June 2024 / Accepted: 22 June 2024 / Published: 26 June 2024
(This article belongs to the Special Issue Dynamical System and Stochastic Analysis)

Abstract

:
This paper presents a comprehensive nonlinear analysis of an innovative stochastic epidemic model that accounts for both behavioral changes and physical discontinuities. Our research begins with the formulation of a perturbed model, integrating two general incidence functions and incorporating a Lévy measure to account for independent jump components. We start by confirming the well-posed nature of the model, ensuring its mathematical soundness and feasibility for further analysis. Following this, we establish a global threshold criterion that serves to distinguish between the eradication and the persistence of an epidemic. This threshold is crucial for understanding the long-term behavior of a disease within a population. To rigorously validate the accuracy of this threshold, we conducted extensive numerical simulations using estimated data on Zoonotic Tuberculosis in Morocco. These simulations provide practical insights and reinforce the theoretical findings of our study. A notable aspect of our approach is its significant advancement over previous works in the literature. Our model not only offers a more comprehensive framework but also identifies optimal conditions under which an epidemic can be controlled or eradicated.
MSC:
34A12; 92D30; 37C10

1. Introduction

During epidemics, the implementation of intervention measures is paramount in curbing the spread of infectious diseases and reducing their associated morbidity and mortality [1]. These measures encompass a spectrum of interventions ranging from pharmaceutical interventions like vaccination campaigns to non-pharmaceutical interventions such as social distancing measures and the promotion of hygienic practices. While the immediate goal of these interventions is to directly disrupt transmission chains, their indirect impact on the behavior of the susceptible population is equally significant [2]. Behavioral changes induced by intervention measures have emerged as a pivotal aspect in epidemic control strategies. The adoption of preventive behaviors, often prompted by the implementation of intervention measures, can significantly influence the trajectory of an outbreak [3]. For instance, the widespread adoption of mask-wearing during the COVID-19 pandemic and the consistent use of condoms to prevent sexually transmitted infections (STIs) exemplify the behavioral responses elicited by public health interventions.
Recently, in [4], the authors presented a new mathematical model aimed at simulating the dynamics of behavior changes within susceptible populations during epidemics. This innovative model distinguishes between two classes of non-infected individuals: the first comprises susceptible individuals who do not alter their behavior in response to intervention measures, while the second encompasses those who proactively change their behavior and adhere to the prescribed interventions. Central to this model is the recognition of the heterogeneous nature of human behavior in the face of epidemic threats. While some individuals may remain steadfast in their routines and habits, others may demonstrate a heightened awareness of the risks posed by the outbreak and willingly adopt preventive measures [5]. By categorizing susceptible individuals into distinct groups based on their behavioral responses, the model provides a nuanced understanding of how intervention measures influence population dynamics [6]. Key features include behavioral heterogeneity, incorporating fixed- and adaptive-behavior individuals and evaluating various intervention strategies such as public health campaigns, lockdowns, and vaccination drives to assess their impact on both groups [7]. The model dynamically simulates interactions between these groups and the infected population, considering the possibility of behavior change over time, and offers insights into how varying compliance levels with interventions affect epidemic control [8]. Real-world applications of this model include predicting outcomes for diseases like influenza and COVID-19, helping policymakers design targeted strategies to maximize compliance and effectiveness in mitigating infectious disease outbreaks [9].
In addition to incorporating heterogeneity in behavior changes, the authors of [4] also comprehensively addressed the impact of stochastic perturbations within their mathematical model. Stochastic perturbations refer to random fluctuations or disturbances that can influence the dynamics of epidemic transmission, introducing variability and unpredictability into the system. Therefore, the model under discussion is structured as follows:
d S 1 ( t ) = r β 1 S 1 ( t ) I ( t ) ( u + c ) S 1 ( t ) d t + κ 1 S 1 ( t ) d ρ 1 ( t ) , d S 2 ( t ) = c S 1 ( t ) β 2 S 2 ( t ) I ( t ) u S 2 ( t ) d t + κ 2 S 2 ( t ) d ρ 2 ( t ) , d I ( t ) = ( β 1 S 1 ( t ) I ( t ) + β 2 S 2 ( t ) I ( t ) ( u + h 1 + h 2 ) I ( t ) d t + κ 3 I ( t ) d ρ 3 ( t ) , d C ( t ) = h 1 I ( t ) u C ( t ) d t + κ 4 C ( t ) d ρ 4 ( t ) .
According to model (1), the variables are defined as follows:
  • S 1 denotes the susceptible individuals who maintain their behavior unchanged in response to the epidemic.
  • S 2 represents the susceptible individuals who alter their behavior due to various interventions, such as media campaigns or governmental measures.
  • I signifies the count of infected individuals within the population.
  • C stands for the individuals who have recovered from the infection and acquired complete immunity.
In addition, the model parameters can be defined as follows:
  • r represents the rate of population influx, encompassing births, immigration, or any other form of population input.
  • β 1 and β 2 indicate the transmission rates of the epidemic, reflecting the likelihood of infection spread within the population.
  • μ represents the natural death rate of the population.
  • c signifies the rate at which susceptible individuals adjust their behavior and transition to the second class.
  • h 1 denotes the recovery rate of infected individuals.
  • h 2 represents the mortality rate attributed to infection.
In incorporating the stochastic component into the model, ρ 1 ( t ) , ρ 2 ( t ) , ρ 3 ( t ) , ρ 4 ( t ) represents a four-dimensional Brownian motion with specific intensities κ 1 , κ 2 , κ 3 , and κ 4 . A diagram depicting the flow dynamics among different classes is shown in Figure 1. In [4], the authors investigated the long-term characteristics of the solution by establishing adequate conditions for extinction and stationarity.
When discussing heterogeneity and variability, it is imperative to incorporate more realistic and generalized hypotheses. The study outlined in [4] has certain limitations as the authors employed a bilinear incidence rate and solely relied on white noise. However, in reality, interactions between individuals often deviate from the mass action principle, leading to nonlinear incidences that can assume various forms. In this study, we address this limitation by considering a broader spectrum of incidence rates that encompass diverse functions documented in the literature.
Stochastic epidemic models are crucial in biological mathematics because they capture the inherent randomness in disease transmission and progression, offering a realistic representation of epidemics. These models are particularly valuable in small populations where stochastic effects can significantly alter outcomes, explaining the variability and uncertainty in outbreak dynamics [10,11]. They incorporate complex biological processes and rare events, enhancing our understanding of disease behavior and the impact of interventions. In quantifying uncertainty and allowing for real-time data integration, stochastic models facilitate adaptive and robust epidemic management strategies. Additionally, they provide theoretical insights into disease dynamics and advance mathematical techniques, enriching the broader field of biological mathematics.
Generally, white noise fails to adequately simulate reality, particularly when interventions are implemented. Interventions can trigger abrupt jumps in the population, significantly altering the model dynamics [12]. Therefore, in this study, we extended our analysis to incorporate multidimensional jump processes, providing a more nuanced understanding of how interventions impact epidemic dynamics. By considering these factors, we aimed to enhance the realism and applicability of the model, enabling a more comprehensive exploration of epidemic dynamics in real-world scenarios [13,14]. Consequently, the system under consideration evolves through an interconnected perturbed formulation, presenting a holistic and sophisticated framework. The new formulation captures the complexities of sudden changes in population behaviors and disease transmission rates due to interventions such as vaccinations, quarantines, and public health policies. By integrating multidimensional jump processes, the model can account for both small fluctuations and significant shocks to the system, reflecting the stochastic nature of real-world epidemic events more accurately [15,16]. In particular, the inclusion of jump processes allows for the representation of non-continuous changes in state variables, which are critical for modeling events like sudden outbreaks or the rapid implementation of control measures. This approach provides a more flexible and detailed depiction of epidemic dynamics, accommodating the unpredictable and often abrupt nature of real-world events.
Technically, our newly introduced stochastic system diverges from conventional models by eschewing clearly delineated endemic or disease-free states [17]. Furthermore, our model exhibits independence in its stochastic component, adding a distinct dimension to the analysis. This independence characteristic enhances the depth and complexity of the analysis, providing unique insights into the system dynamics. Consequently, the conventional method of assessing disease persistence or extinction through the analysis of asymptotic behavior around these states falls short [18]. This underscores the imperative for an innovative approach grounded in stochastic analysis, which is adept at capturing the dynamic interactions among variables and uncertainties inherent in the system. This paper addresses the aforementioned issues and focuses on specific long-term properties of auxiliary equations. These properties play a crucial role in establishing the global threshold of our model.
The structure of this paper is organized as follows. Section 2 introduces the model formulation, accompanied by a detailed compilation of notations and hypotheses. In Section 3, we present the theoretical results, beginning with the verification of the model’s well-posedness and outlining the global threshold that differentiates between epidemic extinction and persistence. Section 4 is devoted to conducting numerical simulations to rigorously validate our theoretical findings. Finally, we conclude with a summary of our key results and provide insights into potential future research directions in Section 5.

2. Model Formulation

In this section, we present the stochastic version of the behavioral model (1) with general incidence rates. The incorporation of stochastic components into the model is conducted by adding noise terms proportionally to each equation, ensuring that these stochastic perturbations maintain the independence property. This stochastic framework allows us to capture the inherent randomness and unpredictability in individual behaviors and disease transmission dynamics that deterministic models may overlook. By introducing stochasticity, we can better understand the variability and potential fluctuations in epidemic outcomes under different scenarios. Under this setting, we consider the following stochastic model:
d S 1 ( t ) = r f 1 S 1 ( t ) , I ( t ) I ( t ) ( u + c ) S 1 ( t ) d t + κ 1 S 1 ( t ) d ρ 1 ( t ) + R 4 { 0 } z 1 ( ξ ) S 1 ( t ) ϕ ˜ 1 ( d t , d ξ ) , d S 2 ( t ) = c S 1 ( t ) f 2 S 2 ( t ) , I ( t ) I ( t ) u S 2 ( t ) d t + κ 2 S 2 ( t ) d ρ 2 ( t ) + R 4 { 0 } z 2 ( ξ ) S 2 ( t ) ϕ ˜ 2 ( d t , d ξ ) , d I ( t ) = f 1 S 1 ( t ) , I ( t ) + f 2 S 2 ( t ) , I ( t ) I ( t ) ( u + h 1 + h 2 ) I ( t ) d t + κ 3 I ( t ) d ρ 3 ( t ) + R 4 { 0 } z 3 ( ξ ) I ( t ) ϕ ˜ 3 ( d t , d ξ ) , d C ( t ) = h 1 I ( t ) u C ( t ) d t + κ 4 C ( t ) d ρ 4 ( t ) + R 4 { 0 } z 4 ( ξ ) C ( t ) ϕ ˜ 4 ( d t , d ξ ) .
where, f 1 and f 2 represent two general incidence rates that satisfy the following hypotheses:
  • (A0): The functions f 1 and f 2 are uniformly continuous and m , m 0 > 0 such that
    m f 1 S 1 ( S 1 , I ) 0 f 1 I ( S 1 , I ) m 0 , m f 2 S 2 ( S 2 , I ) 0 f 2 I ( S 2 , I ) m 0 .
The functions f 1 and f 2 represent two general incidence rates within the model, encapsulating the rates at which susceptible individuals become infected under varying conditions. The function f 1 corresponds to the incidence rate for the group of susceptible individuals who do not alter their behavior in response to intervention measures. This rate reflects the direct transmission dynamics between the non-compliant susceptible individuals and the infected population. Conversely, f 2 pertains to the incidence rate for the group of susceptible individuals who proactively change their behavior and adhere to intervention measures. This rate incorporates the effects of preventive actions, such as social distancing, mask-wearing, and other protective behaviors that reduce the probability of infection. In model (2), ρ k ( k = 1 , , 4 ) denote four mutually independent Brownian motions (BMs) of strengths κ k > 0 ( k = 1 , , 4 ) respectively. All these BMs are essentially defined on a filtered probability triple (stochastic basis) Ω , F Ω , ( F { Ω , t } ) t 0 , P equipped with a filtration satisfying the usual criteria. ϕ k ( k = 1 , , 4 ) are four independent Poisson counting processes associated with four finite characteristic Lévy measures G k ( k = 1 , , 4 ) . ϕ ˜ k ( k = 1 , , 4 ) are four different compensated random measures such that ϕ ˜ k ( d t , d ξ ) = ϕ k ( d t , d ξ ) G k ( d ξ ) d t . Finally, z k : R 4 { 0 } R are the jump size functions, which are postulated to be continuous on R 4 { 0 } .
Prior to exploring the theoretical framework concerning our perturbed model represented by system (2), it is essential to introduce the following notations:
  • α 1 : = max k { 1 , , 4 } R 4 { 0 } z k 2 ( ξ ) G k ( d ξ ) .
  • α 2 : = max k { 1 , , 4 } R 4 { 0 } z k ( ξ ) ln 1 + z k ( ξ ) G k ( d ξ ) .
  • α 3 : = max k { 1 , , 4 } κ k 2 .
  • α 4 ( ξ ) : = max k { 1 , , 4 } z k ( ξ ) = z ϵ * ( ξ ) , where ϵ * indicates the index at which the maximum value is reached.
  • α 5 ( ξ ) : = min k { 1 , , 4 } z k ( ξ ) = z ϵ ¯ ( ξ ) , where ϵ ¯ indicates the index at which the minimum value is reached.
  • α 6 ( ξ ) : = 1 + α 4 ( ξ ) s s × α 4 ( ξ ) 1 .
  • α 7 ( ξ ) : = 1 + α 5 ( ξ ) s s × α 5 ( ξ ) 1 .
  • α 8 ( ξ ) : = max α 6 ( ξ ) , α 7 ( ξ ) .
  • α 9 : = R 4 { 0 } α 8 ( ξ ) 1 α 6 ( ξ ) α 7 ( ξ ) G ϵ * ( d ξ ) + R 4 { 0 } α 8 ( ξ ) 1 α 7 ( ξ ) > α 6 ( ξ ) G ϵ ¯ ( d ξ ) .
In addition, to maintain a meticulous balance between mathematical precision and biological relevance within the envisioned model, we present the following technical assumptions:
  • ( A 1 ) : z k ( ξ ) + 1 are positive k { 1 , , 4 } , and max i { 1 , 2 } α i < .
  • ( A 2 ) : s > 2 such that α 10 = u 0.5 ( s 1 ) α 3 s 1 α 9 > 0 .
Remark 1.
Incidence rates account for the frequency and type of contacts between individuals, which are critical for disease transmission. Different diseases spread through different types of contact (e.g., respiratory droplets, direct physical contact), and general incidence rates help model these specific pathways accurately.
Remark 2.
To illuminate the significance of (A2), it is important to reference the insights provided in [14] (Lemma 2.5). In this study, the authors elaborate on key perspectives that underpin the core findings of our research. By building upon the framework established in this lemma, we establish a robust link between the foundational concepts outlined therein and the overarching conclusions drawn from our investigation.
Remark 3.
Differing from the results detailed in [13], our research introduces more sophisticated hypotheses and a nuanced framework. In particular, incorporating (A1) and (A2) enriches the accuracy and complexity of our analysis. Within this section, we operate under the hypothesis that all of the above assumptions are valid.

3. Results

3.1. Evaluating the Mathematical Sufficiency of Stochastic System (2)

The main concern when examining an epidemic model is to ascertain if it has a unique and positive global solution over time. In this subsection, we will clarify specific conditions that ensure the existence of such a solution. We can represent the solution associated with initial data s ( 0 ) = S 1 ( 0 ) , S 2 ( 0 ) , I ( 0 ) , C ( 0 ) as s ( t ) = S 1 ( t ) , S 2 ( t ) , I ( t ) , C ( t ) .
Theorem 1.
Under (A0) and (A1), we assert that for any initial data s ( 0 ) , there exists a unique solution s ( t ) to system (2) for t 0 . This solution remains non-negative with near certainty for all time instances t 0 .
Proof. 
In system (2), the coefficients involved demonstrate continuous differentiability within their defined domains, meeting the local Lipschitz criterion. As a result, for any initial solution s ( 0 ) within the positive real four-dimensional space ( R + 4 ), there exists a single maximal local solution s ( t ) defined for t within the interval 0 , γ e , where γ e signifies the explosion time [19]. At this point, our aim is to ascertain the global characteristic of this solution, particularly to prove that γ e = with near certainty. To achieve this, let us take into account a suitably large natural number β 0 N such that s ( 0 ) [ β 0 1 , β 0 ] . For every integer β β 0 , we define the stopping time γ k as follows:
γ k = inf t 0 , γ e min S 1 ( t ) , S 2 ( t ) , I ( t ) , C ( t ) β 1 or max S 1 ( t ) , S 2 ( t ) , I ( t ) , C ( t ) β .
Let γ be defined as the limit of γ β as β tends to infinity. It is clear that the sequence γ β β β 0 is strictly increasing. Hence, the limit of γ k as k tends to infinity equals the supremum of γ β for β β 0 . According to the theory presented in [20], which states that the supremum of a sequence of stopping times is itself a stopping time, we conclude that γ is also a stopping time. Using the convention inf = throughout this paper, we can assert straightforwardly that γ γ e almost surely. Therefore, establishing γ e = almost surely directly depends on demonstrating that γ = almost surely. This precisely forms the objective we aim to achieve to conclude the proof. Now, let us assume that the assertion γ = almost surely is incorrect. This implies the existence of a positive value D > 0 such that P γ D > 0 . Consequently, there exists a positive x > 0 such that
P γ β D > x , β β 0 .
Examine the C 2 function F defined for s t R + 4 as follows:
F s = S 1 q q ln S 1 q 1 + S 2 q q ln S 2 q 1 + I 1 ln ( I ) .
Here, q denotes a positive constant to be selected meticulously at a subsequent stage. By employing Ito’s multidimensional formula for F ( s ( t ) ) , we obtain expressions applicable for all β β 0 and t 0 , γ β :
d F s ( t ) = L F s d t + κ 1 S 1 ( t ) q d ρ 1 ( t ) + κ 2 S 2 ( t ) q d ρ 2 ( t ) + κ 3 I ( t ) 1 d ρ 3 ( t ) + k = 1 2 R 4 { 0 } z k ( ξ ) S k ( t ) q ln 1 + z k ( ξ ) ϕ ˜ k ( d t , d ξ ) + R 4 { 0 } z 3 ( ξ ) I ( t ) ln 1 + z 3 ( ξ ) ϕ ˜ 3 ( d t , d ξ ) ,
where
L F s ( t ) = 1 q S 1 ( t ) r f 1 S 1 ( t ) , I ( t ) I ( t ) ( u + c ) S 1 ( t ) + 1 q S 2 ( t ) c S 1 ( t ) f 2 S 2 ( t ) , I ( t ) I ( t ) u S 2 ( t ) + 1 1 I ( t ) f 1 S 1 ( t ) , I ( t ) + f 2 S 2 ( t ) , I ( t ) I ( t ) ( u + h 1 + h 2 ) I ( t ) + 0.5 q κ 1 2 + q κ 2 2 + κ 3 2 + q k = 1 2 R 4 { 0 } z k ( ξ ) ln 1 + z k ( ξ ) f k ( d ξ ) + R 4 { 0 } z 3 ( ξ ) ln 1 + z 3 ( ξ ) G 3 ( d ξ ) .
Then,
L F s ( t ) r u I ( t ) + S 2 ( t ) + S 1 ( t ) ( h 1 + h 2 ) I ( t ) q r S 1 ( t ) q ( u + c ) q f 1 S 1 ( t ) , I ( t ) S 1 ( t ) I ( t ) q c S 1 ( t ) S 2 ( t ) u f 2 S 2 ( t ) , I ( t ) ) S 2 ( t ) I ( t ) f 1 S 1 ( t ) , I ( t ) + f 2 S 2 ( t ) , I ( t ) ( u + h 1 + h 2 ) + C ¯ .
Here, C ¯ = 0.5 q κ 1 2 + q κ 2 2 + κ 3 2 + ( 2 q + 1 ) α 2 . Then,
L F s ( t ) r + q ( u + c ) + q u + ( u + h 1 + h 2 ) + C ¯ + q f 1 ( S 1 ( t ) , I ( t ) ) S 1 ( t ) + f 2 ( S 2 ( t ) , I ( t ) ) S 2 ( t ) ( u + h 1 + h 2 ) × I ( t ) Λ + ( 2 q + 1 ) u + h + C ¯ D ¯ + 2 m q by ( A 0 ) ( u + h 1 + h 2 ) × I ( t ) .
Let us choose m such that 2 m q ( u + h 1 + h 2 ) < 0 . Then, for each β β 0 and t 0 , γ β , we obtain
d F s ( t ) D ¯ d t + κ 1 S 1 ( t ) q d ρ 1 ( t ) + κ 2 S 2 ( t ) q d ρ 2 ( t ) + κ 3 I ( t ) 1 d ρ 3 ( t ) + k = 1 2 R 4 { 0 } z k ( ξ ) S k ( t ) q ln 1 + z k ( ξ ) ϕ ˜ k ( d t , d ξ ) + R 4 { 0 } z 3 ( ξ ) I ( t ) ln 1 + z 3 ( ξ ) ϕ ˜ 3 ( d t , d ξ ) .
So,
E F ( s ( D γ β ) F ( s ( 0 ) ) + D ¯ E γ k T F ( s ( 0 ) ) + D ¯ T .
Since F ( ϵ ) 0 is true for all ϵ > 0 , the following implication arises:
E F ( s ( D γ β ) = E F ( s ( D γ β ) × 1 { γ β D } + E F ( s ( t γ β ) × 1 { γ β > D } E F ( s ( γ β ) × 1 { γ β D } .
We Observe that for any ω Ω that verifies γ β ( ω ) D , there exists a component of F s ( γ β ) equal to either β or β 1 ; thus,
E F ( s ( γ β ) × 1 { γ β D } P γ β D β q q ln β q 1 β 1 q q ln β 1 q 1 β 1 ln β β 1 1 ln β 1 .
By amalgamating (5), (6), and (7) with (4), we deduce that
F s ( 0 ) + D ¯ D x β q q ln β q 1 β 1 q q ln β 1 q 1 β 1 ln β β 1 1 ln β 1 .
Letting β tend toward infinity leads to the contradiction F s ( 0 ) + D ¯ D = , thus concluding the proof. □

3.2. Threshold Analysis of Stochastic System (2)

When exploring a mathematical model depicting the spread of a particular epidemic, our main focus is to determine whether the outbreak will eventually diminish or endure indefinitely. In this subsection, our goal is to reveal conditions that are both sufficiently rigorous and almost indispensable, shedding light on the asymptotic behavior of the epidemic’s progression.
Before introducing the central theorem of this subsection, it is wise to begin a discourse on pertinent lemmas concerning an auxiliary subsystem derived from the initial two equations of (2). This additional subsystem becomes relevant when the population of infectious individuals is conspicuously absent from the context. Let us examine the following two novel stochastic processes:
d S ¯ 1 ( t ) = r ( u + c ) S ¯ 1 ( t ) d t + κ 1 S ¯ 1 ( t ) d ρ 1 ( t ) + R 4 { 0 } z 1 ( ξ ) S ¯ 1 ( t ) ϕ ˜ 1 ( d t , d ξ ) , d S ¯ 2 ( t ) = c S ¯ 1 ( t ) u S ¯ 2 ( t ) d t + κ 2 S ¯ 2 ( t ) d ρ 2 ( t ) + R 4 { 0 } z 2 ( ξ ) S ¯ 2 ( t ) ϕ ˜ 2 ( d t , d ξ ) ,
with positive started data S ¯ 1 ( 0 ) = S 1 ( 0 ) and S ¯ 2 ( 0 ) = S 2 ( 0 ) .
Lemma 1.
Stochastic system (8) is well-posed; and if
( u + c ) 0.5 κ 1 2 R 4 { 0 } z 1 ( ξ ) ln 1 + z 1 ( ξ ) G 1 ( d ξ ) > 0 ,
then for any two integrable functions ψ 1 and ψ 2 , we have
P lim t 1 t 0 t ψ 1 S ¯ 1 ( ϵ ) d ϵ = ( 0 , ) ψ 1 ( ϵ ) π 1 ( d ϵ ) = 1 , P lim t 1 t 0 t ψ 2 S ¯ 2 ( ϵ ) d ϵ = ( 0 , ) ψ 2 ( ϵ ) π 2 ( d ϵ ) = 1 ,
where π 1 and π 2 are the single stationary distributions of S ¯ 1 and S ¯ 2 , respectively.
Remark 4.
For an in-depth understanding of the proof for the above result, refer to Lemma 2.2 in [21]. The importance of considering (9) is elucidated in Lemma 2.4 of [13].
Lemma 2.
Assuming that condition (1) holds true, we deduce
P ( 0 , ) f 1 ( S 1 , 0 ) π 1 ( d S 1 ) m ( 0 , ) S 1 π 1 ( d S 1 ) = r u < = 1 , P ( 0 , ) f 2 ( S 2 , 0 ) π 2 ( d S 2 ) m ( 0 , ) S 2 π 2 ( d S 2 ) = c r ( u + c ) u < = 1 .
Proof. 
Drawing from ( A 0 ) , (10), and the ergodicity of processes S ¯ 1 and S ¯ 2 , we can readily deduce the outcome of this lemma. □
When it comes to managing infectious diseases, a critical factor is determining a stochastic threshold that effectively distinguishes between the precarious brink of extinction and the resilient state of persistence for the infection. This threshold plays a crucial role, illuminating the complex dynamics that dictate the fate of the pathogen within a specific population. In this regard, by setting
λ 1 = ( 0 , ) f 1 ( S 1 , 0 ) π 1 ( d S 1 ) + ( 0 , ) f 2 ( S 2 , 0 ) π 2 ( d S 2 ) , λ 2 = ( u + h 1 + h 2 ) + 0.5 κ 3 2 + R 4 { 0 } z 3 ( ξ ) ln 1 + z 3 ( ξ ) G 3 ( d ξ ) ,
we have the following main theorem.
Theorem 2.
Consider s ( t ) as the solution to system (2) with initial data s ( 0 ) R + 4 . Then, we encounter two distinct real epidemic scenarios:
  • The exponential extinction of the epidemic if λ 1 < λ 2 .
  • The stochastic continuation of the epidemic if λ 1 > λ 2 .
Proof. 
Using Itô’s formula, we obtain the following equation:
d ln I ( t ) = k = 1 2 f k S k ( t ) , I ( t ) λ 2 d t + κ 3 d ρ 3 ( t ) + R 4 { 0 } ln 1 + z 3 ( ξ ) ϕ ˜ 3 ( d t , d ξ ) .
From ( A 0 ) , system (8), and the stochastic comparison theorem, we obtain
d ln I ( t ) k = 1 2 f k S k ( t ) , 0 λ 2 d t + κ 3 d ρ 3 ( t ) + R 4 { 0 } ln 1 + z 3 ( ξ ) ϕ ˜ 3 ( d t , d ξ ) k = 1 2 f k S ¯ k ( t ) , 0 λ 2 d t + κ 3 d ρ 3 ( t ) + R 4 { 0 } ln 1 + z 3 ( ξ ) ϕ ˜ 3 ( d t , d ξ ) .
After integrating and then dividing both sides of the last inequality by t, we obtain
1 t ln I ( t ) ln I ( 0 ) 1 t k = 1 2 0 t f k S ¯ k ( ϵ ) , 0 d ϵ λ 2 + A 1 ( t ) ,
where A 1 ( t ) = κ 3 t ρ 3 ( t ) + 1 t 0 t R 4 { 0 } ln 1 + z 3 u ϕ ˜ 3 ( d s , d ξ ) . In applying Kunita’s inequality [22] to the discontinuous stochastic processes A 1 and leveraging Lemma 2.2 of [23], it is straightforward to derive that P lim t A 1 ( t ) = 0 = 1 . Consequently, from Lemma 1, we deduce that
lim sup t 1 t ln I ( t ) lim t 1 t 0 t f 1 S ¯ 1 ( ϵ ) , 0 d ϵ + lim t 1 t 0 t f 2 S ¯ 2 ( ϵ ) , 0 d ϵ λ 2 = ( 0 , ) f 1 ( S 1 , 0 ) π 1 ( d S 1 ) + ( 0 , ) f 2 ( S 2 , 0 ) π 2 ( d S 2 ) λ 2 = λ 1 λ 2 .
In the concept of the exponential extinction of the epidemic [19], a crucial factor is the value of λ 1 λ 2 . When this quantity is negative, it indicates a critical condition that leads to the disappearance of the epidemic.
Now, we shift our focus to the second scenario. To do so, let us define s ˜ ( t ) = ( S 1 , S 2 , I , S ¯ 1 , S ¯ 2 ) and introduce the following function:
F 1 s ˜ ( t ) = m u k = 1 2 S ¯ k S k I ln ( I ) .
Leveraging Itô’s formula in conjunction with the dynamics described by systems (2) and (8), we obtain
d F 1 s ˜ ( t ) = L F 1 s ˜ ( t ) d t + k = 1 2 m κ k u S ¯ k ( t ) S k ( t ) d ρ k ( t ) κ 3 1 + m u I ( t ) d ρ 3 ( t ) + m u k = 1 2 R 4 { 0 } z k ( ξ ) S ¯ k ( t ) S k ( t ) ϕ ˜ k ( d t , d ξ ) m u R 4 { 0 } z 3 u I ( t ) ϕ ˜ 3 ( d t , d ξ ) R 4 { 0 } ln 1 + z 3 ( ξ ) ϕ ˜ 3 ( d t , d ξ ) ,
where
L F 1 s ˜ ( t ) = λ 2 k = 1 2 f k S k ( t ) , I ( t ) m k = 1 2 S ¯ k ( t ) S k ( t ) + m u ( u + h 1 + h 2 ) I ( t ) .
As a result, we have
L F 1 s ˜ ( t ) λ 2 k = 1 2 f k S ¯ k ( t ) , 0 + k = 1 2 f k S k ( t ) , 0 f k S k ( t ) , I ( t ) + k = 1 2 f k S ¯ k ( t ) , 0 f k S k ( t ) , 0 m k = 1 2 S ¯ k ( t ) S k ( t ) + m u ( u + h 1 + h 2 ) I ( t ) .
Using ( A 0 ) , we can easily obtain that
L F 1 s ˜ ( t ) λ 2 λ 1 + k = 1 2 ( 0 , ) f k ( S k , 0 ) π k ( d S k ) f k S ¯ k ( t ) , 0 + k = 1 2 f k S k ( t ) , 0 f k S k ( t ) , I ( t ) + m u ( u + h 1 + h 2 ) I ( t ) .
From Equation (12), we have
d F 1 s ˜ ( t ) ( λ 2 λ 1 + k = 1 2 ( 0 , ) f k ( S k , 0 ) π k ( d S k ) f k S ¯ k ( t ) , 0 + k = 1 2 f k S k ( t ) , 0 f k S k ( t ) , I ( t ) + m u ( u + h 1 + h 2 ) I ( t ) ) d t + k = 1 2 m κ k u S ¯ k ( t ) S k ( t ) d ρ k ( t ) κ 3 1 + m u I ( t ) d ρ 3 ( t ) + m u k = 1 2 R 4 { 0 } z k ( ξ ) S ¯ k ( t ) S k ( t ) ϕ ˜ k ( d t , d ξ ) m u R 4 { 0 } z 3 u I ( t ) ϕ ˜ 3 ( d t , d ξ ) R 4 { 0 } ln 1 + z 3 ( ξ ) ϕ ˜ 3 ( d t , d ξ ) .
Upon integrating the last inequality and subsequently dividing both sides of the last inequality by t, we obtain
F 1 s ˜ ( t ) t λ 2 λ 1 + k = 1 2 ( 0 , ) f k ( S k , 0 ) π k ( d S k ) 1 t 0 t f k S ¯ k ( s ) , 0 d s + k = 1 2 1 t 0 t f k S k ( s ) , 0 f k S k ( s ) , I ( s ) d s + m ( u + h 1 + h 2 ) u t 0 t I ( s ) d s + k = 1 2 m κ k u t 0 t S ¯ k ( s ) S k ( s ) d ρ k ( s ) κ 3 t 0 t 1 + m u I ( s ) d ρ 3 ( s ) + m u t k = 1 2 0 t R 4 { 0 } z k ( ξ ) S ¯ k ( s ) S k ( s ) ϕ ˜ k ( d s , d ξ ) + F 1 s ˜ ( 0 ) t m u t 0 t R 4 { 0 } z 3 u I ( s ) ϕ ˜ 3 ( d s , d ξ ) 1 t 0 t R 4 { 0 } ln 1 + z 3 ( ξ ) ϕ ˜ 3 ( d s , d ξ ) .
Using the properties of logarithm function, we obtain
m ( u + h 1 + h 2 ) u t 0 t I ( s ) d s λ 1 λ 2 + m u t k = 1 2 S ¯ k ( t ) S k ( t ) I ( t ) I ( t ) t k = 1 2 ( 0 , ) f k ( S k , 0 ) π k ( d S k ) 1 t 0 t f k S ¯ k ( s ) , 0 d s k = 1 2 1 t 0 t f k S k ( s ) , 0 f k S k ( s ) , I ( s ) d s k = 1 2 m κ k u t 0 t S ¯ k ( s ) S k ( s ) d ρ k ( s ) + κ 3 t 0 t 1 + m u I ( s ) d ρ 3 ( s ) m u t k = 1 2 0 t R 4 { 0 } z k ( ξ ) S ¯ k ( s ) S k ( s ) ϕ ˜ k ( d s , d ξ ) F 1 s ˜ ( 0 ) t + m u t 0 t R 4 { 0 } z 3 u I ( s ) ϕ ˜ 3 ( d s , d ξ ) + 1 t 0 t R 4 { 0 } ln 1 + z 3 ( ξ ) ϕ ˜ 3 ( d s , d ξ ) .
From ( A 0 ) , we derive
m ( u + h 1 + h 2 ) u t 0 t I ( s ) d s λ 1 λ 2 + m u t k = 1 2 S ¯ k ( t ) S k ( t ) I ( t ) I ( t ) t k = 1 2 ( 0 , ) f k ( S k , 0 ) π k ( d S k ) 1 t 0 t f k S ¯ k ( s ) , 0 d s 2 m 0 t 0 t I ( s ) d s k = 1 2 m κ k u t 0 t S ¯ k ( s ) S k ( s ) d ρ k ( s ) + κ 3 t 0 t 1 + m u I ( s ) d ρ 3 ( s ) m u t k = 1 2 0 t R 4 { 0 } z k ( ξ ) S ¯ k ( s ) S k ( s ) ϕ ˜ k ( d s , d ξ ) F 1 s ˜ ( 0 ) t + m u t 0 t R 4 { 0 } z 3 u I ( s ) ϕ ˜ 3 ( d s , d ξ ) + 1 t 0 t R 4 { 0 } ln 1 + z 3 ( ξ ) ϕ ˜ 3 ( d s , d ξ ) .
Consequently,
m ( u + h 1 + h 2 ) + 2 ( u + c ) m 0 u t 0 t I ( s ) d s λ 1 λ 2 + A 2 ( t ) + A 3 ( t ) + A 4 ( t ) ,
where
A 2 ( t ) = m u t k = 1 2 S ¯ k ( t ) S k ( t ) I ( t ) I ( t ) t , A 3 ( t ) = k = 1 2 ( 0 , ) f k ( S k , 0 ) π k ( d S k ) 1 t 0 t f k S ¯ k ( s ) , 0 d s , A 4 ( t ) = k = 1 2 m κ k u t 0 t S ¯ k ( s ) S k ( s ) d ρ k ( s ) + κ 3 t 0 t 1 + m u I ( s ) d ρ 3 ( s ) m u t k = 1 2 0 t R 4 { 0 } z k ( ξ ) S ¯ k ( s ) S k ( s ) ϕ ˜ k ( d s , d ξ ) F 1 s ˜ ( 0 ) t + m u t 0 t R 4 { 0 } z 3 u I ( s ) ϕ ˜ 3 ( d s , d ξ ) + 1 t 0 t R 4 { 0 } ln 1 + z 3 ( ξ ) ϕ ˜ 3 ( d s , d ξ ) .
Considering ( A 0 ) and leveraging Lemma 1, we can firmly establish that P lim t A 2 ( t ) = 0 = 1 . Furthermore, the application of Lemma 2.2 from [23] enables a straightforward deduction that P lim t A 3 ( t ) = 0 = 1 and P lim t A 4 ( t ) = 0 = 1 . Then,
P lim inf t 1 t 0 t I ( s ) d s u ( λ 1 λ 2 ) m ( u + h 1 + h 2 ) + 2 ( u + c ) m 0 = 1 .
In scenarios where λ 1 exceeds λ 2 , the persistence of the epidemic in the future becomes more pronounced. This concludes the demonstration of the theorem. □

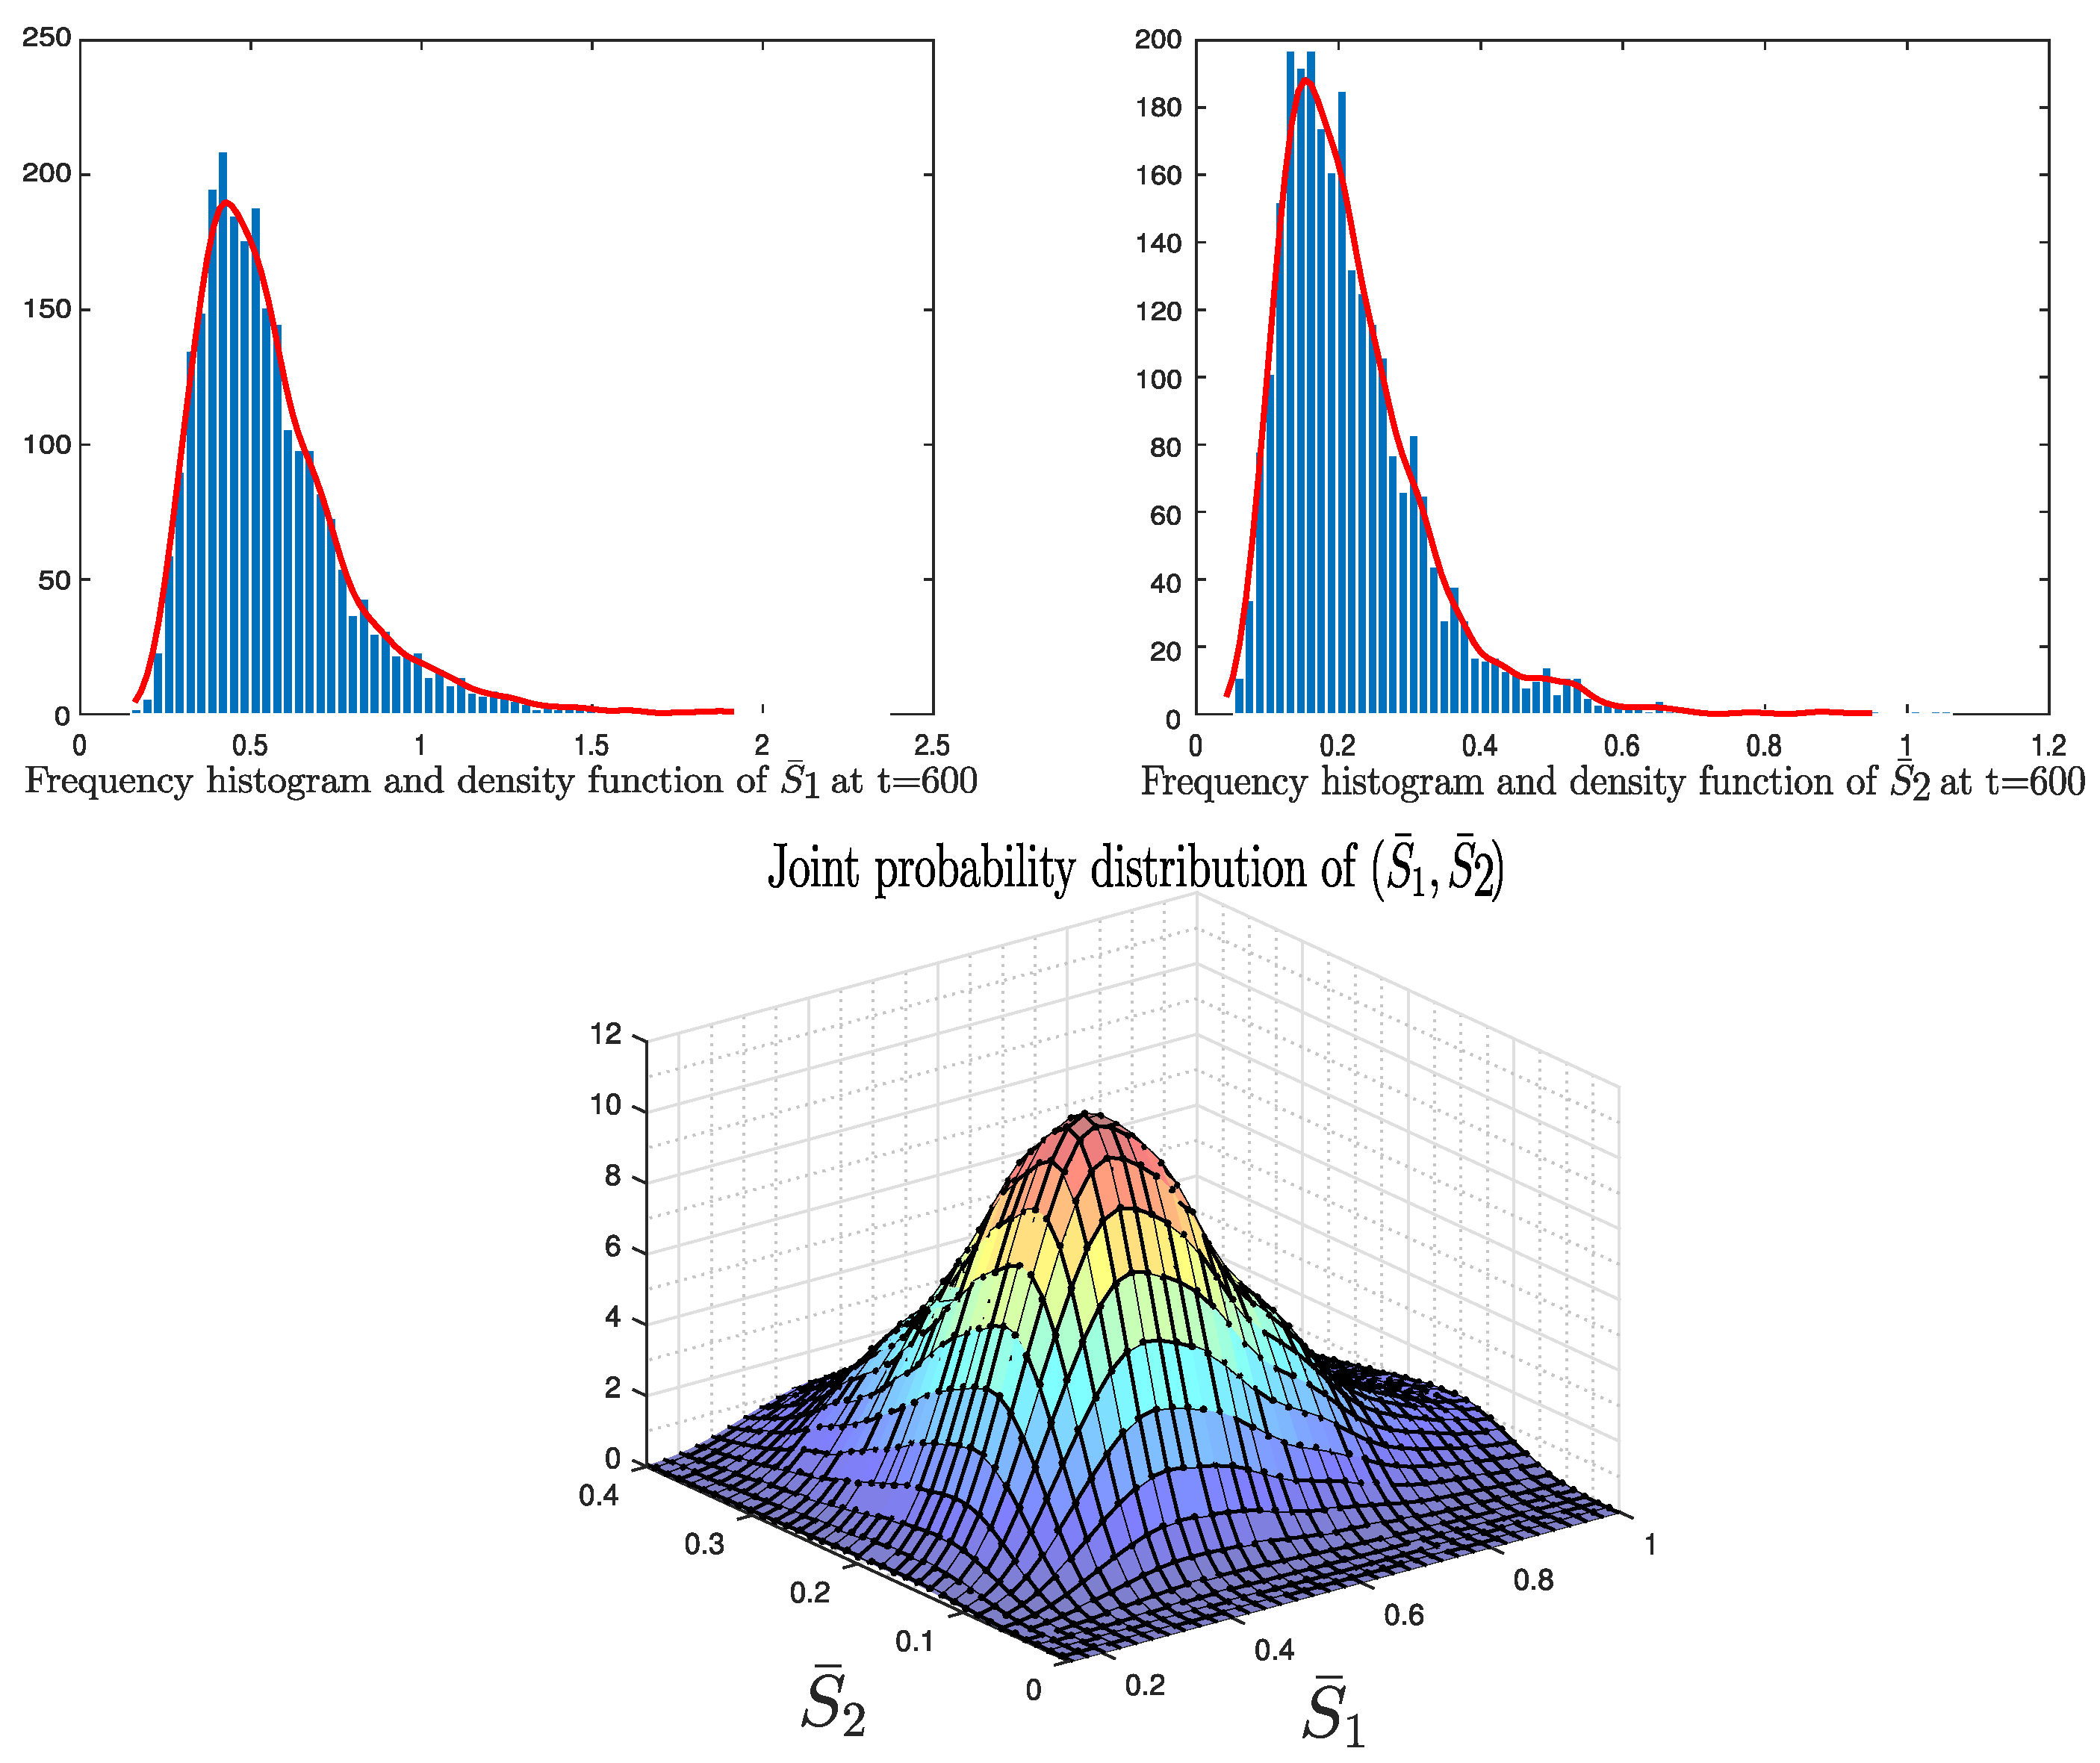
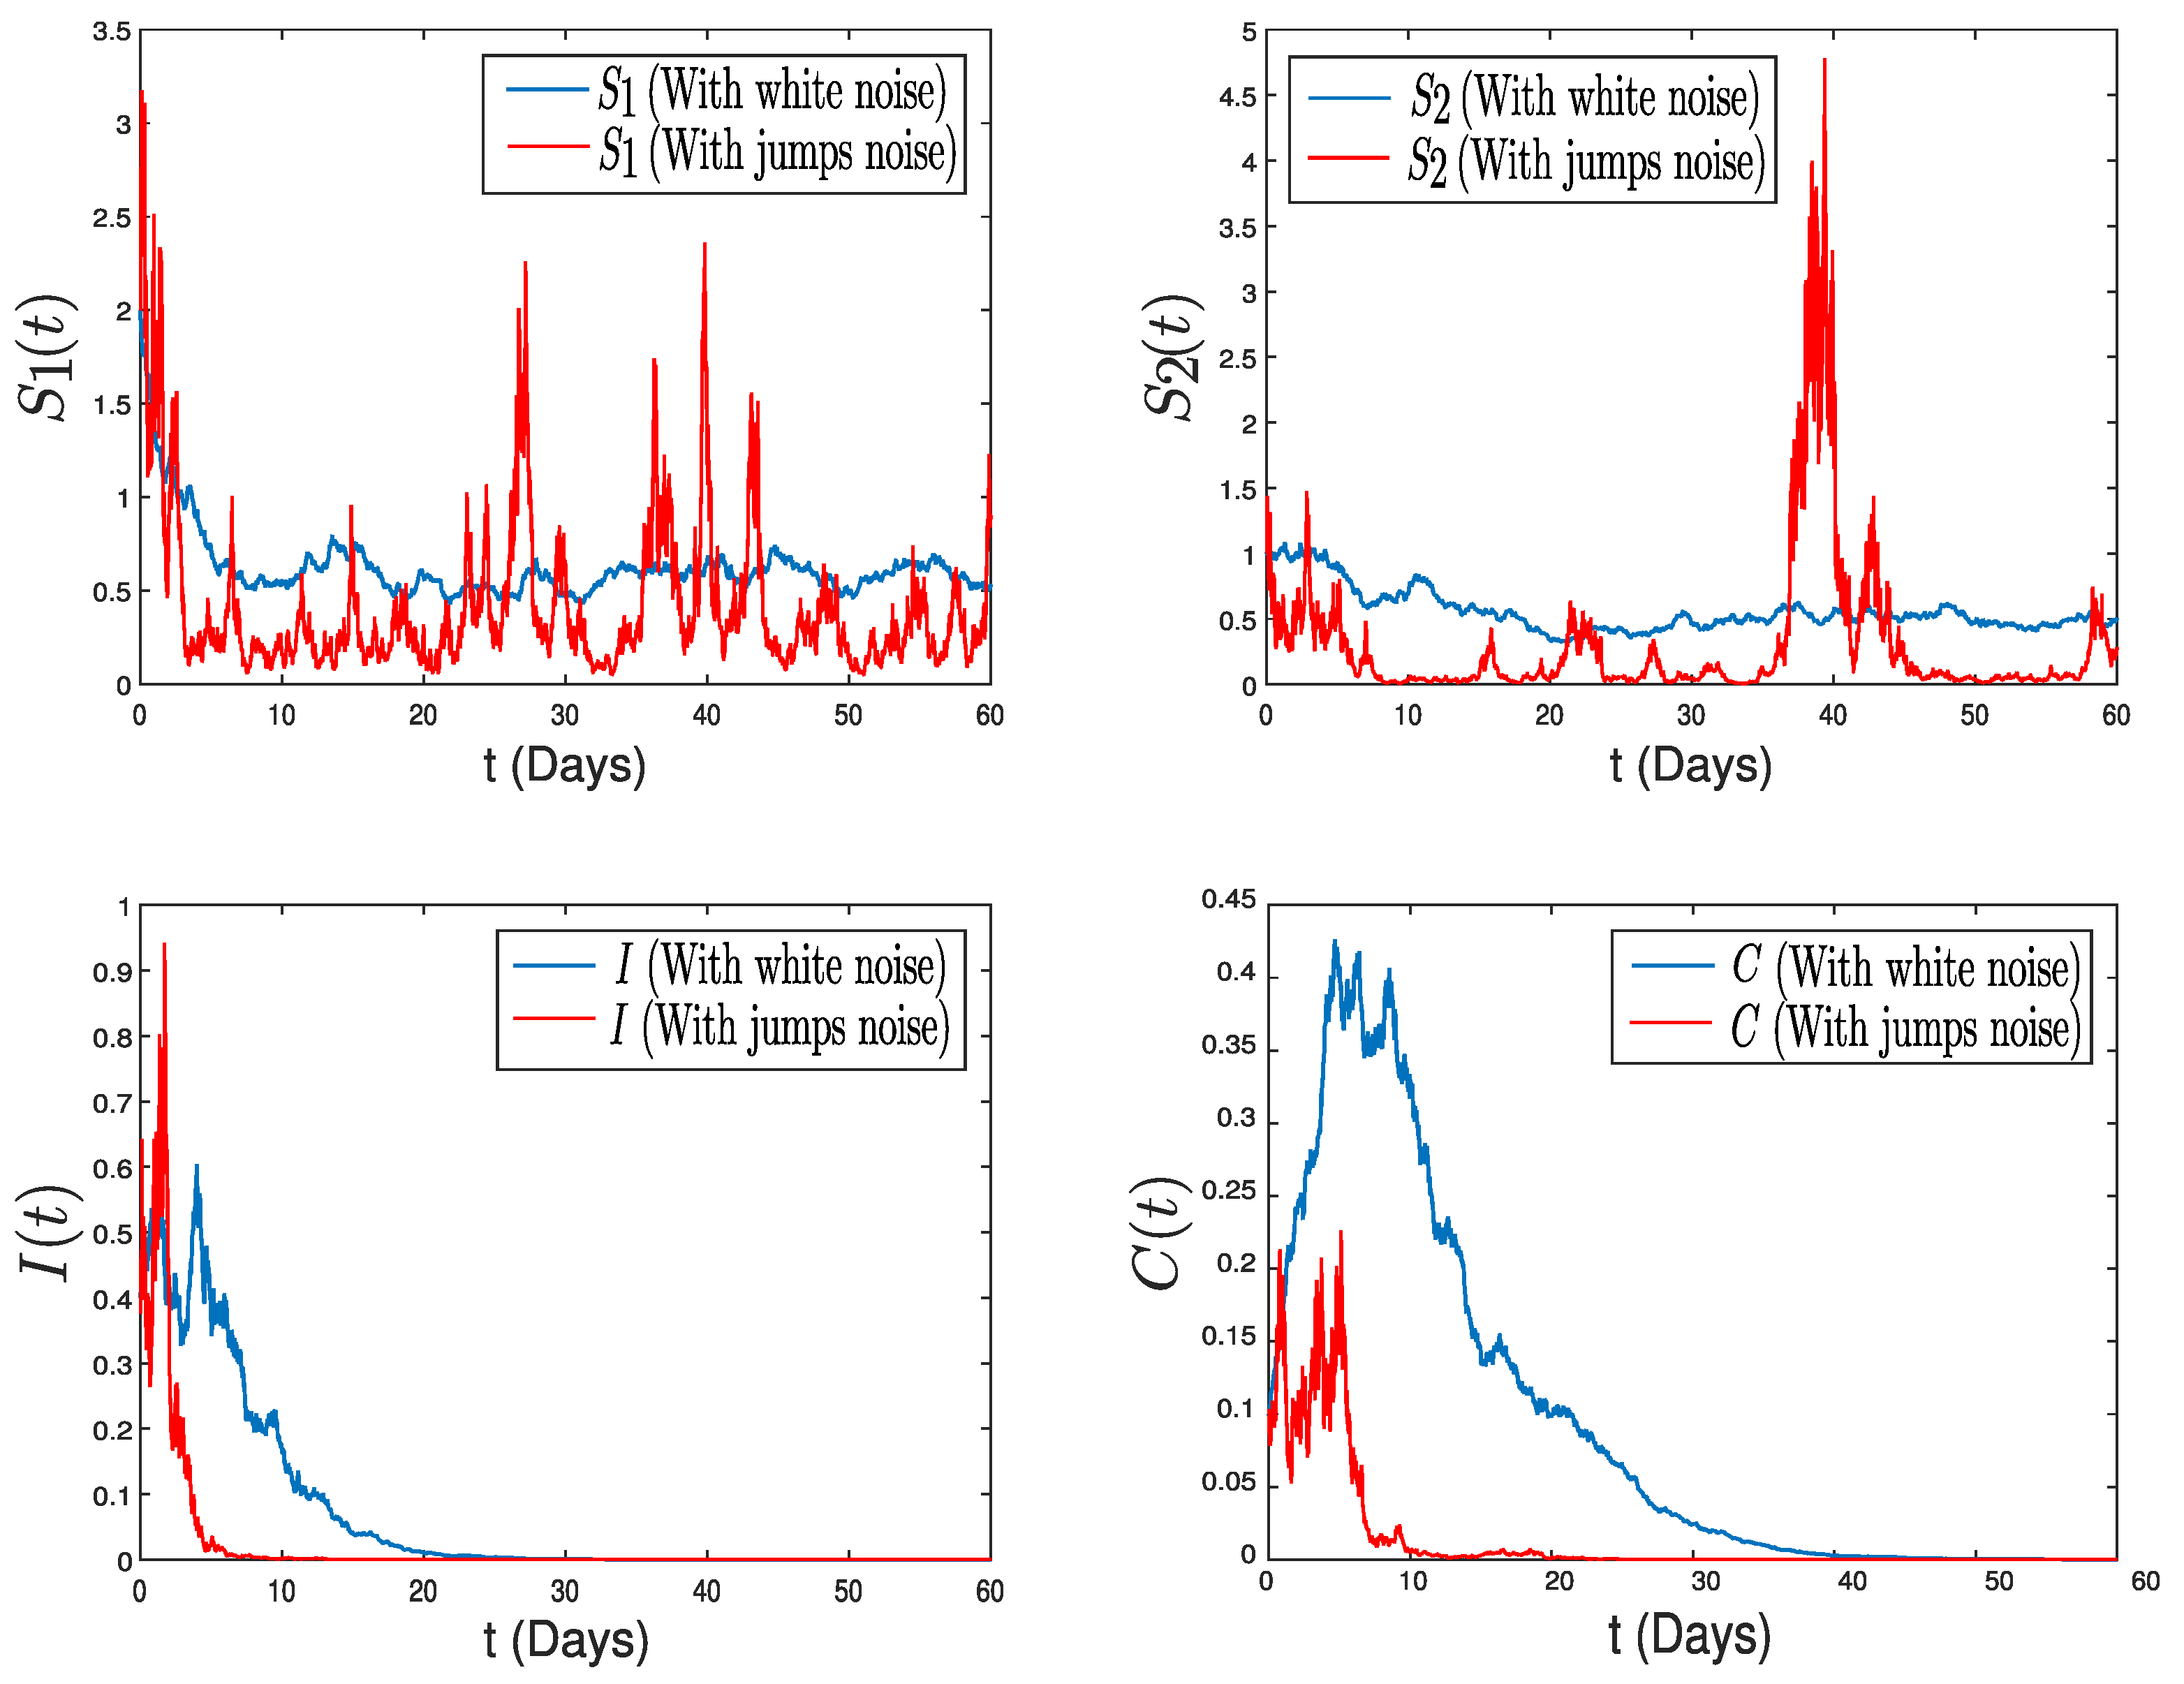
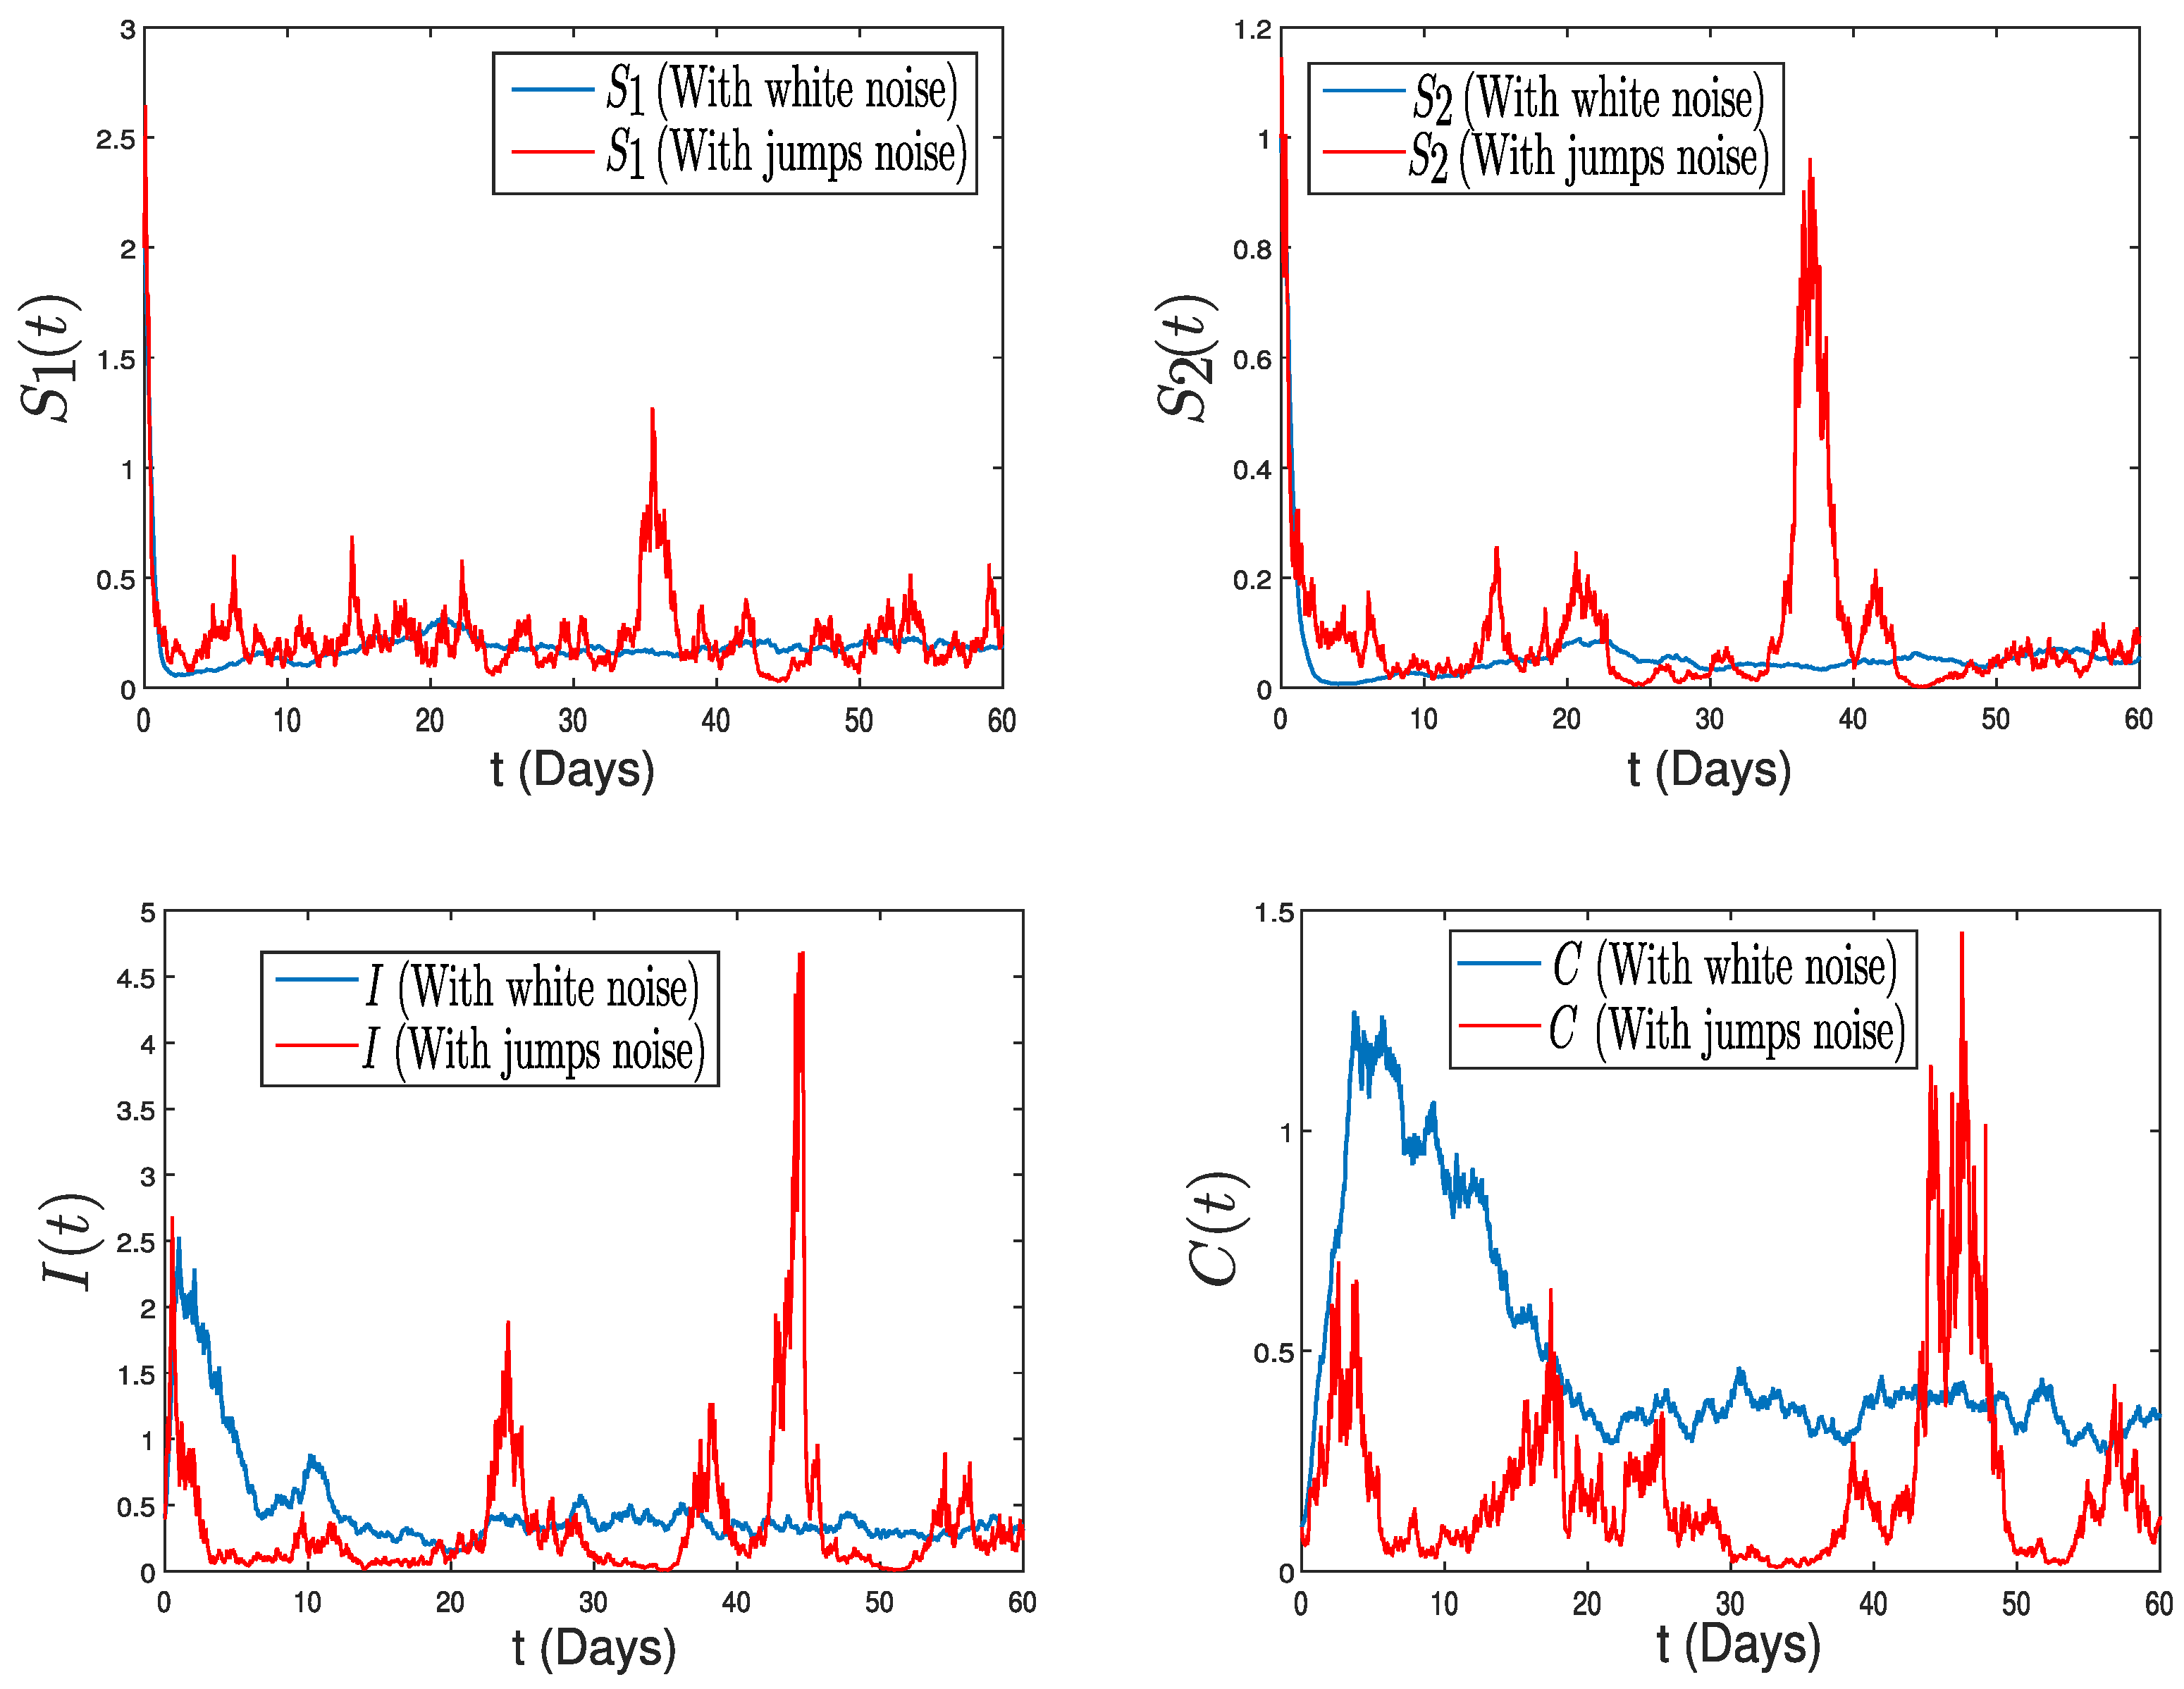
4. Numerical Application: Zoonotic Tuberculosis

In this section, we present a series of numerical demonstrations to corroborate the conclusions outlined in our research, employing authentic data on Zoonotic Tuberculosis as detailed in (Example 1, [24]). This dataset meticulously records reported instances within Morocco, offering a detailed insight into the current scenario. The dataset encompasses a range of parameters and initial conditions reflective of the epidemiological landscape of Zoonotic Tuberculosis in the region. To ensure the robustness of our findings, we draw upon deterministic parameters and initial data outlined in Table 1. These parameters were carefully selected based on the latest epidemiological studies and statistical analyses pertinent to the spread and control of Zoonotic Tuberculosis. Our approach involves integrating these parameters into our mathematical model to simulate various outbreak scenarios, thereby enabling us to examine the potential efficacy of different intervention strategies.
About the dual incidence functions g 1 and g 2 , we consider the following general nonlinear incidences:
f 1 ( S 1 , I ) = β 1 S 1 1 + m 1 S 1 + m 2 I , f 2 ( S 2 , I ) = β 2 S 2 1 + m 3 S 2 + m 4 I ,
where m 1 , m 2 , m 3 , and m 4 are four saturated coefficients. We begin our check by illustrating the rigor of condition (9). We take κ = 2 = 0.3 and κ ( ξ ) = z 2 ( ξ ) = 0.08 . In this case, we obtain
( u + c ) 0.5 κ 1 2 R 4 { 0 } z 1 ( ξ ) ln 1 + z 1 ( ξ ) G 1 ( d ξ ) = 0.017 > 0 .
According to Figure 2, we visually depict the existence of an ergodic stationary distribution for the stochastic processes ( S ¯ 1 , S ¯ 2 ) . This graphical representation unmistakably highlights the enduring nature of the processes over time.
Firstly, we take specific values for the parameters κ k ( k { 1 , , 4 } ), setting them as 0.12 , 0.11 , 0.15 , and 0.1 , respectively. The jump intensities are defined using the function z k ( ξ ) = u k ξ 0.5 + ξ 2 , where k 1 , , 4 and ξ = 0.3 . The corresponding values for u k ( k { 1 , , 4 } ) are established as 0.02 , 0.03 , 0.0770 , and 0.03 , respectively. Here, we obtain λ 1 = 0.0592 and λ 2 = 0.2061 . As a result, we have verified that the prerequisite outlined in Theorem 2 has been met and
lim sup t 1 t ln I ( t ) = λ 1 λ 2 = 0.1469 < 0 .
To solidify this discovery through numerical analysis, we depict two distinct trajectory types corresponding to system (2) in Figure 3. From this visualization, several observations can be drawn. Initially, we note the extinction of Tuberculosis in both trajectories, yet the solution involving jumps demonstrates a faster extinction compared to the solution with only white noise. Additionally, we observe that the incorporation of jumps helps in capturing abrupt changes, particularly in behavioral shifts. At time t = 38 , a significant jump occurs within the educated class S 2 , leading to complete extinction in the infected class.
Now, let us explore the scenario of persistent Tuberculosis. In this experimental setup, our focus is on κ k ( k 1 , , 4 ), with specific values assigned as 0.09 , 0.09 , 0.028 , and 0.026 , respectively. The jump intensities are determined by the function z k ( ξ ) = u k ξ 0.5 + ξ 2 , where k spans from 1 to 4, and ξ is set at 0.24 . The corresponding values for u k ( k 1 , , 7 ) are defined as 0.02 , 0.03 , 0.02 , and 0.03 , respectively. By utilizing the numerical values provided in [24] and adjusting β 1 to 3.3 and β 2 to 2.3, we can readily confirm the validity of our hypotheses, resulting in λ 1 = 3.9876 and λ 2 = 1.231 . Consequently, in line with the assertions of Theorem 2, we can confidently affirm that our model exhibits persistence on average, a trend consistently reflected in the patterns illustrated in Figure 4. Notably, the endemic equilibrium characterizing the deterministic version no longer functions as the stable state for the stochastic model (2). Therefore, over an extended temporal span, the influence of noise intensity becomes a significant factor, shaping the extent to which the solution fluctuates around the deterministic equilibrium states.

5. Conclusions

The dynamic shift in behavior during an epidemic profoundly impacts infection probabilities. Building upon the model introduced in [4], we significantly extended the framework by incorporating general incidence functions and Lévy jumps. This extension ensures the well-posedness of the model and allows us to devise an auxiliary system that is pivotal in determining the global threshold distinguishing between extinction and persistence. Our practical application, validated within the context of Zoonotic Tuberculosis, underscores the pivotal role of Lévy jumps in accurately modeling epidemics, shedding light on their intricate dynamics. Unlike prior works, our paper’s distinctiveness lies in the innovative mathematical techniques employed, introducing a more sophisticated set of hypotheses and a nuanced analytical framework. The inclusion of Assumptions 1 and 2 enhances the precision and depth of our analysis, emphasizing the importance of a meticulous approach. Furthermore, our expanded assumption framework accommodates a broader range of functions, using a non-standard analytical approach to delineate the threshold between the eradication and continuation of infection.
These theoretical advancements hold significant implications for public health, providing crucial insights that can inform and improve epidemic management and mitigation strategies. Understanding the impact of behavior shifts on infection probabilities allows public health officials to design more effective interventions. For instance, targeted public health campaigns can be developed to encourage behaviors that reduce transmission rates, such as promoting vaccination, social distancing, and the use of personal protective equipment. Additionally, the integration of Lévy jumps into epidemic models enables better prediction and rapid response to sudden changes in infection rates, facilitating quicker and more effective public health responses to emerging outbreaks. By identifying precise thresholds for extinction and persistence, health authorities can allocate resources more efficiently, prioritizing areas with the highest risk of sustained transmission. Our model also assists policymakers in developing evidence-based policies that account for behavioral dynamics and nonlinear transmission patterns, leading to more effective control measures.
Furthermore, the potential for broader applications of our theoretical framework is vast. Future research should explore extending our model to various infectious diseases, potentially creating a universal framework for epidemic modeling. This extension would significantly enhance our ability to manage a wide range of public health challenges, improving preparedness and response strategies. By integrating these findings into public health strategies, we can enhance epidemic management, protect vulnerable populations, and ultimately save lives. The implications of our work extend beyond the immediate findings, offering a robust foundation for future innovations in epidemic modeling and public health policy.

Author Contributions

Conceptualization, Y.S. and A.A.R.; methodology, Y.S. and A.A.R.; software, Y.S. and A.A.R.; validation, Y.S., M.I., A.A.R. and W.A.; formal analysis, Y.S. and A.A.R.; funding acquisition, M.I. and W.A.; investigation, Y.S., M.I., A.A.R. and W.A.; writing—original draft preparation, Y.S. and A.A.R.; writing—review and editing, Y.S., M.I., A.A.R. and W.A. All authors have read and agreed to the published version of the manuscript.

Funding

This research was funded by Deanship of Research and Graduate Studies at King Khalid University, Abha, Saudi Arabia, under grant number RGP2/174/45.

Institutional Review Board Statement

Not applicable.

Informed Consent Statement

Not applicable.

Data Availability Statement

The real data used were derived from [24].

Acknowledgments

The authors extend their appreciation to the Deanship of Research and Graduate Studies at King Khalid University for funding this work through Large Research Project under grant number RGP2/174/45.

Conflicts of Interest

The authors declare no conflicts of interest.

References

  1. Capasso, V. Mathematical Structures of Epidemic Systems; Springer Science & Business Media: Berlin/Heidelberg, Germany, 2008; Volume 97. [Google Scholar]
  2. Brauer, F.; Castillo-Chavez, C. Mathematical Models in Population Biology and Epidemiology; Springer Science & Business Media: Berlin/Heidelberg, Germany, 2013; Volume 40. [Google Scholar]
  3. Kermack, W.O.; McKendrick, A.G. Contributions to the mathematical theory of epidemics–I. 1927. Bull. Math. Biol. 1991, 53, 33–55. [Google Scholar]
  4. Nguyen, D.T.; Du, N.H.; Nguyen, S.L. Asymptotic behavior for a stochastic behavioral change SIR model. J. Math. Anal. Appl. 2024, 538, 128361. [Google Scholar] [CrossRef]
  5. Frieswijk, K.; Zino, L.; Ye, M.; Rizzo, A.; Cao, M. A mean-field analysis of a network behavioral-epidemic model. IEEE Control Syst. Lett. 2022, 6, 2533–2538. [Google Scholar] [CrossRef]
  6. Osi, A.; Ghaffarzadegan, N. Parameter estimation in behavioral epidemic models with endogenous societal risk-response. PLoS Comput. Biol. 2024, 20, e1011992. [Google Scholar] [CrossRef]
  7. Marsudi, T.; Suryanto, A.; Darti, I. Global stability and optimal control of an HIV/AIDS epidemic model with behavioral change and treatment. Eng. Lett. 2021, 29, 575–591. [Google Scholar]
  8. Li, J.; Wang, X.; Lin, X. Impact of behavioral change on the epidemic characteristics of an epidemic model without vital dynamics. Math. Biosci. Eng. 2018, 15, 1425–1434. [Google Scholar] [CrossRef]
  9. Ward, C.; Deardon, R.; Schmidt, A.M. Bayesian modeling of dynamic behavioral change during an epidemic. Infect. Dis. Model. 2023, 8, 947–963. [Google Scholar] [CrossRef]
  10. Li, S. SIR epidemic model with general nonlinear incidence rate and Lévy jumps. Mathematics 2024, 12, 215. [Google Scholar] [CrossRef]
  11. Wang, H.; Zhang, G.; Chen, T.; Li, Z. Threshold analysis of a stochastic SIRS epidemic model with logistic birth and nonlinear incidence. Mathematics 2023, 11, 1737. [Google Scholar] [CrossRef]
  12. Zhao, Y.; Jiang, D. The behavior of an SVIR epidemic model with stochastic perturbation. Abstr. Appl. Anal. 2014, 2014, 742730. [Google Scholar] [CrossRef]
  13. Sabbar, Y.; Khan, A.; Din, A.; Tilioua, M. New method to investigate the impact of independent quadratic alpha stable Poisson jumps on the dynamics of a disease under vaccination strategy. Fractal Fract. 2023, 7, 226. [Google Scholar] [CrossRef]
  14. Kiouach, D.; Sabbar, Y.; El-idrissi, S.E.A. New results on the asymptotic behavior of an SIS epidemiological model with quarantine strategy, stochastic transmission, and Lévy disturbance. Math. Meth. Appl. Sci. 2021, 44, 13468–13492. [Google Scholar] [CrossRef]
  15. Rosinski, J. Tempering stable processes. Stoch. Process. Their Appl. 2007, 117, 677–707. [Google Scholar] [CrossRef]
  16. Koponen, I. Analytic approach to the problem of convergence of truncated Lévy flights towards the gaussian stochastic process. Phys. Rev. E 1995, 52, 1197–1199. [Google Scholar] [CrossRef] [PubMed]
  17. Zhang, X.; Yang, Q. Threshold behavior in a stochastic SVIR model with general incidence rates. Appl. Math. Lett. 2021, 121, 107403. [Google Scholar] [CrossRef]
  18. Zhou, B.; Zhang, X.; Jiang, D. Dynamics and density function analysis of a stochastic SVI epidemic model with half saturated incidence rate. Chaos Solit. Fract. 2020, 137, 109865. [Google Scholar] [CrossRef]
  19. Mao, X. Stochastic Differential Equations and Applications; Elsevier: Amsterdam, The Netherlands, 2007. [Google Scholar]
  20. Karatzas, I.; Shreve, S.E. Brownian Motion and Stochastic Calculus; Springer: Berlin/Heidelberg, Germany, 1998. [Google Scholar]
  21. Sabbar, Y.; Kiouach, D.; Rajasekar, S.P.; El-Idrissi, S.E.A. The influence of quadratic Lévy noise on the dynamic of an SIC contagious illness model: New framework, critical comparison and an application to COVID-19 (SARS-CoV-2) case. Chaos Solit. Fract. 2022, 159, 112110. [Google Scholar] [CrossRef] [PubMed]
  22. Øksendal, B.K.; Sulem, A. Applied Stochastic Control of Jump Diffusions; Springer: Berlin/Heidelberg, Germany, 2007; Volume 498. [Google Scholar]
  23. Privault, N.; Wang, L. Stochastic SIR Lévy jump model with heavy tailed increments. J. Nonlinear Sci. 2021, 31, 15. [Google Scholar] [CrossRef]
  24. El Attouga, S.; Bouggar, D.; El Fatini, M.; Hilbert, A.; Pettersson, R. Lévy noise with infinite activity and the impact on the dynamic of an SIRS epidemic model. Physica A 2023, 618, 128701. [Google Scholar] [CrossRef]
Figure 1. Schematic diagram illustrating the SIR model’s behavioral change with white noises.
Mathematics 12 01974 g001
Figure 2. Numerical simulation of the existence of a stationary distribution: histograms and joint distribution under condition (9).
Mathematics 12 01974 g002
Figure 3. Numerical simulation of system (2) with two trajectories: one characterized by white noise and the other by jump diffusion.
Mathematics 12 01974 g003
Figure 4. Numerical simulation of system (2) with two trajectories: one characterized by white noise and the other by jump diffusion.
Mathematics 12 01974 g004
Table 1. The numerical values corresponding to the deterministic parameters and initial data governing the dynamics of system (2).
ParametersExtinction CasePersistence CaseSource
r 0.177 0.177 [24]
c 0.15 0.15 Estimated
β 1 0.249 3.3 [24]
β 2 1.3 2.3 [24]
u 0.167 0.167 [24]
h 1 0.2 0.2 [24]
h 2 0.01 0.01 [24]
m 1 0.1 0.1 Estimated
m 2 0.2 0.2 Estimated
m 3 0.1 0.1 Estimated
m 4 0.2 0.2 Estimated
S 1 ( 0 ) 22Assumed
S 2 ( 0 ) 11Assumed
I ( 0 ) 0.5 0.5 Assumed
C ( 0 ) 0.1 0.1 Assumed
Disclaimer/Publisher’s Note: The statements, opinions and data contained in all publications are solely those of the individual author(s) and contributor(s) and not of MDPI and/or the editor(s). MDPI and/or the editor(s) disclaim responsibility for any injury to people or property resulting from any ideas, methods, instructions or products referred to in the content.

