Article

Quantitative Assessment of Bed-Separation Dynamic Development Caused by Inclined Coal Seam Longwall Mining

1
College of Geoscience and Surveying Engineering, China University of Mining and Technology (Beijing), Beijing 100083, China
2
General Defense Geological Survey Department, Huaibei Mining Co., Ltd., Huaibei 235000, China
*
Author to whom correspondence should be addressed.
Mathematics 2024, 12(13), 1960; https://doi.org/10.3390/math12131960
Submission received: 30 May 2024 / Revised: 19 June 2024 / Accepted: 21 June 2024 / Published: 24 June 2024

Abstract

:
Coal mining under the Quaternary thick loose layer affects key strata breakage, Bed-separations development, ground subsidence, and other studies. This paper presents a method for solving the deflection of a large-deflection inclined thin plate under a thick loose-layer cover with additional lateral loads and midplane forces. The methods presented are based on the principle of large-deflection of thin-plate, energy method, and fracture mechanics theory. The 7225 work face in Anhui Province, China, was studied. Combined with the large-deflection inclined thin plate model, the initial breakage distance within the main roof plate was calculated to be 33 m with the initial breakage angle of 61.2°, and the period breakage distance was calculated to be 21 m with the period breakage angle of 55.4°. The distribution range of “Vertical Three Zones” from 7225 working face to the ground, including the height of the caved zone is 38.07 m, the height of the fractured zone is 41.13 m, and the height of the curved zone with the thick loose layer removed is 187.56 m. During the dynamic development of the principal key strata (PKS), the deflection value develops from 0 mm to 2714 mm with 7225 working face mining, and the maximum value of the spatial volume is 56,485 m3, which is verified by Three-dimensional Discrete Element Code (3DEC) numerical simulation. The dynamic development of Bed-separation within the overlying strata, with a maximum development height of 545.2 mm and a maximum volume of 11,228.1 m3 of the Bed-separation cavity. The dynamic development of the Bed-separation height and the cavity under different mining length and width conditions of the working face are also discussed. The large-deflection inclined thin plate model proposed in this paper effectively explores the dynamic deflection and fragmentation law of the overlying strata induced by the inclined working face of Longwall mining and provides a theoretical basis and computational model for quantitatively evaluating the dynamic development of the Bed-separation cavity.

Graphical Abstract

1. Introduction

China’s Anhui, Shanxi, and Shandong Provinces extensively distribute quaternary thick loose mining layers [1]. Within the mining areas of Huaibei in Anhui Province, there is a specific location where mining operations occur at a depth of 600 m. The 200 m thin rock strata encumber the working face, followed by a 400 m thick loose layer. This results in general movement damage to the rock strata. This necessitates developing and implementing a highly accurate model that adheres to the inherent principles of the overburden rock movement for practical use in production. The thick, loose layers mainly comprise sparsely scattered sediments that have yet to undergo the process of solidification and hardening into rock [2]. These sediments exhibit similar physical features. The underlying rock layers, located beneath the broad, loose strata, consist of progressively deposited mudstone, fine sandstone, siltstone, and other stones with various physical characteristics [3]. Qian Minggao proposed the Key Strata hypothesis to explain how thick rock layers affect the mobility of different rock layers, especially those with different levels of softness and hardness beneath thick, loose layers. Subsidence deformation in the key strata leads to simultaneous deformation of the overloaded rock layers, entirely or partially, along with the non-key strata. The underlying non-key layer experiences asynchronous deformation, causing it to separate from the bed beneath the key stratum [4,5]. Research on bed separation plays a crucial role in gas extraction above coal seams [6], examination of water risks related to bed separation [7], and the implementation of separation grout Injection mining.
The deterioration of rock layers due to excessive pressure and the development of gaps between beds caused by underground mining is a complex process driven by various spatial and temporal factors [8,9]. Prior research [10,11] conducted experiments with comparable materials and augmented their results with numerical simulations [12,13,14]. Nevertheless, it is crucial to acknowledge that these studies have a comparatively less robust theoretical basis for their approaches and mostly concentrate on visualizing the process of structural deterioration in overloaded rock layers. Theoretical analyses of elastic foundation support beams [15,16] and plates [17,18,19] provide the basis for comprehending the structural deterioration process of heavily loaded rock layers. The purpose of the elastic foundation support beam and plate concept is to specifically analyze the primary stratum and investigate the structural failure of the principal strata and the occurrence of the Bed-separation phenomenon beneath it. Within the framework of the Winkler foundation, it is hypothesized that thick, unconsolidated layers function as the weight on top. In contrast, other rock layers are considered the weight on top of the main layer. The settlement deformation of the primary layers shows a slight variation in thickness, and it is estimated by utilizing a thin plate with negligible bending. It is hypothesized that the working face is positioned horizontally to the rock layer above it, and the load is delivered at a right angle to the center of the plate. The Winkler foundation is based on the idea that it comprises several independent and non-interacting springs. The force exerted by the foundation depends only on the amount it is deflected.
When a coal seam is sloped, it is necessary to use Longwall mining techniques that have prolonged lengths along the direction of the seam’s slope and strike. As a result, there is a significant difference in the vertical distance between the boundaries of the coal seam opening and closing and the mining depths along the uphill and downhill boundaries of the coal seam [20,21]. The assumption that the overburden weight is equal or perpendicular to the midface of the key strata is not applicable in the context of inclined working face mining. This mining technique causes the overlying material to apply forces on the central plane of the targeted rock layers [22]. The mining process entails the progression of slanted excavations, resulting in changes in the mining depth. As a result, this causes changes in the load distribution of each essential stratum on the top of the bedrock. If the seam is mined to a greater thickness, the deformation of the critical strata towards the edge of the slab can be approximated to the deformation of a thin plate [23,24]. However, it must be recognized that the magnitude of deformation is roughly equal to the plate thickness. Therefore, if we use a slightly deformed thin plate model and ignore the strain in the middle plane, the prediction accuracy of the critical strata deformation will be reduced. Although it is possible to obtain an analytical solution for the deflection of a thin plate by using the Navier solution for a simply supported thin plate with small deflection, it is difficult to obtain the Navier solution for a large-deflection inclined thin plate with an additional mid-plane force, and the accuracy of the results is lower than that of the energy method [25,26,27]. The main concept of the energy method is to describe the process of deflection of a thin plate in which the strain energy of the plate is dynamically balanced with the work performed by the external loads [28]. The strain energy method has the advantages of a simple method and easy programming for calculating the deflection coefficients of large-deflection inclined thin plates, while the calculation results can effectively meet the engineering requirements [29,30].
This study thoroughly examines the angle of inclination of the coal seam. It is assumed that the rock layers above the working face are parallel to the working face and have the same angle as the coal seam. A thin plate model with large deflection is generated using the Key Strata Theory. The strata located above the load maintain a vertical orientation. The item provided can be divided into two loads: one exerting force at a right angle to the inclined plate and another exerting force parallel to the mid-plane of the inclined plate. Theoretical improvement of the Winkler foundation discontinuity problem entails adding constraints to individual springs in the Winkler model, creating a two-parameter foundation model. This work suggests utilizing the inclined large deflection thin plate model to improve the accuracy of predicting the deflection curve of significant strata. Furthermore, its objective is to ascertain the location, form, and beginning and ending times of bed separation formation under dynamic stress resulting from inclined coal seam mining.

2. Materials and Methods

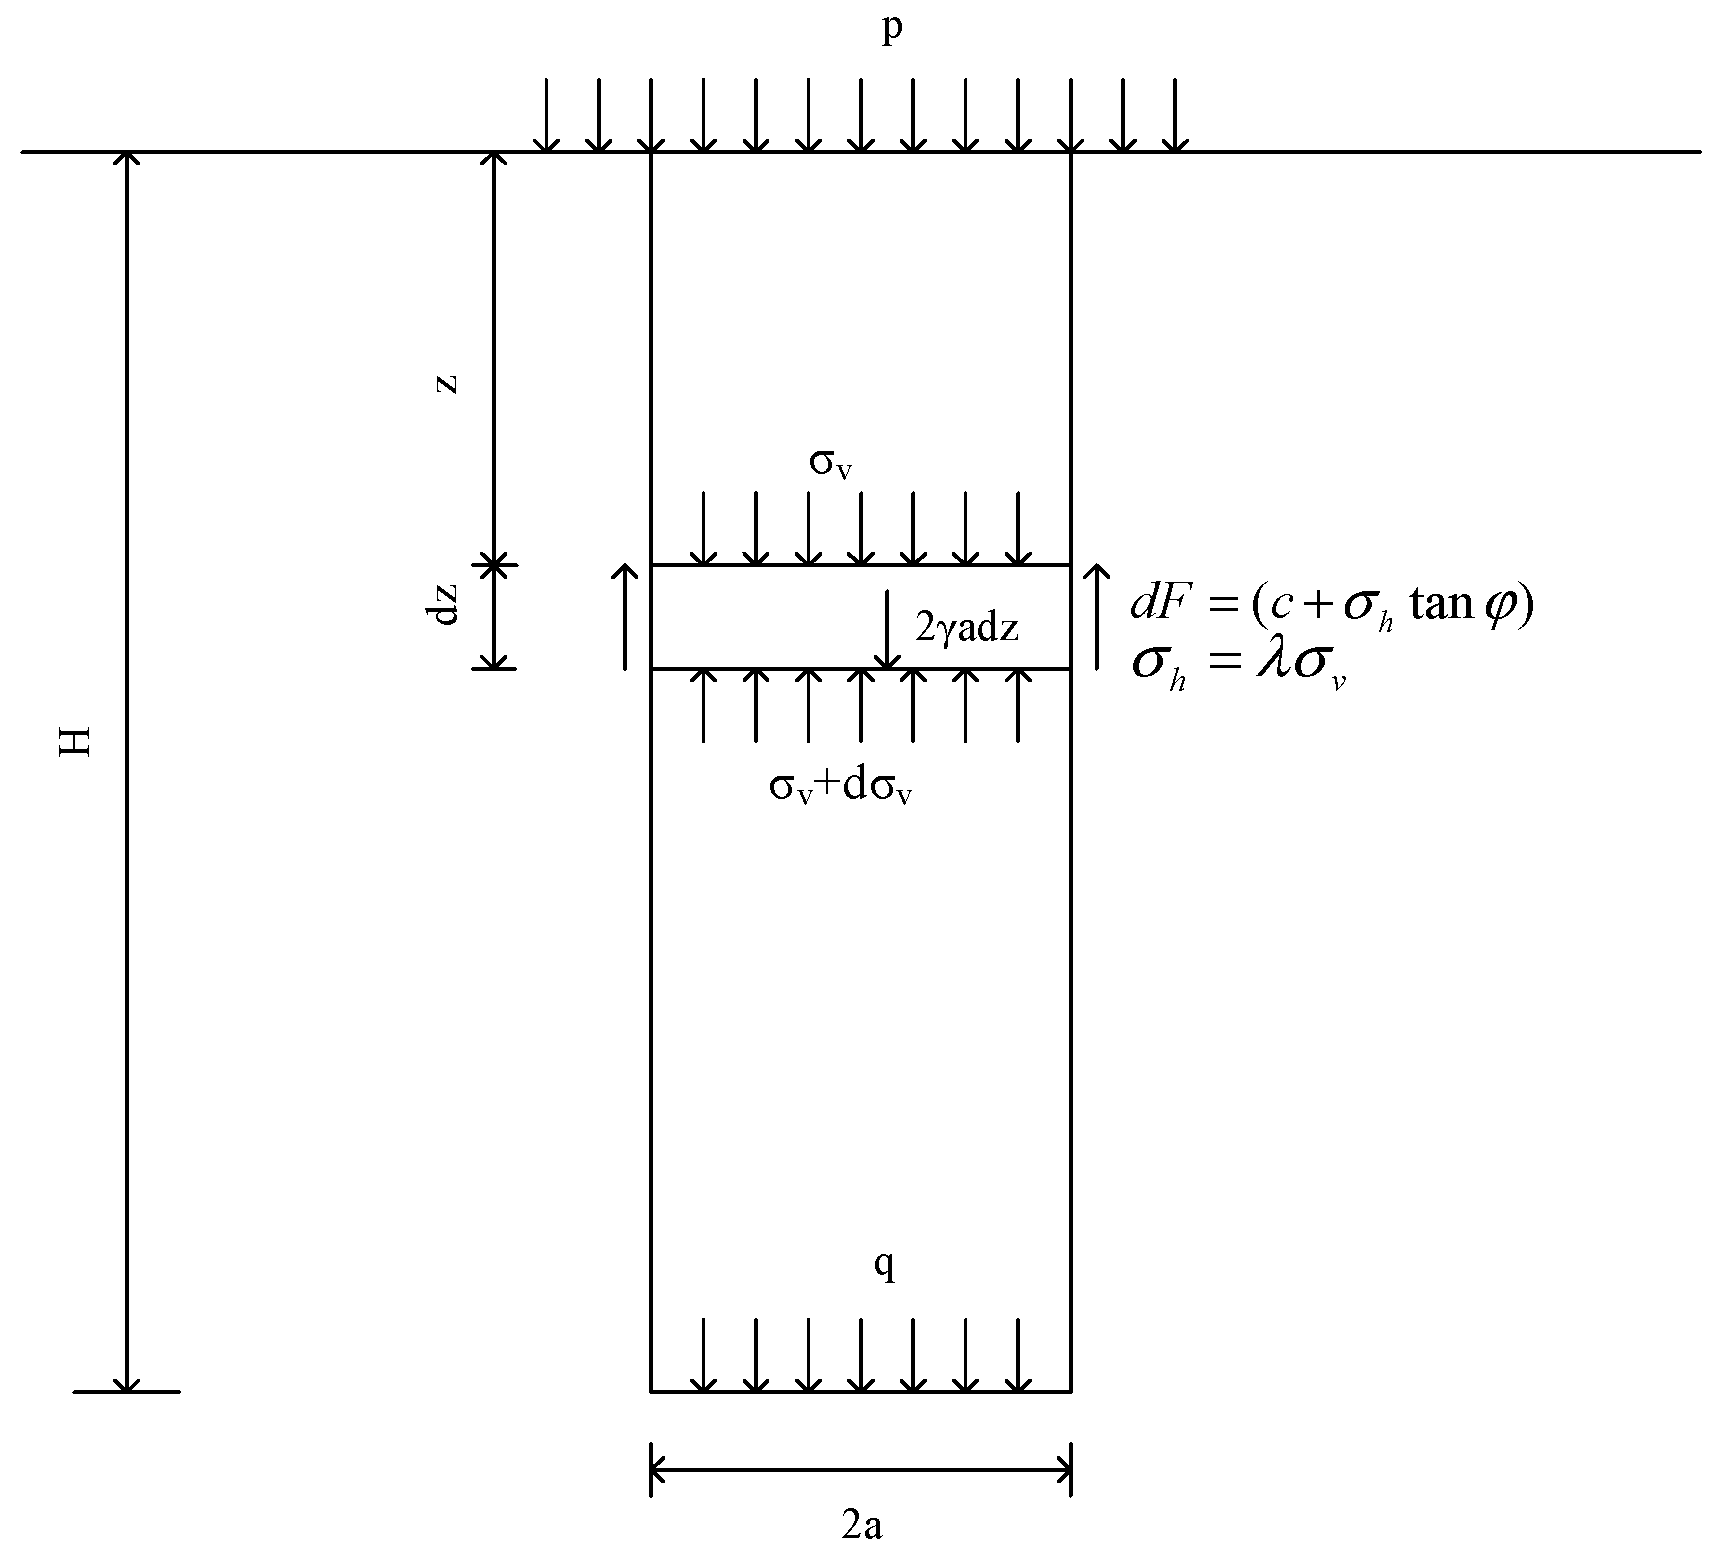
2.1. Calculation of Overlying Load Based on Stress Transfer

As the rock strata subside, consolidation, extrusion, and shear produce opposite stresses. The direct use of the calculation method for the product of capacity and thickness will make the load calculation value large. The stress transfer method can calculate the load above the bedrock for soft and fragile rock strata or thick, loose strata soils. Since the rock strata have a certain cohesion, their strength obeys the Mohr–Coulomb theorem [31,32,33], i.e.,
τ = c + σ tan φ
where  τ  is the soil shear strength,  c  is the soil cohesion,  σ  is the soil tensile strength, and  φ  is the angle of friction within the soil.
The bedrock internal cohesion is considerable, the surrounding rock on both sides is stable, and the subsidence area is limited to the upper part of the top plate. First, a schematic diagram of the calculation of the loads applied to the roof by the overlying bedrock is established.
As shown in Figure 1, the shear forces on both sides of a differentially thin bedrock of depth z and thickness dz are as follows:
d F = ( c + σ h tan φ ) d z = ( c + λ σ v tan φ ) d z
where z is the depth of a differential thin strata in bedrock,  σ h  is the differential thin strata horizontal stress at depth z,  σ v  is the differential thin strata vertical stress at depth z,  τ  is the soil shear strength,  c  is the soil cohesion,  φ  is the soil internal friction angle, and  λ  is the lateral pressure coefficient.
Assuming a uniform load  p  at the surface, the equilibrium equation for the differential thin strata  d z  in the vertical direction is
a γ d z + a σ v = a ( σ v + d σ v ) + ( c + λ σ v tan φ ) d z
Calculations obtained
( γ λ tan φ a σ v c a ) d z = d σ v
Solving the differential Equation obtains
σ v = a γ c λ tan φ ( 1 + A e λ tan φ · z a )
where  γ  is the rock weight,  a  is the span of the subsidence area,  σ v  is the differential thin vertical stress at depth z, and  λ  is the lateral pressure coefficient.
According to the surface boundary conditions, when  z = 0 σ v = p , then substitution into Equation (5) can be obtained
A = λ p tan φ a γ c 1
Now, the vertical stress  σ v  at the bedrock depth z can be found as follows:
σ v = a γ c λ tan φ ( 1 e λ tan φ · z a ) + p e λ tan φ · z a
When  z = H , the vertical load transferred to the top plate during bedrock subsidence is obtained as
σ = a γ c λ tan φ ( 1 e λ tan φ · H a ) + p e λ tan φ · H a

2.2. Calculation of Overlying Load Based on Stress Transfer

The Winkler model is an assumption made by the Czech engineer Winkler in 1867 when calculating railroad tracks that the pressure at any point on the surface of the foundation is proportional to the displacement at this point [34,35].
p = k w ( x , y )
where k is called the foundation reaction coefficient.
According to this assumption, the displacement of a point on the foundation is independent of the other points. The foundation comprises many independent springs that do not affect each other, and the Winkler foundation model is illustrated in Figure 2. The model assumes that the foundation deformation occurs only within the footing area and that there is no deformation outside.
The Winkler foundation model cannot diffuse strain and deformation and thus has severe defects in the theory. Although the elastic half-space model is perfect in theory, it has more difficulties in mathematical calculation. For this purpose, some foundation calculation models between the two are cited, among which the two-parameter foundation model uses two independent parameters to characterize the foundation properties, which theoretically improves the disadvantages of foundation discontinuity in the Winkler foundation model and is more straightforward than the elastic half-space model in mathematical calculations.
Since the plate is tilted in space, the Winkler foundation model considers no interaction between adjacent units irrelevant. A two-parameter model is chosen, as shown in Figure 3. The feature is to connect a series of springs in a Winkler foundation with a film subjected to a constant value of tensile force T. The balance between the film force and the spring system is considered.
The relationship between the lead hammer load P and the displacement of the foundation in the three-dimensional case is
p ( x , y ) = k w ( x , y ) N 2 w ( x , y )
For the inclined plate on the foundation, the film tension N can be approximated as a vector sum of the gravity of the inclined plate and the force of the overlying load along the inclined plate.

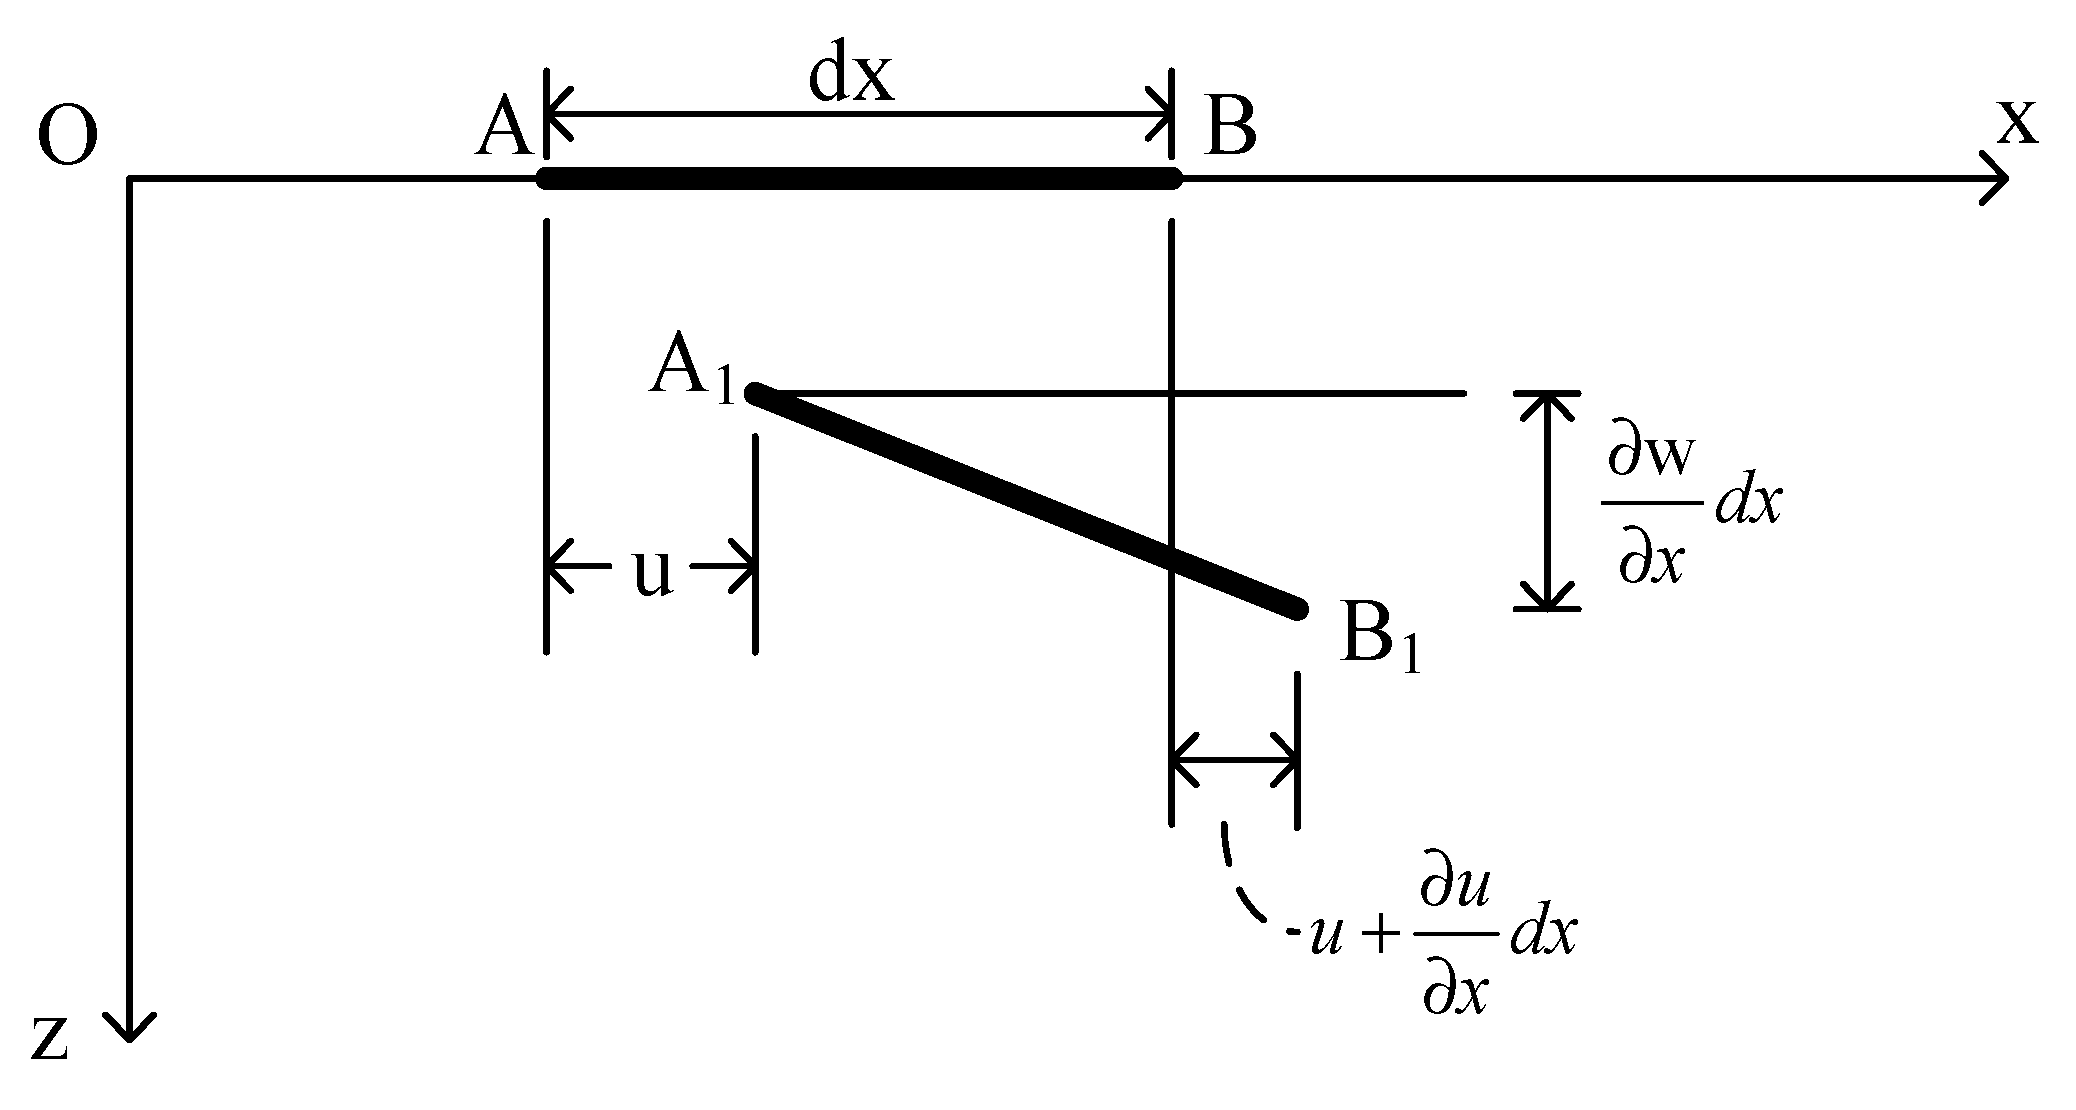
2.3. Energy Method for Solving Additional Lateral Loads and Mid-Plane Stresses for Thin Plate Deflection Values

2.3.1. Establishment of Thin Plate Model

The coordinate axes x and y are taken in the plate’s mid-plane, and the z-axis is perpendicular to the mid-plane. Two pairs parallel to the xz and yz planes are used to intercept the cell from the plate to establish the bending moment MX, MY, the torque MXY and the lateral vertical shear QX, QY. The results are shown in Figure 4.
Considering the load distribution on the upper surface of the plate, the load intensity is denoted by q, and the load acting on the unit body is qdxdy. The equilibrium equation is obtained by projecting the force acting on the unit body in the z-direction.
Q x x d x d y + Q y y d x d y + q d x d y = 0
The force acting on the unitary body is de-mobilized in the x-direction to obtain the equilibrium equation [36].
M x y x d x d y + M y y d x d y + Q y d x d y = 0
When ignoring the effect of shear QX,QY on the bending, as well as the compressive stress  σ z  generated by the load q. At this point, the deflection is expressed by Equation [24]:
4 w x 4 + 2 4 w x 2 y 2 + 4 w y 4 = q D
where  D = E h 3 12 ( 1 v 2 )  denotes the bending stiffness of the thin plate, and v denotes Poisson’s ratio of the thin plate.

2.3.2. Establishment of Thin Plate Model

According to the equation of elasticity, when the deformation state of the elastomer  ε x , ε y , ε z , γ x y , γ x z , γ y z  undergoes a small deformation to the moment  ε x + d ε x , ε y + d ε y , ε z + d ε z , γ x y + d γ x y , γ x z + d γ x z , γ y z + d γ y z , the strain energy increment per unit volume is  d U = σ x d ε x + σ y d ε y + σ z d ε z + τ x y d γ x y + τ x z d γ x z + τ y z d γ y z .
For the Kirchhoff assumption for thin plates, the above Equation can be simplified as follows:
d U = σ x d ε x + σ y d ε y + τ x y d γ x y
The strain and stress components are replaced by the generalized deformation component  κ x , κ y , κ x y  and the inner torque, respectively, and integrated along the thickness direction to obtain the deformation energy increment per unit area of the middle surface expressed by the generalized deformation increment:
d V = V κ x d κ x + V κ y d κ y + V κ x y d κ x y
Under the condition of linear elasticity, the deformation energy density is a positive definite quadratic function of the generalized deformation:
V = D 2 [ κ x 2 + κ y 2 + 2 v κ x κ y + 2 ( 1 v ) κ x y 2 ]
Dividing the above Equation along the median plane and expressing the generalized deformation component by the deflection w, the deformation energy for bending of thin plates is obtained as follows:
U = D 2 [ ( 2 w x 2 ) 2 + ( 2 w y 2 ) 2 + 2 v 2 w x 2 2 w y 2 + 2 ( 1 v ) ( 2 w x y ) 2 ] d x d y
When all the boundaries of the plate are rigidly fixed, or the deflection of the plate is zero on all sides, the strain energy of thin plate bending can be simplified as
U = D 2 ( 2 w x 2 + 2 w y 2 ) 2 d x d y

2.3.3. Strain Energy Generated by the Bending of the Plate by the Action of the Mid-Plane Stresses

The strain energy resulting from the bending of the plate is mainly caused by the strain energy caused by the elongation of the mid-plane and the additional strain energy resulting from the bending of the plate by the lateral load.
Assuming that at each point on the mid-plane of the plate, the unit length force  N x N y N x y  is known, the strain component on the mid-plane of the plate can be known by Hooke’s law as
ε x = ( N x μ N y ) h E ε y = ( N y μ N x ) h E γ x y = N x y h G
Thus, the strain energy caused by the elongation of the mid-plane is as follows:
U 1 = 1 2 h E [ N x 2 + N y 2 2 μ N x N y + 2 ( 1 + μ ) N x y 2 ] d x d y
After the lateral load is applied, it bends the plate and causes additional strain on the mid-plane. When the plate is bent, the small displacements generated at a point in the mid-plane in the x, y, z direction components are represented by ux, uy, w. Now consider a mid-plane linear cell in the x-axis; from Figure 5, it can be seen that the elongation produced in the cell because of displacement ux is  u x x d x , compare the length of cell A1B1 and its projection length in the x-axis, the elongation produced in the cell due to displacement w is  1 2 ( w x ) 2 d x .
Therefore, the total unit elongation generated in the x-axis of the unit taken in the mid-plane is
ε x = u x + 1 2 ( w x ) 2
Similarly, the total unit elongation produced in the y-axis is
ε y = v y + 1 2 ( w y ) 2
Due to the mid-plane shear strain generated by the plate bending, the shear strain generated by displacement ux,uy is  u x x + u y y , and the shear strain generated by displacement w is  w x w y . The results are shown in Figure 6.
Summing the shear strains resulting from the various displacements obtains.
γ x y = u x x + u y y + w x w x
The additional strain energy caused by the mid-plane bending strain is
U 2 = [ N x u x x + N y u y y + N x y ( u x x + u y y ) ] d x d y + 1 2 [ N x ( w x ) 2 + N y ( w y ) 2 + 2 N x y ( 2 w x y ) ] d x d y
By adding U1, U2, the strain energy generated by the bending of the plate due to the action of the mid-plane force is obtained.
Due to the thin plate theory, the displacements parallel to the mid-plane within the mid-plane of the thin plate are neglected in Kirchhoff’s assumption, i.e., the displacements ux,uy along the x,y direction are neglected.
To the theory of large deflection of thin plates, the strain energy expression generated by the face force in bending of inclined plates satisfying Kirchhoff’s assumption condition is
U 1 + U 2 = 1 2 h E [ N x 2 + N y 2 2 μ N x N y + 2 ( 1 + μ ) N x y 2 ] d x d y + [ N x u x x + N y u y y + N x y ( u x x + u y y ) ] d x d y + 1 2 [ N x ( w x ) 2 + N y ( w y ) 2 + 2 N x y ( 2 w x y ) ] d x d y

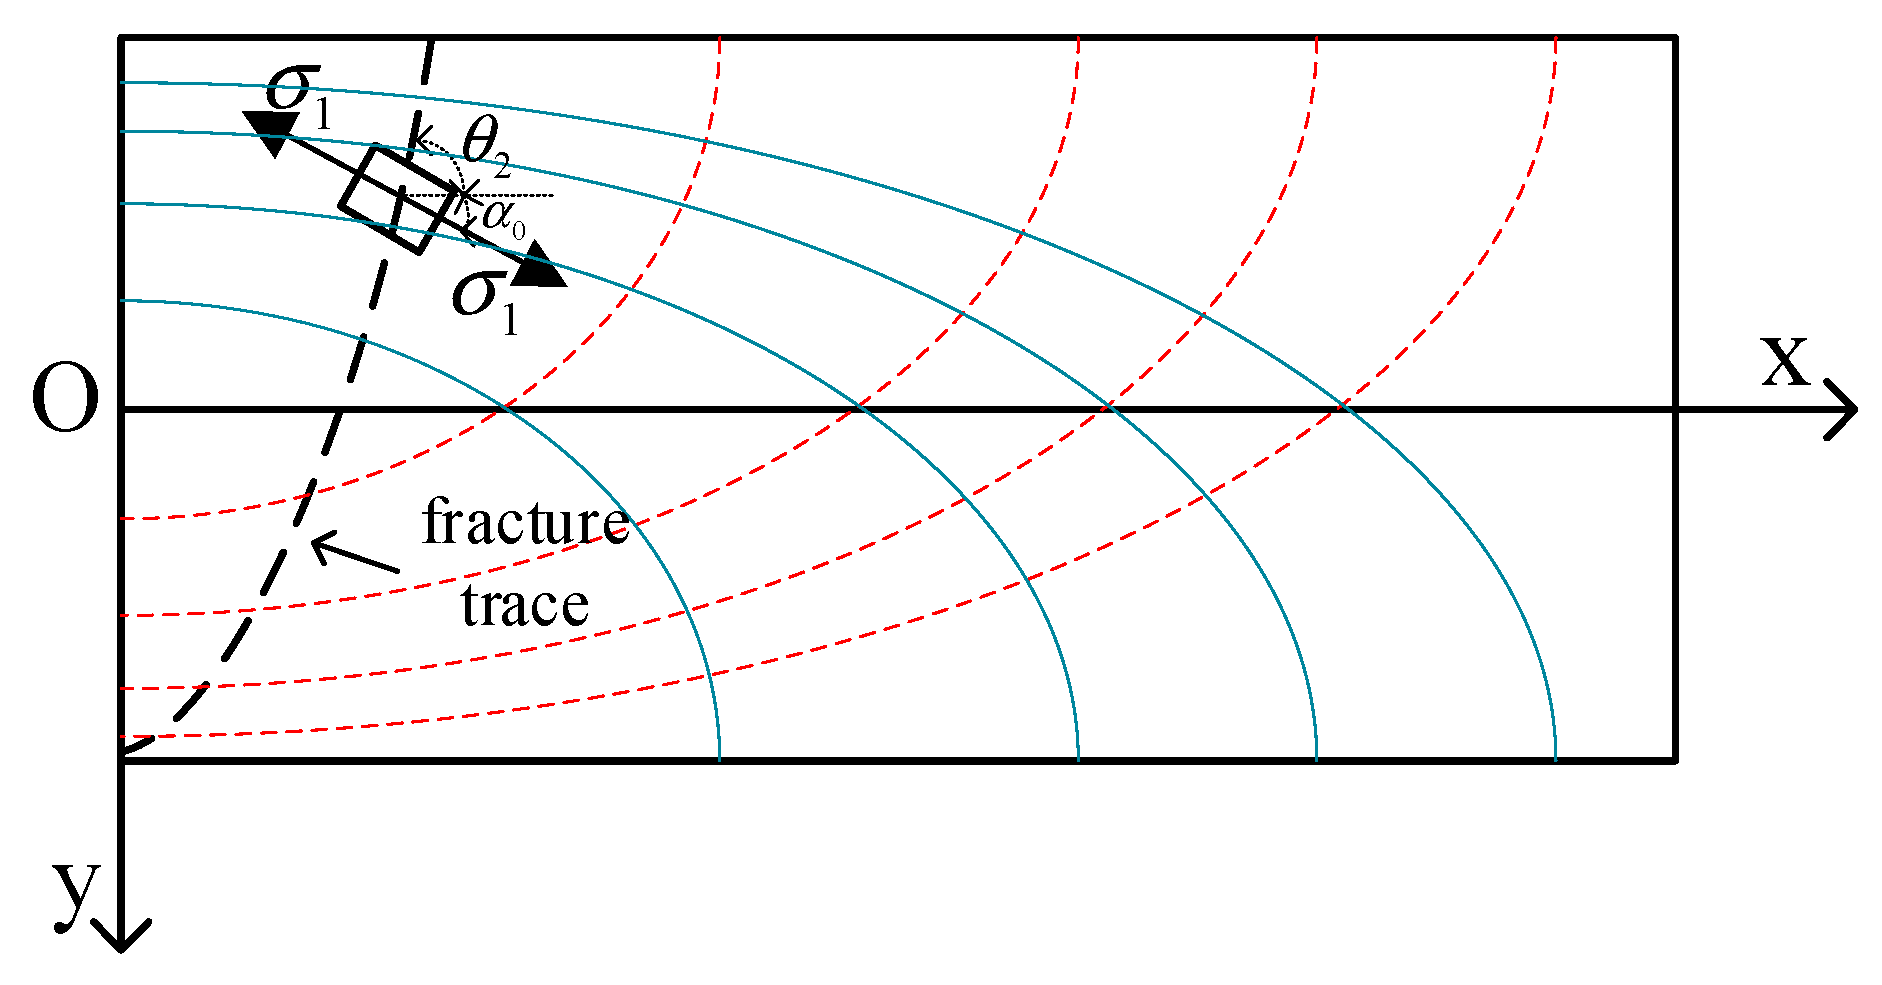
2.4. Solving the Key Strata Breakage Distance and Angle Based on the First Strength Theory

Due to coal seam mining, the main roof is prone to tensile damage when the main roof first shows some inclined cracks at the edge of the tensile area on both sides of the embedded end, causing the rock under the main roof to collapse. The angle of inclination of fracture inversions and fracture traces in the bedrock on the main roof plays a decisive role in the extent of damage to key strata in the overburden. The larger the fracture inversion step of each strata in bedrock, or the smaller the angle between the fracture trace and horizontal plane, the smaller the breakage damage of key strata in overlying rock, and the smaller the influence range of surface subsidence [37]. Therefore, the analysis of the formation of bedrock fracture inversion steps and the inclination angle of each fracture trace is necessary to accurately predict the internal movement boundary of the overlying rock strata and the extent of surface subsidence [31], and the results are shown in Figure 7.
According to the theory of maximum principal stress, it is known that rocks are usually resistant to compression but not to tension. The main influencing factor for the fracture of the rock formation is the maximum principal stress, and the rock formation will break in tension along the direction perpendicular to the principal stress. According to the distribution regulation of the primary tensile stress, the fracture trace of the threshold rock formation can be determined [38].
According to the relationship between the principal stress and the stress components, the principal tensile stress  σ 1  and the principal compressive stress  σ 3  at any point can be obtained:
σ 1 = σ x + σ y 2 + ( σ x σ y 2 ) 2 + τ 2 x y σ 3 = σ x + σ y 2 ( σ x σ y 2 ) 2 + τ 2 x y
For the thin plate model, the theoretical geometric equations of the thin plate are derived.
ε x = z 2 w x 2 ε y = z 2 w y 2 γ x y = 2 z 2 w x y
Derivation of the theoretical physical equations for thin plates leads to
σ x = E z 1 μ 2 ( 2 w x 2 + μ 2 w y 2 ) σ y = E z 1 μ 2 ( 2 w y 2 + μ 2 w x 2 ) τ x y = E z 1 + μ ( 2 w x y )
Combining the physical equations of the thin plate with the expressions of principal tensile stress  σ 1  and principal compressive stresses  σ 3 , the distribution of principal tensile  σ 1  and principal compressive stresses  σ 3  in the thin plate during the initial and periodic fracture of the top plate is obtained. Since the roof plate was not destroyed before the initial fracture, the thin plate was the surrounding solid support model. The slat profile along the orientation of the thin top plate is plotted to obtain the first fracture principal tensile stress (blue line). The principal compressive stress (red dashed line) is symmetrically distributed about the neutral axis of the slat. The principal tensile and principal compressive stresses are perpendicular to each other at any point. The main compressive stress is near the upper edge of the slat, the main tensile stress is near the lower edge of the slat, and the main tensile stress shows a “funnel-shaped” inclined distribution on both sides of the slat. The results are shown in Figure 8.
After the initial fracture of the roof plate occurs, with the mining of the working face, a thin plate model with three sides solidly supported and one side supported is established. Meanwhile, the slat profile along the strike of the thin top plate is drawn to obtain a symmetric distribution of the principal tensile stress  σ 1  (blue line) and the principal compressive stress  σ 3  (red dashed line) in the top plate at cyclic fracture about the neutral axis of the slat. The main tensile stress is near the upper edge of the middle of the slat, the main compressive stress is near the lower edge of the middle of the slat, and the writing cracks are formed by the concentrated distribution of the main tensile stress in the slat, showing a “funnel-shaped” inclined distribution. The results are shown in Figure 9.
The angle between the principal tensile stress and the horizontal plane in the initial and periodic fractures is
α = 1 2 arctan ( 2 τ x y σ x σ y )
The angle between the fracture trace and the horizontal plane can be expressed as
θ = π 2 α = π 2 1 2 arctan ( 2 τ x y σ x σ y )

3. Dynamic Development of Key Strata Deflection

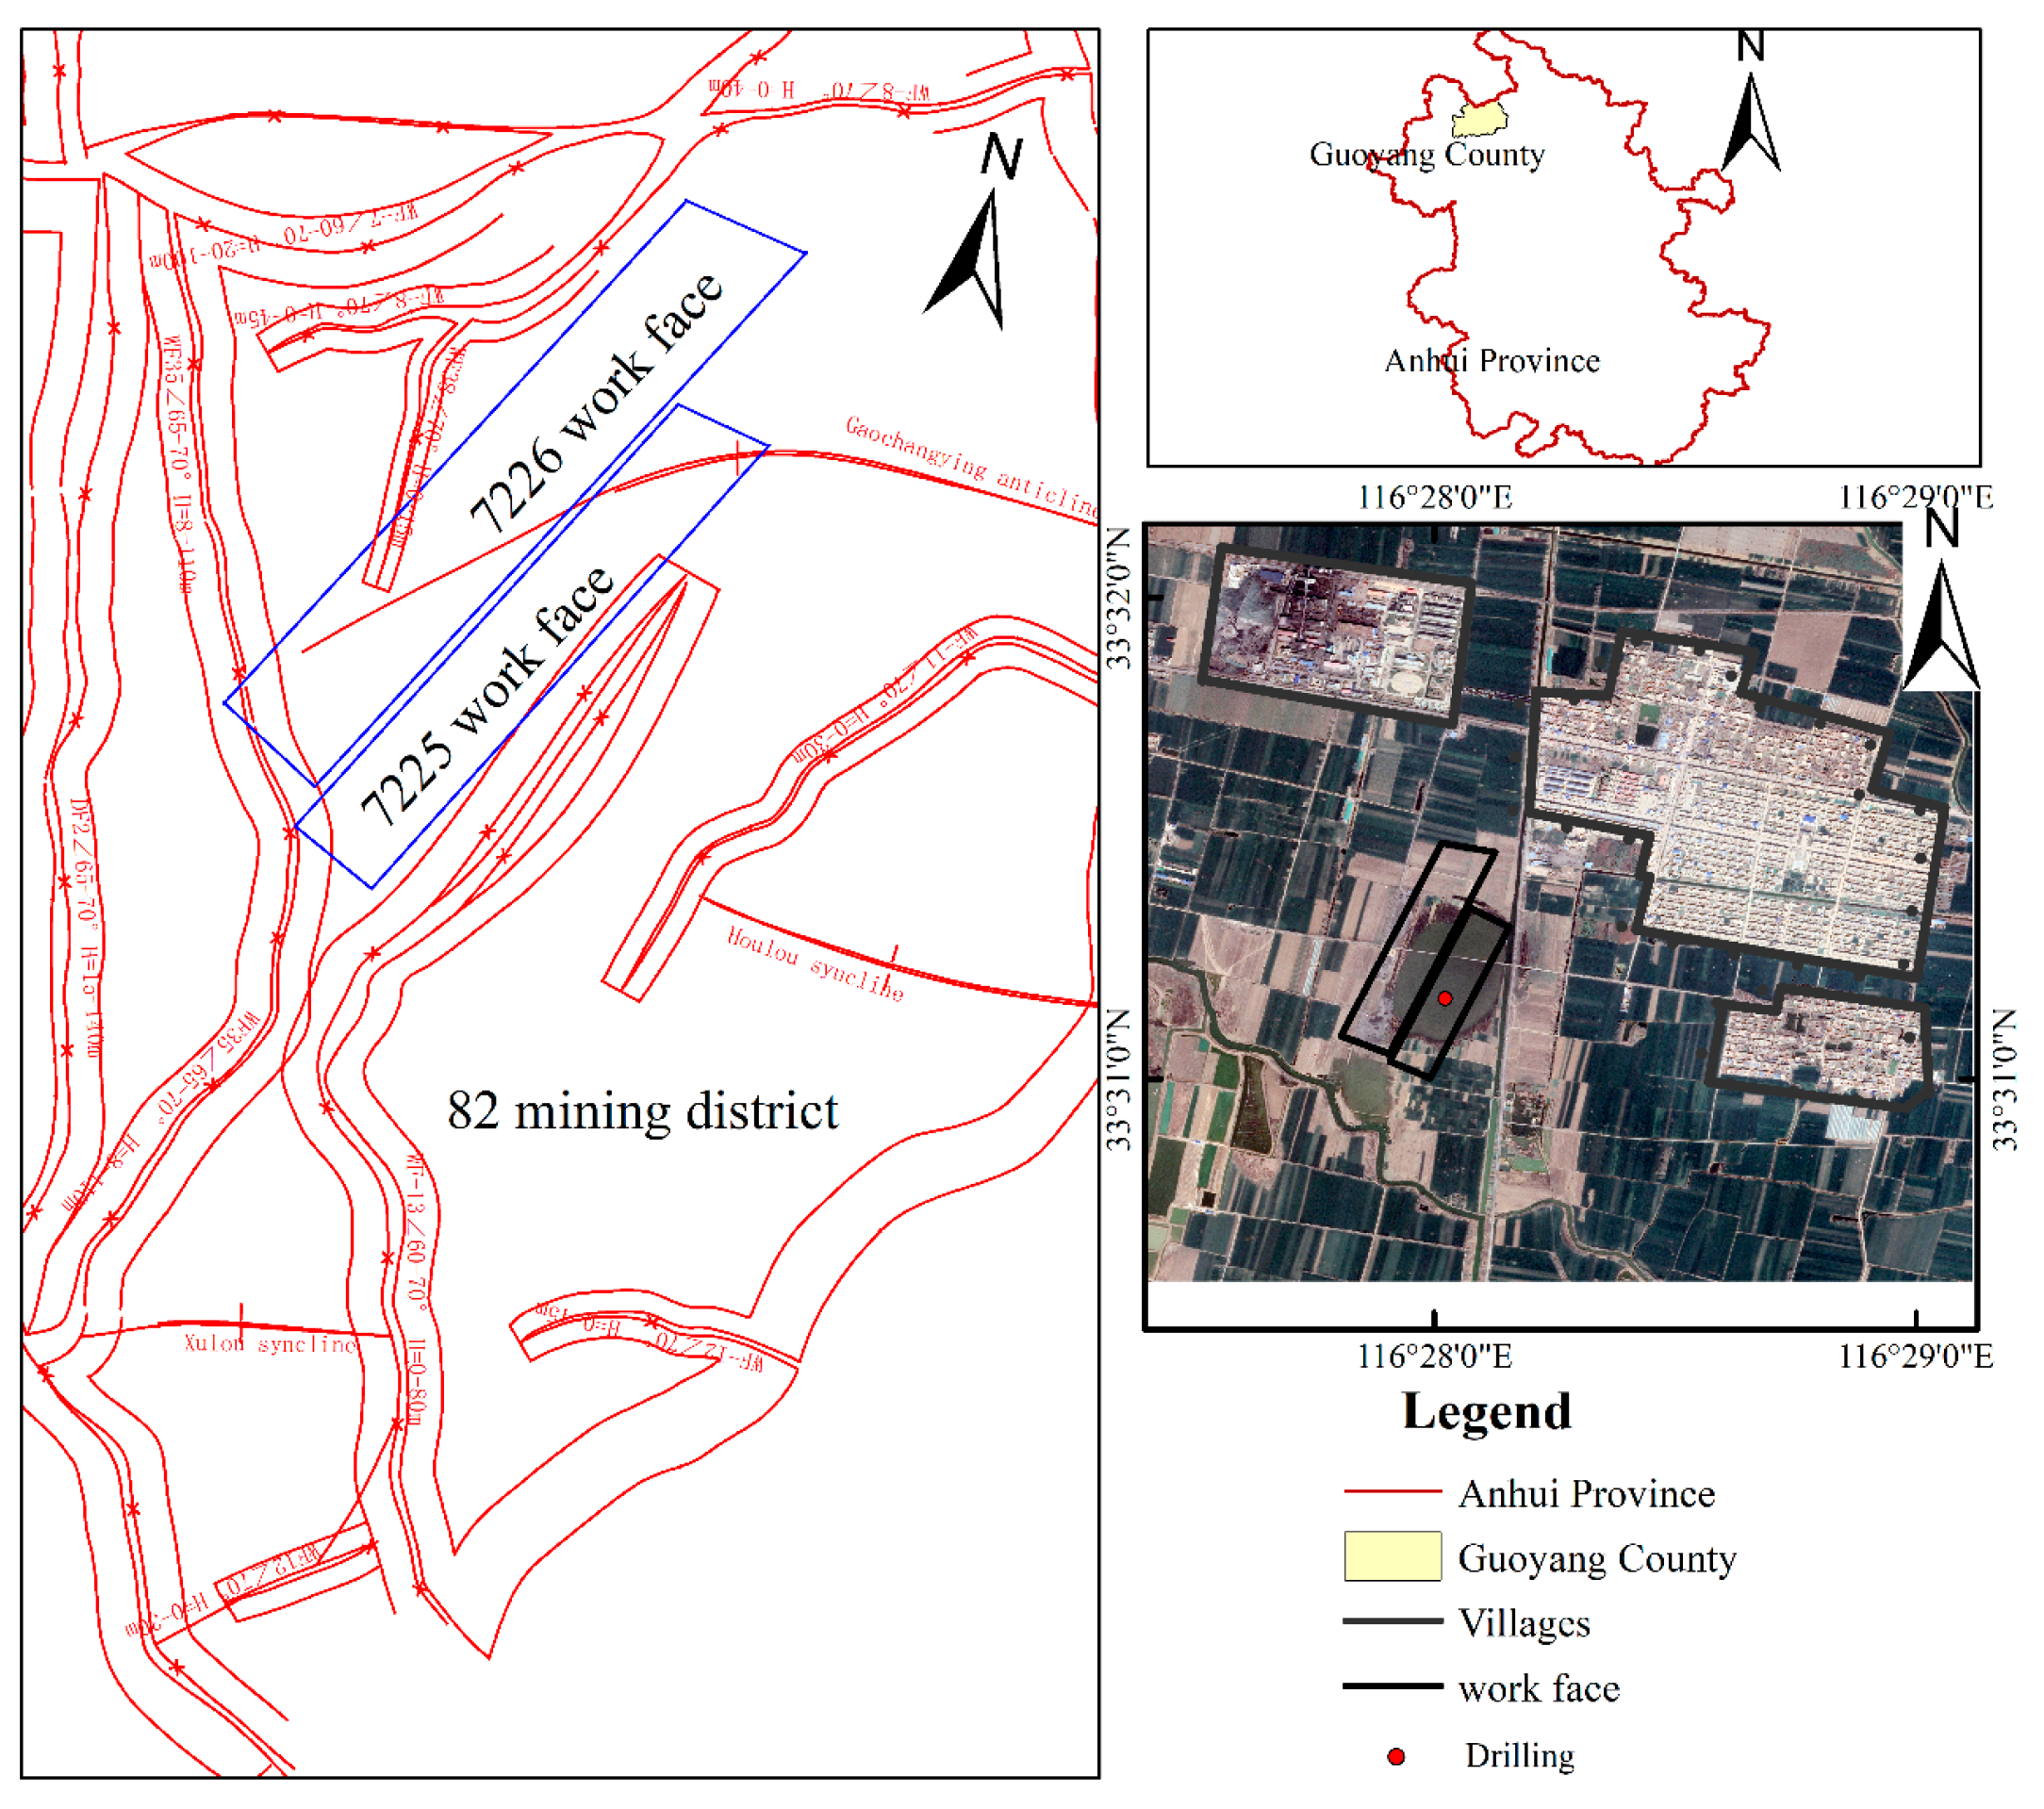
3.1. Engineering Geology Background

This study selects the 7225 working face in Huaibei, Anhui Province, with a strike length of 651 m, inclination length of 150 m, coal seam strike angle of 7.2°, an inclination angle of 8.1°, and coal seam mining thickness of 3.7 m. The elevation of the corner point of the working face cutting line and the uphill boundary is −410.8 m, the corner point of the finishing line and the downhill boundary line is −513.5 m, and the ground elevation is 28 m. The thickness of bedrock is 266.76 m, and the thickness range of thick loose strata is 172.04 m to 274.74 m. The spatial distribution and geological structure of the working face are shown in Figure 10.
As a result of the coal seam’s slant, the bedrock above the opening and closing line experiences a loose strata load with a variation in thickness of 102.7 m following the extraction of the coal seam over a considerable mining distance, with the results shown in Figure 11. If we disregard the impact of the coal seam inclination angle and consider the coal seam and overlaying rock strata as a horizontal plate, applying an approximately equal load throughout the entire plate will increase inaccuracy. The overburden load on the lower seam cannot be accurately estimated as perpendicular to the thin plate due to the degree of inclination of the coal seam. The angle of inclination of the coal seam will correspond to a similar angle in the system. The overburden load can be divided into two components: stresses perpendicular to the thin plate and stresses parallel to the thin plate’s central surface. The subsequent sections provide an analysis of the impacts associated with inclined coal seam mining and horizontal coal seam mining.
Analyze the rock distribution and physical properties of rock strata in a drill hole data above the working face and determine the distribution of key strata of bedrock above the working face. The information of each rock strata number, name, thickness, depth from the surface, rock strata classification schematic, and key strata distribution were obtained from drilling, as shown in Figure 12.
Concerning the physical properties of each rock strata in the actual borehole measured by the mine and related studies, the parameters of each rock stratum in the above borehole, such as density, tensile modulus, shear modulus, elastic modulus, cohesion, internal friction angle, and Poisson’s ratio, were obtained as shown in Table 1.

3.2. Deflection Function Based on Minimum Potential Energy Inclined Key Strata Thin Plate

The Equation of static equilibrium by elastic mechanics can be derived with the help of the principle of minimum potential energy. The expression of minimum potential energy is:
E p = U W
where U denotes the strain energy of the thin plate, and W denotes the work by the external force on the thin plate.
In this paper, the strain energy of the inclined critical laminate is equal to the total strain energy under the combined action of lateral load and mid-plane force, which can be expressed as
U + U 1 + U 2 = D 2 0 a 0 b ( 2 w x 2 + 2 w y 2 ) 2 d x d y + 1 2 h E [ N x 2 + N y 2 2 μ N x N y ] d x d y + [ N x u x x + N y u y y ] d x d y + 1 2 [ N x ( w x ) 2 + N y ( w y ) 2 ] d x d y
When the inclined key strata of the thin plate under the elastic foundation, consider the foundation reaction force work, then the external force on the thin plate work is equal to the lateral load and flexible foundation combined force in the vertical direction with the plate work and the work of the troops in the mid-plane along the horizontal path of the plate.
The work by the lateral load and the elastic foundation combined force can be expressed as
W v = 0 a 0 b [ q 1 + ( q 2 q 1 ) x sin ( α _ S t r i k e ) + y sin ( α _ D i p ) a sin ( α _ S t r i k e ) + b sin ( α _ D i p ) ] w d x d y 0 a 0 b k w 2 d x d y + 0 a 0 b N ( 2 w x 2 + 2 w y 2 ) 2 d x d y
The work by the mid-plane force along the mid-plane can be expressed as
W h = 1 2 h E [ N x 2 + N y 2 2 μ N x N y ] d x d y + [ N x u x x + N y u y y ] d x d y
The principle of minimum potential energy states that the actual displacement always makes the total potential energy take the minimum value among all displacements satisfying the displacement boundary. Therefore, the actual displacement should make the total potential energy zero.
E p = D 2 0 a 0 b ( 2 w x 2 + 2 w y 2 ) 2 d x d y + 1 2 [ N x ( w x ) 2 + N y ( w y ) 2 ] d x d y + 0 a 0 b k w 2 d x d y 0 a 0 b N ( 2 w x 2 + 2 w y 2 ) 2 d x d y 0 a 0 b [ q 1 + ( q 2 q 1 ) x sin ( α _ S t r i k e ) + y sin ( α _ D i p ) a sin ( α _ S t r i k e ) + b sin ( α _ D i p ) ] w d x d y

3.2.1. Four-Sided Solid-Supported Inclined Key Strata Plate Deflection before Initial Fracture

Assume that the deflection function for the bending of a solidly supported thin plate around the perimeter is
w = A m n [ 1 cos ( 2 π x a ) ] [ 1 cos ( 2 π y b ) ]
Strain energy by combined lateral load and mid-plane force in an inclined key strata thin plate model with four-sided solid-supported before initial fracture.
D 2 0 a 0 b ( 2 w x 2 + 2 w y 2 ) 2 d x d y = 2 D π 4 a b A m n ( 3 a 4 + 2 a 2 b 2 + 3 b 4 )
1 2 [ N x ( w x ) 2 + N y ( w y ) 2 ] d x d y = 3 A m n 2 π 2 ( N x b 2 + N y a 2 ) 2 a b
The work by the overlying load transfer model to calculate the work by the overlying load during the bending deformation of the inclined key strata.
0 a 0 b [ q 1 + ( q 2 q 1 ) x sin ( α _ S t r i k e ) + y sin ( α _ D i p ) a sin ( α _ S t r i k e ) + b sin ( α _ D i p ) ] w d x d y = 1 2 A m n a b ( q 1 + q 2 )
The inclined key strata lamellae are subjected to reaction forces in the elastic foundation to do work as
0 a 0 b k w 2 d x d y + 0 a 0 b N x ( 2 w x 2 + 2 w y 2 ) 2 d x d y = 9 A m n 2 a b k 4 3 A m n 2 N x π 2 ( a 2 + b 2 ) a b
The total potential energy in the four-sided solid-supported inclined key strata model is
E p = 3 A m n 2 π 2 ( N x b 2 + N y a 2 ) 2 a b + 2 D π 4 a b A m n 2 ( 3 a 4 + 2 a 2 b 2 + 3 b 4 ) + 9 A m n 2 a b k 4 + 3 A m n 2 N π 2 ( a 2 + b 2 ) a b 1 2 A m n a b ( q 1 + q 2 )
By the principle of minimum potential energy, when  E p A m n = 0 , the deflection coefficient of the solidly supported inclined plate deflection is
A m n = a 2 b 2 ( q 1 + q 2 ) [ 8 π 4 a 2 b 2 D ( 3 a 4 + 2 a 2 b 2 + 3 b 4 ) + 9 a 2 b 2 k + 12 N π 2 ( a 2 + b 2 ) + 6 π 2 ( N x b 2 + N y a 2 ) ]

3.2.2. Three-Side Solid-Supported and One-Side Simple-Supported Inclined Key Strata Plate Deflection before Periodic Fracture

Assume that the deflection function of a three-sided solid-supported and one-sided simple-supported thin plate deflection is
w = A m n ( x a ) [ 1 cos ( 2 π x a ) ] [ 1 cos ( 2 π y b ) ]
Strain energy by combined lateral load and mid-plane force in a three-sided solid-supported and one-sided simple-supported thin plate model before periodic fracture.
D 2 0 a 0 b ( 2 w x 2 + 2 w y 2 ) 2 d x d y = A m n 2 D π 2 [ b 4 ( 45 + 24 π 2 ) a 2 b 2 ( 6 16 π 2 ) + a 4 ( 24 π 2 45 ) ] 12 a 3 b 3
1 2 [ N x ( w x ) 2 + N y ( w y ) 2 ] d x d y = A m n 2 ( 8 N x π 2 b 2 3 N x b 2 + 8 N y π 2 a 2 15 N y a 2 ) 16 a b
The overlying load transfer model does the work to calculate the work by the overlying load during the bending deformation of the inclined key strata.
0 a 0 b [ q 1 + ( q 2 q 1 ) x sin ( α _ S t r i k e ) + y sin ( α _ D i p ) a sin ( α _ S t r i k e ) + b sin ( α _ D i p ) ] w d x d y = A m n a b ( 6 a sin ( α _ S t r i k e ) ( q 1 q 2 ) + a π 2 sin ( α _ S t r i k e ) ( 2 q 1 + 4 q 2 ) + 3 π 2 b sin ( α _ D i p ) ( q 1 + q 2 ) ) 12 π 2 ( a sin ( α _ S t r i k e ) + b sin ( α _ D i p ) )
The inclined key strata lamellae are subjected to reaction forces in the elastic foundation to do work as
0 a 0 b k w 2 d x d y + 0 a 0 b N ( 2 w x 2 + 2 w y 2 ) 2 d x d y = 3 A m n 2 a b k ( 8 π 2 + 15 ) 32 π 2 A m n 2 N [ a 2 ( 8 π 2 15 ) + b 2 ( 8 π 2 3 ) ] 8 a b
The total potential energy in the three-sided solid-supported one-sided simple-supported inclined key strata thin plate model is
E p = A m n 2 D π 2 [ b 4 ( 45 + 24 π 2 ) + a 2 b 2 ( 16 π 2 6 ) + a 4 ( 24 π 2 45 ) ] 12 a 3 b 3 + A m n 2 ( 8 N x π 2 b 2 3 N x b 2 + 8 N y π 2 a 2 15 N y a 2 ) 16 a b + A m n 2 N [ a 2 ( 8 π 2 15 ) + b 2 ( 8 π 2 3 ) ] 8 a b A m n a b ( 6 a sin ( α _ S t r i k e ) ( q 1 q 2 ) + a π 2 sin ( α _ S t r i k e ) ( 2 q 1 + 4 q 2 ) + 3 π 2 b sin ( α _ D i p ) ( q 1 + q 2 ) ) 12 π 2 ( a sin ( α _ S t r i k e ) + b sin ( α _ D i p ) ) + 3 A m n 2 a b k ( 8 π 2 + 15 ) 32 π 2
By the principle of minimum potential energy, when  E p A m n = 0 , the deflection coefficient of three-sided solid-supported and one-sided simple-supported is
A m n = 4 a 4 b 4 ( 6 a sin ( α _ S t r i k e ) ( q 1 q 2 ) + a π 2 sin ( α _ S t r i k e ) ( 2 q 1 + 4 q 2 ) + 3 π 2 b sin ( α _ D i p ) ( q 1 + q 2 ) ) / a sin ( α _ S t r i k e ) + b sin ( α _ D i p ) 8 D π 4 [ b 4 ( 45 + 24 π 2 ) + a 2 b 2 ( 16 π 2 6 ) + a 4 ( 24 π 2 45 ) ] + 6 π 2 a 2 b 2 ( 8 N x π 2 b 2 3 N x b 2 + 8 N y π 2 a 2 15 N y a 2 ) + 9 a 4 b 4 k ( 8 π 2 + 15 ) + + 12 a 2 b 2 π 2 N [ a 2 ( 8 π 2 15 ) + b 2 ( 8 π 2 3 ) ]

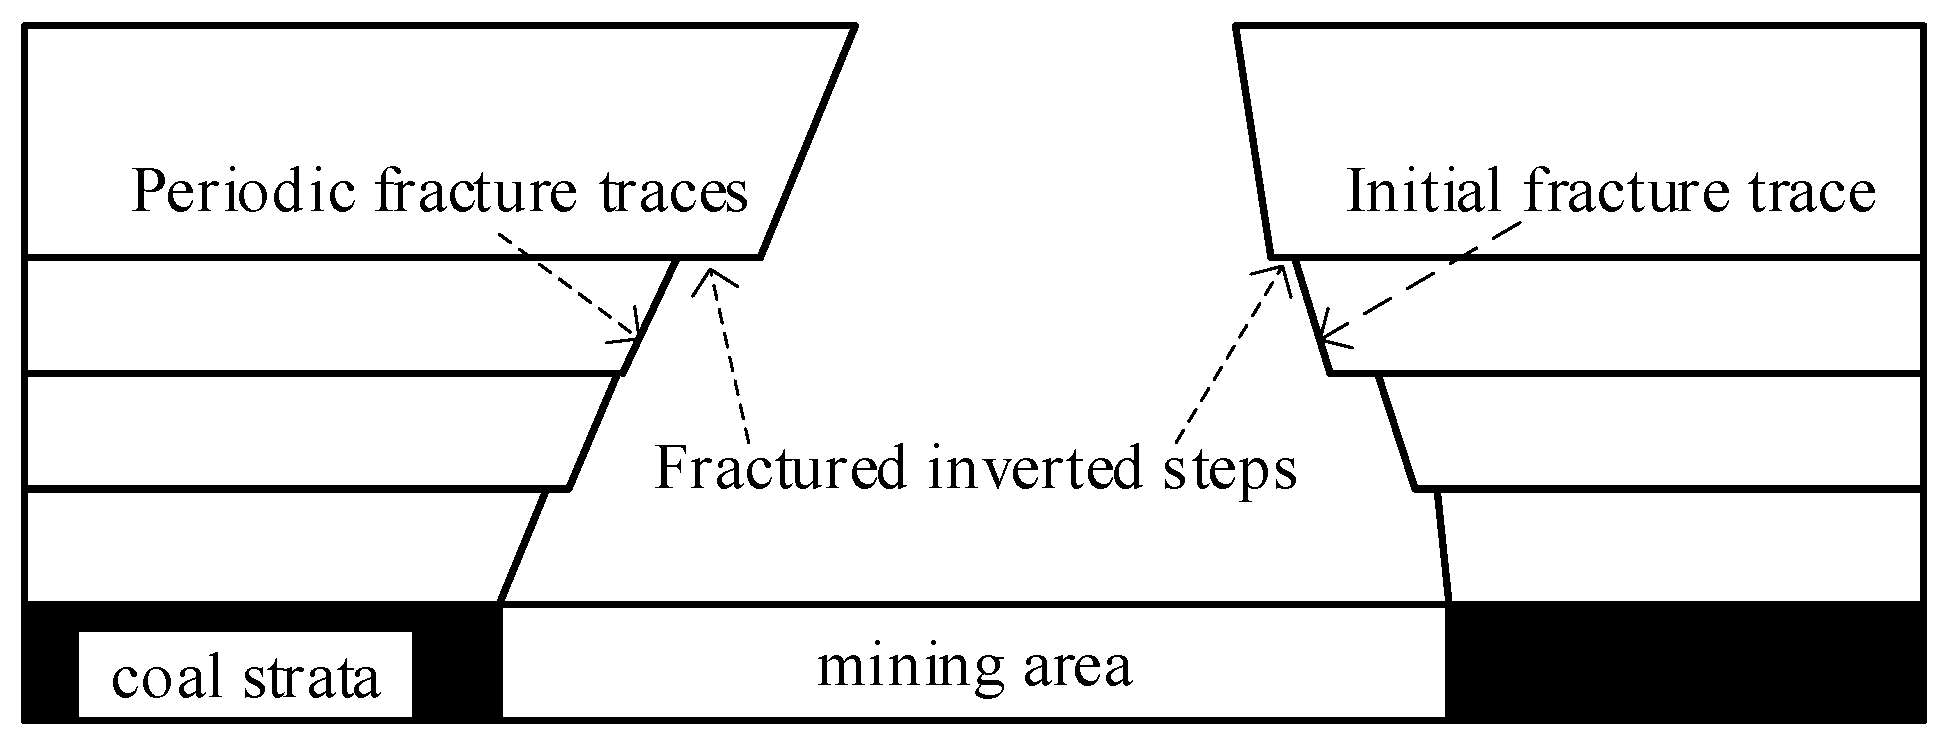
3.3. Calculation of Inclined Key Strata Breaking Distance and Fracture Trace Angle

The direct top collapse is performed without foundation support as the coal seam below the main roof is mined. Thus, the elastic foundation reaction force integral term is removed, and the angle between the main roof’s initial and periodic breakage distance and the fracture trace is calculated. Regarding the development of the key strata under the Bed-separation and no foundation support, the overlying key strata’s limit break distance and the fracture trace’s angle are calculated. By the principle of minimum potential energy, assume that the mining length of the working face is  L _ b r o k e n , and the overlying load on the inclined plate is
q 1 = q 1 q 2 = q 1 + ( q 2 q 1 ) L _ b r o k e n sin ( α _ S t r i k e ) + b sin ( α _ D i p ) a sin ( α _ S t r i k e ) + b sin ( α _ D i p )
The deflection coefficient of the four-sided solid-supported inclined key strata thin plate model is
A m n = L _ b r o k e n 2 b 2 ( q 1 + q 2 ) [ 8 π 4 L _ b r o k e n 2 b 2 D ( 3 L _ b r o k e n 4 + 2 L _ b r o k e n 2 b 2 + 3 b 4 ) + 6 π 2 ( N x b 2 + N y L _ b r o k e n 2 ) ]
The deflection coefficient of the three-sided solid-supported one-sided simple-supported inclined key strata thin plate model is
A m n = 4 L _ b r o k e n 4 b 4 ( 6 L _ b r o k e n sin ( α _ S t r i k e ) ( q 1 q 2 ) + π 2 L _ b r o k e n sin ( α _ S t r i k e ) ( 2 q 1 + 4 q 2 ) + 3 π 2 b sin ( α _ D i p ) ( q 1 + q 2 ) ) / L _ b r o k e n sin ( α _ S t r i k e ) + b sin ( α _ D i p ) 8 D π 4 [ b 4 ( 45 + 24 π 2 ) + L _ b r o k e n 2 b 2 ( 16 π 2 6 ) + L _ b r o k e n 4 ( 24 π 2 45 ) ] + 6 π 2 L _ b r o k e n 2 b 2 ( 8 N x π 2 b 2 3 N x b 2 + 8 N y π 2 L _ b r o k e n 2 15 N y L _ b r o k e n 2 )
When the length of the coal seam mining area reaches the breaking distance limit, the main roof’s principal stress is equal to the measured ultimate tensile stress of the main roof borehole. From the calculation formula of the principal tensile stress and the deflection coefficient of the thin plate, it is known that
σ t e n s i l e = σ x + σ y 2 + ( σ x σ y 2 ) 2 + τ 2 x y = 2 π 2 E h A m n ( 1 1 + μ ( 1 L _ b r o k e n 2 1 b 2 ) 1 1 μ ( 1 L _ b r o k e n 2 + 1 b 2 ) )
After the breakage distance of initial breakage and periodic breakage is known, the breakage angle can be calculated by substituting the formula.
θ = π 2 1 2 arctan ( 2 τ x y σ x σ y ) = π 2 1 2 arctan ( 2 ( 1 μ ) 2 w x y 2 w y 2 2 w x 2 )
As the working face is mining, the angle between the fracture trace and the horizontal plane, when the solid-supported inclined thin plate is initially broken around, is
θ _ i n i t i a l = π 2 1 2 arctan ( π 2 ( 1 μ ) L _ b r o k e n _ s o l i d ( 1 + μ ) b ( 1 L _ b r o k e n _ s o l i d 2 + 1 b 2 ) )
When the working face continues mining, the three-sided solid-supported one-sided simple-supported periodically fracture; the angle between the periodic fracture trace and the horizontal plane is
θ _ p e r i o d i c = π 2 1 2 arctan ( ( 1 μ ) ( π 2 + 1 / 2 π 3 ) L _ b r o k e n _ s i m p l e ( 1 + μ ) b ( 1 L _ b r o k e n _ s i m p l e 2 + 1 b 2 ) )
Because of the rock layers’ complex composition, each key layer contains mudstone, coal seam, fine sandstone, siltstone, etc. The angle between the fracture traces of each rock strata and the horizontal plane is different. Each key strata is examined, and the angle between the fracture traces within the rock strata between the key strata and the averages simplifies the working surface. Assuming that the two key strata contain several n strata, the breakage distance and the angle between the fracture line and the working surface of each stratum have been calculated by Equations (54)–(56). The average angle between the fracture line and the working surface of the rock strata with the number of n layers between the two adjacent key strata is
θ _ i n i t i a l   a v e r a g e = 1 n H i 1 n H i / tan θ i _ i n i t i a l θ _ p e r i o d i c   a v e r a g e = 1 n H i 1 n H i / tan θ i _ p e r i o d i c
Referring to the construction process of the large-deflection inclined thin plate model, the flow chart of the model is shown in Figure 13.

4. Large-Deflection Inclined Thin-Plate Model to Calculate the Dynamic Development of Key Strata Deflections and Bed-Separation

The primary strata of interest within the extracted rock formations are the hard rock strata, which significantly influence the alteration of stress fields in each rock stratum due to coal seam mining and rock movement. When the primary layers experience displacement, the adjacent softer rock layers undergo deformation in tandem. Similarly, the overlying, softer rocks may incur complete or partial damage when the primary layers fracture. The strata of primary importance are organized hierarchically, extending from the work face to the surface. The uppermost strata in this hierarchy are called the principal key strata, while the remaining are classified as key strata. Coal seam mining operations often result in varying degrees of deflection, which can be attributed to the disparities in the elastic modulus, load-bearing capacity, and foundation support conditions of individual important strata.
Consequently, this leads to a bed separation underneath each stratum. A study on mining inclined coal seams established a large-deflection inclined thin-plate model for each key strata. The objective was to investigate these key strata’s dynamic growth pattern of deflection and bed separation.
Set the corner point of 7225 work face in the direction of the open cutting line and inclined uphill as the origin of the regional coordinate system, the direction of work face mining advance as the x-axis, the tip pointing downhill from the work face as the y-axis, and the direction perpendicular to the xOy plane and pointing to the surface as the z-axis. From the 7225 working face inclination parameters, it is known that compared with the 1954 Beijing coordinate system, the angle between the x-axis direction of the regional coordinate system and the horizontal plane is the working face strike inclination angle of 7.2°. The angle between the y-axis direction of the regional coordinate system and the horizontal plane is the working face inclination downhill slope of 8°.

4.1. Breakage of the Main Roof and the “Vertical Three Zones” Height Development

Liu Tianquan put forward the theory of “vertical three belts” of rock movement from horizontal and vertical directions and initially elaborated on the law of overall breakage and movement of rock strata. The vertical direction divides the overlying rock strata of the mining area into, from bottom to top: caved zone, fractured zone, and continuous bending zone [39]. Similarly, McNally et al. divided the overburden of the coal seam into “three zones” after mining, replacing the continuous bending zone with the elastic zone [40]. Forster divided the overlying rock strata into “four zones”, which are caved zone, fractured zone, mobile continuous bending zone, and topsoil layer. Holla et al. divided the overlying rocks into “four zones”, called the complete caved zone, fractured zone, expansion zone, and mobile continuous bending zone [41]. Forster estimates the height of the entire caved zone as 5 times the mining thickness and the development of the fractured zone as 21 to 33 times the mining thickness. Chinese scholars give the empirical formula for calculating the height of the caved zone, a function related to the mining thickness and the rock expansion coefficient of the caved zone. The procedure for calculating the height of the caved zone in practice is as follows:
h _ c a v e d   z o n e = m ( k 1 ) cos α
The caved zone and the fissured zone are called two zones, also called the water-conducting fissured zone, and the water in the two zones can flow into the mining area with the fissures. It is essential to study the development height of the hydraulic fractured zone when carrying out Bed-separation grouting and filling mining, which must be designed to avoid slurry flow from the fractured zone into the mining area. The formula for calculating the fractured zone height in practice is
h _ f r a c t u r e d   z o n e = 100 m 1.6 m + 3.6 ± 5.6
During the initial stages of mining operations, the primary roof undergoes tensile stress and surpasses its maximum tensile strength, resulting in tensile failure in the main roof. This event marks the advancement of the working face up to the point of initial pressure exertion on the main roof. The main roof periodic pressure step refers to advancing the working surface distance following the first pressure on the main roof period, accompanied by stretch breaks. The main roof’s initial and recurrent pressure steps can be calculated by considering the initial and periodic braking distances of the large-deflection inclined thin-plate model of the main roof. Due to the predominance of soft rocks or thin layers of hard rocks in the uppermost strata of the primary roof, the tensile strength is diminished, resulting in a reduced braking distance compared to that of the main roof.
Consequently, the two roofs are prone to collapse simultaneously. The siltstone strata located in the 15th layer of the drill hole are situated at a distance of 49 m from the extraction region. These strata are found within the fractured zone, as determined by using the empirical formula for computation. Determining the height of fractured zone development involves the computation of the breakage distance of the primary layers, the fracture trace of the 15th siltstone stratum, and the average fracture trace of the overlaying rock strata. The utilization of the large deflection achieves this inclined thin-plate model. Table 2 presents the data regarding the braking distance, fracture trace, and coal seam angle of the primary strata and additional soft rock seams located in the bubble fall zone and fracture zone above the coal seam resulting from mining activities at the 7225 work face. The findings indicate that the initial separation distance between the key strata and the soft rocks exceeds the recurring distance. Additionally, the angle formed by the initial fracture trace and the coal seam is larger than that formed by the recurring fracture trace and the coal seam. The angular deviation between the initial and periodic fracture traces in soft rock formations is larger than the corresponding deviation in hard key strata.
According to the data in Table 2 and Figure 14, the results of the analysis are shown in Table 3, and the revealed height of the collapse zone in the overburden movement is 38.07 m after mining 7225 working face. Additionally, the fractured zone exhibits a development height of 41.13 m. The thick, loose layer was assumed to be laterally loaded, and the height of the overall bending zone was assumed to be the remaining height of the bedrock thickness minus the caved and fractured zones. The “Vertical Three Zones” heights calculated for the large-deflection inclined thin plate are included in the interval estimated by the empirical formulas, indicating that the model’s calculated values are highly accurate and meet the engineering requirements. The initial and periodic pressure steps of the main roof demonstrate a strong alignment with the measured pressure steps seen in the coal mine. This demonstrates that the model exhibits a significant level of precision and may be effectively utilized in examining primary roof pressure and the vertical extent of the “upper three zones”.
As the inclined working face descended, the rock strata within the collapsed zone experienced breakage and yielded. In contrast, the rock strata within the fractured zone underwent fragmentation, forming fractured inverted steps. The angle between the fracture trace resulting from the fracture inversion step and the inclined coal seam is determined by referencing Table 2. Figure 14 illustrates the schematic representation of the regional partitioning of the collapsed, fractured, and continuous bending zones above the mining area. Additionally, it depicts the progression of the deviated strata beneath the primary key strata within the continuous bending zone. The second layer of mudstone is situated directly above the coal seam, while the third layer consists of fine sandstone and serves as the primary roof over the coal seam.
Additionally, a section of the soft rocks between the fourth and fourteenth layers is encompassed within the collapsed zone. The fractured zone encompasses a portion of the soft rocks spanning from the 4th to the 14th strata, the siltstone found in the 15th stratum, and a section of the soft rocks extending from the 16th to the 23rd strata. The continuous bending zone encompasses several strata contributing to the overall surface area. Notably, the 24th strata consists of siltstone and is the third key. Additionally, the 39th strata comprises fine sandstone and is considered the principal key layer. Lastly, the 51st strata consists of thick, loose strata, further contributing to the overall composition of the region.
Within this context, it is observed that the fine sandstone present in the collapsed zone’s primary layer has bubbled. Similarly, the siltstone found in the primary layer of the fractured zone has experienced fracturing. Furthermore, the area beneath the bed separation zone has undergone compaction. The siltstone found in the third key strata, and the fine sandstone in the 39th principal key strata inside the continuous bending zone exhibit the presence of bed separation cavities beneath the principal key strata. Furthermore, these bed separation cavities below the principal key strata demonstrate a greater height and volume of development. Beneath the primary roof structure lies the secondary roof and the mining zone, which has seen a loss of support from the underlying elastic foundation. The Bed-separation voids inside the cracked zone undergo prompt compaction after their formation. When employing the energy technique to analyze the key strata inside the fractured zone, it is necessary to consider the contribution of the elastic foundation term to calculate the work performed and predict the deflection of the key strata. The elastic foundation work term can be eliminated using two essential techniques: creating Bed-separation cavities beneath each critical stratum inside the continuous bending zone and utilizing large-deflection inclined thin plate modeling.

4.2. Deflection of the Principal Key Strata and the Dynamics of the Height and Volume of Bed-Separation Development

With mining the 7225 work face, the initial fracture trace and the periodic fracture trace extend upward from the open cut line position from the main roof position to above the fractured zone. The starting position of each key strata in the continuous bending zone is  L _ S t a r t   C o o r d i n a t s y s t e m  from the origin, and the ending position of each key strata in the continuous bending zone is  L _ m i n i n g   d i s t a n c e L _ E n d   C o o r d i n a t s y s t e m . After the mining distance  L _ m i n i n g   d i s t a n c e  of the work face, as the 7225 work face takes Longwall mining, the bending width of the principal key strata sheet of the continuous bending zone and the inclined width of the work face is approximated as b. The actual bending length of the principal key strata sheet of the continuous bending zone is  L _ m i n i n g   d i s t a n c e L _ S t a r t   C o o r d i n a t s y s t e m L _ E n d   C o o r d i n a t s y s t e m .
With the known height of the caved zone and fractured zone and the angle between the fracture trace and the coal seam, it is concluded that after 96 m of mining, the fracture trace of the inverted step extends to the continuous bending zone, and the overall deflection of the continuous bending zone begins to appear. The Bed-separation cavity below the principal key strata is caused by the non-synchronous bending of the principal and third key strata.
Continuous bending zone key strata starting deflection position is equal to the quotient of the height of each key strata and soft rocks in the caved zone and the fractured zone with the tangent of the angle between the corresponding initial fracture trace and the coal seam:
L _ S t a r t   C o o r d i n a t s y s t e m = H K S 1 tan θ K S 2 _ i n i t i a l + h _ c a v e d   z o n e H K S 1 tan θ _ i n i t i a l   a v e r a g e + H K S 2 tan θ K S 2 _ i n i t i a l + h _ f r a c t u r e d   z o n e H K S 2 tan θ _ i n i t i a l   a v e r a g e
Continuous bending zone key strata ending deflection position is equal to the quotient of the height of each key strata and soft rocks in the caved zone and fractured zone with the tangent of the angle between the corresponding periodic fracture trace and the coal seam:
L _ E n d   C o o r d i n a t s y s t e m = H K S 1 tan θ K S 2 _ p e r i o d i c + h _ c a v e d   z o n e H K S 1 tan θ _ p e r i o d i c   a v e r a g e + H K S 2 tan θ K S 2 _ p e r i o d i c + h _ f r a c t u r e d   z o n e H K S 2 tan θ _ p e r i o d i c   a v e r a g e
The rock layers within the collapsed region are undergoing subsidence. In contrast, in the fractured region, the offsets are present for a shorter duration due to the fracturing and compression of the critical rock layers. In the context of work face mining, it is observed that the continuous bending zone above the coal seam consists of two significant strata: the 24th strata siltstone and the 39th strata fine sandstone. Among them, the 39th strata fine sandstone is the key stratum. The 24th strata siltstone, the third significant strata, is situated within the continuous bending zone and can be chosen as the primary strata for grout filling mining.
Nevertheless, the proximity of its lower section to the fractured zone raises concerns regarding the potential impact of high-intensity grouting activities on the soft rocks beneath the 24th stratum. This could lead to the inadvertent flow of slurry into the fractured zone and subsequently into the mining region, disrupting regular mining operations. Hence, this section primarily addresses the height and volume of the bed separation cavity beneath the key strata that undergo dynamic development during the mining process.
In order to investigate the correlation between the deflection of principal key strata, the dynamic development of bed separation, and the surface subsidence, we referred to the comprehensive observation data of surface observation points at work face 7225 and the corresponding mining line location. The research utilized the dates of 15 September 2015, 27 October 2015, 2 December 2015, 26 December 2015, and 15 April 2016, along with the matching working face mining distances. Table 4 presents the research date, which includes the mining distance of the working face, the location of the start and finish of deflection, the maximum deflection value, and the results of the deflection space volume of the primary essential strata. The maximum deflection value and the significance of the deflection space of the primary key strata exhibited a continual increase. After mining, the most excellent deflection value reached a magnitude of 2714 mm, creating a voluminous space measuring 56,485 m3.
Based on the deflection function of the key strata, the mining work face at depths of 135 m, 300 m, 414 m, 535 m, and 651 m exhibits deflection in the significant vital strata. This deflection is observed in the three-dimensional expansion of the regional coordinate system. The dynamic representation of these results is depicted in Figure 15, which showcases the time series of the deflection. When the distance between the working face and the mining area is 135 m, the primary key strata exhibit a maximum deflection value of 9.6 mm. The primary key strata do not exhibit discernible deflection. As the distance of work face mining rises, there is a corresponding increase in the deflection range of the primary key stratum, which expands rapidly in the downward direction.
Additionally, the maximum deflection value experiences a rapid increase. After excavating, the working face reaches a depth of 535 m; the primary key strata exhibit a maximum deflection value of 2683.2 mm. Furthermore, it is seen that the maximum deflection value experiences a gradual increase over time. At a mining depth of 651 m, when the working face intersects the closure line, the primary key strata exhibit a maximum deflection value of 2714 mm, thereby attaining its peak deflection.
The deflection curve of the Bed-separation below the principal key strata in the continuous bending zone is equal to the difference between the deflection curve of the third key strata and the deflection curve of the principal key strata:
w _ B e d   s e p a r a t i o n = ( A m n _ K S 3 A m n _ P K S ) [ 1 cos ( 2 π x L _ m i n i n g   d i s t a n c e L _ S t a r t   C o o r d i n a t s y s t e m L _ E n d   C o o r d i n a t s y s t e m ) ] [ 1 cos ( 2 π y b ) ]
The volume of the Bed-separation cavity below the principal key strata in the continuous bending zone can be obtained:
V _ B e d   s e p a r a t i o n = L _ S t a r t   C o o r d i n a t s y s t e m L _ m i n i n g   d i s t a n c e L _ S t a r t   C o o r d i n a t s y s t e m L _ E n d   C o o r d i n a t s y s t e m 0 b w _ B e d   s e p a r a t i o n   d x d y
The work face has a width of 7225 units and a length of 149 m, with a mining distance ranging from 0 m to 96 m. Within this range, the key strata exhibit continuous bending without any deflection. However, beyond a mining distance of 96 m, the key strata in the continuous bending zone experience deflection deformation. Figure 16 displays the maximum development height of the bed separation cavity underneath the primary key strata within the overlying rock of the 7225 workings to the mining distance. The absence of bed separation below the primary key strata is observed when the working face is advanced from 0 m to 96 m. The increase rate in the bed separation’s maximum height is significant, as it reaches a maximum value of 545.2 mm when the working face progresses from 96 m to 579 m. The vertical extent of the bed separation diminishes gradually as the working face progresses from a distance of 579 m to 651 m.
The dynamic variation results of the volume of the off-bed cavity below the principal key strata in the overlying rock strata caused by the 7225 working face mining distance are shown in Figure 17. When the working face advances from 0 m to 96 m, the volume of the Bed-separation cavity is 0 m3 because the Bed-separation is not developed below the principal key strata. As the mining distance increases from 96 m to 651 m, the volume of the Bed-separation cavity increases and reaches the maximum value of 11,228.1 m3 when the mining distance is 651 m.

4.3. Verification of the Principal Key Strata Deflection and Lower Delamination Accuracy Based on 3DEC

The rock consists of a fundamental continuum of rock blocks and non-continuous geological structure surfaces. In a non-equilibrium stress field, rocks can exhibit mechanical behavior like a continuous medium. The structural surfaces between individual rock pieces facilitate this mechanical interaction. When the structural surface experiences stress that exceeds its bearing capacity, the rock blocks exhibit vertical misalignment with each other. Three-dimensional Discrete Element Code (3DEC, v7.0) is a computational software for the numerical analysis of discontinuous models using the discrete element method, corresponding to the Mathematics Subject Classification (MSC) code number “65-04”.
The Mohr–Coulomb model has been selected as the intrinsic model for the rock blocks. The physical and mechanical properties used as input are listed in Table 1. These properties primarily consist of bulk weight, elastic modulus, tensile modulus, shear modulus, cohesion, internal friction angle, Poisson’s ratio, and others. The Mohr-Coulomb slippage model was chosen for the nodal ontogenetic model of the surface structure between the rock blocks. A discrete element model with three-dimensional characteristics is constructed, spanning from the uppermost plate of the 7225 working face to the surface. The model boundary is defined as the spatial extent of the basin undergoing surface movement. It is postulated that the vertical movement of the lower plate is negligible on the z-axis, and the force of gravity influences the surface. The velocity in the x and y-directions is zero, indicating the absence of any regular movement. The inside zone corresponds to the mining area encompassing the 7225 work face, where grid encryption measures are used. On the other hand, the exterior region refers to the non-mining area characterized by a somewhat lower density of grid placement. The transparent bottom plate was implemented to enhance the visibility of the coal seam excavation region, as depicted in Figure 18.
Similar to the depiction in Figure 16, the mining distance for the 7225 work face was intentionally set at distances of 300 m, 414 m, 535 m, and 651 m. Subsequently, a numerical simulation using the 3DEC software was conducted to assess the deflection of the primary critical strata. The findings are depicted in Figure 19, wherein the red hue represents the downward deflection of the key strata, the blue hue represents the upward uplift of the key strata, and the black rectangle box denotes the designated mining range of work face 7225. After excavating 300 m, the primary strata of interest located above the mining area are predominantly observed along the x-axis within the range of 0 m to 280 m. Notably, higher deflection values are observed near the open cut line, while two minor deflections are observed between 280 and 651 m. The primary strata above the active mining area are predominantly observed along the x-axis within the interval of 0 m to 349 m, following a mining depth of 414 m.
Nevertheless, these surfaces are linked to a pair of deflection structures close to the anticipated termination point of the primary geological layers above the active mining area. Following the extraction of 535 m, the primary strata above the active mining area exhibited a collective deflection, with the deflection surface extending farther downhill towards the 7225 work face. Upon extracting a total of 651 m, it has been observed that the primary strata above the 7225 working face exhibit a fully developed deflection surface. Furthermore, the boundary of this deflection surface extends towards the working face, displaying an inclination in the downhill direction. The extent of the deflection surface in the x-axis direction is limited to the boundary between the open cut line and the finish line. The 3DEC program simulates the deflection range of the major key strata above the 7225 working face in mining operations. The simulated deflection range closely aligns with the deflection value determined by the big deflection inclined thin plate model. The occurrence of inexplicable uplift outside the designated mining area for the 7225 work face can be attributed to the correctness of the deformation zone setup.

5. Impact of Bed-Separation under the Principal Key Strata

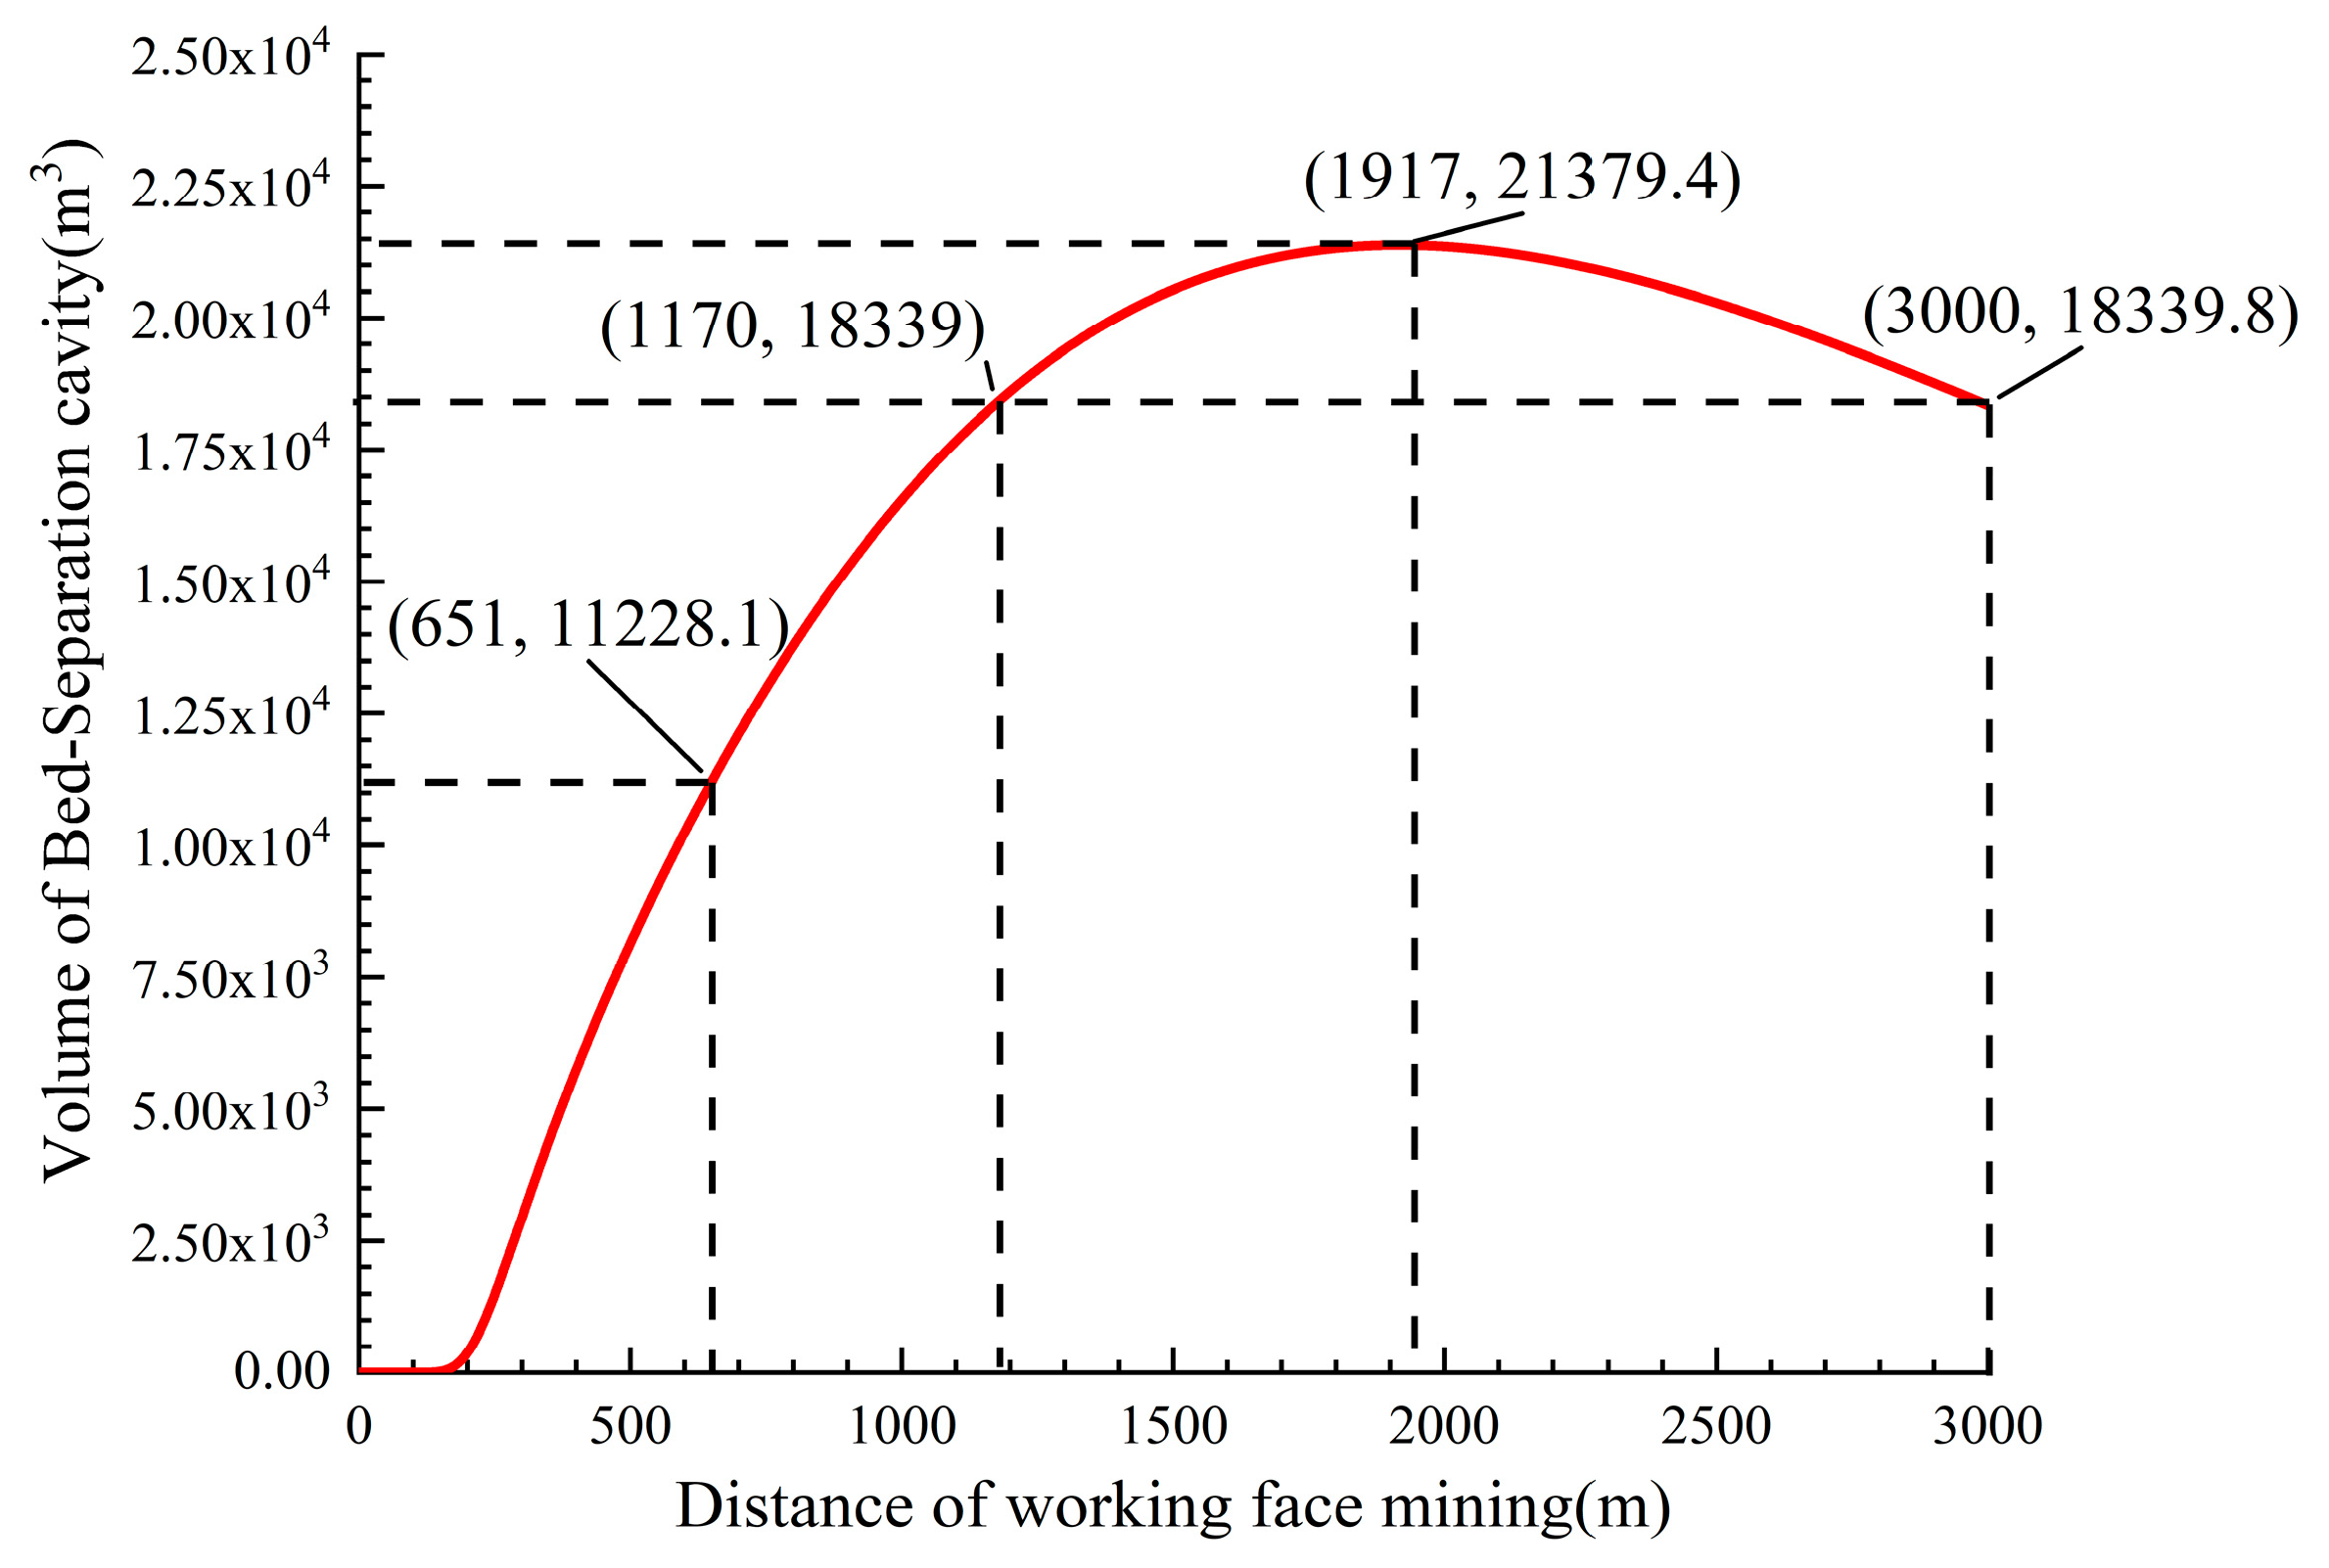
5.1. Influence of Work Face Mining Length on the Development Height and Cavity Volume of the Bed-Separation

The dynamically evolving nature of bed separation beneath the PKS horizons within the continuous bending zone leads to its non-development during the initial phase. Subsequently, the vertical distance between the bed separation experiences a notable escalation till it attains its furthest magnitude, coinciding with the extraction of the mining front. Following a specific time frame, the progressive expansion of mining distance continually increases the load exerted on the primary key strata. Additionally, the height of the lower bed separation gradually declines until it reaches a point of closure.
This study investigates the correlation between the maximum height of the bed separation development and the mining distance. It is anticipated that the mining operations will continue on the 7225 working face, and the mining distance of this working face will be extended to 3000 m. Figure 20 displays the outcomes of the diagram illustrating the fluctuations in the maximum height of the bed separation development to the primary key strata, as influenced by the mining distance. Once the mining distance of the working face surpassed 579 m, there was a gradual decrease in the development height of the bed separation under the primary important strata. The height of the bed separation development experienced a reduction to 169.4 mm upon reaching a mining distance of 3000 m.
Given the hypothetical scenario where the working face persists in its mining activities and decides to expand the mining distance to 3000 m, it is imperative to investigate the comprehensive correlation between the volume of the bed separation cavity and the mining distance. The findings are depicted in Figure 21. The volume of the bed separation cavity exhibits a progressive increase until it reaches its maximum value of 21,379.4 m3 when the mining distance of the working face is less than 1917 m. Subsequently, when the mining distance extends, there is a gradual reduction in the volume of the bed separation cavity. Specifically, at a mining distance of 3000 m, the volume of the bed separation cavity is observed to be 18,339.8 m3, which is equivalent to the volume observed at a mining distance of 1170 m.

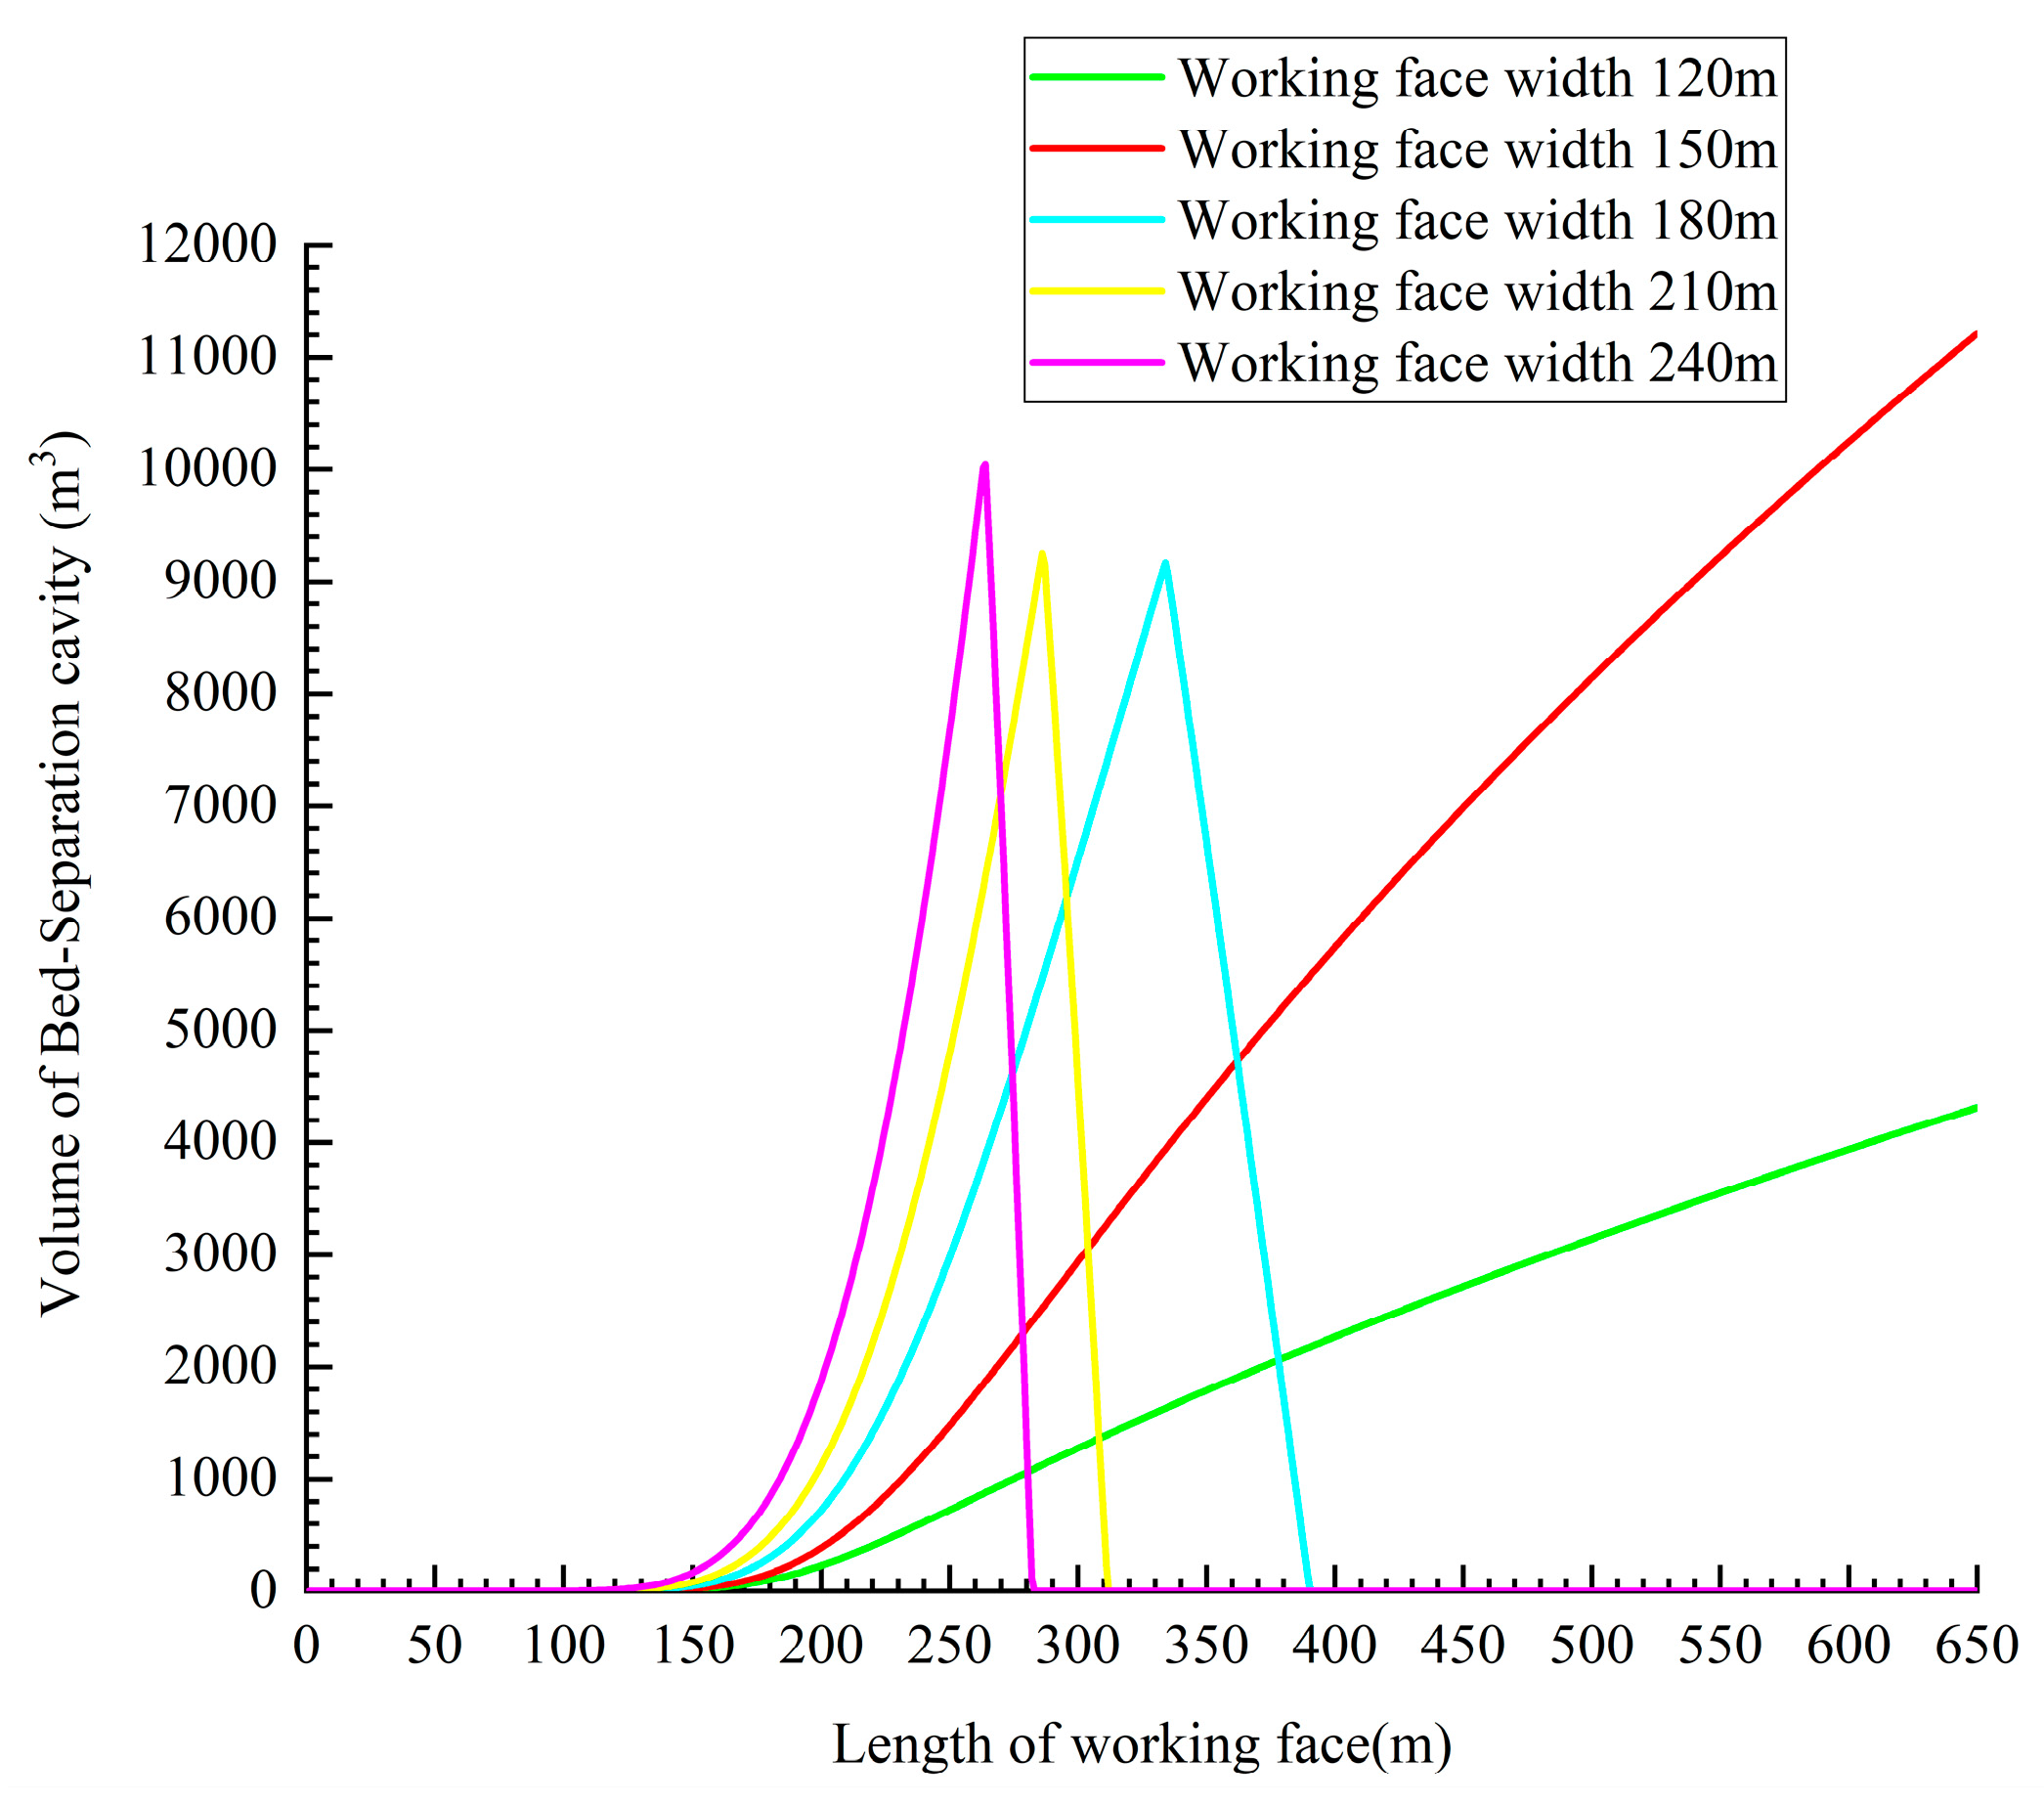
5.2. Influence of Working Face Width on the Development Height and Cavity Volume of the Bed-Separation

The utilization of various mining widths on the 7225 working face can lead to adequate and inadequate mining tendencies. Consequently, this will result in variations in the starting and ending positions of the main roof’s initial and periodic braking distances and the deflection caused by the thin plate of the principal key strata. These factors, in turn, will impact the height and volume of the cavity in the overlying bed separation that develops beneath the principal key strata. The design mining width of the 7225 working face is 150 m. It is hypothesized that the mining width might be 120 m, 180 m, 210 m, or 240 m. Table 5 displays the parameters encompassing the initial breaking distance, periodic breaking distance of the main roof, starting and ending position of the deflection of the principal key strata thin plate, as well as the height and cavity volume of the overlying Bed-separation of the principal key strata.
Based on the assumption that the mining length of the 7225 working face remains constant at 651 m, the correlation between the development height of the overlying Bed-separation under the principal key strata and various design mining widths is established using the large-deflection inclined thin plate model. The outcomes of this analysis are depicted in Figure 22. As the mining breadth expands to either 120 m or 150 m, the overlaying bed separation beneath the primary key strata undergoes continuous development as the mining length increases. When the mining width is reduced to 120 m, the growth rate of the overlaying stratum is seen to be slower compared to a mining width of 150 m. The maximum height of bed separation development is smaller in the former case. When the design mining width is set at 180 m, 210 m, or 240 m, the bed separation quickly develops and achieves its maximum height within a short distance after the major key strata above the 7225 working face deflect. Subsequently, when the displacement of the underlying key strata is sustained, the underlying rocks progressively support the primary key strata. The progressive obstruction and subsequent contraction of the bed separation ultimately culminate in its total closure underneath the PKS.
Based on the assumption that the mining length of the 7225 working face remains constant at 651 m, the correlation between the volume of the cavity in the overlying Bed-separation under the principal key strata and various design mining widths is established using the large-deflection inclined thin plate model. The findings are visually presented in Figure 23. As the width of the design reaches 120 m, an increase in the volume of the bed separation cavity located above the primary key strata is observed as the mining length progresses. However, the maximum volume is one-third of the volume achieved when the mining breadth is 150 m. When the design mining width is set at 180 m, 210 m, or 240 m, the development of the bed separation cavity occurs swiftly once the major key strata above the 7225 working face deflect. Furthermore, the volume of the cavity exceeds the mining width of 150 m until the mining length reaches 280 m. Nevertheless, after the delaminated cavity reached its maximum volume, the volume of the bed separation cavity rapidly decreased to zero due to the swift closure of the bed separation.

6. Conclusions

This study proposes a large-deflection inclined thin plate mechanics model for calculating PKS deflection and Bed-separation induced by an inclined working face mining activity covered by a thick loose layer. The model was applied to quantify and evaluate the dynamic development of Bed-separation during Longwall mining in the 7225 inclined workings of a mine in Anhui Province, China. As previously mentioned, this paper provides the following findings:
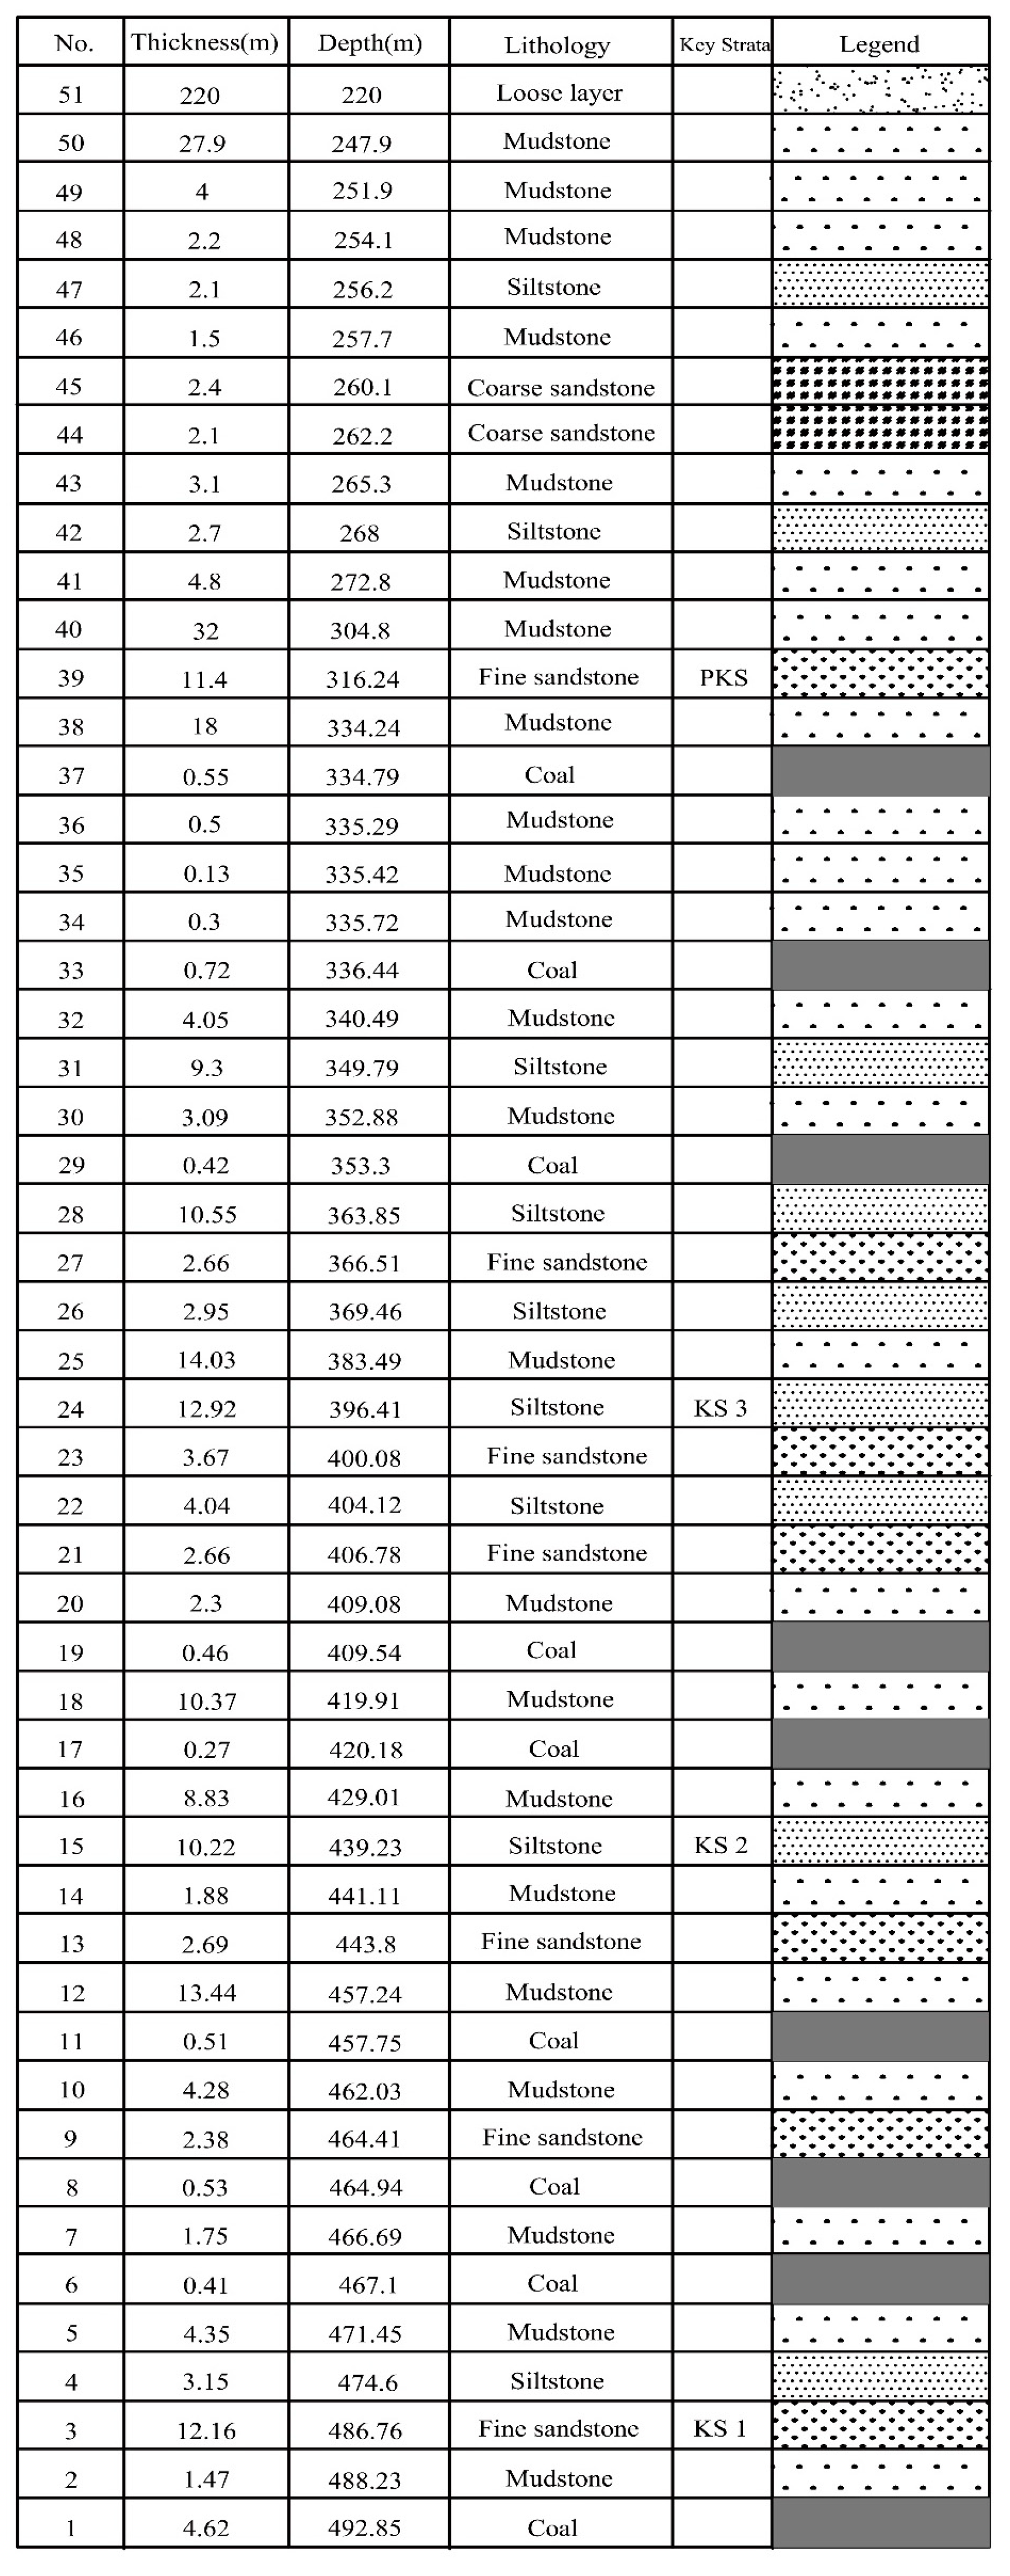
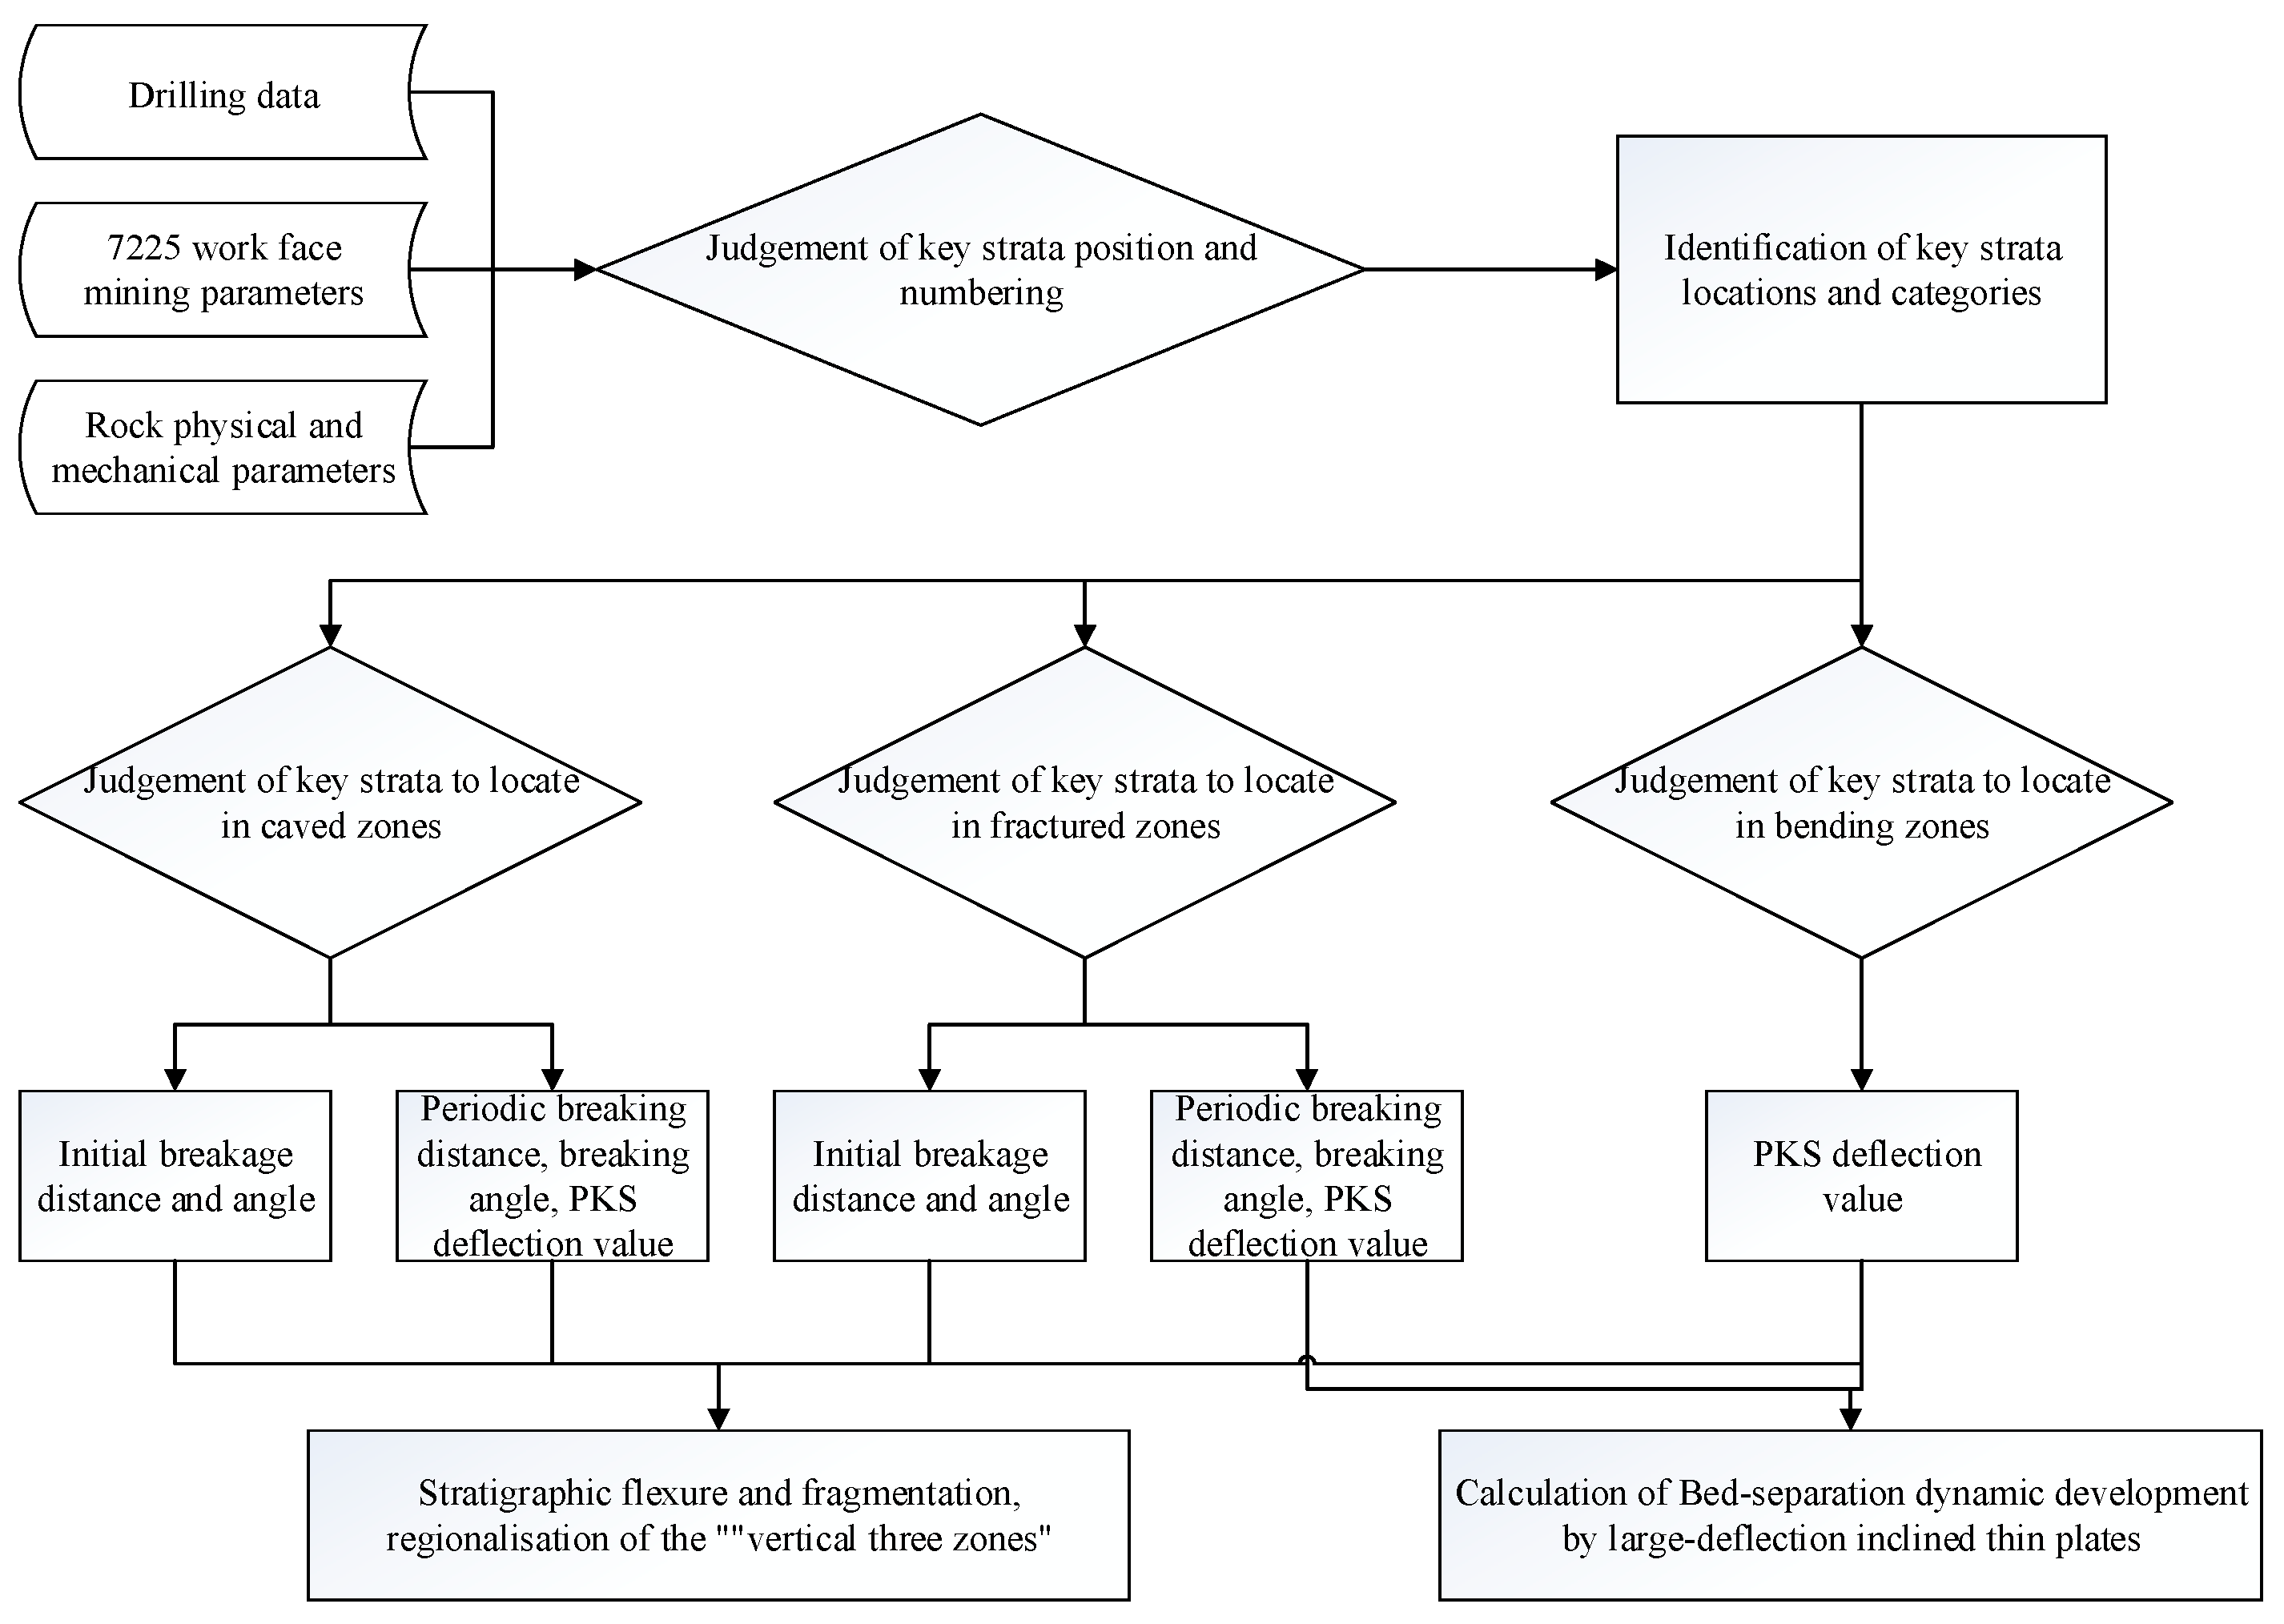
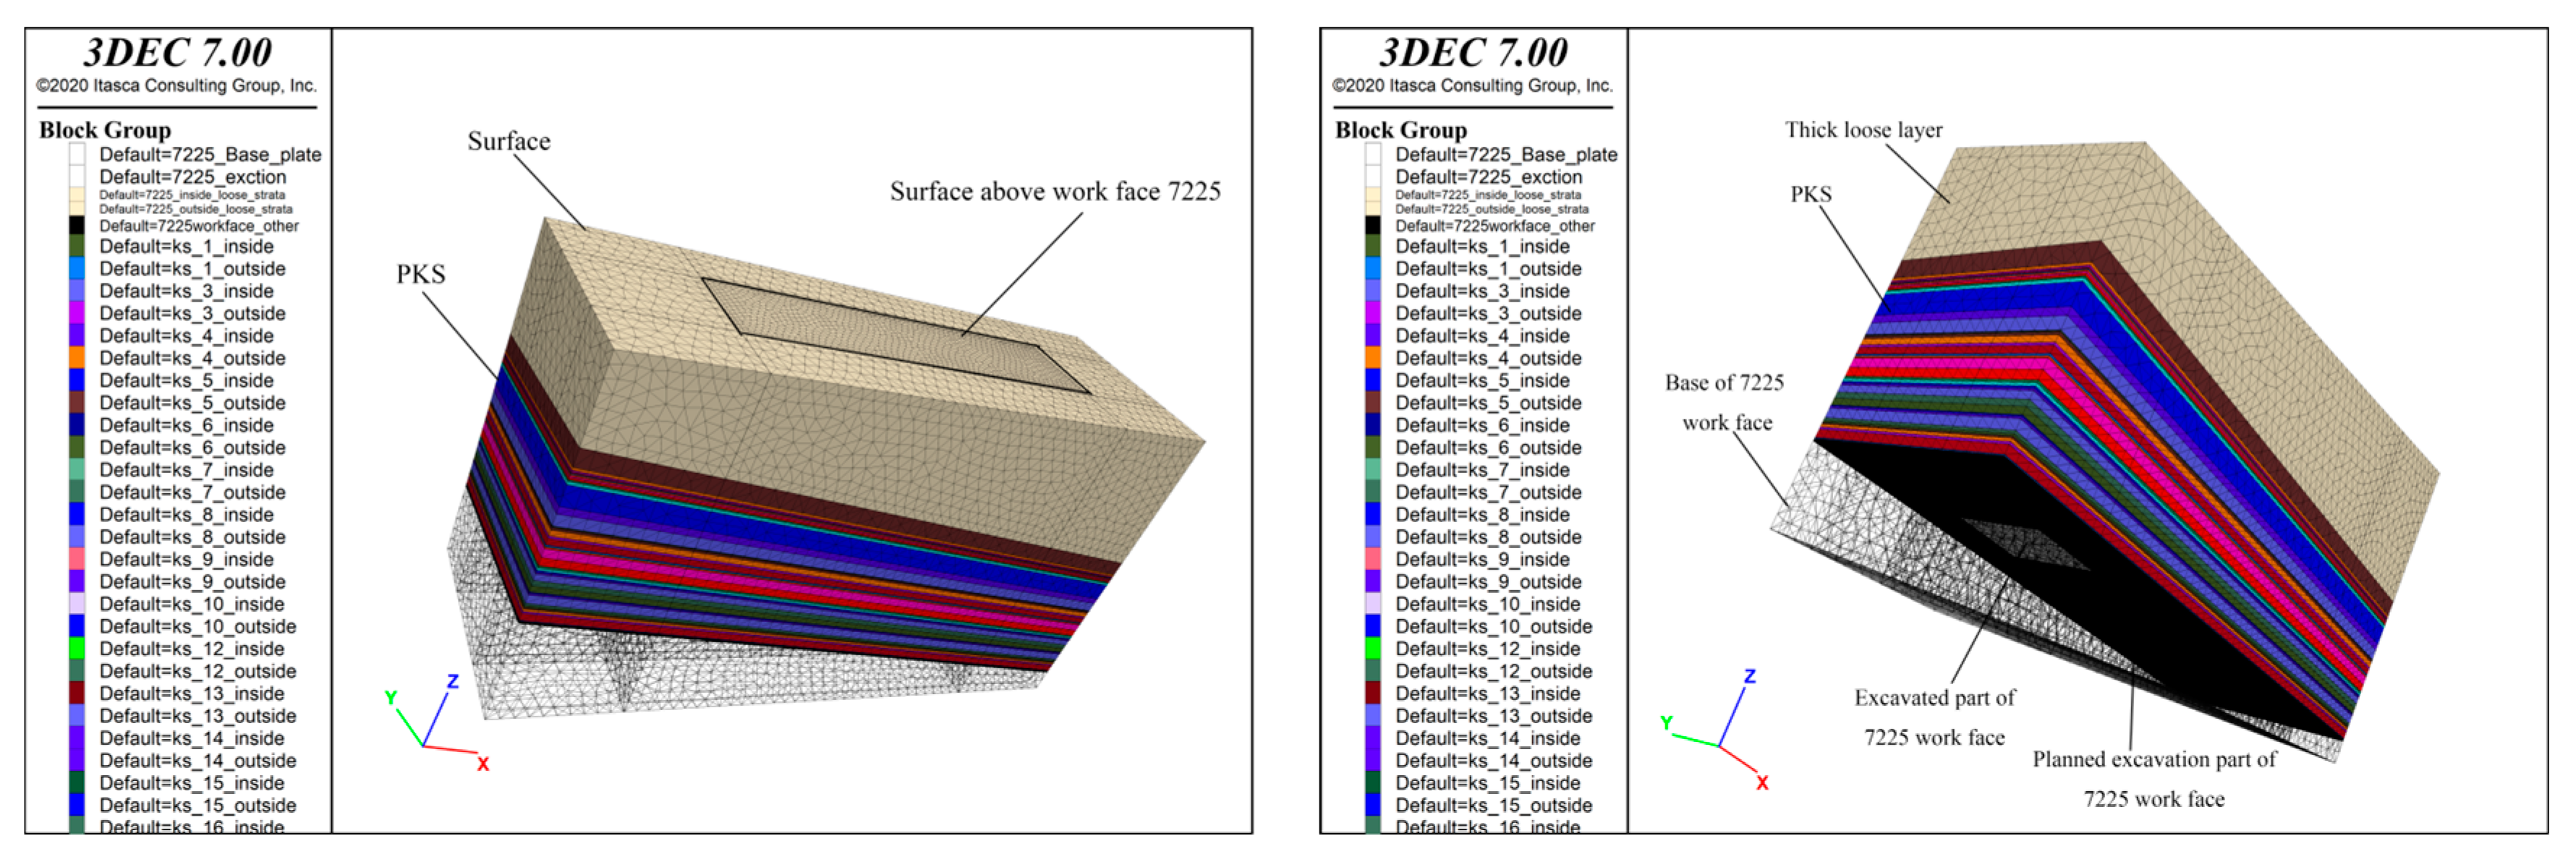
  • Based on the drilling data obtained above the 7225 working face, each rock stratum’s physical and mechanical properties from the coal seam to the ground were determined. The thick, loose layer overlying the 7225 working face was determined to contain four key strata, numbered 3, 15, 24, and 39. It was also determined that the main roof plate was No.3, 1.47 m above the 7225 work face, and the PKS was No.39, 171.99 m above the 7225 work face;
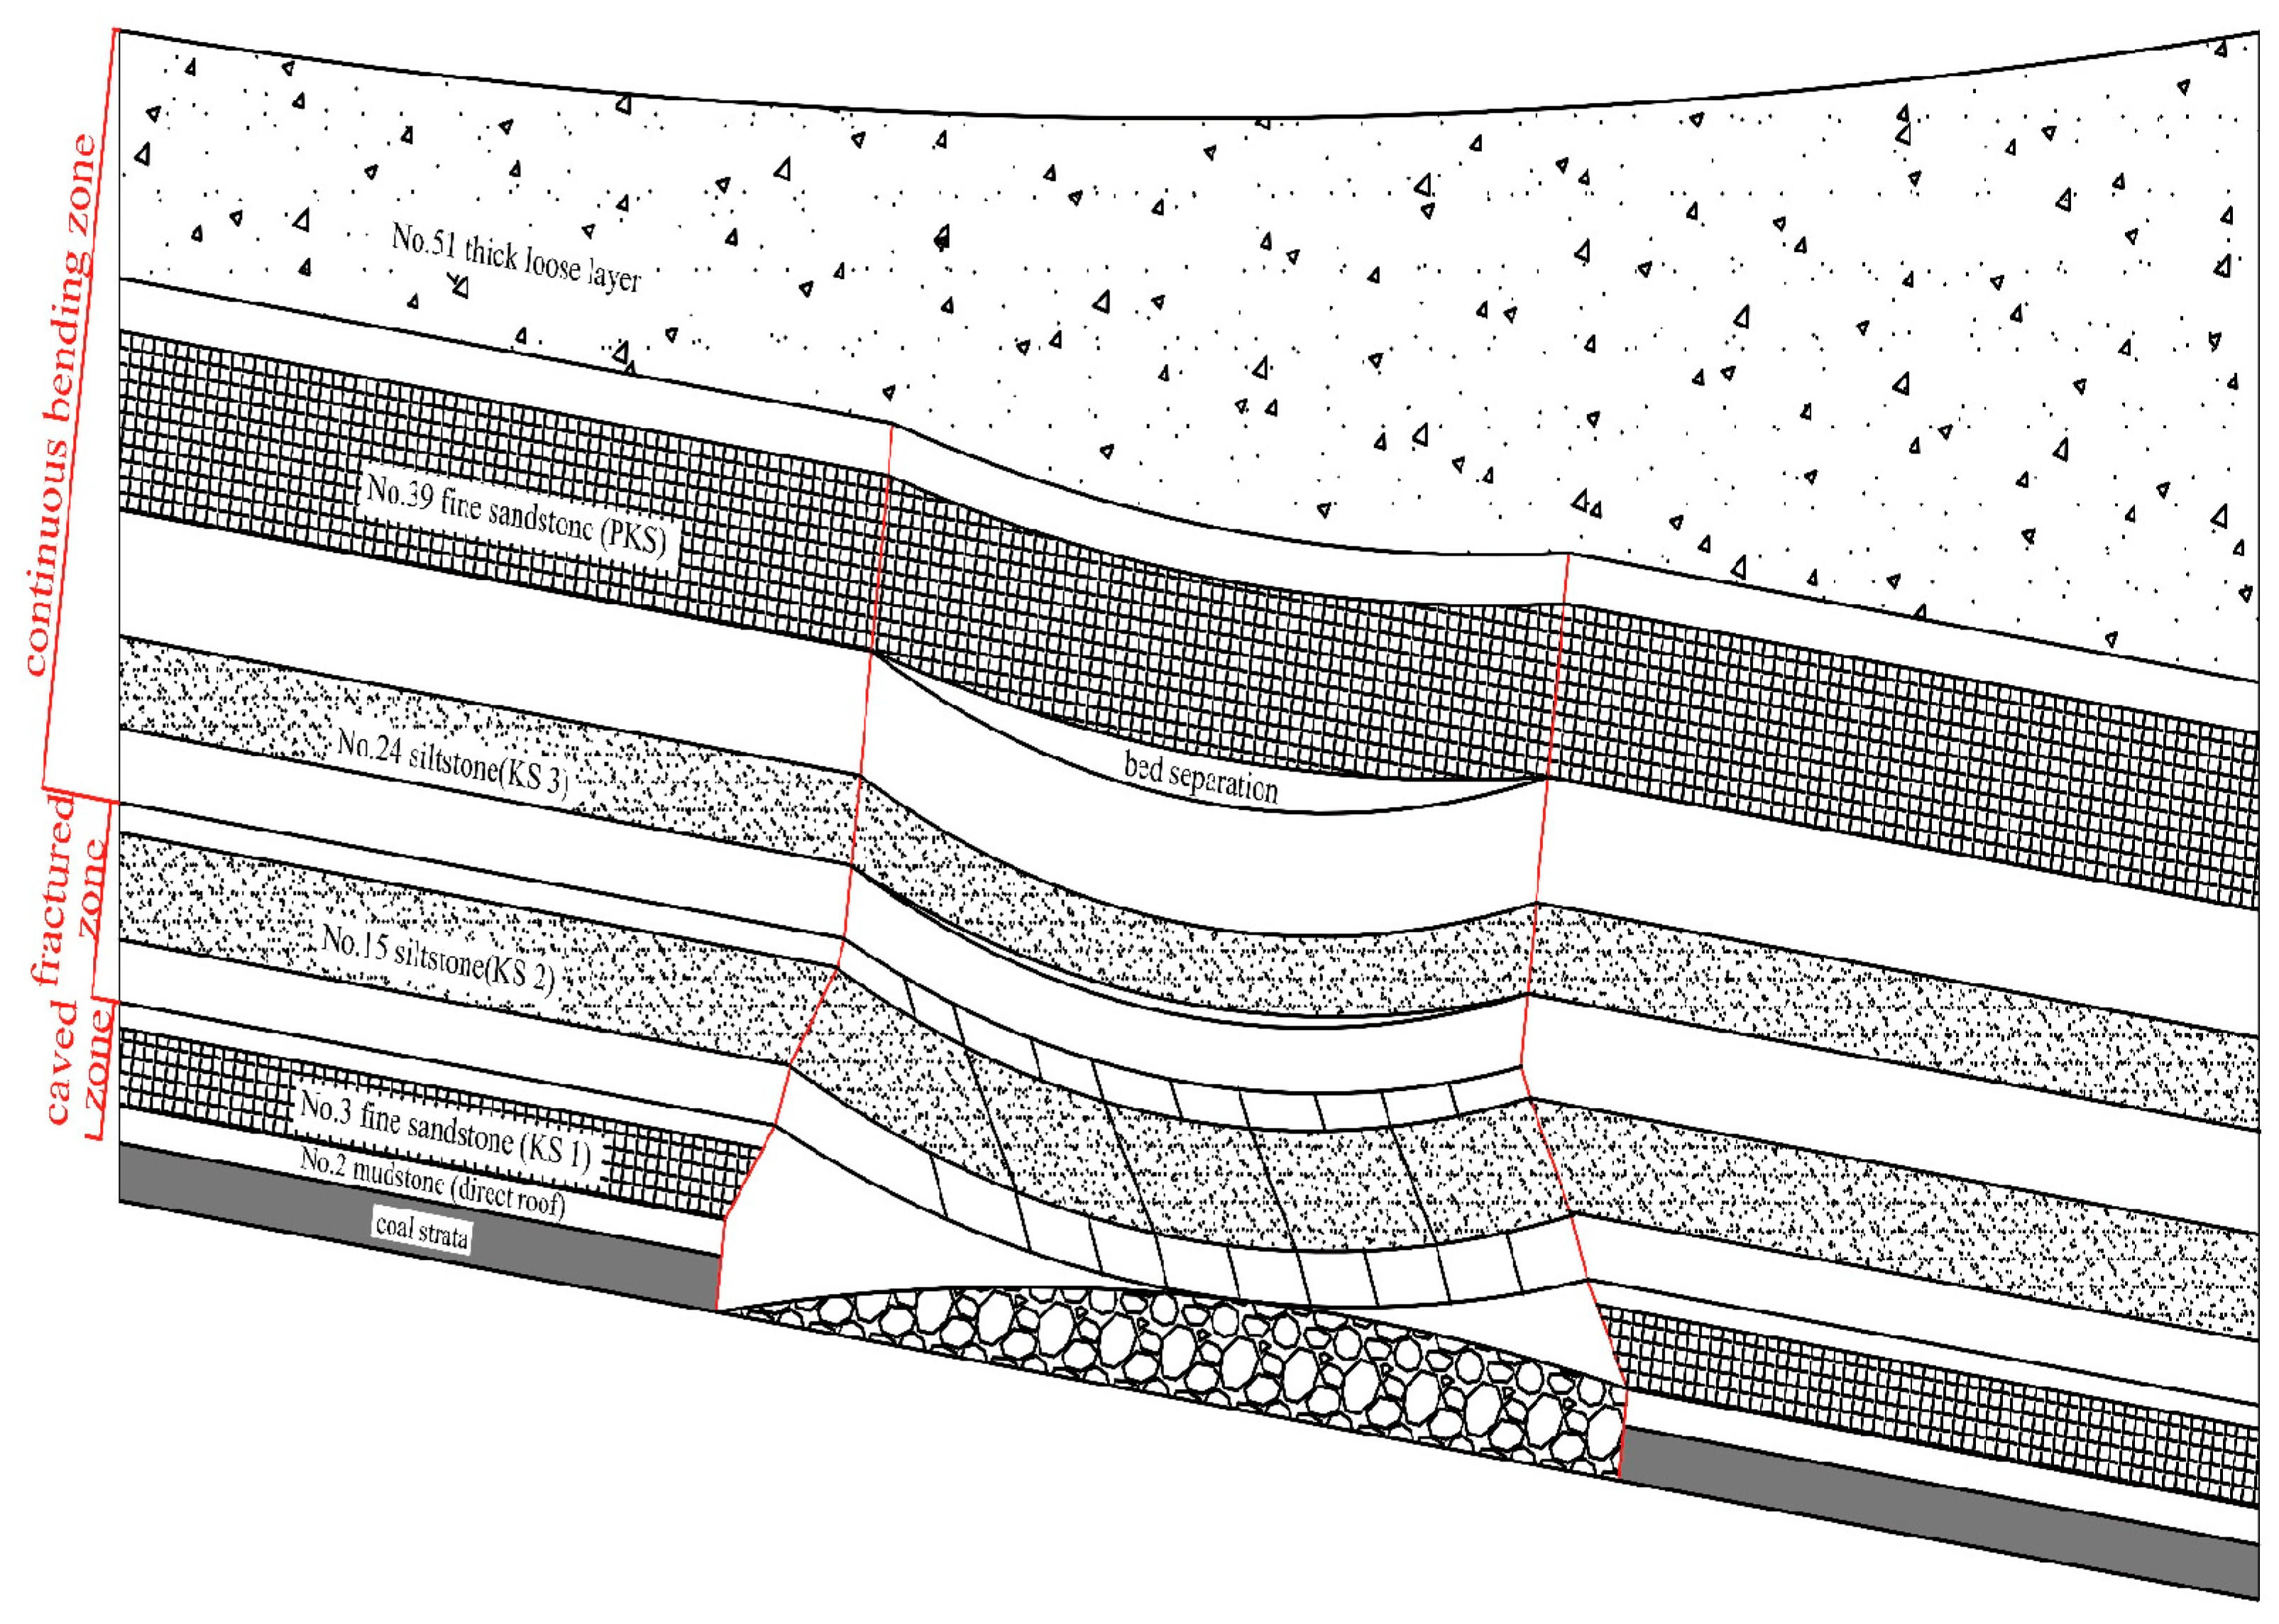
  • A model of a large-deflection inclined thin plate with one unsupported side and three supported sides was created by mining the 7225 inclined face. Then, the initial breakage distance of the main roof plate was 33 m, and the initial breakage angle was 61.2°; the periodic breakage distance was 21 m, and the periodic breakage angle was 55.4°. The distribution range of the “Vertical Three Zones” from the 7225 face to the ground surface included the height of the caved zone of 38.07 m, the height of the fissured zone of 41.13 m, the height of the bending zone of 187.56 m excluding the thick loose layer. It also analyses the relationship between the spatial location of each key strata’s starting and ending deformation points within the “Vertical Three Zones” and the mining activities’ distance;
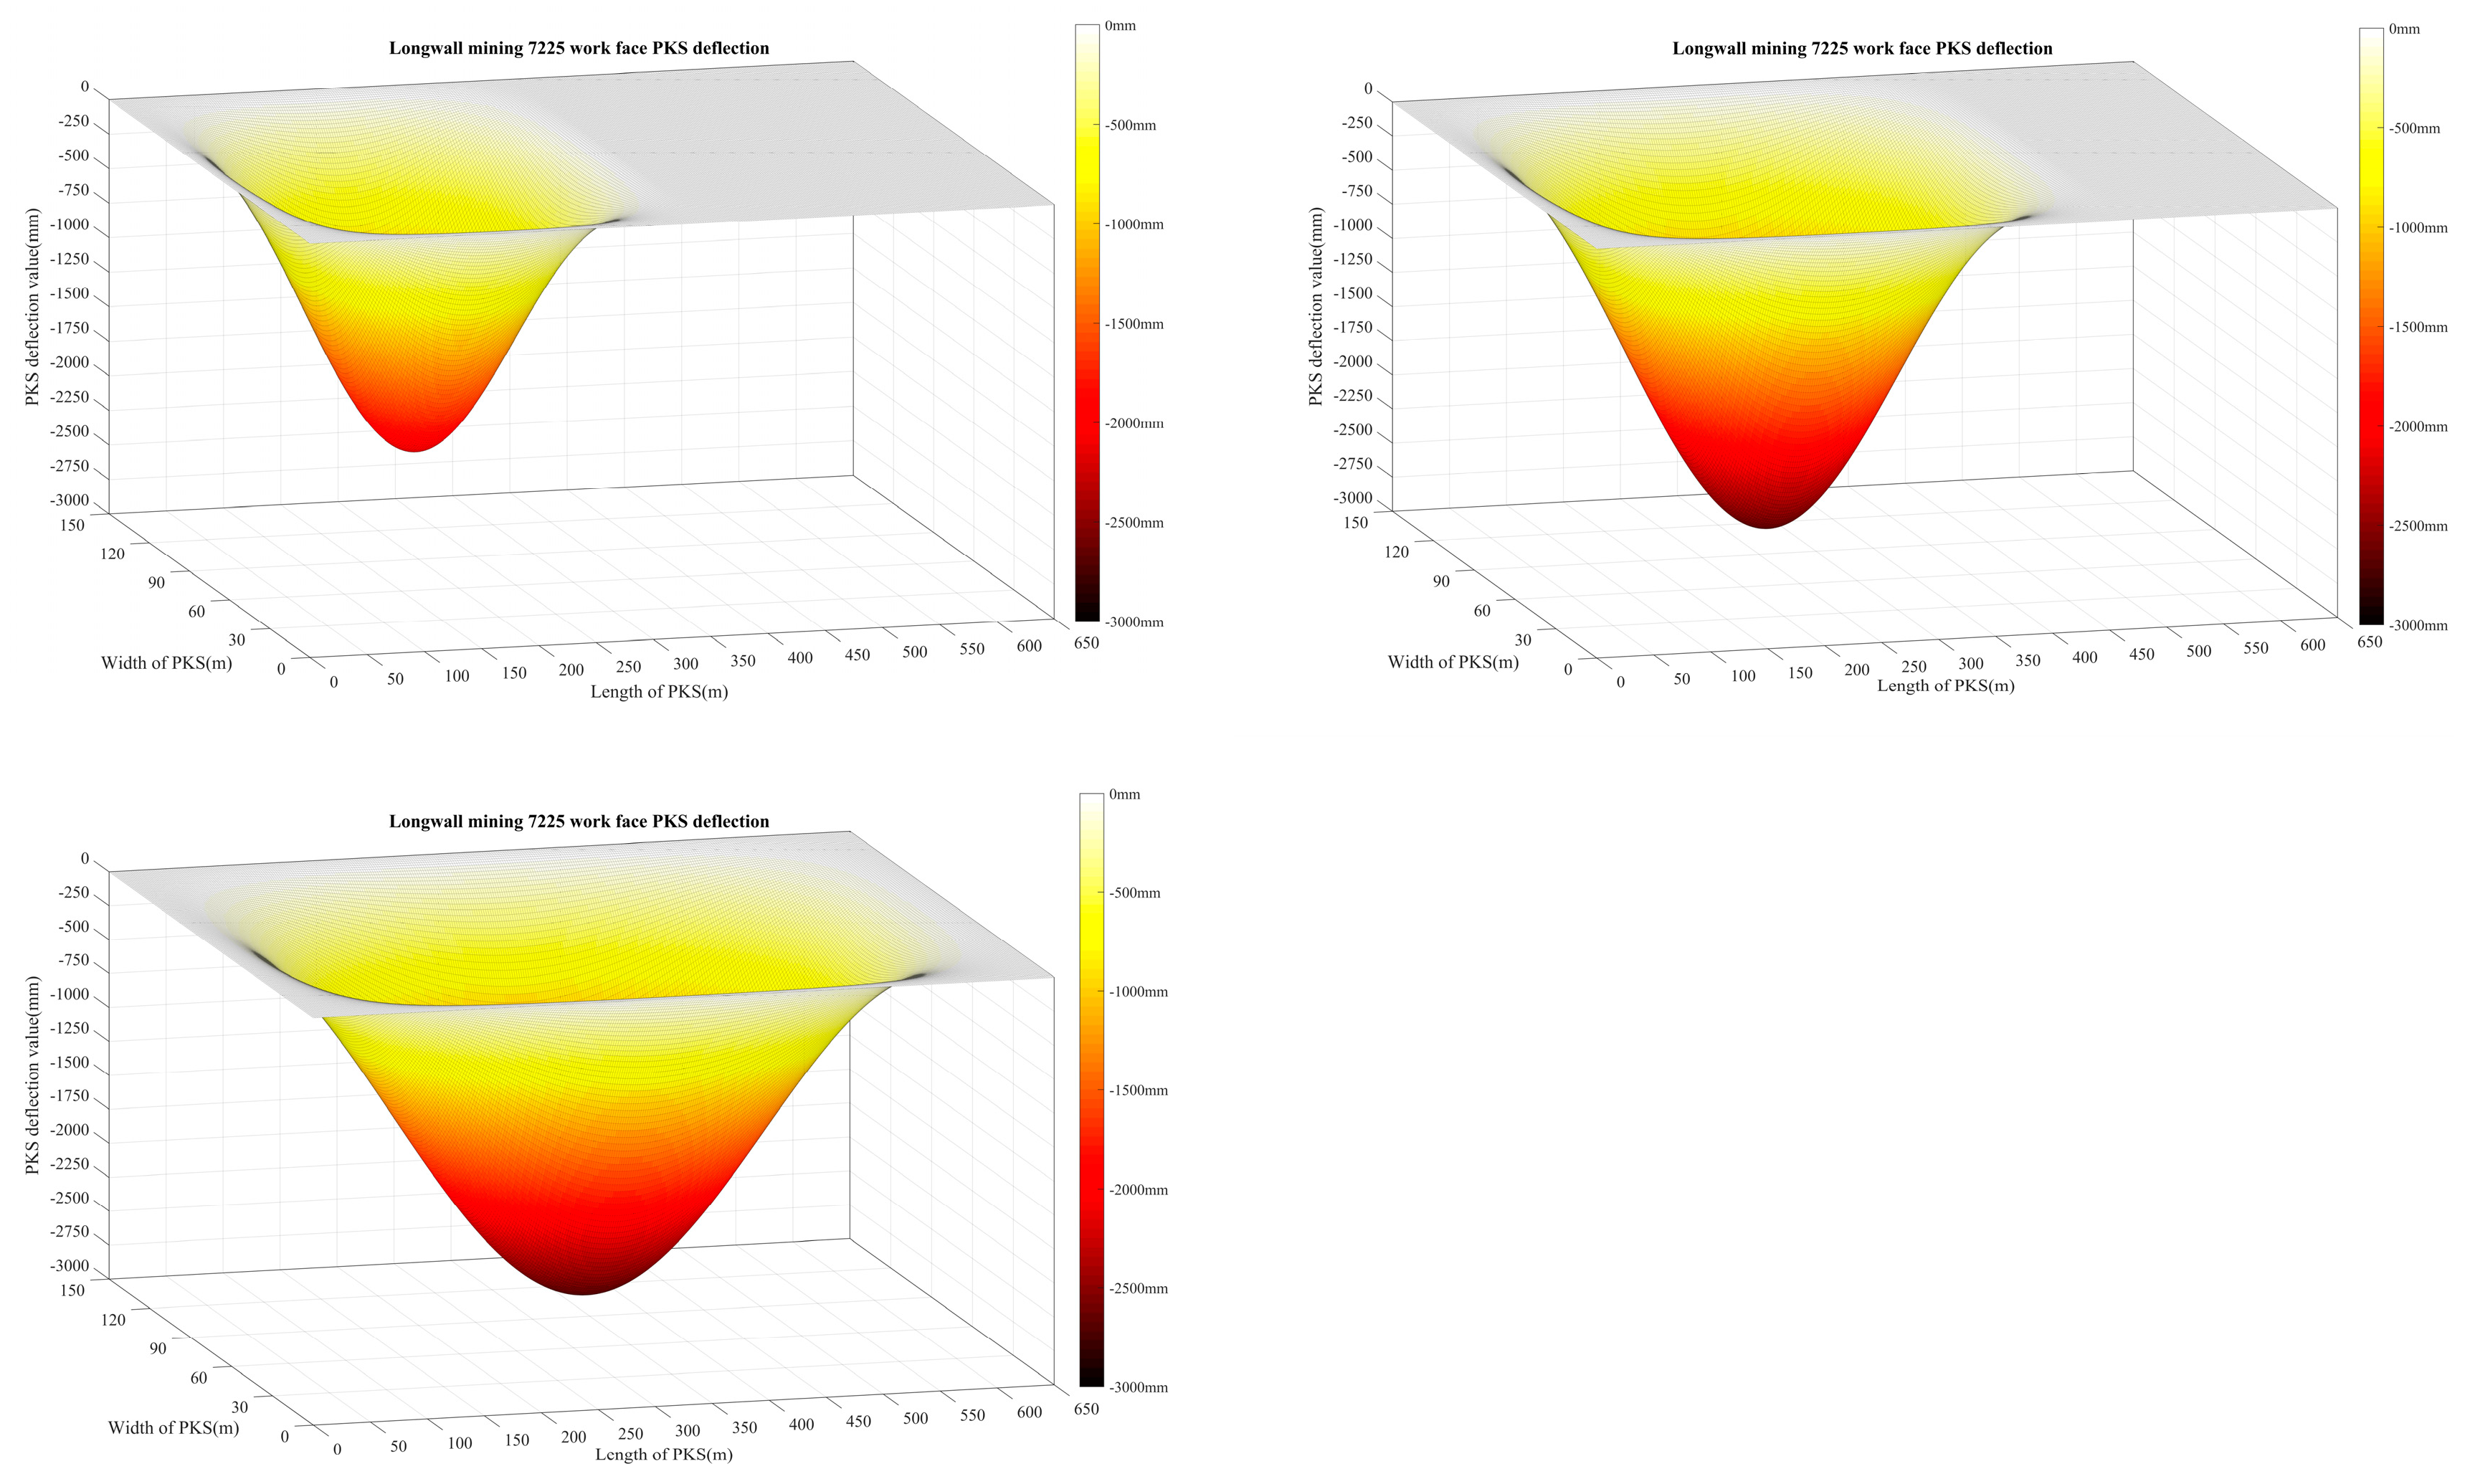
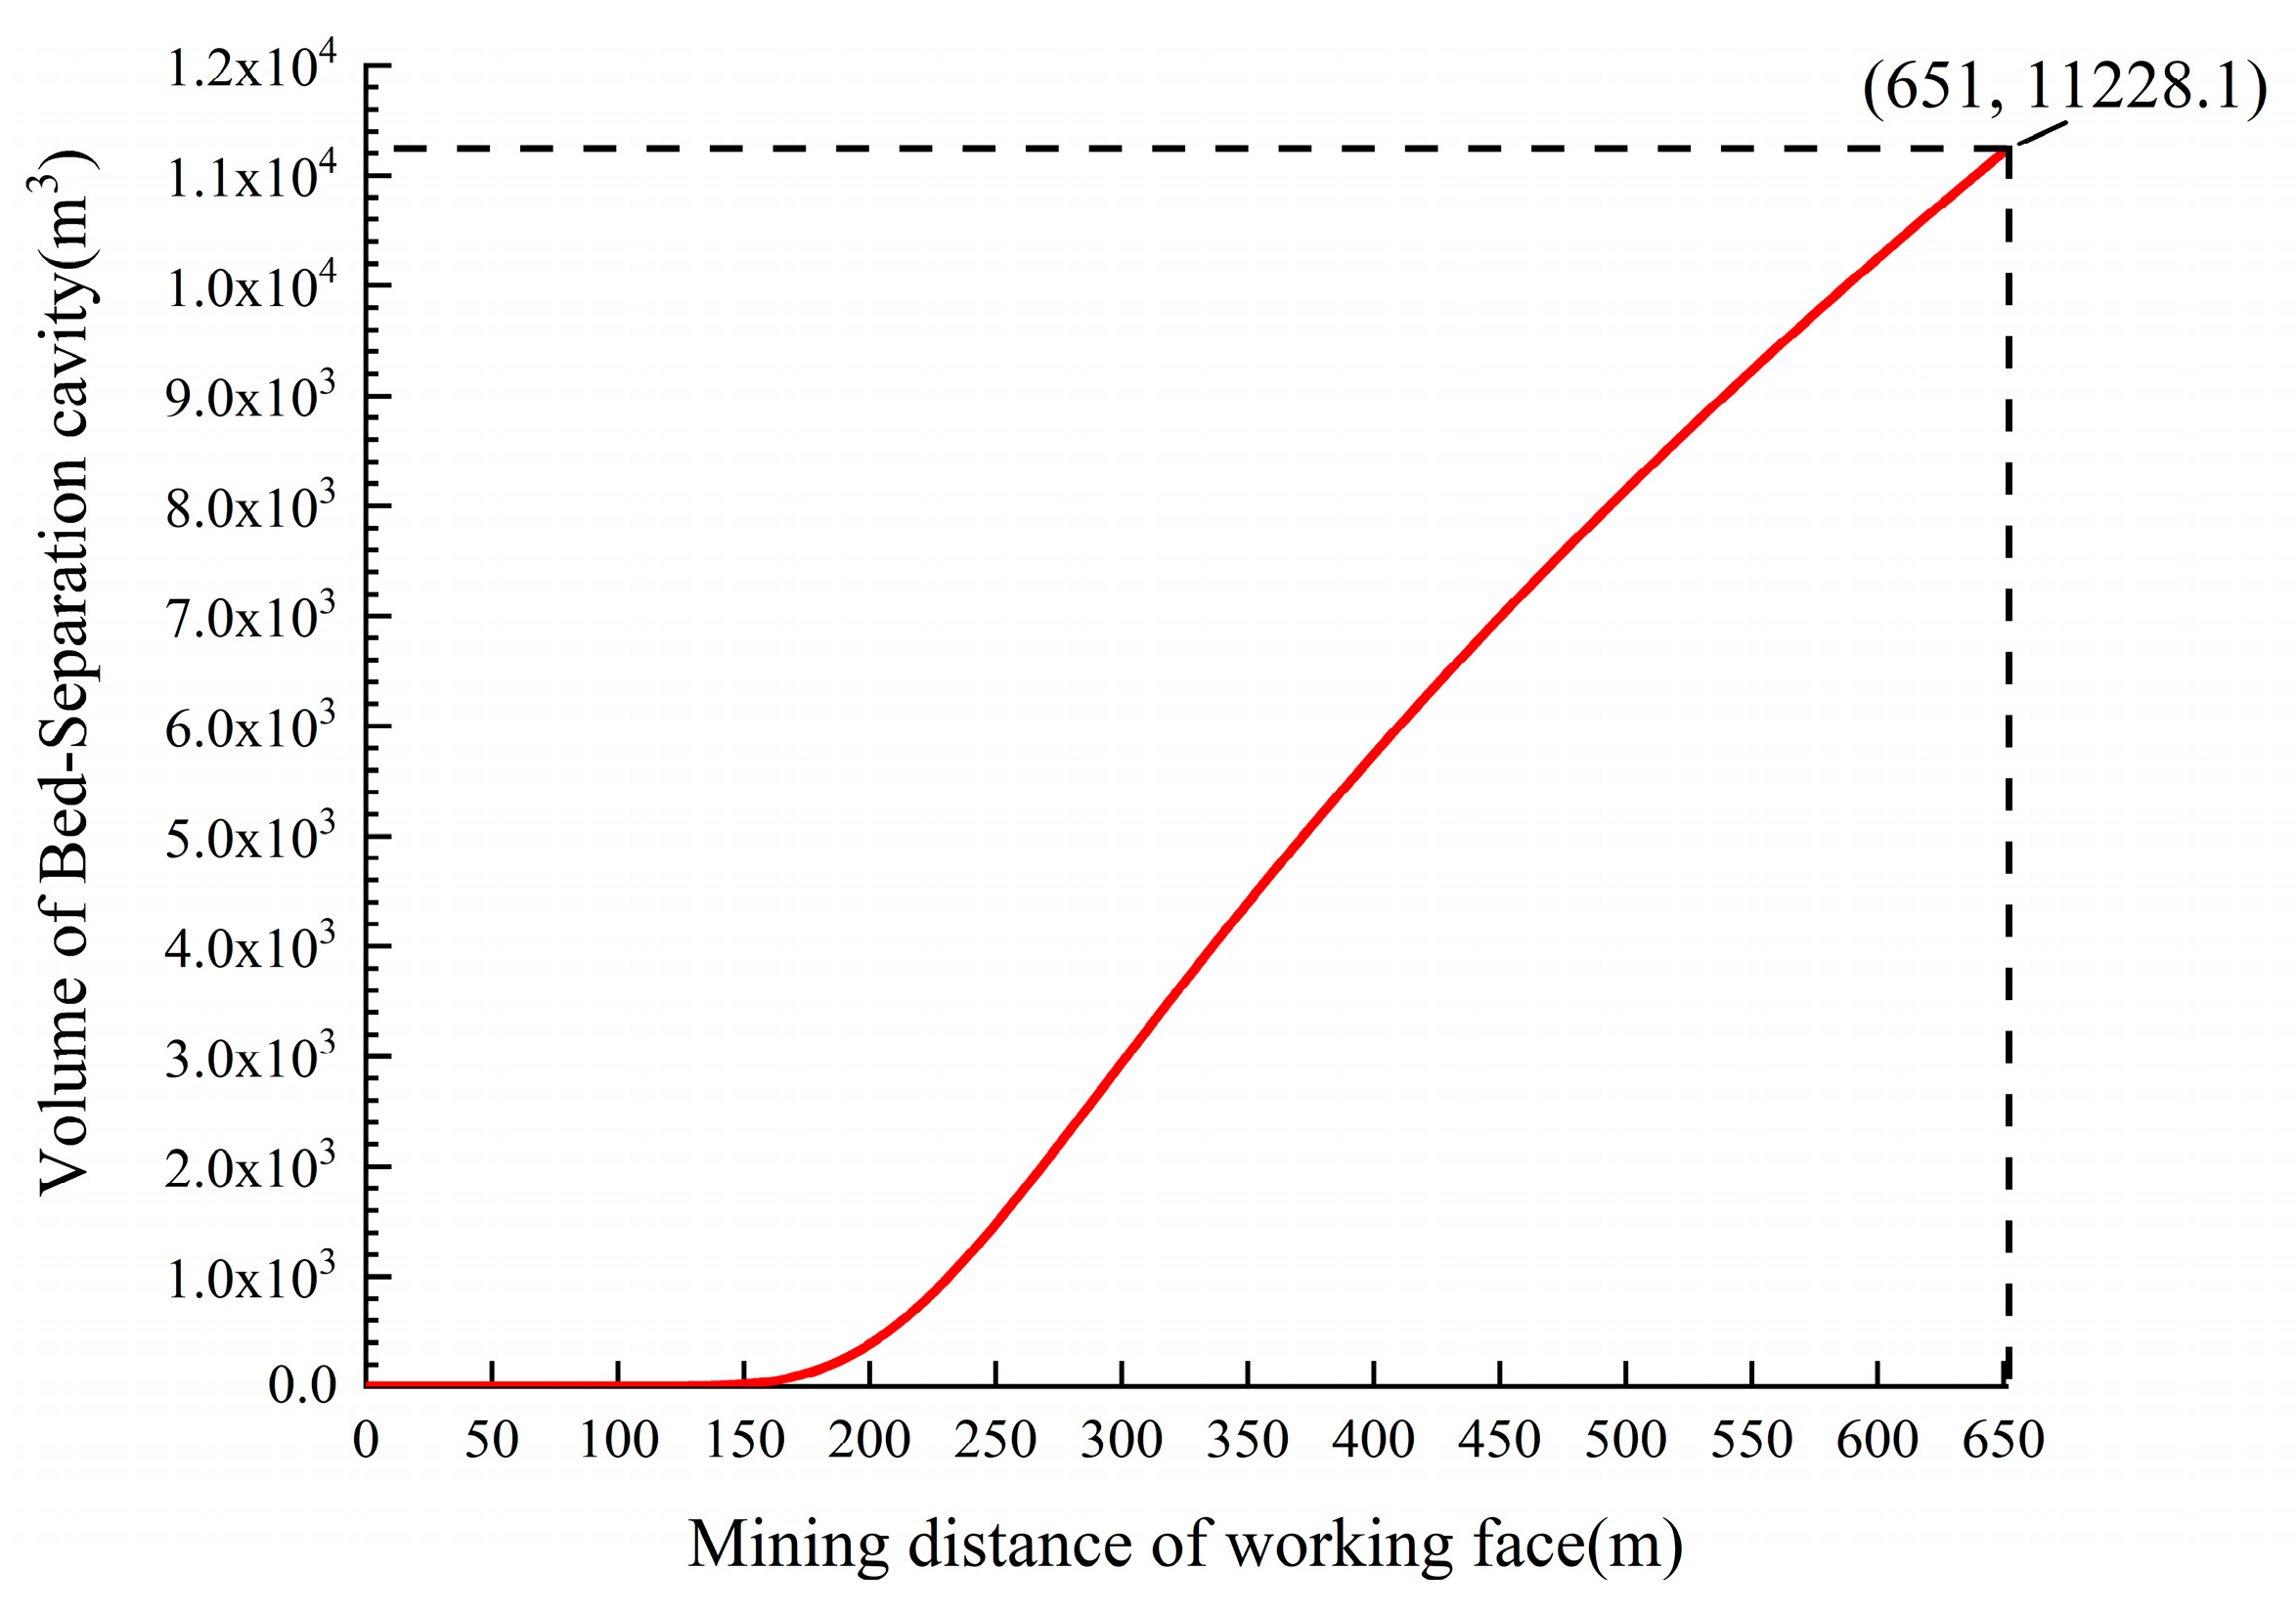
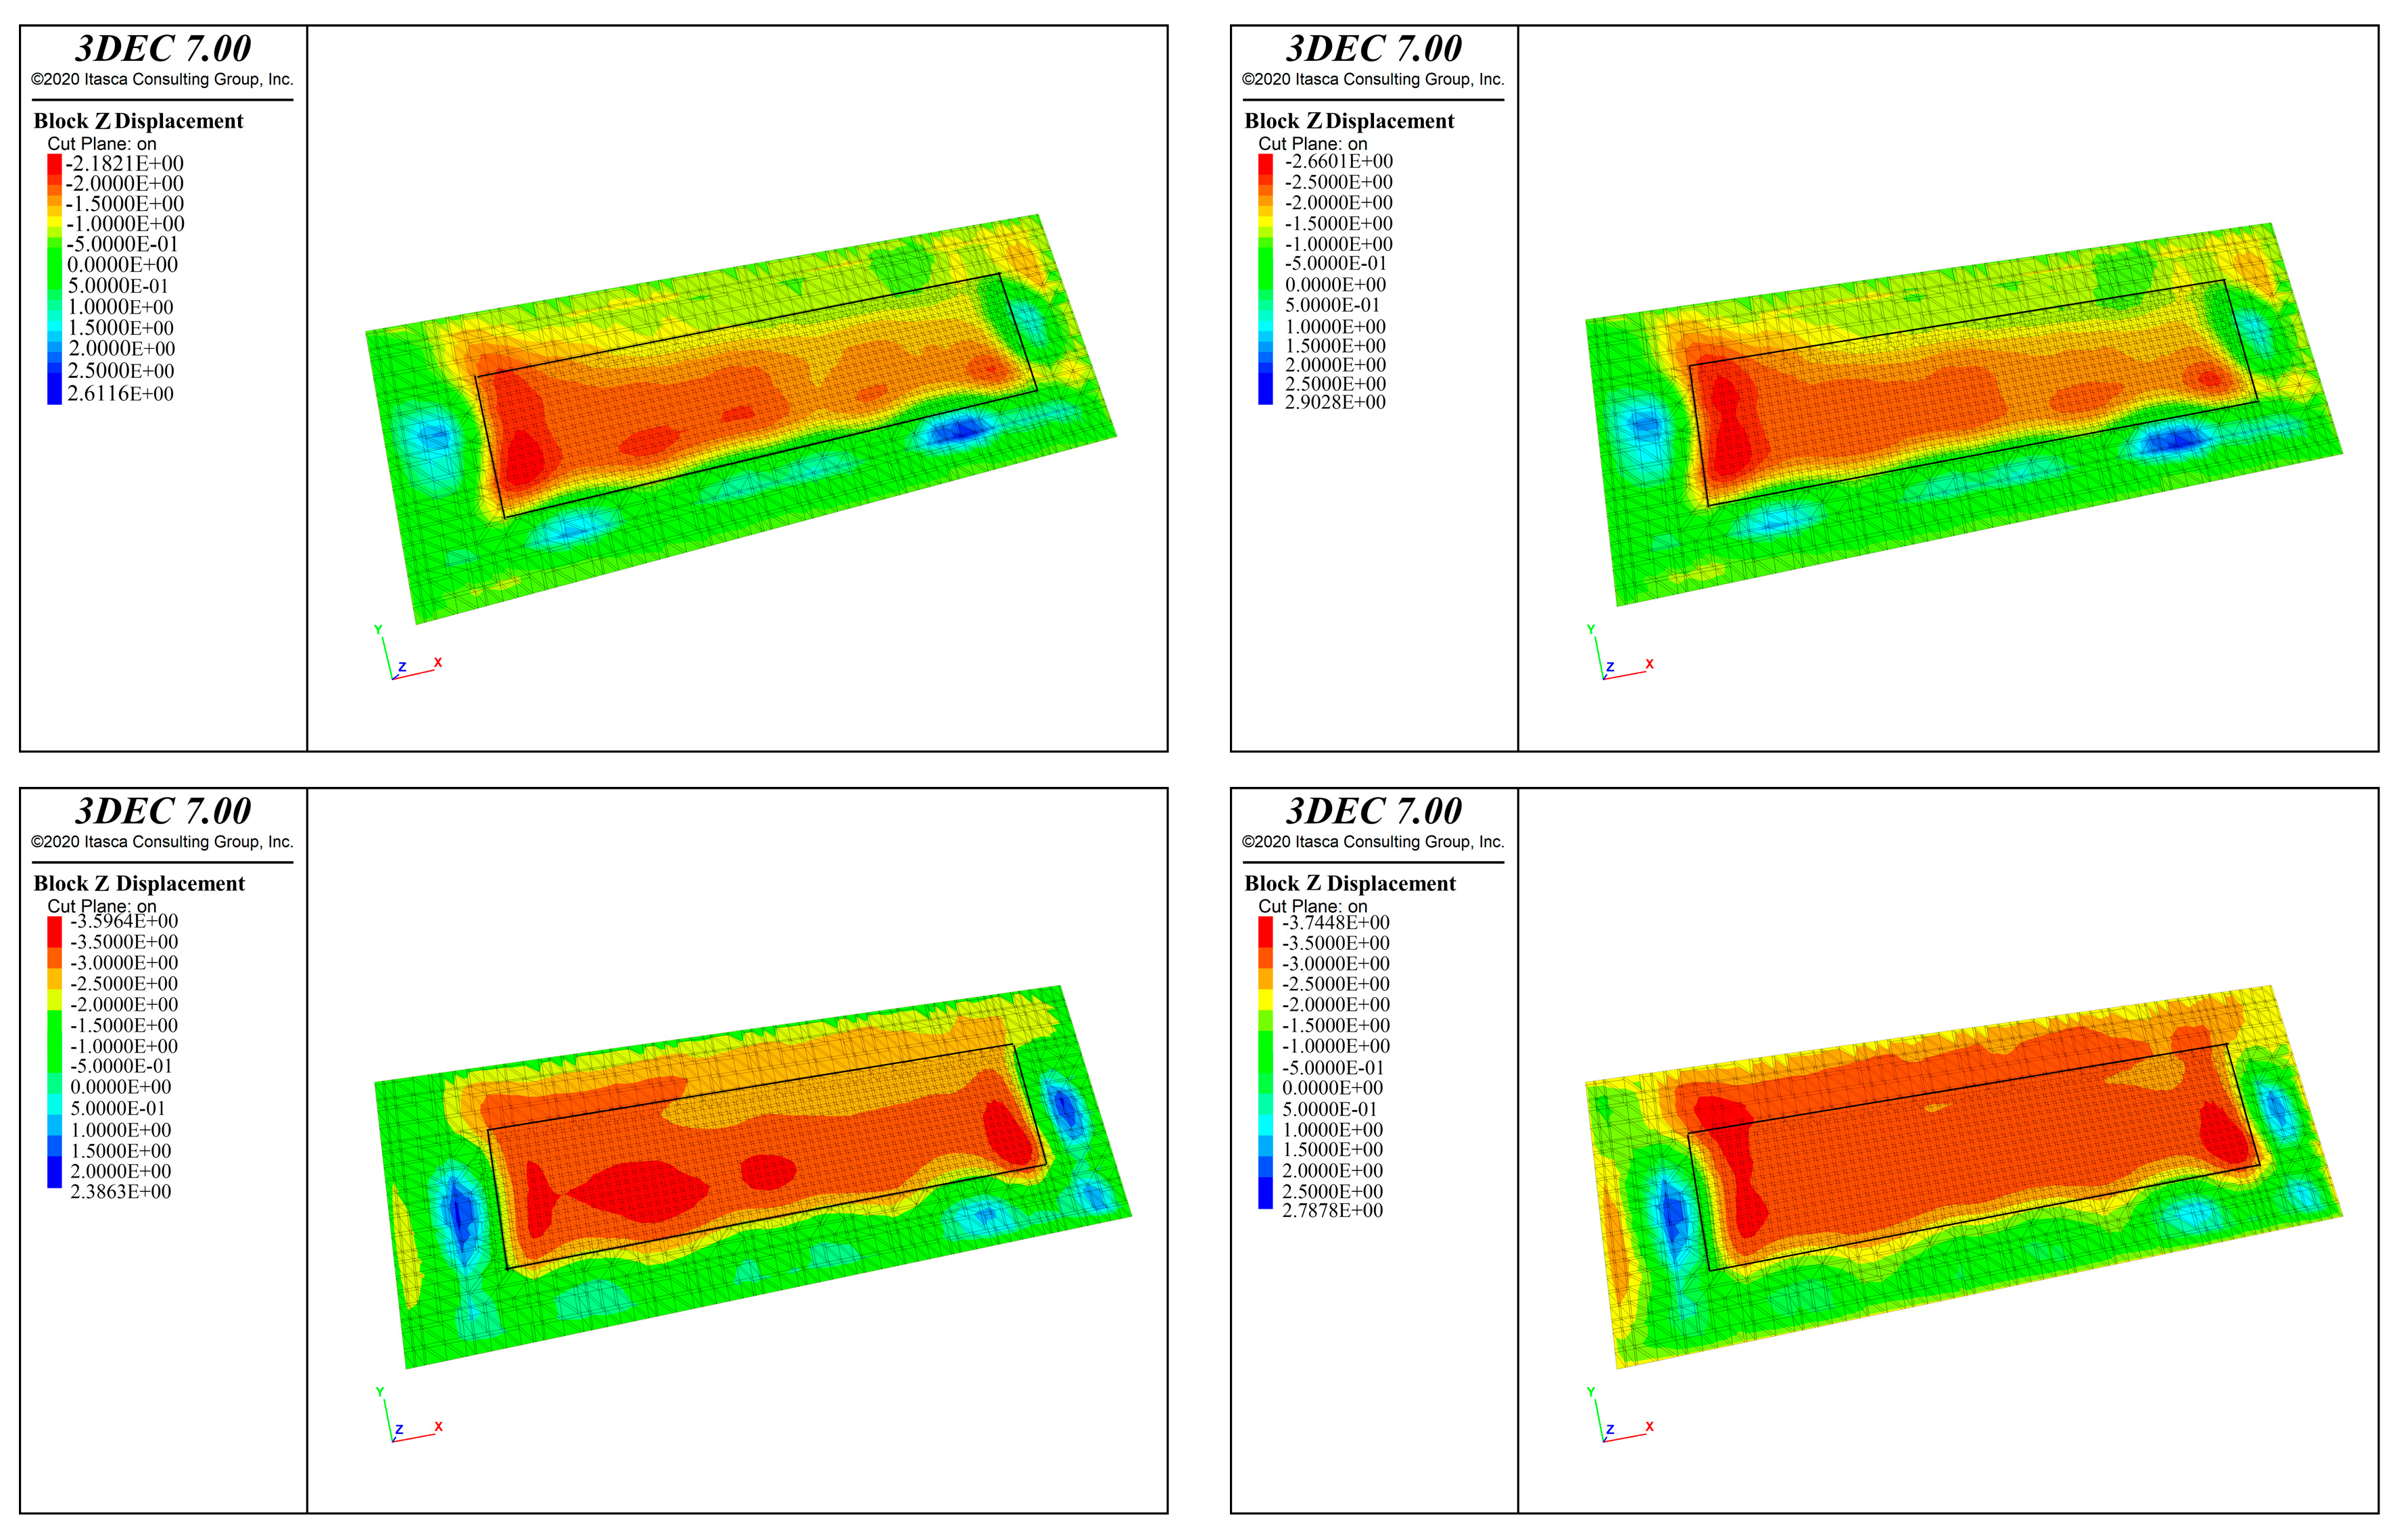
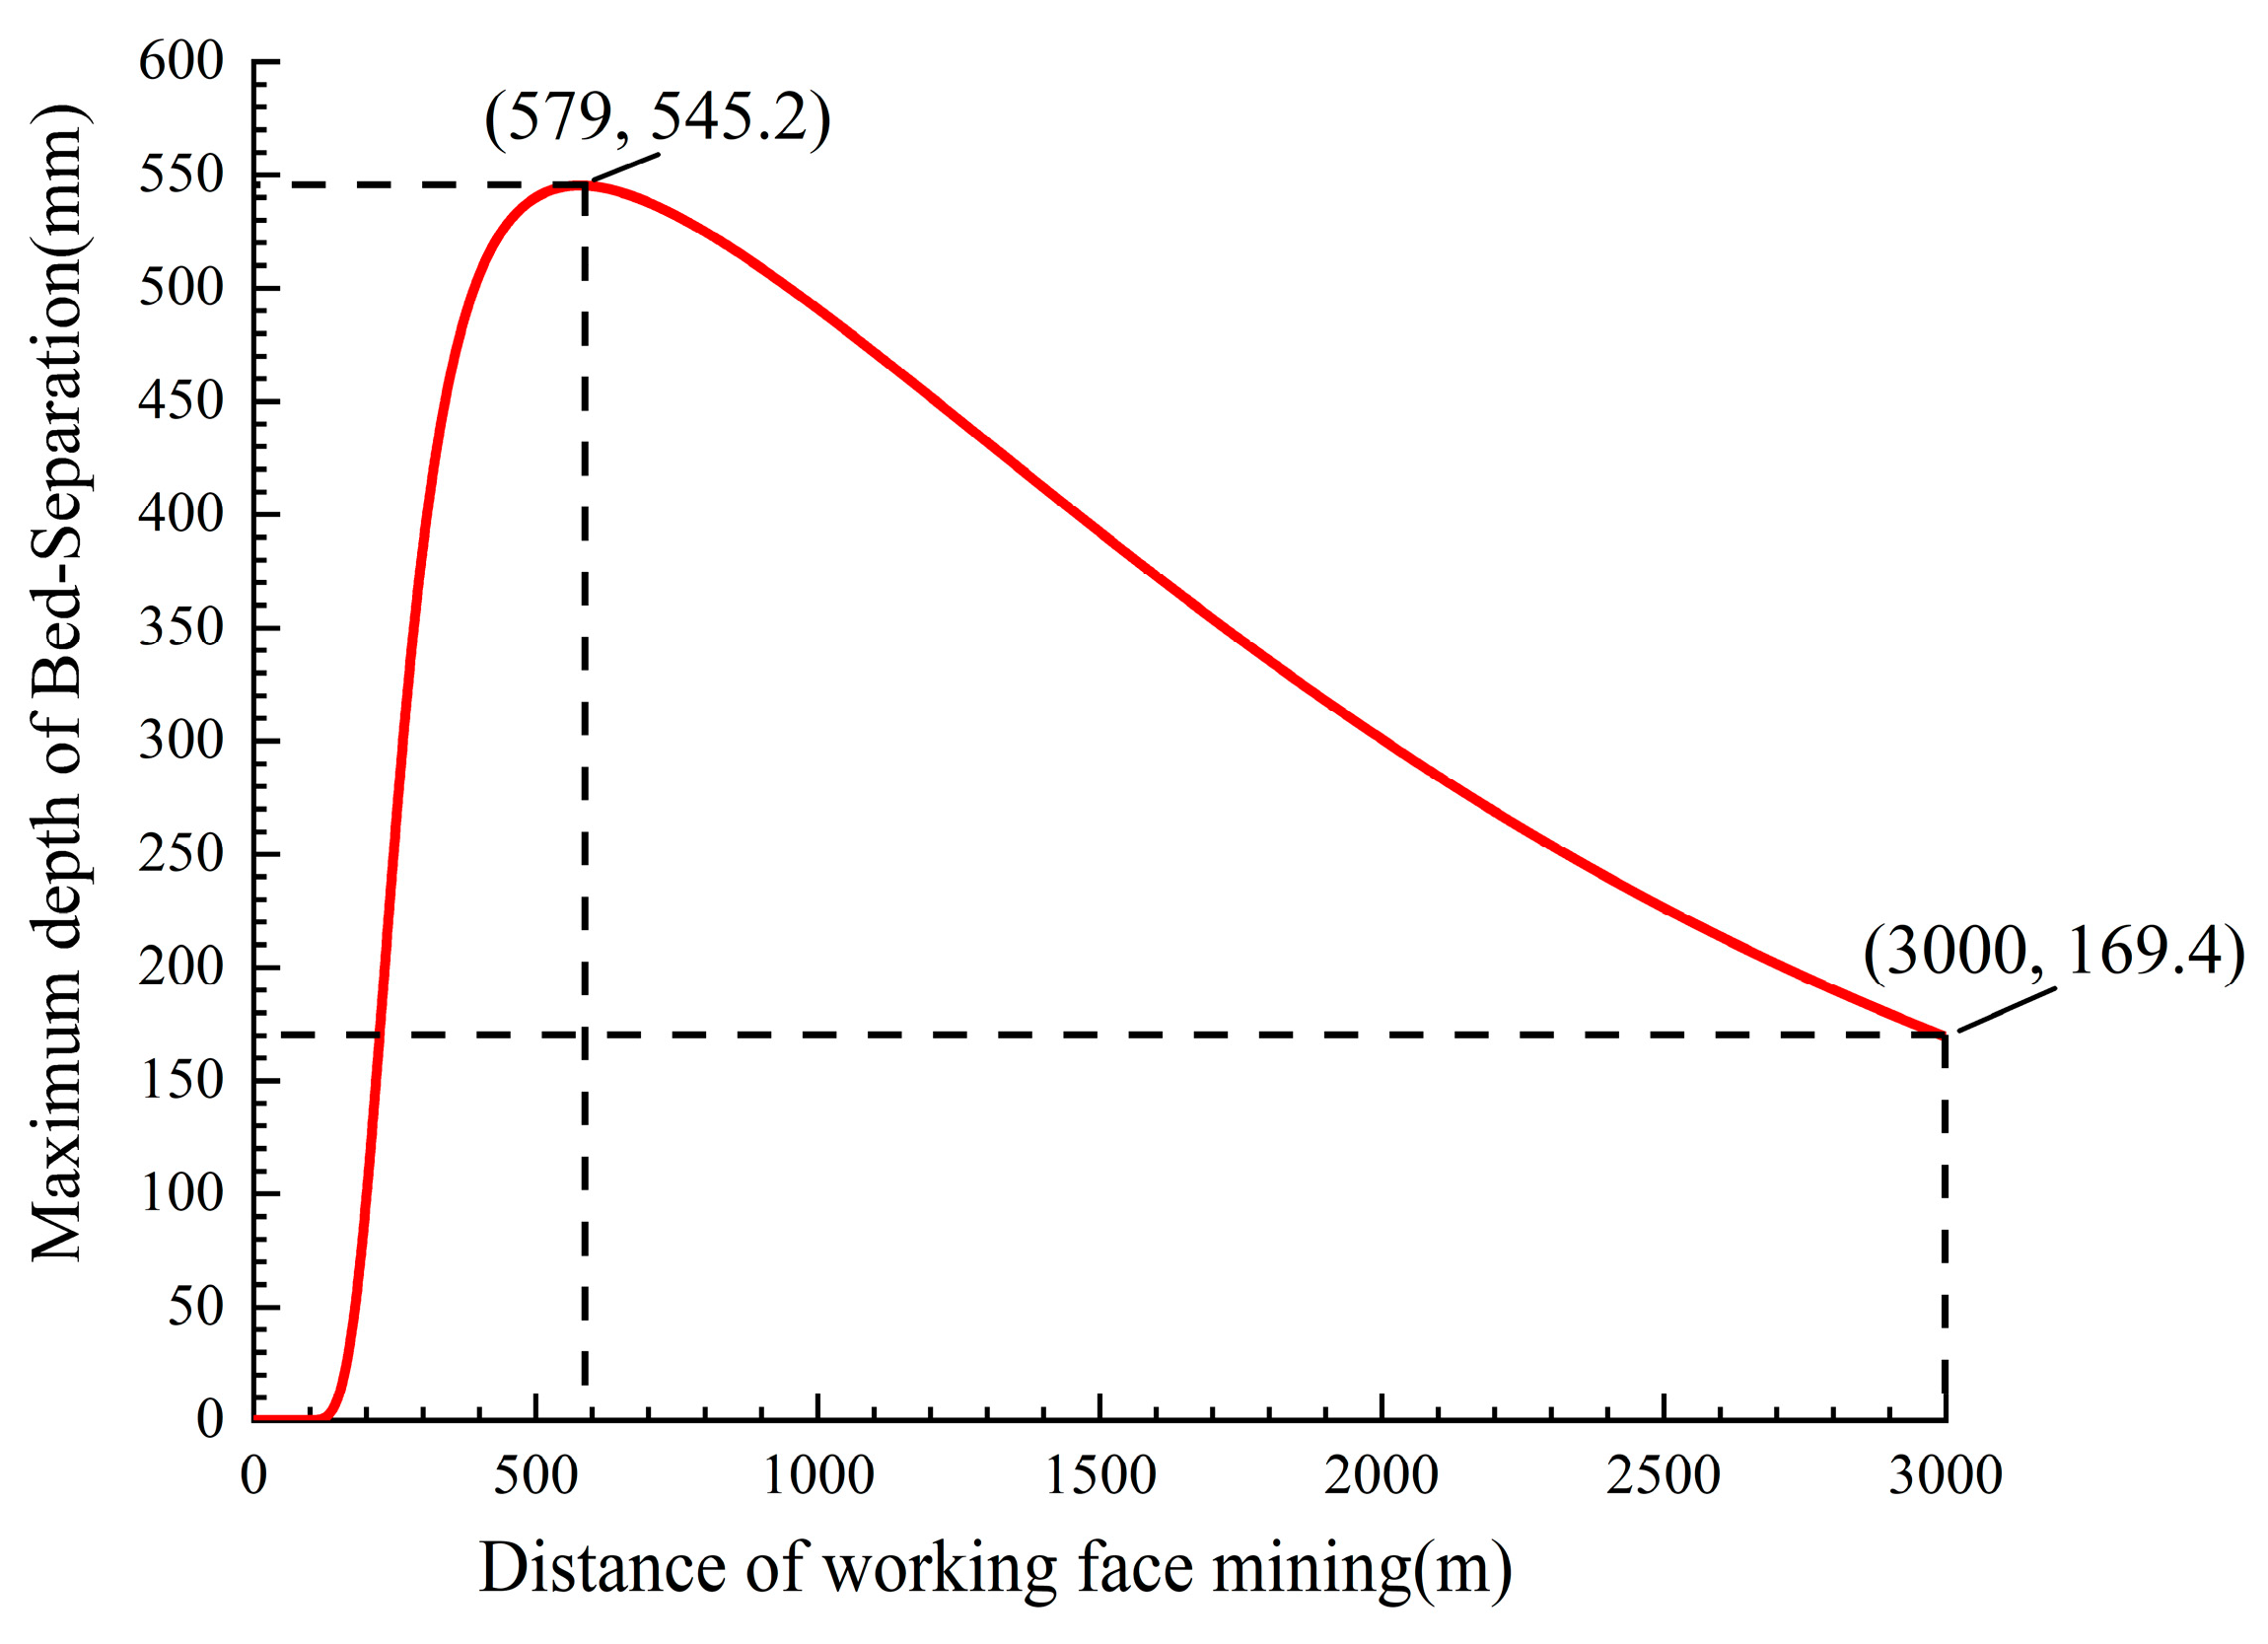
  • The large-deflection inclined thin plate model was applied to the 7225 inclined working face mining process. The PKS deflection value develops from 0 mm to 2714 mm with the mining of the working face, and the maximum value of the space volume is 56,485 m3, verified by 3DEC numerical simulation. The dynamic development of bed-separation below the PKS within the overburden strata, the maximum development height is 545.2 mm, and the maximum value of Bed-separation cavity volume is 11,228.1 m3. Finally, the dynamic development of bed-separation height and cavity under the working face’s different mining length and width conditions is discussed. As the length of the working face increases, the Bed-separation height increases and then decreases, and the maximum value of the development height is 545.2 mm, corresponding to the mining distance of 579 m. The volume of the Bed-separation cavity increases until it starts to decrease after 1917 m. The Bed-separation height and cavity volume show an increasing trend when the working face width increases within 150 m. After the working face width exceeds 180 m, the Bed-separation cavity develops and closes rapidly;
  • The large-deflection inclined thin plate model proposed in this paper can effectively explore the dynamic development of PKS deflection and Bed-separation induced by Longwall mining inclined workings overlying thick loose layers. Of course, the large-deflection inclined thin plate model has limitations in its application to the analysis of overlying stratigraphic deflection caused by open-pit mining and partially sharp inclined working face mining. In the future, the model will be applied more to the dynamic assessment of bed-separation development caused by horizontal or inclined coal seam mining, and it will provide a theoretical basis for the rational use of Bed-separation cavities, such as grouting backfill.

Author Contributions

Conceptualization, Y.L. and K.Y.; methodology, Y.L. and K.Y.; software, W.T.; validation, Y.L., K.Y. and X.W.; formal analysis, K.Y. and Y.L.; investigation, W.T.; resources, W.T. and Y.L.; data curation, K.Y., K.J. and W.T.; writing—original draft preparation, Y.L. and K.Y.; writing—review and editing, Y.L. and K.J.; visualization, Y.L.; supervision, K.Y., Y.L., K.J. and W.T.; project administration, K.Y.; funding acquisition, X.W. All authors have read and agreed to the published version of the manuscript.

Funding

This work has been financially supported by the Research Project of Huaibei Mining Co., Ltd. [2023-129] and the Research Project of Huaibei Mining Co., Ltd. [2024-140].

Data Availability Statement

The original contributions presented in the study are included in the article; further inquiries can be directed to the corresponding author.

Acknowledgments

The authors thank the reviewers and the editor for providing valuable suggestions to improve the manuscript.

Conflicts of Interest

Author Xiangping Wei was employed by the company General Defense Geological Survey Department, Huaibei Mining Co., Ltd. The remaining authors declare that the research was conducted in the absence of any commercial or financial relationships that could be construed as a potential conflict of interest.

Abbreviations

List of Symbols
UThe strain energy of thin plate bending d Q Shear force on the differential unit
U1The strain energy caused by the Elongation of the mid-plane q The load on the differential unit
U2The additional strain energy caused by the mid-plane bending strainkthe foundation reaction coefficient
σ 1 Key strata principal tensile stressNA vector sum of the gravity along the inclined plate
σ 3 Key strata principal compressive stressesMXThin plate bending moment in the x-axis
α The angle between the principal tensile stress and the horizontal planeMYThin plate bending moment in the y-axis
θ The angle between the fracture trace and the horizontal planeMXYThin plate torque
WThe work by the external force on the thin plateQXLateral vertical shear in the x-axis
W v The work by the lateral load and the elastic foundation combined forceQYLateral vertical shear of the y-axis
W h The work by the mid-plane force along the mid-planewThin plate deflection
E p The minimum potential energy q 1 Lateral load at the junction point between the uphill direction and the cut line
A m n Key strata deflection coefficient q 2 Lateral load at the junction point between the downhill direction and the finishing line
N x Unit length mid-plane tension in the x-axis σ t e n s i l e Key strata ultimate tensile stress
N y Unit length mid-plane tension in the y-axis θ _ i n i t i a l The angle between the key strata initial fracture trace and the horizontal plane
N x y Unit length mid-plane shear θ _ p e r i o d i c The angle between the key strata periodic fracture trace and the horizontal plane
uxSmall displacements of mid-plane in the x-axis θ _ i n i t i a l   a v e r a g e The average angle of the initial fracture trace between the two adjacent key strata
uySmall displacements of mid-plane in the y-axis θ _ p e r i o d i c   a v e r a g e The average angle of periodic fracture trace between the two adjacent key strata
ε x Total unit elongation in the x-axis h _ c a v e d   z o n e The height of the caved zone
ε y Total unit elongation in the y-axismCoal seam mining height
γ x y Total unit shear strainsk′Rock expansion coefficient
σ x Key strata tensile stress in the x-axis h _ f r a c t u r e d   z o n e The height of the fractured zone
σ y Key strata tensile stress in the y-axis L _ m i n i n g   d i s t a n c e The mining distance of the work face
τ x y Key strata shear stress L _ S t a r t   C o o r d i n a t s y s t e m Continuous bending zone key strata starting deflection position
DBending stiffness of the thin plate L _ E n d   C o o r d i n a t s y s t e m Continuous bending zone key strata ending deflection position
vPoisson’s ratio of thin plate w _ B e d   s e p a r a t i o n The deflection curve of the Bed-separation
aLength of plate V _ B e d   s e p a r a t i o n The volume of the Bed-separation cavity
bWidth of plate

References

  1. Hou, D.F.; Li, D.H.; Xu, G.S.; Zhang, Y.B. Superposition model for analyzing the dynamic ground subsidence in mining area of thick loose layer. Int. J. Min. Sci. Technol. 2018, 28, 663–668. [Google Scholar] [CrossRef]
  2. Gao, X.C.; Wang, L.Q.; Wang, Q.; Hu, X.Y.; Wang, Y.C.; Zhang, Y.F. Stability Analysis and the Random Response of Anti-Sliding Pile for Erdaogou Landslide Considering Spatial Variability. Mathematics 2023, 11, 16. [Google Scholar] [CrossRef]
  3. Wang, F.; Xu, J.L.; Xie, J.L. Effects of arch structure in unconsolidated layers on fracture and failure of overlying strata. Int. J. Rock Mech. Min. Sci. 2019, 114, 141–152. [Google Scholar] [CrossRef]
  4. Li, Z.; Xu, J.L.; Ju, J.F.; Zhu, W.B.; Xu, J.M. The effects of the rotational speed of voussoir beam structures formed by key strata on the ground pressure of stopes. Int. J. Rock Mech. Min. Sci. 2018, 108, 67–79. [Google Scholar] [CrossRef]
  5. Zhu, W.B.; Xu, J.M.; Xu, J.L.; Chen, D.Y.; Shi, J.X. Pier-column backfill mining technology for controlling surface subsidence. Int. J. Rock Mech. Min. Sci. 2017, 96, 58–65. [Google Scholar] [CrossRef]
  6. Qu, Q.D.; Xu, J.L.; Wu, R.L.; Qin, W.; Hu, G.Z. Three-zone characterisation of coupled strata and gas behaviour in multi-seam mining. Int. J. Rock Mech. Min. Sci. 2015, 78, 91–98. [Google Scholar] [CrossRef]
  7. Ma, H.W.; Sui, W.H.; Ni, J.M. Environmentally sustainable mining: A case study on surface subsidence control of grouting into overburden. Environ. Earth Sci. 2019, 78, 15. [Google Scholar] [CrossRef]
  8. Xu, J.M.; Juan, P.; Zhu, W.B. Movement Laws of the Overlying Strata at the Working Face Ends and Their Effects on the Surface Deformation. Minerals 2022, 12, 19. [Google Scholar] [CrossRef]
  9. Jin, L.X.; Liu, P.T.; Yao, W.B.; Wei, J.J. A Comprehensive Evaluation of Resilience in Abandoned Open-Pit Mine Slopes Based on a Two-Dimensional Cloud Model with Combination Weighting. Mathematics 2024, 12, 26. [Google Scholar] [CrossRef]
  10. Wu, Q.L.; Wu, Q.S.; Xue, Y.C.; Kong, P.; Gong, B. Analysis of Overlying Strata Movement and Disaster-Causing Effects of Coal Mining Face under the Action of Hard Thick Magmatic Rock. Processes 2018, 6, 18. [Google Scholar] [CrossRef]
  11. Park, T.; Lee, S.Y.; Seo, J.W.; Voyladjis, G.Z. Structural dynamic behavior of skew sandwich plates with laminated composite faces. Compos. Pt. B-Eng. 2008, 39, 316–326. [Google Scholar] [CrossRef]
  12. Boulanger, R.W.; Khosravi, M.; Khosravi, A.; Wilson, D.W. Remediation of liquefaction effects for an embankment using soil-cement walls: Centrifuge and numerical modeling. Soil Dyn. Earthq. Eng. 2018, 114, 38–50. [Google Scholar] [CrossRef]
  13. Park, T.; Lee, S.Y.; Voyiadjis, G.Z. Finite element vibration analysis of composite skew laminates containing delaminations around quadrilateral cutouts. Compos. Pt. B-Eng. 2009, 40, 225–236. [Google Scholar] [CrossRef]
  14. Amornfa, K.; Quang, H.; Tuan, T.V.V. Effect of groundwater level change on piled raft foundation in Ho Chi Minh City, Viet Nam using 3D-FEM. Geomech. Eng. 2023, 32, 387–396. [Google Scholar] [CrossRef]
  15. Avcar, M.; Hadji, L.; Akan, R. The influence of Winkler-Pasternak elastic foundations on the natural frequencies of imperfect functionally graded sandwich beams. Geomech. Eng. 2022, 31, 99–112. [Google Scholar] [CrossRef]
  16. Bashiri, A.H.; Akbas, S.D.; Abdelrahman, A.A.; Assie, A.; Eltaher, M.A.; Mohamed, E.F. Vibration of multilayered functionally graded deep beams under thermal load. Geomech. Eng. 2021, 24, 545–557. [Google Scholar] [CrossRef]
  17. Yu, M.L.; Zuo, J.P.; Sun, Y.J.; Mi, C.N.; Li, Z.D. Investigation on fracture models and ground pressure distribution of thick hard rock strata including weak interlayer. Int. J. Min. Sci. Technol. 2022, 32, 137–153. [Google Scholar] [CrossRef]
  18. Lee, S.Y.; Wooh, S.C.; Yhim, S.S. Dynamic behavior of folded composite plates analyzed by the third order plate theory. Int. J. Solids Struct. 2004, 41, 1879–1892. [Google Scholar] [CrossRef]
  19. Gravanis, E.; Sarris, E. A working model for estimating CO2-induced uplift of cap rocks under different flow regimes in CO2 sequestration. Geomech. Energy Environ. 2023, 33, 15. [Google Scholar] [CrossRef]
  20. Mi, C.N.; Zuo, J.P.; Sun, Y.J.; Zhao, S.K. Investigation on Rockburst Mechanism Due to Inclined Coal Seam Combined Mining and its Control by Reducing Stress Concentration. Nat. Resour. Res. 2022, 31, 3341–3364. [Google Scholar] [CrossRef]
  21. Sun, Y.J.; Zuo, J.P.; Karakus, M.; Liu, L.; Zhou, H.W.; Yu, M.L. A New Theoretical Method to Predict Strata Movement and Surface Subsidence due to Inclined Coal Seam Mining. Rock Mech. Rock Eng. 2021, 54, 2723–2740. [Google Scholar] [CrossRef]
  22. Zhang, J.F. Analytical Solution and Engineering Application of the Inclined Rectangle Plate under Longitudinal and Lateral Load. In Proceedings of the International Conference on Structures and Building Materials, Guangzhou, China, 7–9 January 2011; pp. 696–700. [Google Scholar]
  23. Imrak, E.; Fetvaci, C. The Deflection Solution of a Clamped Rectangular Thin Plate Carrying Uniformly Load. Mech. Based Des. Struct. Mech. 2009, 37, 462–474. [Google Scholar] [CrossRef]
  24. Bakker, M.C.M.; Rosmanit, M.; Hofmeyer, H. Approximate large-deflection analysis of simply supported rectangular plates under transverse loading using plate post-buckling solutions. Thin-Walled Struct. 2008, 46, 1224–1235. [Google Scholar] [CrossRef]
  25. Li, X.L.; Liu, C.W.; Liu, Y.; Xie, H. The Breaking Span of Thick and Hard Roof Based on the Thick Plate Theory and Strain Energy Distribution Characteristics of Coal Seam and Its Application. Math. Probl. Eng. 2017, 2017, 14. [Google Scholar] [CrossRef]
  26. Liao, F.; Meng, D.Y.; Yang, Z.Y.; Wang, H.; Wu, R.J. Research on the Calculation Method of Internal Force of Combined Energy Dissipation Shed-tunnel Roof. In Proceedings of the 5th Annual International Conference on Material Science and Engineering (ICMSE), Xiamen, China, 20–22 October 2017. [Google Scholar]
  27. Wu, L.Y.; Bai, H.B.; Ma, D. Prediction and Prevention of Water Inrush Hazards from Bed Separation Space. Mine Water Environ. 2021, 40, 657–670. [Google Scholar] [CrossRef]
  28. Li, Y.X.; Ma, J.; Yang, K.M.; Jiang, K.G.; Gu, X.R.; Peng, L.S.; Chen, X.Y. Isolated overburden grout injection technology mining and grouting parameters discussion and optimization. Environ. Earth Sci. 2024, 83, 30. [Google Scholar] [CrossRef]
  29. Wang, W.R.; Lu, Y.; Zhao, D.Z.; Zhang, J.M.; Bai, X.S. Research on large deflection deformation reconstruction of elastic thin plate based on strain monitoring. Measurement 2020, 149, 11. [Google Scholar] [CrossRef]
  30. Liu, G.J.; Mu, Z.L.; Chen, J.J.; Yang, J.; Cao, J.L. Rock burst risk in an island longwall coal face by stress field. Geosci. J. 2018, 22, 609–622. [Google Scholar] [CrossRef]
  31. Sun, Y.J.; Zuo, J.P.; Karakus, M.; Wang, J.T. Investigation of movement and damage of integral overburden during shallow coal seam mining. Int. J. Rock Mech. Min. Sci. 2019, 117, 63–75. [Google Scholar] [CrossRef]
  32. Veiskarami, M.; Kumar, J.; Valikhah, F. Effect of the Flow Rule on the Bearing Capacity of Strip Foundations on Sand by the Upper-Bound Limit Analysis and Slip Lines. Int. J. Geomech. 2014, 14, 11. [Google Scholar] [CrossRef]
  33. Gesualdo, A.; Minutolo, V.; Nunziante, L. Local collapse in soft rock bank cavities. J. Geotech. Geoenviron. Eng. 2001, 127, 1037–1042. [Google Scholar] [CrossRef]
  34. Karamanski, T.; Kazakov, K. Modified model of a plate based on the Winkler foundation. In Proceedings of the 12th International Conference on Computational Methods and Experimental Measurements, Malta, 20–22 June 2005; pp. 417–423. [Google Scholar]
  35. Mofid, M.; Noroozi, M. A Plate on Winkler Foundation with Variable Coefficient. Sci. Iran. Trans. A-Civ. Eng 2009, 16, 249–255. [Google Scholar]
  36. Domagalski, L.; Jedrysiak, J. On the elastostatics of thin periodic plates with large deflections. Meccanica 2012, 47, 1659–1671. [Google Scholar] [CrossRef]
  37. Xu, W.; Zhao, S.J.; Zhang, W.Z.; Zhao, X.B. Numerical Simulation of Crack Propagation and Branching Behaviors in Heterogeneous Rock-like Materials. Buildings 2024, 14, 17. [Google Scholar] [CrossRef]
  38. Zhang, K.Y.; Liu, F.; Xia, K.W.; Xu, Y.; Dong, P.; Yu, C.Y. On the calibration and verification of Voronoi-based discontinuous deformation analysis for modeling rock fracture. J. Rock Mech. Geotech. Eng. 2023, 15, 2025–2038. [Google Scholar] [CrossRef]
  39. Liu, T. Mining rock impact and control engineering and its application. J. China Coal Socirty 1995, 20, 1–5. [Google Scholar]
  40. McNally, G.H.; Willey, P.L.; Creech, M. Geological Factorrs Influencing Longwall-iduced Subsidence. In Proceedings of the Symposiun on Geology in Longwall Mining, Sydney, Australia, 12–13 November 1996; pp. 257–267. [Google Scholar]
  41. Holla, L.; Barclay, E. Mine Subsidence in the Southern Coalfield, NSW, Australia; NSW Department of Mineral Resources: Maitland, NSW, Australia, 2000.
Figure 1. Diagram of stress transfer from the overlying bedrock to the roof plate with both sides stable surrounding rocks.
Mathematics 12 01960 g001
Figure 2. Diagram of Winkler foundation model.
Mathematics 12 01960 g002
Figure 3. Diagram of the two-parameter foundation model.
Mathematics 12 01960 g003
Figure 4. Diagram of distribution of bending moment and shear force in a thin plate.
Mathematics 12 01960 g004
Figure 5. Additional elongation due to bending of mid-plane by lateral load.
Mathematics 12 01960 g005
Figure 6. Additional shear strain generated by lateral load bending the mid-plane.
Mathematics 12 01960 g006
Figure 7. Diagram of bedrock “inverted funnel-shaped” fracture.
Mathematics 12 01960 g007
Figure 8. Diagram of the distribution of the main stress traces and fracture shape of the initial bedrock fracture.
Mathematics 12 01960 g008
Figure 9. Diagram of the distribution of main stress traces and fracture shape of bedrock periodic fracture.
Mathematics 12 01960 g009
Figure 10. Diagram of the geographical location and geological structure of the study area.
Mathematics 12 01960 g010
Figure 11. Analysis of different stratigraphic models and rock seam forces by coal seam inclination.
Mathematics 12 01960 g011
Figure 12. Work face drilling data and key strata judgment.
Mathematics 12 01960 g012
Figure 13. Flowchart for large-deflection inclined thin plate model.
Mathematics 12 01960 g013
Figure 14. Bending and breaking of key strata caused by mining, the regional division of “Vertical Three Zones”, dynamic development of Bed-separation.
Mathematics 12 01960 g014
Figure 15. Diagram of the three-dimensional expansion of the principal key strata deflection face in the regional coordinate system (working face mining distance 135 m, 300 m, 414 m, 535 m, 651 m).
Mathematics 12 01960 g015aMathematics 12 01960 g015b
Figure 16. Variation of the maximum height of Bed-separation development below the principal key strata with the advancing distance of the 7225 work face.
Mathematics 12 01960 g016
Figure 17. Volume of the Bed-separation cavity under the principal key strata with the advancing distance of the 7225 working face.
Mathematics 12 01960 g017
Figure 18. 3DEC program 7225 working face excavation deformation area design model.
Mathematics 12 01960 g018
Figure 19. 3DEC numerical simulation program calculates the deflection value of the principal key strata (work face mining distance 300 m, 414 m, 535 m, 651 m).
Mathematics 12 01960 g019
Figure 20. Diagram of the maximum height variation of Bed-separation developed under the principal key strata assuming a mining distance of 3000 m.
Mathematics 12 01960 g020
Figure 21. Diagram of the assumed mining distance of 3000 m for the volume change of the Bed-separation cavity under the principal key strata.
Mathematics 12 01960 g021
Figure 22. Influence of different mining widths on the development height of the overlying Bed-separation under the principal key strata.
Mathematics 12 01960 g022
Figure 23. Impact of different mining widths on the volume of the overlying Bed-separation cavity below the principal critical strata.
Mathematics 12 01960 g023
Table 1. Reference table of physical properties of each rock strata in drill holes.
LithologyDensity
(kg/m3)
Tensile Strength
(MPa)
Elastic Modulus
(GPa)
Shear Modulus
(GPa)
Cohesion
(MPa)
Angle of Internal Friction (°)Poisson’s Ratio
Loose layer22000.10.30.1151.5200.3
Mudstone26001.2135.281.7331.30.23
Siltstone27004.4122.99.74.7431.40.18
Coarse sandstone27004.0234.214.375.1737.50.19
Fine sandstone27004.3434.114.963.1535.90.14
Coal13000.35.62.150.5250.3
Table 2. Break distance and fracture trace angle between key strata and other rock strata in the caved zone and fractured zone.
Rock Strata NumberInitial Breakage Distance (m)Initial Fracture Trace Angle (°)Periodic Breakage Distance (m)Periodic Fracture Trace Angle (°)
No. 3 fine sandstone (KS 1)3361.22155.4
No. 4 to No. 14 soft rocks 78.2 62.3
No.15 siltstone (KS 2)3864.42156.2
No. 16 to No. 23 soft rocks 76.2 60.4
Table 3. Comparison of empirical formulas and modeling results for the development height of the “Vertical Three Zones”.
Selection ModelsCaved Zone Height (m)Fractured Zone Height (m)Continuous Bending Zone Height (m)
Empirical formulas31.07~46.6133.27~44.47175.68~202.42
Model calculations38.0741.13187.56
Table 4. Mining distance of the working face corresponding to the research date and deflection parameters of the principal key strata.
Distance of Working Face Mining (m)PKS Deflection Start Position (m)PKS Deflection End Position (m)PKS Maximum Deflection Value (mm)PKS Deflection Space Volume (m3)Corresponding Date of Mining
13532719.613.515 September 2015
300322361407.61076827 October 2015
414323502090.824,9332 December 2015
535324712683.244,17226 December 2015
65132586271456,48515 April 2016
Table 5. Study date corresponding working face mining distance and surface subsidence basin inscription parameters.
Width of Working Face (m)Initial
Breakage Distance (m)
Periodic Breakage Distance (m)PKS Deflection Start Position (m)PKS
Deflection End Position (m)
Bed-Separation Maximum Deflection Value (mm)Bed-Separation Deflection Space Volume (m3)
1203216365852594312
15033213258754511,228
1803422293298259169
2103524262518669251
24035272422388410,043
Disclaimer/Publisher’s Note: The statements, opinions and data contained in all publications are solely those of the individual author(s) and contributor(s) and not of MDPI and/or the editor(s). MDPI and/or the editor(s) disclaim responsibility for any injury to people or property resulting from any ideas, methods, instructions or products referred to in the content.

