Article

Research on Vehicle AEB Control Strategy Based on Safety Time–Safety Distance Fusion Algorithm

1
Hubei Key Laboratory of Advanced Technology for Automotive Components, Wuhan University of Technology, Wuhan 430070, China
2
Hubei Collaborative Innovation Center for Automotive Components Technology, Wuhan University of Technology, Wuhan 430070, China
3
Hubei Research Center for New Energy & Intelligent Connected Vehicle, Wuhan University of Technology, Wuhan 430070, China
4
School of Automotive Engineering, Wuhan University of Technology, Wuhan 430070, China
*
Author to whom correspondence should be addressed.
Mathematics 2024, 12(12), 1905; https://doi.org/10.3390/math12121905
Submission received: 27 May 2024 / Revised: 14 June 2024 / Accepted: 17 June 2024 / Published: 19 June 2024
(This article belongs to the Special Issue Modeling, Optimization and Control of Industrial Processes)

Abstract

:
With the increasing consumer focus on automotive safety, Autonomous Emergency Braking (AEB) systems, recognized as effective active safety technologies for collision avoidance and the mitigation of collision-related injuries, are gaining wider application in the automotive industry. To address the issues of the insufficient working reliability of AEB systems and their unsatisfactory level of accordance with the psychological expectations of drivers, this study proposes an optimized second-order Time to Collision (TTC) safety time algorithm based on the motion state of the preceding vehicle. Additionally, the study introduces a safety distance algorithm derived from an analysis of the braking process of the main vehicle. The safety time algorithm focusing on comfort and the safety distance algorithm focusing on safety are effectively integrated in the time domain and the space domain to obtain the safety time–safety distance fusion algorithm. A MATLAB/Simulink–Carsim joint simulation platform has been established to validate the AEB control strategy in terms of safety, comfort, and system responsiveness. The simulation results show that the proposed safety time–safety distance fusion algorithm consistently achieves complete collision avoidance, indicating a higher safety level for the AEB system. Furthermore, the application of active hierarchical braking minimizes the distance error, at under 0.37 m, which meets psychological expectations of drivers and improves the comfort of the AEB system.

1. Introduction

The Autonomous Emergency Braking (AEB) system assesses collision risks and achieves complete collision avoidance or reduces collision damage through active warning and active braking. Statistical analysis indicates that the AEB system can lead to a 22% reduction in accident mortality rates and a 27% decrease in severe pedestrian injuries, as well as a 38% reduction in the incidence of rear-end collisions. [1,2,3]. However, existing AEB systems face challenges such as insufficient working reliability in different road conditions and unsatisfactory level of accordance with the psychological expectations of drivers. Therefore, the development of effective AEB control strategies can enhance the safety, comfort, and responsiveness of the AEB system. Park et al. [4] conducted the detection of pedestrian targets based on funnel plot method and calculated the early warning and braking distance by using the fusion information of vehicles and sensors. The test demonstrated that the vehicle equipped with a pedestrian AEB system could effectively avoid or mitigate accidents when traveling at a speed of 40 km/h.
Tokyo Institute of Technology [5] proposed a first-order safety time model using TTC as an indicator. Liu et al. [6] assessed vehicle collision risks based on TTC and designed a control strategy combining PID and BP neural networks. Pei et al. [7] used the reciprocal of collision time (TTC−1) as an evaluation index and established a hierarchical safety distance model based on the danger coefficient ε. Lie Guo et al. [8] introduced a braking model based on second-order TTC, which compares the collision time calculated by the second-order TTC with a preset threshold for accurate braking time judgment. These studies primarily focus on the collision avoidance strategy that emphasizes comfort, based on the time of reaction. Gounis et al. [9] formulated an Autonomous Emergency Braking (AEB) control system based on a safety distance model. The simulation outcomes indicate that the system exhibits superior performance in emergency braking scenarios. Luo et al. [10] proposed a minimum safety distance model based on time headway and safe braking distance. Gu et al. [11] designed a safety distance model and defined dimensionless warning algorithms to achieve hierarchical early warnings and autonomous emergency braking. Ao et al. [12] designed an AEB control strategy combining safety time and safety distance based on forward dangerous target identification, capable of issuing collision warnings and executing hierarchical active braking. These studies focus on collision avoidance based on driving distance for safety. Cheng et al. [13] proposed a lateral stability coordinated collision avoidance control system (LSCACS) based on model predictive control (MPC). MPC was used as the upper controller to calculate the required deceleration and additional yaw moment, and the lower controller controlled the wheel cylinder pressure by calculating the braking force required by the tire. The HIL (Hardware-in-the-Loop) testing has substantiated its commendable performance in collision avoidance and yaw stability. Han et al. [14] modified the TTC braking threshold based on the peak road friction estimated by the sliding tire model. Yang et al. [15] trained the AEB fuzzy neural network controller based on the longitudinal anti-collision braking control data of experienced drivers. Meanwhile, a genetic algorithm was introduced to optimize the controller and a PID algorithm was used to control the expected deceleration. Zeng et al. [16] quickly estimated the road adhesion coefficient based on the ground reflectivity extracted by multi-beam lidar and applied it to the AEB algorithm to optimize it. Considering the performance of the EHB system, the enhanced AEB algorithm exhibited a higher degree of congruence with real-world conditions.
In summary, the current research on AEB control strategies primarily focuses on safety-oriented collision avoidance strategies based on safe distance and comfort-focused collision avoidance strategies based on reaction characteristics, i.e., safety distance algorithms and safety time algorithms. However, most of these strategies are calibrated based on ideal conditions. These models, when confronted with fluctuating traffic conditions and diverse driver behaviors, still requires further verification, making it challenging to simultaneously meet the safety and comfort requirements of the AEB system.
This study aims to enhance the safety, comfort, and responsiveness of the AEB system by proposing an optimized second-order TTC safety time algorithm based on the motion state of the preceding vehicle and a safety distance algorithm derived from the analysis of the braking process of main vehicles. The fusion of these algorithms in the time and spatial domains results in a unified safety time–safety distance fusion algorithm to improve the safety of the AEB system. Additionally, a hierarchical warning/braking control strategy for the AEB system is designed to enhance comfort and system responsiveness. The control architecture diagram of the AEB system in this study is shown in Figure 1.

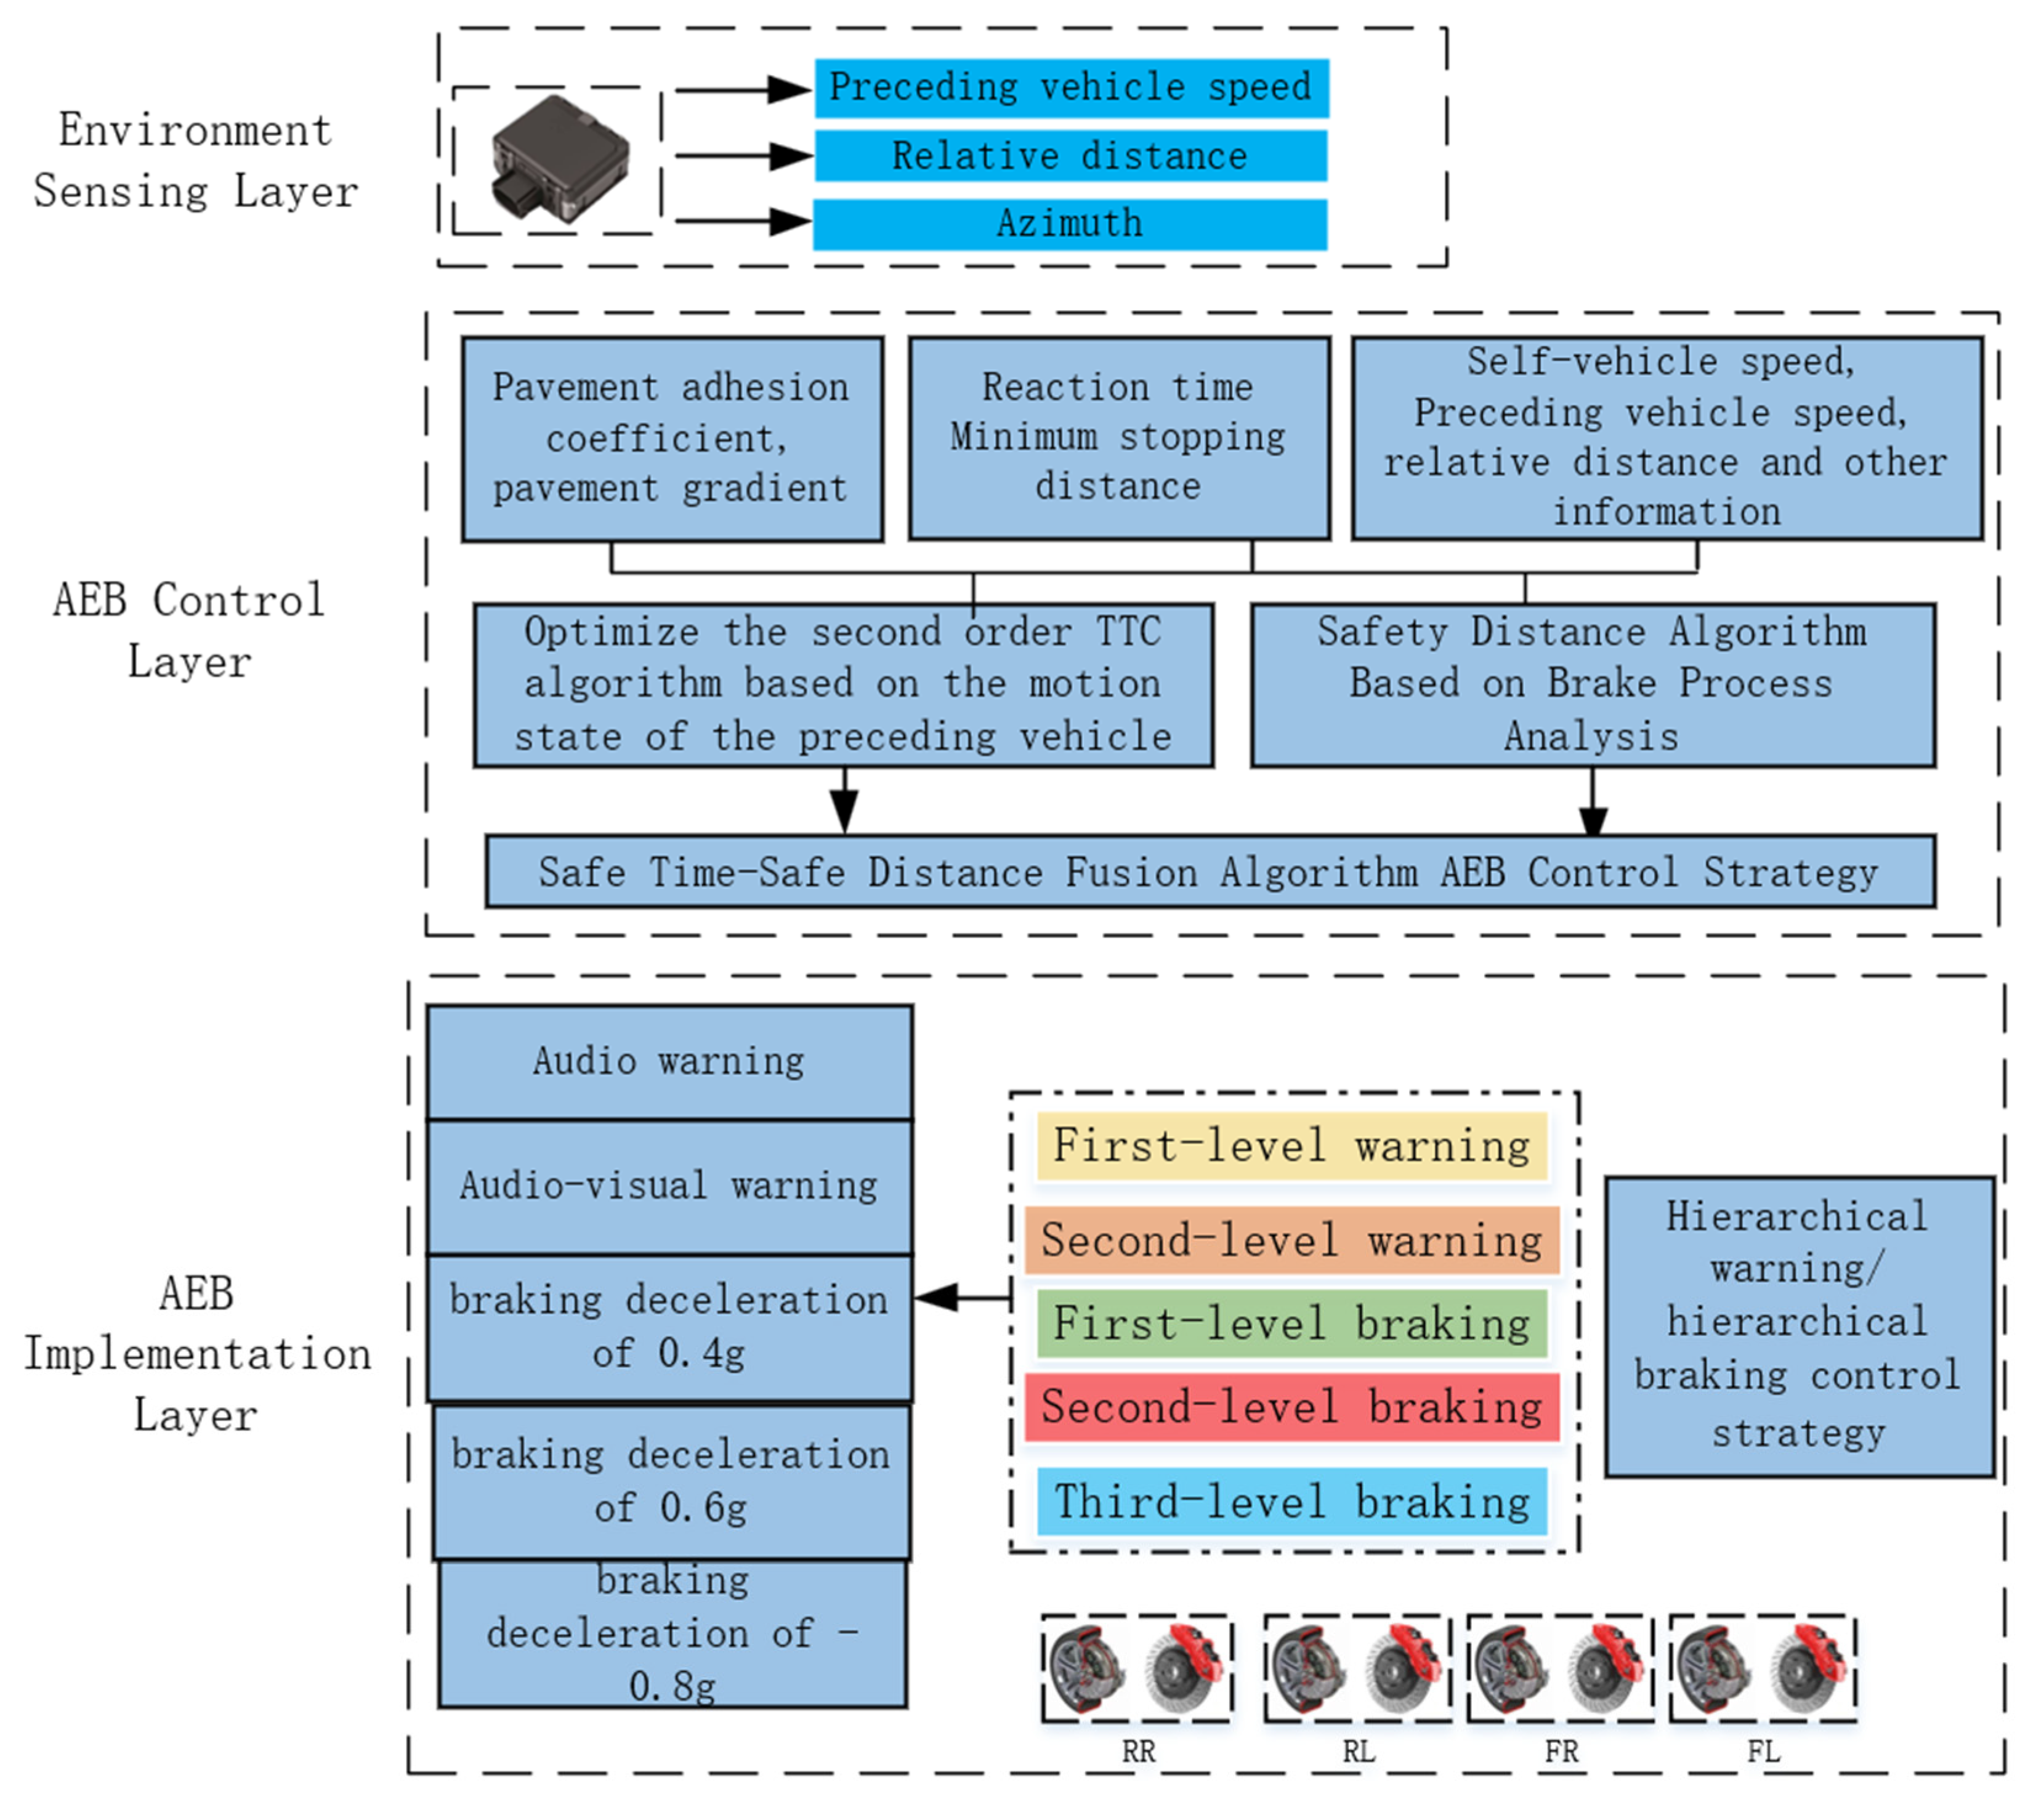
2. Safety Time–Safety Distance Fusion Algorithm

2.1. Optimized Second-Order TTC Safety Time Algorithm

This study proposes an optimized second-order TTC safety time algorithm based on the motion state of the preceding vehicle, considering four driving conditions: stationary preceding vehicle, preceding vehicle at a uniform velocity, preceding vehicle decelerating, and preceding vehicle accelerating. The algorithm is formulated after analyzing the first-order TTC model and collision risk, as shown in Table 1.
In Table 1, v 1 is the speed of the main vehicle, v 2 is the speed of the preceding vehicle, v r is the relative speed, and v r = v 1 v 2 , a 1 is the deceleration of the main vehicle; a 2 is the deceleration of the preceding vehicle, a r is the relative deceleration, and a r = a 1 a 2 , S r is the relative distance.

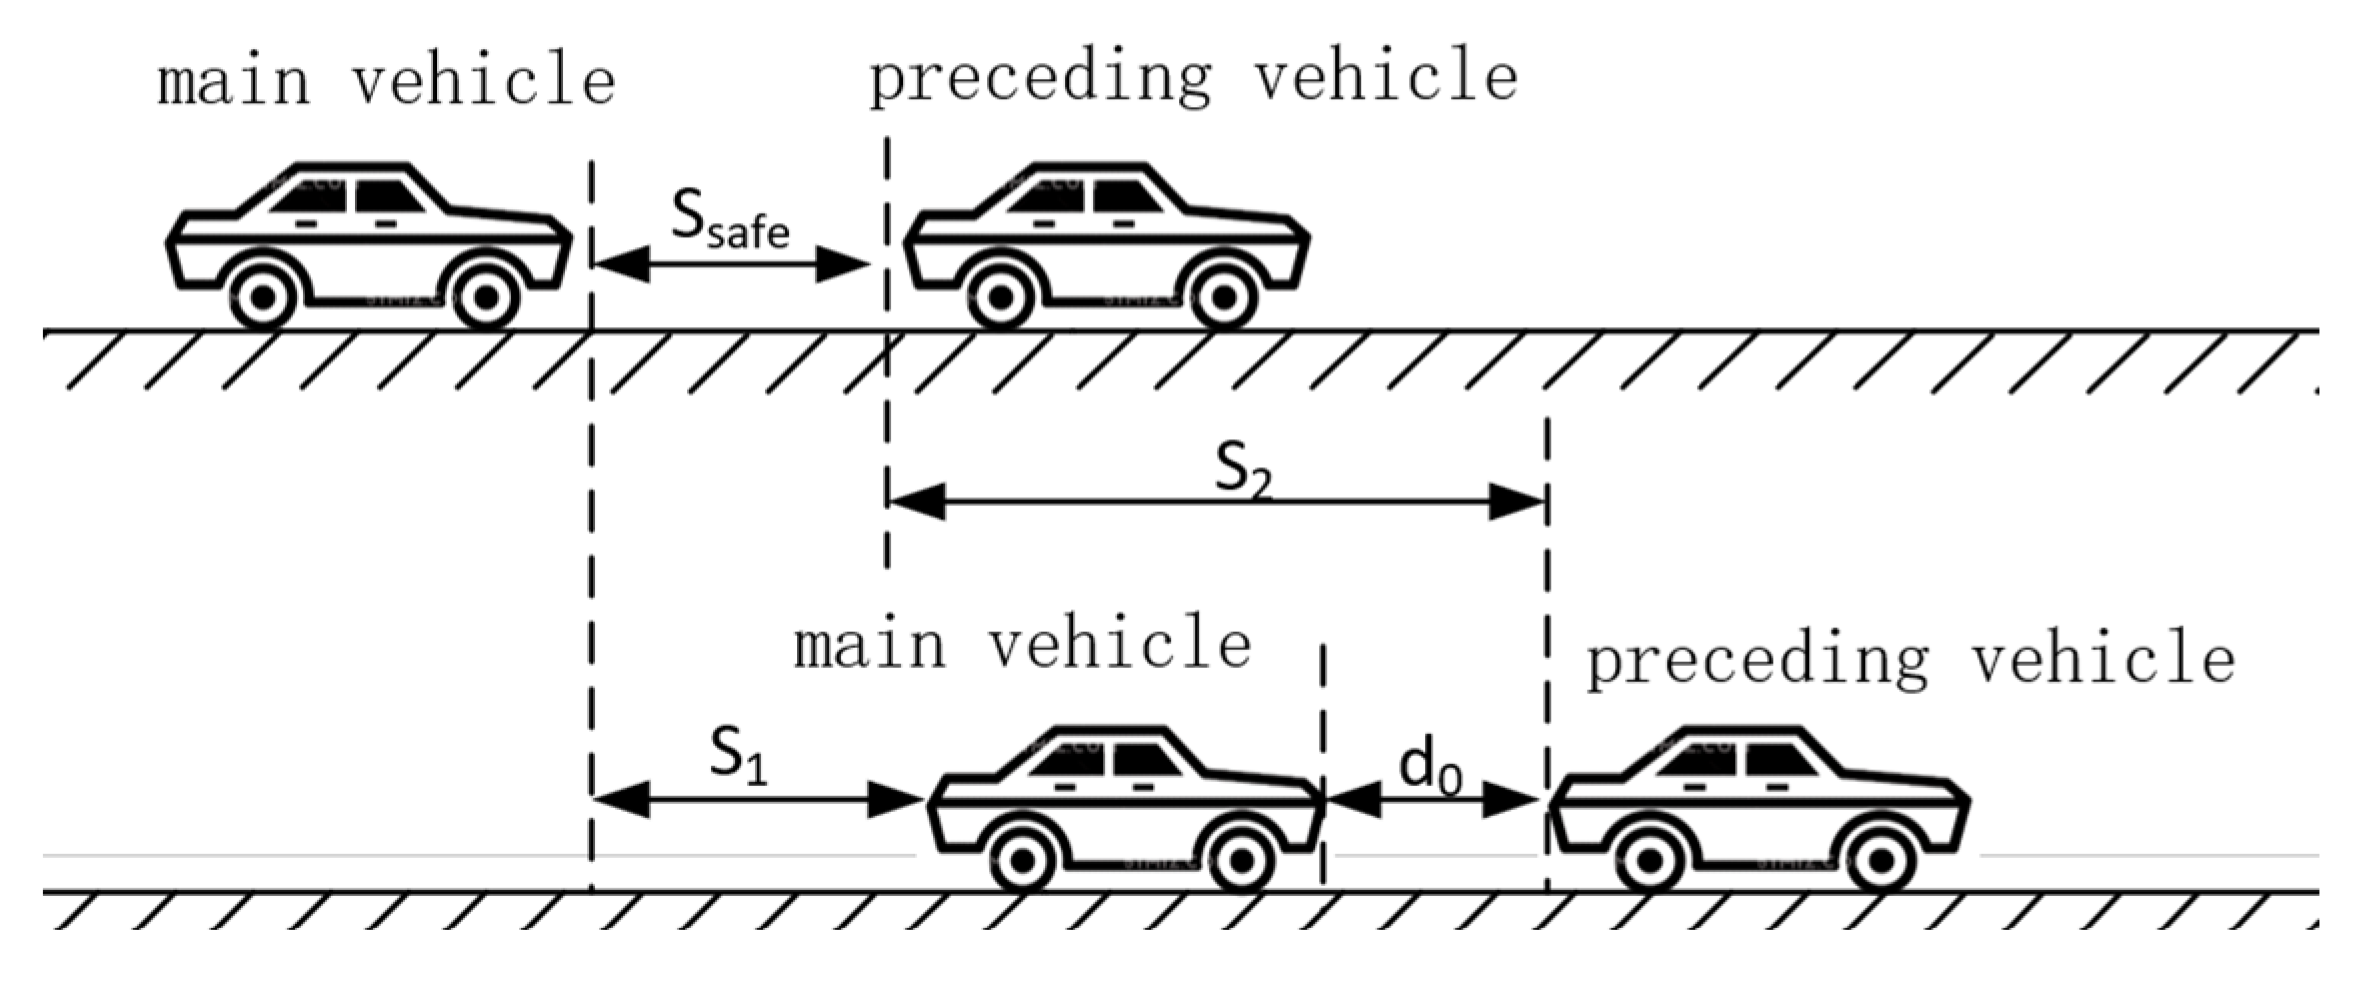
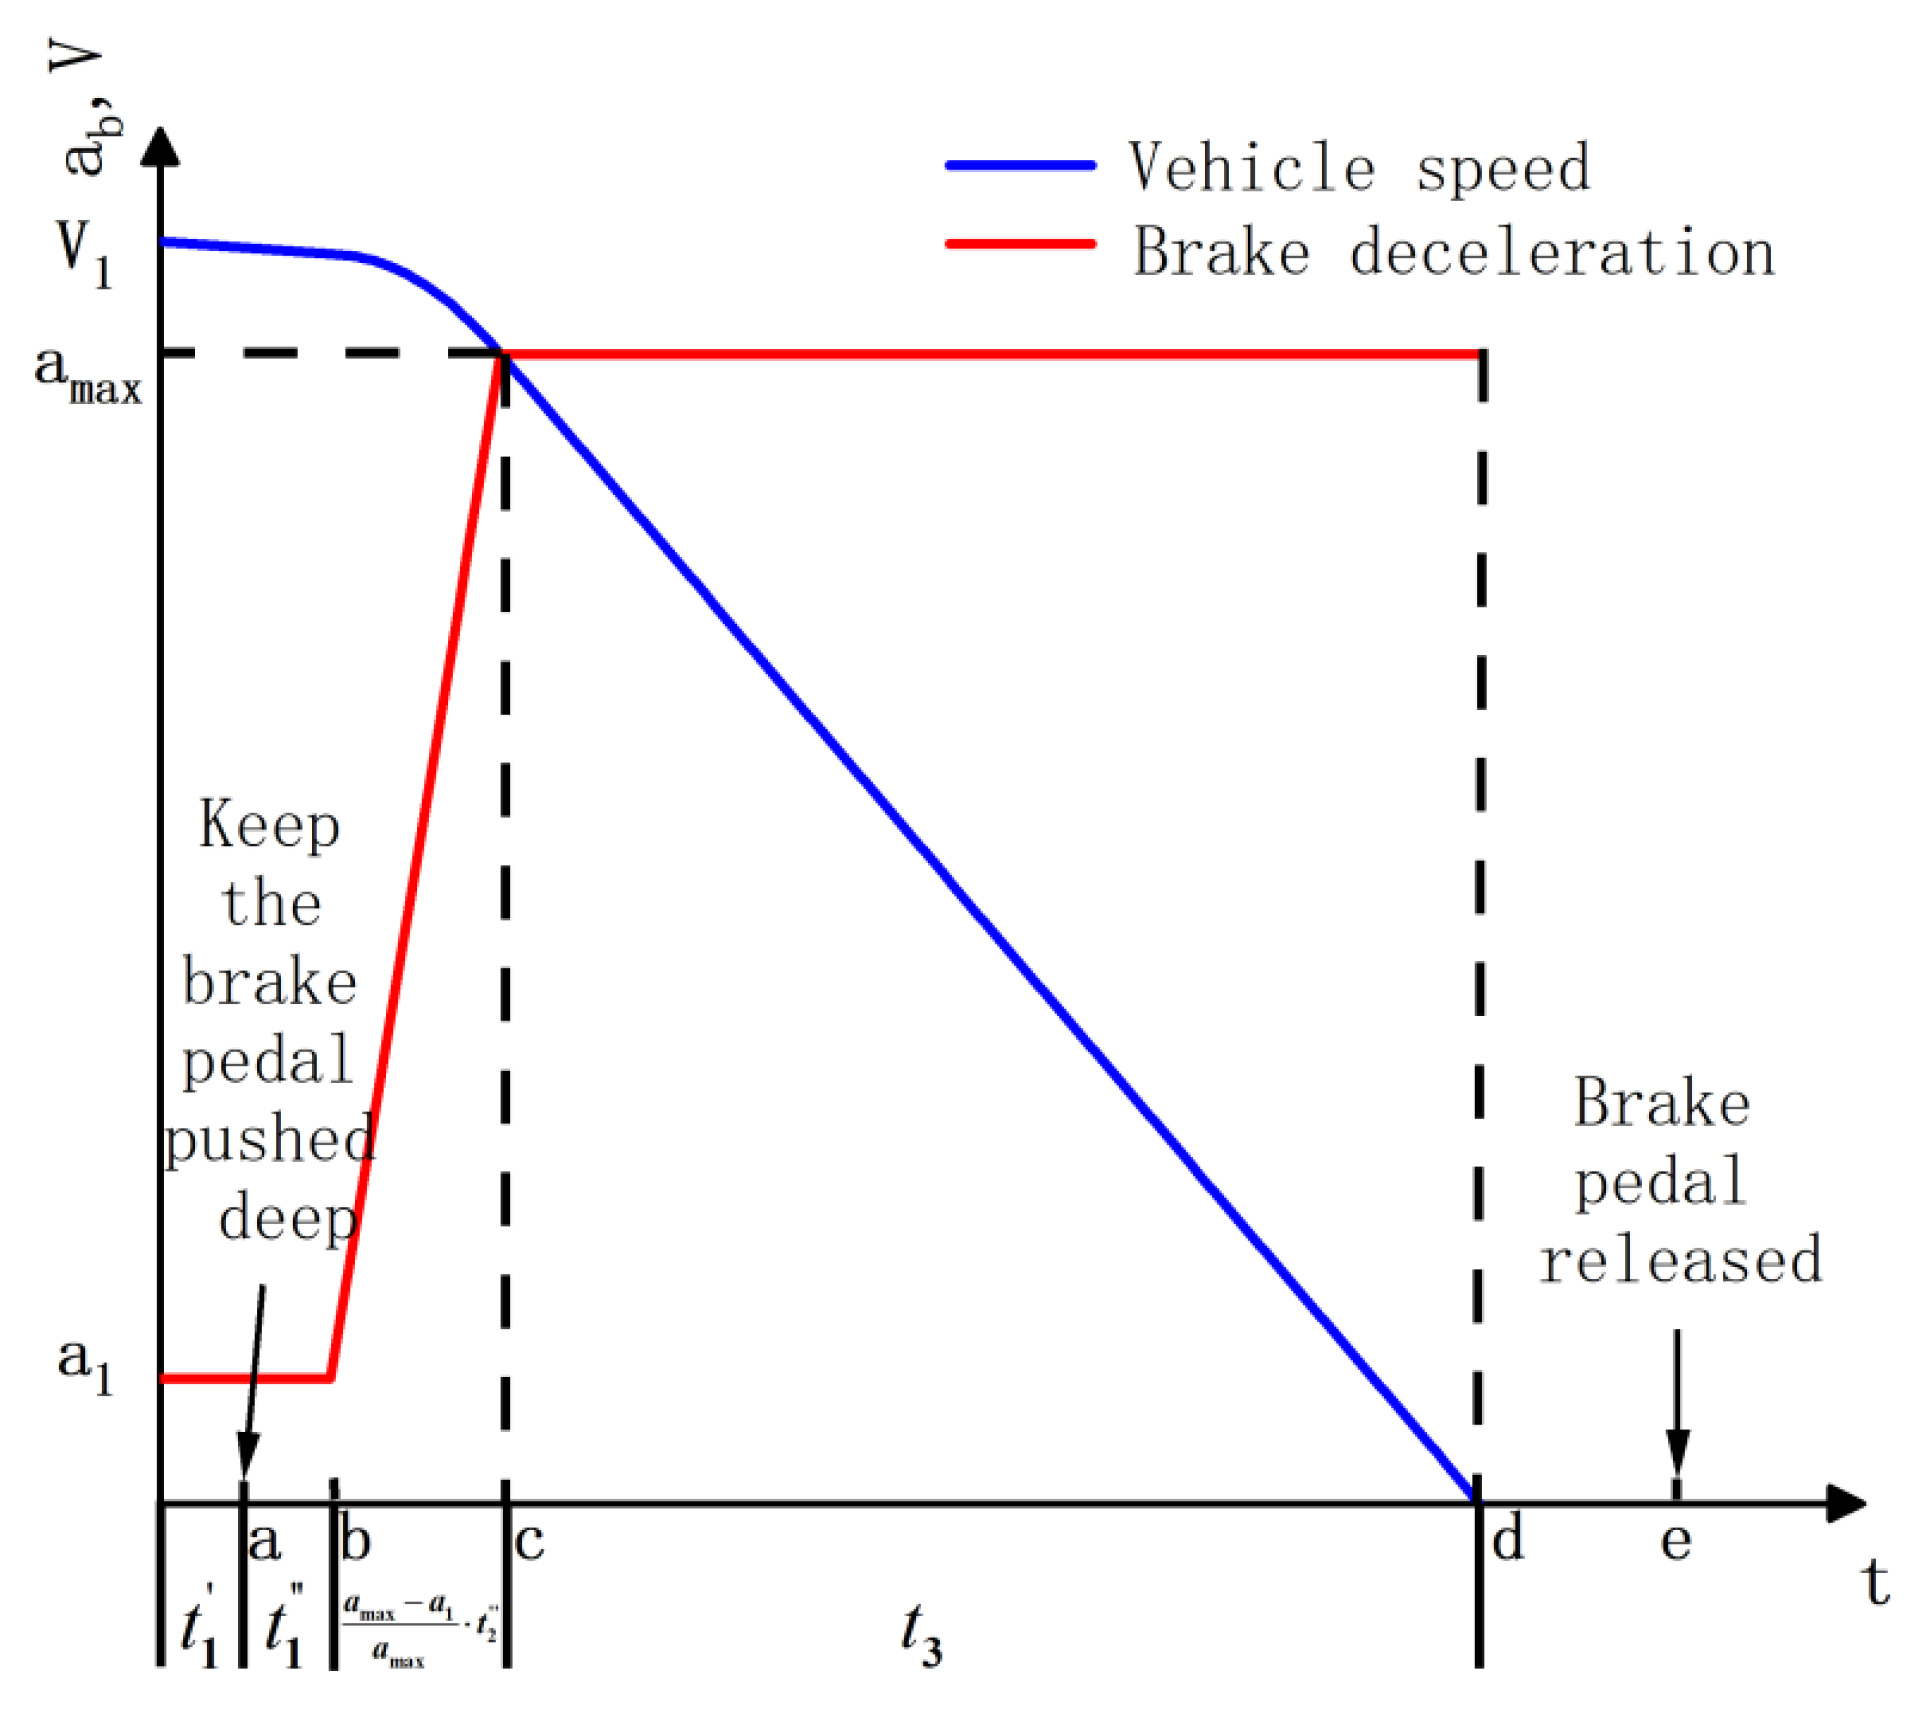
2.2. Safety Distance Algorithm Based on Brake Process Analysis

This study proposes a safety distance algorithm by analyzing the braking process of the main vehicle. As shown in Figure 2, it illustrates the displacement of the main vehicle and the preceding vehicle during the braking process. The minimum safe distance S s a f e is given by:
S s a f e = S 1 + d 0 S 2
where S 1 is the travel distance of the main vehicle during the entire braking process, S 2 is the travel distance of the preceding vehicle, and d 0 is the minimum stopping distance.
Considering only the longitudinal motion of the vehicle and neglecting the lateral movements such as yaw, roll, side, and vertical motions during travel, as well as air resistance and rolling resistance, the maximum deceleration a m a x that the vehicle can provide while braking on a road surface with a coefficient of adhesion μ and a slope of β is given by:
a m a x = μ g c o s θ + g s i n θ
The safety distance algorithm proposed in this study involves two scenarios: the point at which the driver of the main vehicle begins to apply the brake and the point at which the driver of the main vehicle has begun to apply the brake. Figure 3 and Figure 4 illustrate the braking process in schematic form. The algorithm is based on the driving conditions of the preceding vehicle and sets the following thresholds: primary warning distance thresholds d w 1 _ 1 and d w 1 _ 2 , secondary warning distance thresholds d w 2 _ 1 and d w 2 _ 2 , primary braking distance thresholds d b 1 _ 1 and d b 1 _ 2 , secondary braking distance thresholds d b 2 _ 1 and d b 2 _ 2 , and tertiary braking distance thresholds d b 3 _ 1 and d b 3 _ 2 , as shown in Table 2. Table 3 provides detailed formulations for the calculation of these threshold values when the driver of the main vehicle realizes the need to start implementing the safe distance algorithm during braking. Part of the formulas in Table 3 are elaborated in detail, as shown in Table 4. Table 5 provides detailed formulations for the calculation of these threshold values when the driver has started to implement the safe distance algorithm during braking. Part of the formulas in Table 5 are elaborated in detail, as shown in Table 6.
In Table 2, v 1 is speed of the main vehicle when the driver begins to apply the brake; v 2 is speed of the main vehicle when the deceleration reaches its maximum value; t 1 a is the time elapsed between the time the driver of the primary vehicle realizes the need to start applying the brakes and the time when the primary vehicle starts applying the brakes, and t 1 a = t 1 + t 1 + t 2 ; t 2 a is the time elapsed between the time when the main vehicle starts applying the brakes and the time when the main vehicle’s braking deceleration reaches its maximum value, and t 2 a = t 1 + t 1 + t 2 + t 2 ; and t 3 a is the time elapsed between the time when the main vehicle starts applying the brakes and the time when the main vehicle’s braking deceleration reaches its maximum value, and t 3 a = t 1 + t 1 + t 2 + t 2 + t 3 . t 1 is the time from when the driver receives the emergency stop signal to when the brain generates braking awareness, also referred to as reaction time of driver. This study focuses on a vehicle AEB control strategy based on safety time–safety distance fusion algorithm; the time of reaction was considered as constant. t 1 is the time from when a braking request is issued to when the actual vehicle starts generating braking force, which is taken as 0.1 s in this study [17]; t 2 is the time from the issuance of a braking request to the actual vehicle commencing the generation of braking force, which this study takes as 0.1 s [3]; t 2 is the braking force growth time, which is taken as 0.1 s in this study [10]; t 3 is the duration of the continuous braking time; and d 0 is the desired minimum stopping spacing, which is taken as 3 m in this study [18]. v 3 is the speed of the main vehicle from the initiation of braking to the point when the deceleration increases; v 4 is the speed of the main vehicle from the initiation of braking to the point where the deceleration increases. t 1 b is the time elapsed from the onset of braking in the main vehicle to the commencement of an increase in braking deceleration, and t 1 b = t 1 + t 1 ; t 2 b is the time span from the initiation of braking in the main vehicle to the moment when the braking deceleration reaches its maximum value, and t 2 b = t 1 + t 1 + a m a x a 1 a m a x t 2 ;   a n d   t 3 b is the duration from the commencement of braking in the main vehicle to the point at which the braking deceleration attains its maximum value, and t 3 b = t 1 + t 1 + a m a x a 1 a m a x t 2 + t 3 .

2.3. Safety Time–Safe Distance Fusion Algorithm

The optimized second-order TTC safety time algorithm effectively reflects the driving characteristics of the driver, offering a relatively high level of comfort. The safety distance algorithm based on the braking process is more suitable for emergency braking or stationary conditions, providing a higher degree of safety.
This study conducts an analysis within the time domain and spatial domain, aiming to integrate the advantages of the safety time algorithm and the safety distance algorithm. A fusion algorithm of safety time and safety distance is derived, which is based on the driving conditions of the leading vehicle. It assumes that the main vehicle brakes with a certain deceleration rate and would just collide with the leading vehicle when its speed reduces to v2. It combines the primary warning distance thresholds d w 1 _ 1 and d w 1 _ 2 , the secondary warning distance thresholds d w 2 _ 1 and d w 2 _ 2 , the primary braking distance thresholds d b 1 _ 1 and d b 1 _ 2 , the secondary braking distance thresholds d b 2 _ 1 and d b 2 _ 2 , and the tertiary braking distance thresholds d b 3 _ 1 and d b 3 _ 2 from the safety distance algorithm with the S r from the optimized second-order TTC safety time algorithm respectively. This integration leads to the derivation of primary warning TTC thresholds T T C w 1 , secondary warning TTC thresholds T T C w 2 , primary braking TTC thresholds T T C b 1 , secondary braking TTC thresholds T T C b 1 , and tertiary braking TTC thresholds T T C b 3 , as described in Table 7.

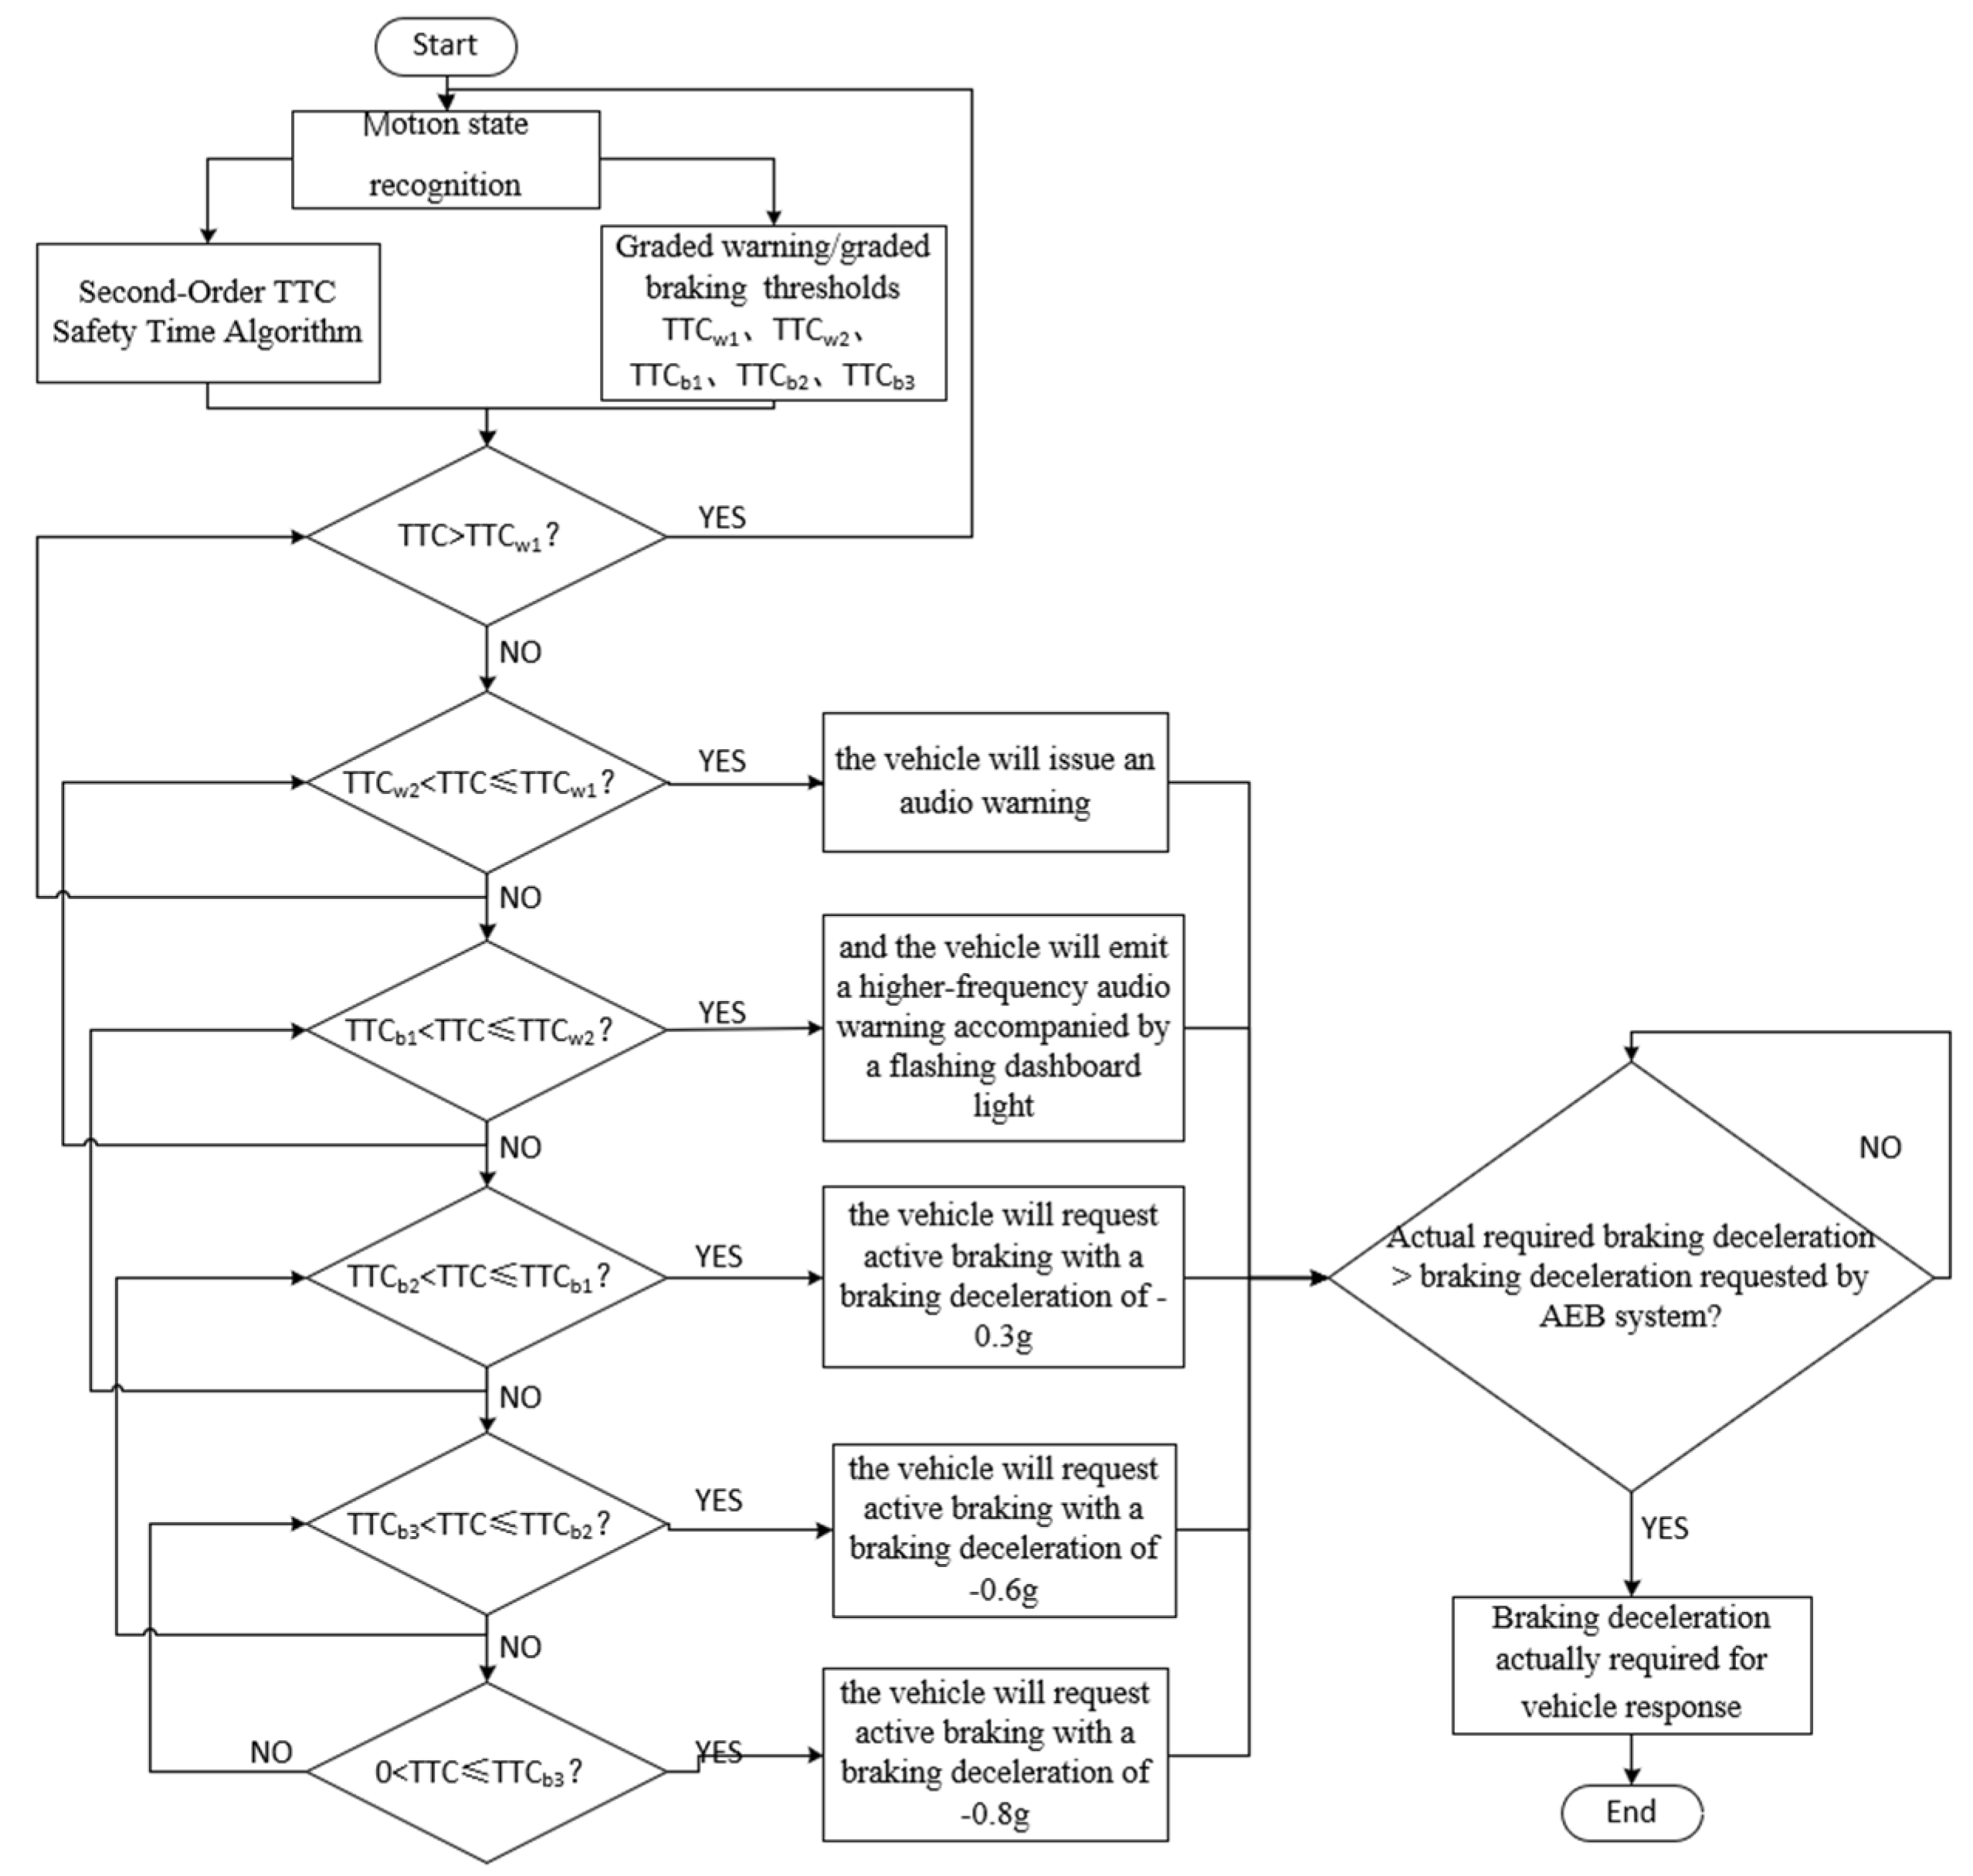
3. The Hierarchical Warning/Hierarchical Braking Control Strategy

This study designs a hierarchical warning/hierarchical braking control strategy for the AEB system based on the integrated algorithm, with the aim of improving the comfort and responsiveness of the AEB system.
The National Highway Traffic Safety Administration (NHTSA) has conducted experiments based on collision avoidance behaviors of drivers and has statistically compiled the corresponding deceleration data, as shown in Table 8. The data indicate that the average braking deceleration of the vast majority of drivers does not exceed −0.55 g, and the maximum braking deceleration does not exceed −0.92 g [19].
To maximize the comfort and system responsiveness of the AEB system’s intervention, this study proposes a two-level graded warning and three-level graded braking control strategy. The first- and second-level warnings are audio and audio-visual warnings, respectively. The braking deceleration requests for the first-, second-, and third-level braking are set at −0.3 g, −0.6 g, and −0.8 g, respectively. The flowchart of the graded warning/graded braking control strategy designed in this study is shown in Figure 5.
When T T C > T T C w 1 , the AEB system will not respond; when T T C w 2 < T T C < T T C w 1 , the primary warning will be activated, and the vehicle will issue an auditory warning to inform the driver to intervene with braking; when T T C b 1 < T T C < T T C w 2 , the secondary warning will be activated, and the vehicle will emit a higher frequency auditory warning, accompanied by flashing dashboard lights to alert the driver to intervene with braking; when T T C b 2 < T T C < T T C b 1 , the primary braking will be activated, and the vehicle will request active braking with a deceleration of −0.3 g; when T T C b 3 < T T C < T T C b 2 , the secondary braking will be activated, and the vehicle will request active braking with a deceleration of −0.6 g; and when 0 < T T C < T T C b 3 , the tertiary braking will be activated, and the vehicle will request active braking with a deceleration of −0.8 g. To maximize driver control over the vehicle, control is prioritized to the driver’s inputs when the actual required deceleration exceeds that requested by the AEB system.

4. Simulation Validation of AEB Control Strategy

4.1. Construction of the Joint Simulation Platform

Based on the maximum speeds allowed on various roads in the China-New Car Assessment Program (C-NCAP), the maximum speeds for urban, suburban, and high-speed roads are 50 km/h, 80 km/h, and 120 km/h, respectively. This study establishes a joint simulation scenario based on the C-NCAP vehicle AEB system testing standards and real-world driving scenarios, primarily considering urban and suburban driving scenarios that encompass both high and low speeds, as well as high and low friction road conditions. This study ultimately selects scenarios that include CCRs (stationary preceding vehicle), CCRm (uniformly moving preceding vehicle), CCRb (decelerating preceding vehicle), and an accelerating preceding vehicle scenario. Additionally, a vehicle dynamics model was established in Carsim, with the key vehicle parameters detailed in Table 9. A joint simulation platform using MATLAB/Simulink–Carsim (R2017b) has been established.

4.2. Joint Simulation Comparative Models and Evaluation Metrics

To validate the effectiveness of the AEB control strategy proposed in this study, the Honda model [20], the Berkeley model [21], and the TTC model [22] are adopted as comparative models in the joint simulation. The safety evaluation metrics selected include the preceding vehicle’s speed and relative distance to the main vehicle, as well as the speed reduction rate at the time of collision. Comfort evaluation metrics are based on the relative distance/TTC at the time of warning and the relative distance/TTC during active braking. System responsiveness is evaluated by the difference between the actual vehicle deceleration and the expected deceleration by the AEB system. These metrics are employed to complete the validation and analysis of the proposed AEB control strategy in this study.

4.3. Typical Test Scene Simulation and Analysis

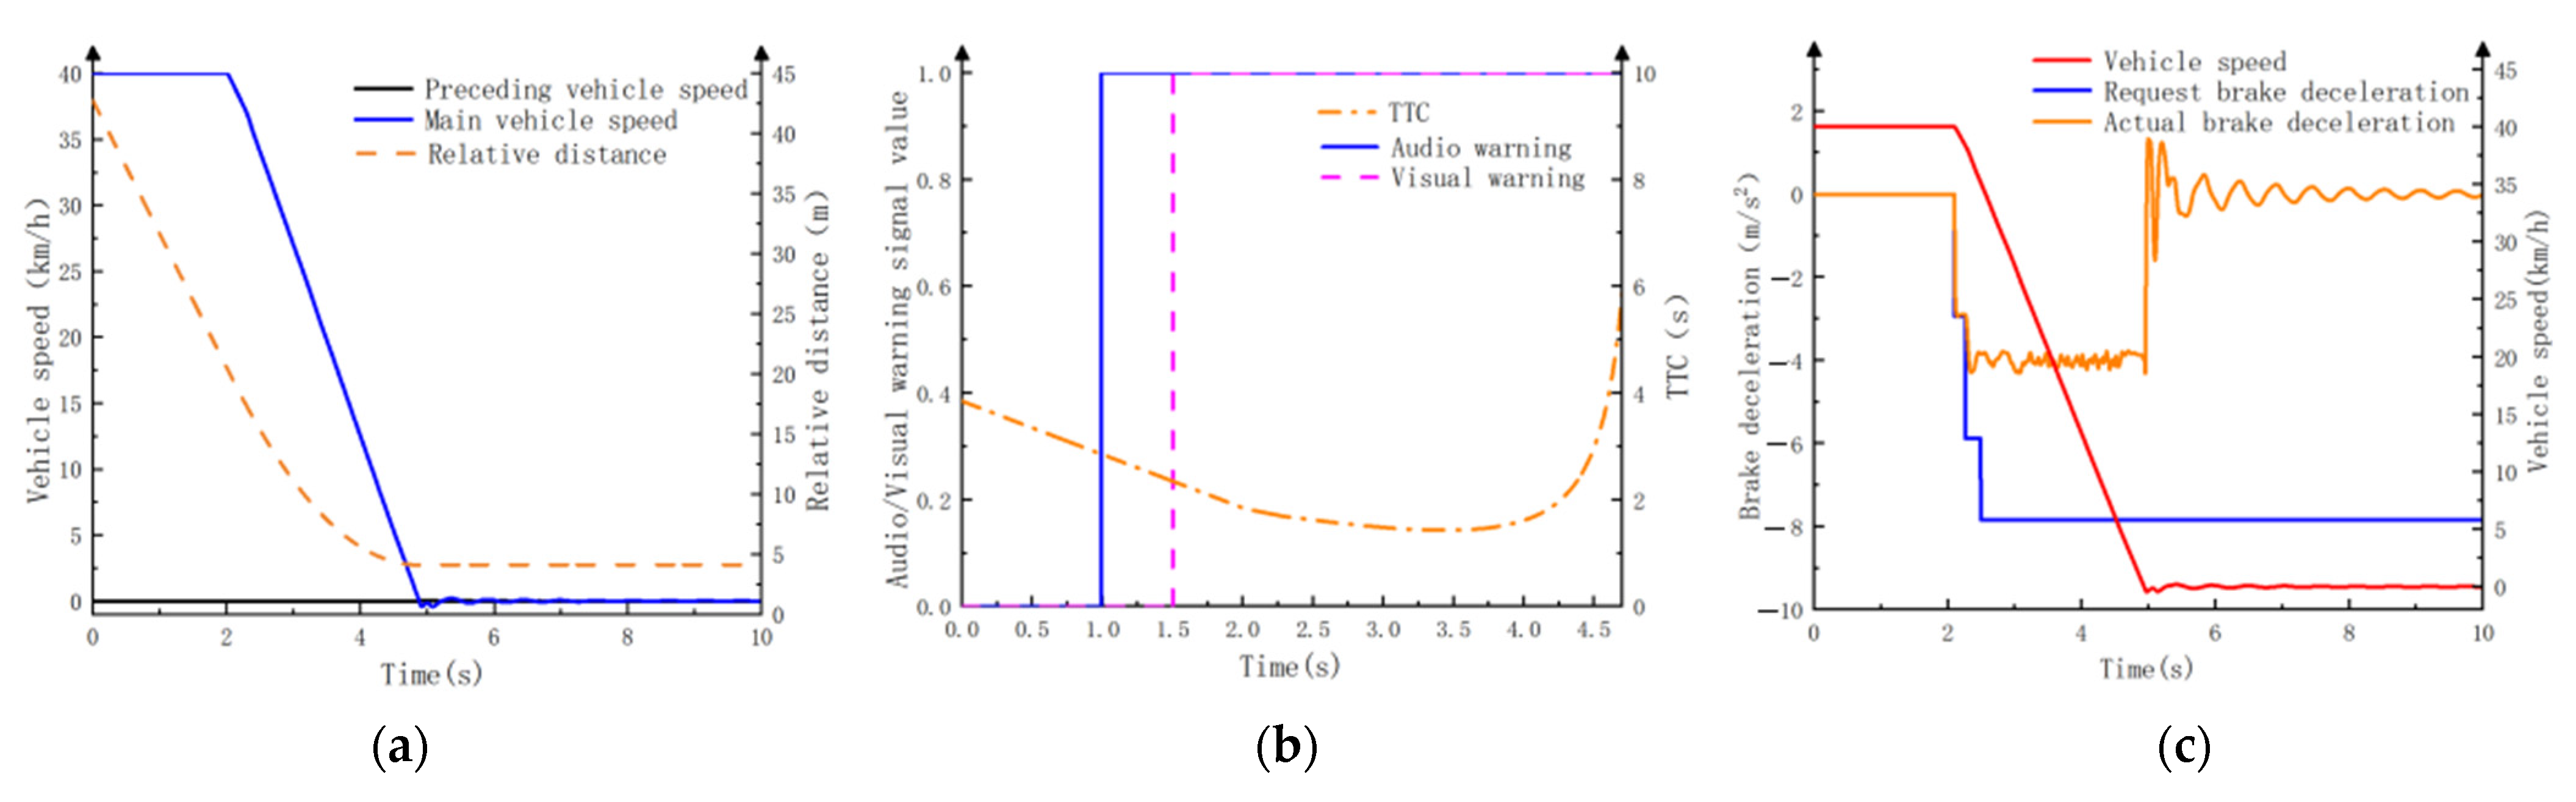
4.3.1. Test Conditions for CCRs Scenario

The preceding vehicle is initialized with a speed of 80 km/h on a road with a 9% downhill gradient and a coefficient of adhesion of 0.85. The stationary preceding vehicle is 100 m ahead of the main vehicle. As shown in Figure 6, the simulation results of the integrated algorithm under the CCRs scenario are presented.
Figure 6 indicates that the AEB system activates a primary auditory warning to alert the driver at a relative distance (TTC time) of 62.14 m (2.8 s), a secondary visual warning at 50.8 m (2.29 s), primary braking at 39.47 m (1.78 s) with an active deceleration of −0.3 g, secondary braking at 37.73 m (1.71 s) with an active deceleration of −0.6 g, and tertiary braking at 35.62 m (1.64 s) with an active deceleration of −0.8 g. However, the road gradient and surface adhesion limit the maximum braking deceleration to approximately −0.76 g, with the vehicle finally coming to a stop at a distance of 3.37 m from the preceding vehicle.
After conducting comparative model simulations, it was found that due to the lack of consideration for the gradient’s impact, neither the Honda model, the Berkeley model, nor the TTC model achieved complete collision avoidance. The main results of the simulations are shown in Table 10.
The simulation results demonstrate that under the CCRs scenario, the designed control strategy is effective in preventing collisions. The timing of active warnings and braking interventions is consistent with actual conditions, offering a high level of safety and comfort. The vehicle’s chassis system can rapidly respond to the AEB’s requested deceleration, indicating a high level of system responsiveness.

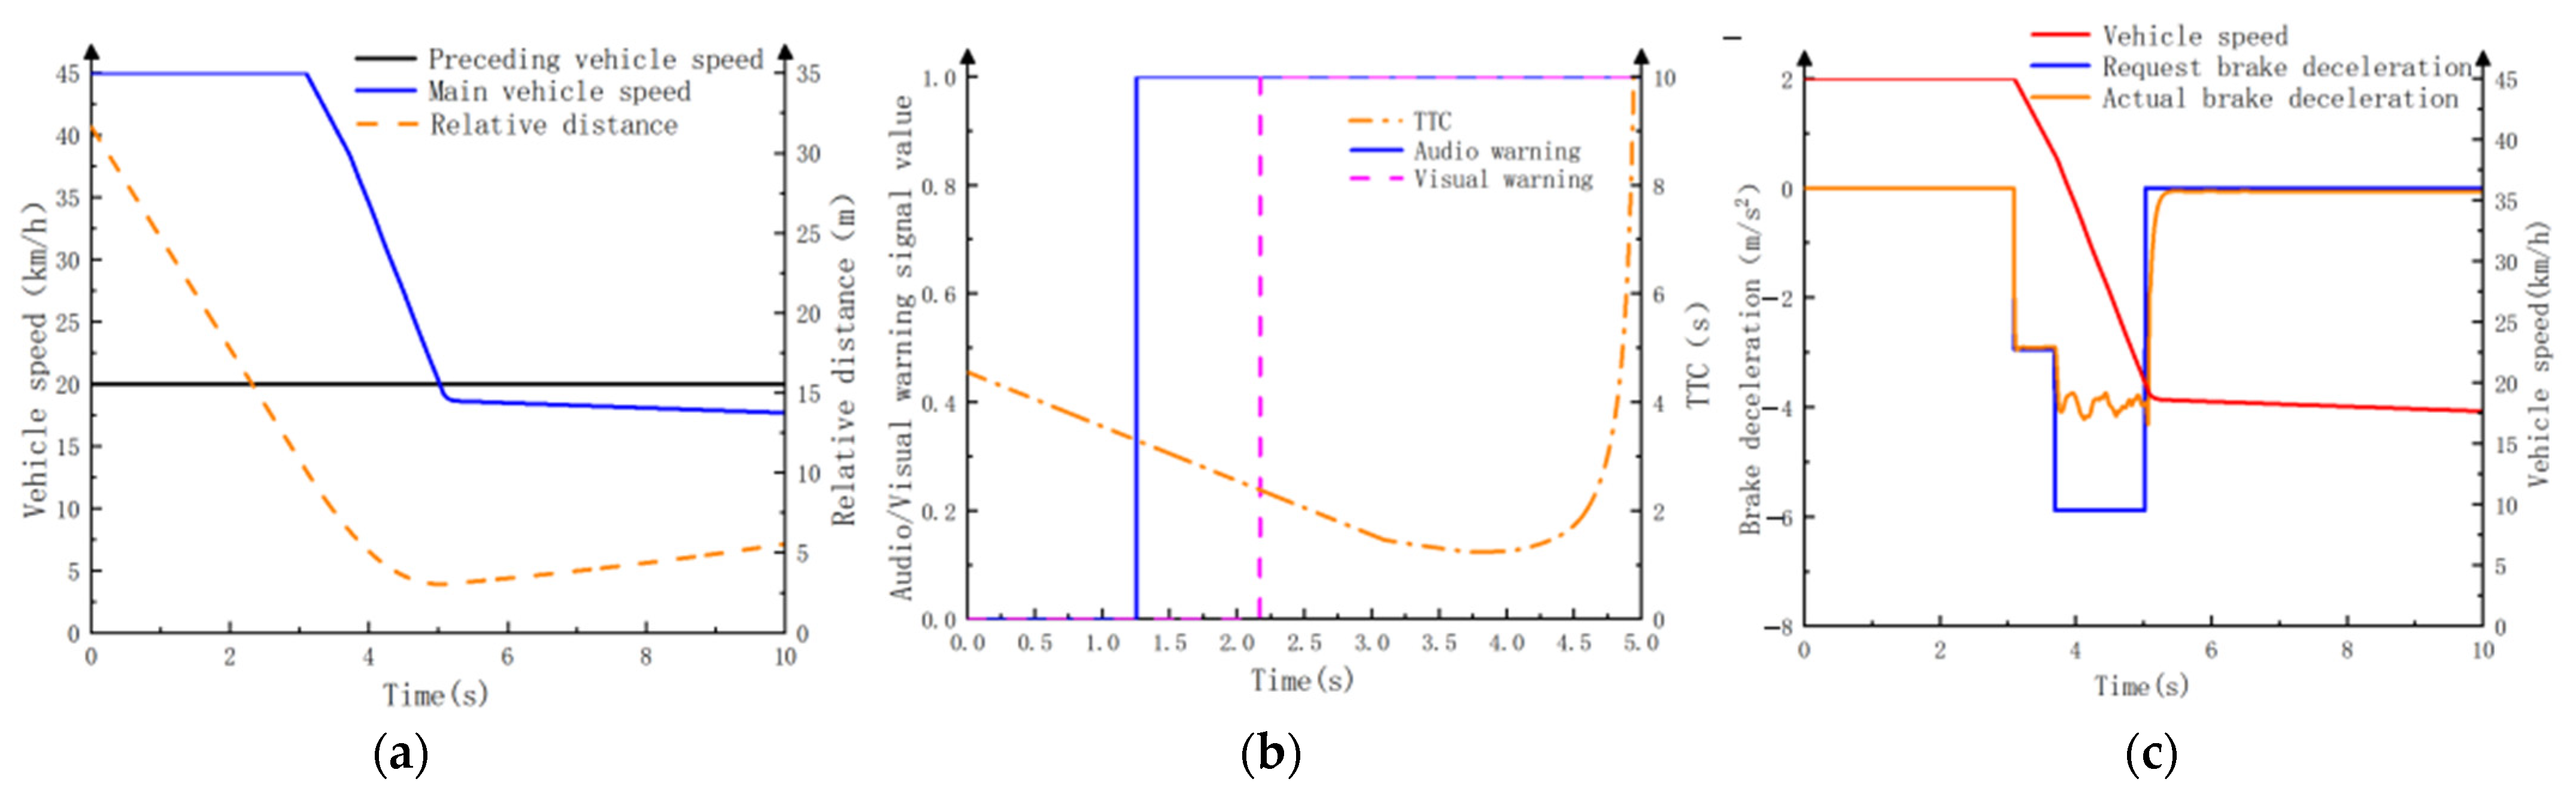
4.3.2. Test Conditions for CCRm Scenario

The main vehicle is initialized with a speed of 80 km/h on a road with a 9% downhill gradient and a coefficient of adhesion of 0.85. The preceding vehicle is set at a distance of 68 m from the main vehicle, maintaining a uniform speed of 20 km/h. The simulation results are shown in Figure 7.
Figure 7 indicates that the AEB system initiates a primary auditory warning at a relative distance (Time-to-Collision, TTC) of 46.95 m (2.81 s) to alert the driver. A secondary visual warning is activated at 35.62 m (2.13 s) to prompt the driver to apply brakes. The primary braking intervention is engaged at 24.29 m (1.45 s) with an active deceleration of −0.3 g, the secondary braking intervention is engaged at 22.48 m (1.36 s) with an active deceleration of −0.6 g, and the tertiary braking intervention is engaged at 20.19 m (1.27 s) with an active deceleration of −0.8 g. However, the road gradient and surface adhesion limit the maximum braking deceleration to approximately −0.76 g. When the vehicle’s speed falls below that of the preceding vehicle, the AEB system will deactivate. Due to the downhill road, the vehicle will undergo accelerated coasting, with the minimum driving distance between the two vehicles being 3.09 m.
Comparative model simulations illustrate that the TTC model fails to achieve effective collision avoidance. The Honda model activates collision warning and active braking at relative distances (TTC times) of 42.99 m/2.57 s and 27.47 m/1.64 s, respectively, exhibiting a riskier warning and a more conservative braking intervention, with a minimum inter-vehicle distance of 7.61 m. The Berkeley model activates collision warning and active braking at 68.29 m/4.08 s and 24.38 m/1.46 s, respectively, showing an overly conservative warning and a conventional braking intervention, with a minimum inter-vehicle distance of 4.51 m. The main results of the simulations are presented in Table 11.
The simulation results demonstrate that under the CCRm scenario, the designed control strategy is effective in preventing collisions. The timing of active warnings and active braking interventions is consistent with actual conditions, offering a high level of safety and comfort. The vehicle’s chassis system can rapidly respond to the AEB’s requested deceleration, indicating a high level of system responsiveness.

4.3.3. Test Conditions for CCRb Scenario

The main vehicle is initialized with a speed of 50 km/h on a road with a 9% downhill gradient and a coefficient of adhesion of 0.4. The preceding vehicle is positioned 40 m ahead of the main vehicle, moving at an initial speed of 50 km/h and decelerating at a rate of −3 m/s2. The simulation results are presented in Figure 8.
Figure 8 illustrates that the AEB system initiates a primary auditory warning at a relative distance (TTC) of 35.8 m (3.49 s) to alert the driver. A secondary visual warning is activated at 33.04 m (3.0 s) to indicate the need for braking. The primary braking intervention occurs at 29.16 m (2.47 s) with an active deceleration of −0.3 g, followed by a secondary braking intervention at 28.71 m (2.43 s) with an active deceleration of −0.6 g. A tertiary braking intervention is engaged at 27.96 m (2.39 s) with an active deceleration of −0.8 g. However, the road gradient and surface adhesion limit the maximum braking deceleration to approximately −0.31 g, with the minimum inter-vehicle distance maintained during AEB operation being 2.63 m.
Comparative model simulations illustrate that due to the neglect of gradient effects, neither the Honda model, the Berkeley model, nor the TTC model achieved complete collision avoidance, as shown in the main results of the simulations presented in Table 12.
The simulation results demonstrate that under the CCRb scenario, the designed control strategy is effective in preventing collisions. The timing of proactive warnings and active braking interventions aligns with actual conditions, offering a high level of safety and comfort. The vehicle’s chassis system can rapidly respond to the AEB’s requested deceleration, indicating a high level of system responsiveness.

4.3.4. Test Conditions for a Preceding Vehicle Accelerating Scenario

The main vehicle is initialized at a speed of 80 km/h on a road with a 9% downhill gradient and a coefficient of adhesion of 0.85. The preceding vehicle is positioned 52 m ahead of the main vehicle, starting at a speed of 33 km/h and accelerating at a rate of 0.98 m/s². The simulation results are presented in Figure 9.
Figure 9 indicates that the AEB system only activated the secondary level of braking. A primary auditory warning was initiated at a relative distance (Time-to-Collision, TTC) of 43.25 m (4.24 s) to alert the driver. A secondary visual warning was activated at 24.79 m (2.63 s) to prompt the driver to apply brakes. The primary braking intervention occurred at 10.93 m (1.25 s) with an active deceleration of −0.3 g, and the second-level braking intervention occurred at 8.28 m (1.07 s) with an active deceleration of −0.6 g. When the main vehicle’s speed falls below that of the preceding vehicle, the AEB system disengages, and the vehicle enters a free coasting state. The minimum inter-vehicle distance maintained during AEB operation was 3.06 m.
Comparative simulations of the Honda model, the Berkeley model, and the TTC model all achieved complete collision avoidance, with the minimum distances to the preceding vehicle during AEB operation being 14.7 m, 14.0 m, and 5.55 m, respectively. The Honda model activated collision warning and active braking at relative distances (TTC times) of 31.02 m/3.19 s and 21.75 m/2.34 s, respectively, showing conventional warning performance and overly conservative braking intervention. The Berkeley model activated collision warning and active braking at 64.84 m/6.05 s and 20.97 m/2.26 s, respectively, with both warning and braking interventions being overly conservative. The TTC model activated collision warning and active braking at 28.83 m/3.0 s and 15.78 m/1.75 s, respectively, showing an aggressive warning performance and a more conservative braking intervention. The main results of the simulations are presented in Table 13.
The simulation results demonstrate that under the preceding vehicle acceleration scenario, due to the premature activation of the AEB system’s active braking intervention, the minimum inter-vehicle distance is significantly larger than that of the integrated algorithm model, resulting in reduced road traffic utilization. The designed control strategy is effective in preventing collisions, offering a high level of safety and comfort. The vehicle’s chassis system can rapidly respond to the AEB’s requested deceleration, indicating a high level of system responsiveness.

5. Conclusions

Aiming at the reliability of AEB system and the issue of its unsatisfactory level of accordance with drivers’ psychological expectations, this study proposes the safe time and safe distance fusion algorithm as well as the hierarchical warning/hierarchical braking control strategy and carries out the simulation verification. The main conclusions are as follows:
(1) The proposed fusion algorithm can achieve complete collision avoidance in the four working conditions of CCRs (preceding vehicle stationary), CCRm (preceding vehicle uniform speed), CCRb (preceding vehicle deceleration), and preceding vehicle acceleration. It attains a speed reduction rate of 100%, outperforming the selected benchmark model, thus indicating a high level of safety in the AEB system.
(2) The application of active graded braking results in minimal absolute errors between the vehicle’s actual minimum relative distance and the desired minimum traveling distance, which are 0.37 m, 0.09 m, 0.37 m, and 0.06 m respectively. This alignment meets the driver’s psychological expectations, leading to an improvement in the AEB system’s comfort level.
(3) The vehicle’s actual braking deceleration can rapidly follow the braking deceleration requested by the AEB system, indicating a fast response speed of the AEB system.

Author Contributions

Conceptualization, X.F. and T.Y.; methodology, X.F. and J.W.; software, D.W.; validation, W.J.; formal analysis, J.W.; investigation, W.M.; resources, X.F.; data curation, D.W.; writing—original draft preparation, X.F. and J.W.; writing—review and editing, T.Y. and W.M.; visualization, W.J.; supervision, T.Y.; project administration, T.Y.; funding acquisition, X.F. All authors have read and agreed to the published version of the manuscript.

Funding

This research was funded by the National Key R&D Program of China (2022YFC3006005 and 2023YFB2504300) and the Key R&D Program of Hubei Province of China (2023BCB046).

Data Availability Statement

The data are contained within the article.

Conflicts of Interest

The authors declare no conflicts of interest.

References

  1. Li, H.; Jin, H. Research on Personalized AEB Strategies Based on Self-Supervised Contrastive Learning. IEEE Trans. Intell. Transp. Syst. 2024, 25, 1303–1316. [Google Scholar] [CrossRef]
  2. Cao, W.; Yang, M.; Wei, Z.; Wang, J.; Yang, X. Autonomous Emergency Braking of Electric Vehicles with High Robustness to Cyber-Physical Uncertainties for Enhanced Braking Stability. IEEE Trans. Veh. Technol. 2023, 72, 4426–4441. [Google Scholar] [CrossRef]
  3. Veneroso, L.; Alfatti, F.; Annicchiarico, C.; Capitani, R. Modelling, testing and validation of an innovative AEB control logic on a Hardware in the loop test bench. IOP Conf. Ser. Mater. Sci. Eng. 2023, 1275, 012041. [Google Scholar] [CrossRef]
  4. Park, M.-K.; Lee, S.-Y.; Kwon, C.-K.; Kim, S.-W. Design of Pedestrian target selection with Funnel Map for Pedestrian AEB System. IEEE Trans. Veh. Technol. 2017, 66, 3597–3609. [Google Scholar] [CrossRef]
  5. Youshiha, H.; Awano, S.; Nagai, M.; Kamada, T. Target Following Brake Control for Collision Avoidance Assist of Active Interface Vehicle. In Proceedings of the SICE-ICASE International Joint Conference, Busan, Republic of Korea, 18–26 October 2006; pp. 4436–4439. [Google Scholar]
  6. Liu, Z.; Cheng, S.; Wang, S. Control Strategy of Automatic Emergency Braking System under Complex Road Conditions. Chin. Sci. Technol. Pap. 2022, 17, 221–227. [Google Scholar]
  7. Xiaofei, P.E.I.; Zhaodu, L.I.U.; Guocheng, M.A.; Yang, Y.E. Safe Distance Model and Target Detection Algorithm for Vehicle Active Collision Avoidance System. J. Automob. Saf. Energy Conserv. 2012, 3, 26–33. [Google Scholar]
  8. Guo, L.; Sun, D.C.; Ge, P.S. Automatic Emergency Braking Model with Second-Order Collision Time under Complex Conditions. Mach. Des. Manuf. 2022, 375, 127–131. [Google Scholar]
  9. Gounis, K.; Bassiliades, N. Intelligent momentary assisted control for autonomous emergency braking. Simul. Model. Pract. Theory 2022, 115, 102450. [Google Scholar] [CrossRef]
  10. Luo, Q.; Xu, L.H. Research on Establishment and Simulation of Following Model Based on Minimum Safety Distance. Sci. Technol. Eng. 2010, 10, 569–573. [Google Scholar]
  11. Guan, Y.Y. Research on Longitudinal Collision Warning and Automatic Emergency Braking Controller of Electric Vehicle. Ph.D. Thesis, Beijing Jiaotong University, Beijing, China, 2018. [Google Scholar]
  12. Ao, H.W.; Chen, X.W.; Rong, T.K. Research on Layered Control Strategy of Vehicle Emergency Braking Based on Safety Distance—Time Model. J. Chongqing Univ. Technol. 2022, 36, 31–38. [Google Scholar]
  13. Cheng, S.; Li, L.; Guo, H.-Q.; Chen, Z.-G.; Song, P. Longitudinal Collision Avoidance and Lateral Stability Adaptive Control System Based on MPC of Autonomous Vehicles. IEEE Trans. Intell. Transp. Syst. 2019, 21, 2376–2385. [Google Scholar] [CrossRef]
  14. Han, I.C.; Luan, B.C.; Hsieh, F.C. Development of autonomous emergency braking control system based on road friction. In Proceedings of the 2014 IEEE International Conference on Automation Science and Engineering, Taipei, Taiwan, 18–22 August 2014; pp. 933–937. [Google Scholar]
  15. Yang, W.; Zhang, X.; Lei, Q.; Cheng, X. Research on longitudinal active collision avoidance of autonomous emergency braking pedestrian system (AEB-P). Sensors 2019, 19, 4671. [Google Scholar] [CrossRef] [PubMed]
  16. Zeng, D.; Yu, Z.; Xiong, L.; Zhao, J.; Zhang, P.; Li, Z.; Fu, Z.; Xia, L.; Wei, Y.; Yan, S.; et al. Improved AEB algorithm combined with estimating the adhesion coefficient of road ahead and considering the performance of EHB. Proc. Inst. Mech. Eng. Part D J. Automob. Eng. 2021, 237, 2415–2430. [Google Scholar] [CrossRef]
  17. Lai, F.; Yang, H. Integrated Longitudinal and Lateral Control of Emergency Collision Avoidance for Intelligent Vehicles under Curved Road Conditions. Appl. Sci. 2023, 13, 12–16. [Google Scholar] [CrossRef]
  18. Zhou, T.; Liu, W.; Zhang, M.; Jia, J. Optimization of AEB Decision System Based on Unsafe Control Behavior Analysis and Improved ABAS Algorithm. IEEE Trans. Intell. Transp. Syst. 2024, 25, 3152–3165. [Google Scholar] [CrossRef]
  19. Wang, Z.; Zang, L.; Jiao, J.; Mao, Y. Research on Hierarchical Control Strategy of Automatic Emergency Braking System. World Electr. Veh. J. 2023, 14, 6–9. [Google Scholar] [CrossRef]
  20. Yang, Y.; Wang, C.; Yang, S.; Tang, X. Study on Top Hierarchy Control Strategy of AEBS over Regenerative Brake and Hydraulic Brake for Hub Motor Drive BEVs. Energies 2022, 15, 18–23. [Google Scholar] [CrossRef]
  21. Zhang, L.; Yu, Z.; Xu, X.; Yan, Y. Research on Automatic Emergency Braking System Based on Target Recognition and Fusion Control Strategy in Curved Road. Electronics 2023, 12, 3490. [Google Scholar] [CrossRef]
  22. Zhang, S.; Liu, X.; Deng, G.; Ou, J.; Yang, E.; Yang, S.; Li, T. Longitudinal and Lateral Control Strategies for Automatic Lane Change to Avoid Collision in Vehicle High–Speed Driving. Sensors 2023, 23, 23–28. [Google Scholar] [CrossRef] [PubMed]
Figure 1. The control architecture diagram of the AEB system.
Mathematics 12 01905 g001
Figure 2. The displacement diagram of the main vehicle and the preceding vehicle in the braking process.
Mathematics 12 01905 g002
Figure 3. Schematic diagram of the braking process in which the driver of the main vehicle begins to apply the brake.
Mathematics 12 01905 g003
Figure 4. Schematic diagram of the braking process in which the driver of the main vehicle has begun to apply the brake.
Mathematics 12 01905 g004
Figure 5. Hierarchical warning/hierarchical braking control strategy flow chart.
Mathematics 12 01905 g005
Figure 6. CCRs scenario test simulation results. (a) Main vehicle speed/relative distance, (b) hierarchical warning signal value/TTC, and (c) brake deceleration/vehicle speed.
Mathematics 12 01905 g006
Figure 7. CCRm scenario test simulation results. (a) main vehicle speed/relative distance, (b) hierarchical warning signal value/TTC, and (c) brake deceleration/vehicle speed.
Mathematics 12 01905 g007
Figure 8. CCRb scenario test simulation results. (a) main vehicle speed/relative distance, (b) hierarchical warning signal value/TTC, and (c) brake deceleration/vehicle speed.
Mathematics 12 01905 g008
Figure 9. Simulation results of acceleration scene test of preceding vehicle. (a) main vehicle speed/relative distance, (b) hierarchical warning signal value/TTC, and (c) brake deceleration/vehicle speed.
Mathematics 12 01905 g009
Table 1. Optimize the second order TTC algorithm.
Motion StateConditionsOptimize the Second-Order TTC Algorithm
Stationary preceding vehicle v r > 0 & & a r > 0 & & a 1 v 1 2 2 S r T T C = v 1 v 1 2 2 a 1 S r a 1
v r > 0 & & a r = 0 T T C = S r v 1
Preceding vehicle at a constant speed v r > 0 & & a r > 0
& & a 1 ( v 1 v 2 ) 2 2 s r
T T C = v 1 v 2 ( v 1 v 2 ) 2 2 a 1 S r a 1
v r > 0 & & a r = 0 T T C = S r v 1 v 2
Preceding vehicle decelerating v r > 0 & & a r > 0 | | a r < 0 & & a 1 0 T T C = v 1 v 2 ( v 1 v 2 ) 2 2 ( a 1 a 2 ) S r a 1 a 2
v r > 0 & & a r = 0 T T C = S r v 1 v 2
a r < 0 & & a 1 = 0 T T C = ( v 1 v 2 ) + ( v 1 v 2 ) 2 + 2 a 2 S r a 2
Preceding vehicle accelerating v r > 0 & & a 1 = 0 & & | a 2 | ( v 1 v 2 ) 2 2 S r T T C = v 1 v 2 ( v 1 v 2 ) 2 2 | a 2 | S r | a 2 |
v r > 0 & & a 1 > 0 T T C = v 1 v 2 ( v 1 v 2 ) 2 2 ( a 1 + a 2 ) S r a 1 + | a 2 |
Table 2. The functions of vehicle speed-time and braking deceleration-time.
The Function of Vehicle Speed-Time and Braking Deceleration-Time
The driver begins to apply the brake v = v 1 ,     0 < t t 1 a v 1 a m a x t a m a x t 2 t 2 ,     t 1 a < t t 2 a v 2 a m a x t ,     t 2 a < t t 3 a a = 0 ,     0 < t t 1 a a m a x t 2 ( t t 1 t 1 t 2 ) ,     t 1 a < t t 2 a a m a x ,     t 2 a < t t 3 a
The driver has begun to apply the brake v = v 1 a 1 t ,     0 < t t 1 b v 3 a 1 t a m a x t 2 t 2 ,     t 1 b < t t 2 b v 4 a m a x t ,     t 2 b < t t 3 b a = a 1 ,     0 < t t 1 a a m a x t 2 t t 1 t 1 + a 1 ,     t 1 a < t t 2 a a m a x ,     t 2 a < t t 3 a
Table 3. The driver of the main vehicle realizes the need to start implementing the safe distance algorithm when braking.
Motion State of the Preceding VehicleWarning/Braking Distance Thresholds
Stationary preceding vehicle d w 1 _ 1 _ s t a d w 2 _ 1 s t a d b 1 _ 1 _ s t a d b 2 _ 1 _ s t a d b 3 _ 1 _ s t a = 1 1 / 2 0 0 0 S 1 1 + S 1 2 + S 1 3 s t a / d e c + 1 1 1 1 / 2 0 d 0
Preceding vehicle at a constant speed d w 1 _ 1 _ c o n d w 2 _ 1 _ c o n d b 1 _ 1 _ c o n d b 2 _ 1 _ c o n d b 3 _ 1 _ c o n = 1 1 / 2 0 0 0 S 1 1 + S 1 2 + S 1 3 c o n S 2 c o n 1 + 1 1 1 1 / 2 0 d 0
Preceding vehicle decelerating d w 1 _ 1 _ d e c d w 3 _ 1 _ d e c d b 1 _ 1 _ d e c d b 2 _ 1 _ d e c d b 3 _ 1 _ d e c = 1 1 / 2 0 0 0 S 1 1 + S 1 2 + S 1 3 s t a / d e c S 2 d e c + 1 1 1 1 / 2 0 d 0
Preceding vehicle accelerating. d w 1 _ 1 _ a c c d w 3 _ 1 _ a c c d b 1 _ 1 _ a c c d b 2 _ 1 _ a c c d b 3 _ 1 _ a c c = 1 1 / 2 0 0 0 S 1 1 + S 1 2 + S 1 3 a c c S 2 a c c 1 + 1 1 1 1 / 2 0 d 0
Table 4. Part of the formulas in Table 3 are elaborated in detail.
S 1 1 = v 1 ( t 1 + t 1 ) S 1 2 = v 1 t 2 + v 1 t 1 a m a x t 2 2 6
S 1 3 s t a / d e c = v 1 2 2 a m a x v 1 t 2 2 + a m a x t 2 2 8 S 2 c o n 1 = v 2 ( t 2 + t 2 + v 1 v 2 a m a x t 2 2 )
S 1 3 c o n = v 1 2 v 2 2 2 a m a x v 1 t 2 2 + a m a x t 2 2 8 S 2 d e c = v 2 2 2 a 2
S 1 3 a c c = v 1 2 2 a m a x v 1 t 2 2 + a m a x t 2 2 8 ( a m a x v 2 + | a 2 | v 1 ) 2 2 a m a x ( a m a x + | a 2 | ) 2
S 2 a c c 1 = v 2 [ t 2 + t 2 + v 1 a m a x t 2 2 a m a x v 2 + | a 2 | v 1 a m a x ( a m a x + | a 2 | ) ] + | a 2 | 2 [ t 2 + t 2 + v 1 a m a x t 2 2 a m a x v 2 + | a 2 | v 1 a m a x ( a m a x + | a 2 | ) ] 2
Table 5. The driver has started to implement the safe distance algorithm when braking.
Motion State of the Preceding VehicleWarning/Braking Distance Thresholds
Stationary preceding vehicle d w 1 _ 2 _ s t a d w 2 _ 2 _ s t a d b 1 _ 2 _ s t a d b 2 _ 2 _ s t a d b 3 _ 2 _ s t a = 1 1 / 2 0 0 0 S 2 1 + S 2 2 + S 2 3 s t a / d e c + 1 1 1 1 / 2 0 d 0
Preceding vehicle at a constant speed d w 1 _ 2 _ c o n d w 2 _ 2 _ c o n d b 1 _ 2 _ c o n d b 2 _ 2 _ c o n d b 3 _ 2 _ c o n = 1 1 / 2 0 0 0 S 2 1 + S 2 2 + S 2 3 c o n S 2 c o n 2 + 1 1 1 1 / 2 0 d 0
Preceding vehicle decelerating d w 1 _ 2 _ d e c d w 2 _ 2 _ d e c d b 1 _ 2 _ d e c d b 2 _ 2 _ d e c d b 3 _ 2 _ d e c = 1 1 / 2 0 0 0 S 2 1 + S 2 2 + S 2 3 s t a / d e c S 2 d e c + 1 1 1 1 / 2 0 d 0
Preceding vehicle accelerating d w 1 _ 2 _ a c c d w 2 _ 2 _ a c c d b 1 _ 2 _ a c c d b 2 _ 2 _ a c c d b 3 _ 2 _ a c c = 1 1 / 2 0 0 0 S 2 1 + S 2 2 + S 2 3 a c c S 2 a c c 2 + 1 1 1 1 / 2 0 d 0
Table 6. Part of the formulas in Table 5 are elaborated in detail.
S 2 2 = v 1 a 1 t 1 + t 1 a m a x a 1 t 2 a m a x a 1 a m a x a 1 2 t 2 2 2 a m a x 2 ( a m a x a 1 ) 3 t 2 2 6 a m a x 2
S 2 3 c o n = [ v 1 a 1 t 1 + t 1 + a m a x a 1 t 2 a m a x t 2 ( a m a x a 1 ) 2 2 a m a x ] 2 v 2 2 2 a m a x
S 2 c o n 2 = v 2 [ a m a x a 1 t 2 a m a x + v 1 v 2 a 1 t 1 + t 1 + a m a x a 1 t 2 a m a x t 2 ( a m a x a 1 ) 2 2 a m a x a m a x ]
S 2 3 s t a / d e c = [ v 1 a 1 t 1 + t 1 + a m a x a 1 t 2 a m a x t 2 ( a m a x a 1 ) 2 2 a m a x ] 2 2 a m a x
S 2 3 a c c = [ v 1 a 1 t 1 + t 1 + a m a x a 1 t 2 a m a x t 2 ( a m a x a 1 ) 2 2 a m a x ] 2 v e n d 2 2 a m a x
S 2 a c c 2 = v 2 a m a x a 1 a m a x t 2 + t 3 a c c 2 + | a 2 | 2 [ a m a x a 1 a m a x t 2 + t 3 a c c 2 ] 2
t 3 a c c 2 = v 1 v e n d a 1 t 1 + t 1 + a m a x a 1 t 2 a m a x t 2 ( a m a x a 1 ) 2 2 a m a x a m a x
Table 7. Fusion algorithm specific expression.
Motion StateConditionsFusion Algorithm
Stationary preceding vehicle v r > 0 & & a r > 0 & & a 1 v 1 2 2 S r T T C w 1 _ 2 _ s t a T T C w 2 _ 2 _ s t a T T C b 1 _ 2 _ s t a T T C b 2 _ 2 _ s t a T T C b 3 _ 2 _ s t a = v 1 v 1 2 2 a 1 S r _ A E B a 1
S r _ A E B = d w 1 _ 2 _ s t a d w 2 _ 2 _ s t a d b 1 _ 2 _ s t a d b 2 _ 2 _ s t a d b 3 _ 2 _ s t a
v r > 0 & & a r = 0 T T C w 1 _ 1 _ s t a T T C w 2 _ 1 _ s t a T T C b 1 _ 1 _ s t a T T C b 2 _ 1 _ s t a T T C b 3 _ 1 _ s t a = S r _ A E B v 1
S r _ A E B = d w 1 _ 1 _ s t a d w 2 _ 1 _ s t a d b 1 _ 1 _ s t a d b 2 _ 1 _ s t a d b 3 _ 1 _ s t a
Preceding vehicle at a constant speed v r > 0 & & a r > 0 & & a 1 ( v 1 v 2 ) 2 2 S r T T C w 1 _ 2 _ c o n T T C w 2 _ 2 _ c o n T T C b 1 _ 2 _ c o n T T C b 2 _ 2 _ c o n T T C b 3 _ 2 _ c o n = v 1 v 2 ( v 1 v 2 ) 2 2 a 1 S r _ A E B a 1
S r _ A E B = d w 1 _ 2 _ c o n d w 2 _ 2 _ c o n d b 1 _ 2 _ c o n d b 2 _ 2 _ c o n d b 3 _ 2 _ c o n
v r > 0 & & a r = 0 T T C w 1 _ 1 _ c o n T T C w 2 _ 1 _ c o n T T C b 1 _ 1 _ c o n T T C b 2 _ 1 _ c o n T T C b 3 _ 1 _ c o n = S r _ A E B v 1 v 2
S r _ A E B = d w 1 _ 1 _ c o n d w 2 _ 1 _ c o n d b 1 _ 1 _ c o n d b 2 _ 1 _ c o n d b 3 _ 1 _ c o n
Preceding vehicle decelerating v r > 0 & & a r > 0 | | a r < 0 & & a 1 0 T T C w 1 _ 2 _ d e c 1 T T C w 2 _ 2 _ d e c 1 T T C b 1 _ 2 _ d e c 1 T T C b 2 _ 2 _ d e c 1 T T C b 3 _ 2 _ d e c 1 = v 1 v 2 ( v 1 v 2 ) 2 2 ( a 1 a 2 ) S r _ A E B a 1 a 2
S r _ A E B = d w 1 _ 2 _ d e c d w 2 _ 2 _ d e c d b 1 _ 2 _ d e c d b 2 _ 2 _ d e c d b 3 _ 2 _ d e c
v r > 0 & & a r = 0 T T C w 1 _ 2 _ d e c 2 T T C w 2 _ 2 _ d e c 2 T T C b 1 _ 2 _ d e c 2 T T C b 2 _ 2 _ d e c 2 T T C b 3 _ 2 _ d e c 2 = S r _ A E B v 1 v 2
S r _ A E B = d w 1 _ 2 _ d e c d w 2 _ 2 _ d e c d b 1 _ 2 _ d e c d b 2 _ 2 _ d e c d b 3 _ 2 _ d e c
a r < 0 & & a 1 = 0 T T C w 1 _ 2 _ d e c T T C w 2 _ 2 _ d e c T T C b 1 _ 2 _ d e c T T C b 2 _ 1 _ d e c T T C b 3 _ 1 _ d e c = ( v 1 v 2 ) + ( v 1 v 2 ) 2 + 2 a 2 S r _ A E B a 2
S r _ A E B = d w 1 _ 1 _ d e c d w 2 _ 1 d e c d b 1 _ 1 _ d e c d b 2 _ 1 _ d e c d b 3 _ 1 _ d e c
Preceding vehicle accelerating v r > 0 & & a 1 = 0 & & | a 2 | ( v 1 v 2 ) 2 2 S r T T C w 1 _ 1 _ a c c T T C w 2 _ 1 _ a c c T T C b 1 _ 1 _ a c c T T C b 2 _ 1 _ a c c T T C b 3 _ 1 _ a c c = v 1 v 2 ( v 1 v 2 ) 2 2 | a 2 | S r _ A E B a 1 a 2
S r _ A E B = d w 1 _ 1 _ a c c d w 2 _ 1 _ a c c d b 1 _ 1 _ d e c d b 2 _ 1 _ d e c d b 3 _ 1 _ d e c
v r > 0 & & a 1 > 0 T T C w 1 _ 2 _ a c c T T C w 2 _ 2 _ a c c T T C b 1 _ 2 _ a c c T T C b 2 _ 2 _ a c c T T C b 3 _ 2 _ a c c = v 1 v 2 ( v 1 v 2 ) 2 2 ( a 1 + | a 2 | ) S r _ A E B a 1 + | a 2 |
S r _ A E B = d w 1 _ 2 _ a c c d w 2 _ 2 _ a c c d b 1 _ 2 _ a c c d b 2 _ 2 _ a c c d b 3 _ 2 _ a c c
Table 8. Statistical distribution data of braking deceleration in collision avoidance tests.
DecelerationDistributions
5%25%50%75%95%
The average braking deceleration−0.15−0.29−0.38−0.42−0.55
The maximum braking deceleration−0.37−0.58−0.72−0.82−0.92
Table 9. Information of vehicle important parameters.
Parameter NameParameter InformationParameter NameParameter Information
Windward area A3.7 m2Effective wheel radius Re465 mm
Height of center of gravity hg860 mmWheelbases L3500 mm
Overall mass m4560 kgDistance from center of mass to front axle lf1700 mm
Spring–loaded mass4080 kgDistance from center of mass to rear axle lr1800 mm
Unsprung mass480 kgTread b2070 mm
Air resistance coefficient Cd0.4Moment of inertia about z-axis Iz10,080 kg·m2
Table 10. CCRs scene test main simulation results statistical table.
ModelRelative Distance at the Start of Collision Warning
or TTC
Relative Distance at the Start of Active Braking or TTCFull Collision Avoidance or NotRate of Velocity ReductionMinimum Relative DistanceRelative Speed of Collision
Fusion algorithm model62.14 m/2.8 s39.47 m/1.78 sYes100%3.37 m
Honda model55.26 m/2.49 s29.4 m/1.32 sNo59.7%0 m32.24 km/h
Berkeley model70.79 m/3.19 s31.05 m/1.4 sNo66.3%0 m26.99 km/h
TTC model57.99 m/2.6 s35.67 m/1.6 sNo49.1%0 m40.71 km/h
Table 11. CCRm scene test main simulation results statistical table.
ModelRelative Distance at the Start of Collision Warning
or TTC
Relative Distance at the Start of Active Braking or TTCFull Collision Avoidance or NotRate of Velocity ReductionMinimum Relative DistanceRelative Speed of Collision
Fusion algorithm model46.95 m/2.81 s24.29 m/1.45 sYes100%3.09 m
Honda model42.99 m/2.57 s27.47 m/1.64 sYes100%7.61 m
Berkeley model68.29 m/4.08 s24.38 m/1.46 sYes100%4.51 m
TTC model43.49 m/2.6 s26.75 m/1.6 sNo80.6%0 m11.67 km/h
Table 12. CCRb scene test main simulation results statistical table.
ModelRelative Distance at the Start of Collision Warning
or TTC
Relative Distance at the Start of Active Braking or TTCFull Collision Avoidance or NotRate of Velocity ReductionMinimum Relative DistanceRelative Speed of Collision
Fusion algorithm
model
35.8 m/3.49 s29.16 m/2.47 sYes100%2.63 m
Honda model26.22 m/2.13 s15.44 m/1.12 sNo28.7%0 m35.66 km/h
Berkeley model31.8 m/2.82 s12.74 m/0.9 sNo22.4%0 m38.80 km/h
TTC model24.82 m/1.98 s18.28 m/1.36 sNo38%0 m30.98 km/h
Table 13. Statistical table of main simulation results of acceleration scene test.
ModelRelative Distance at the Start of Collision Warning
or TTC
Relative Distance at the Start of Active Braking or TTCFull Collision Avoidance or NotRate of Velocity ReductionMinimum Relative DistanceRelative Speed of Collision
Fusion algorithm model43.25 m/4.24 s10.93 m/1.25 sYes100%3.06 m
Honda model31.02 m/3.19 s21.75 m/2.34 sYes100%14.7 m
Berkeley model64.84 m/6.05 s20.97 m/2.26 sYes100%14.0 m
TTC model28.83 m/3.0 s15.78 m/1.75 sYes100%5.55 m
Disclaimer/Publisher’s Note: The statements, opinions and data contained in all publications are solely those of the individual author(s) and contributor(s) and not of MDPI and/or the editor(s). MDPI and/or the editor(s) disclaim responsibility for any injury to people or property resulting from any ideas, methods, instructions or products referred to in the content.

