
Novel Machine Learning Based Credit Card Fraud Detection Systems


Abstract
1. Introduction
2. Preliminaries
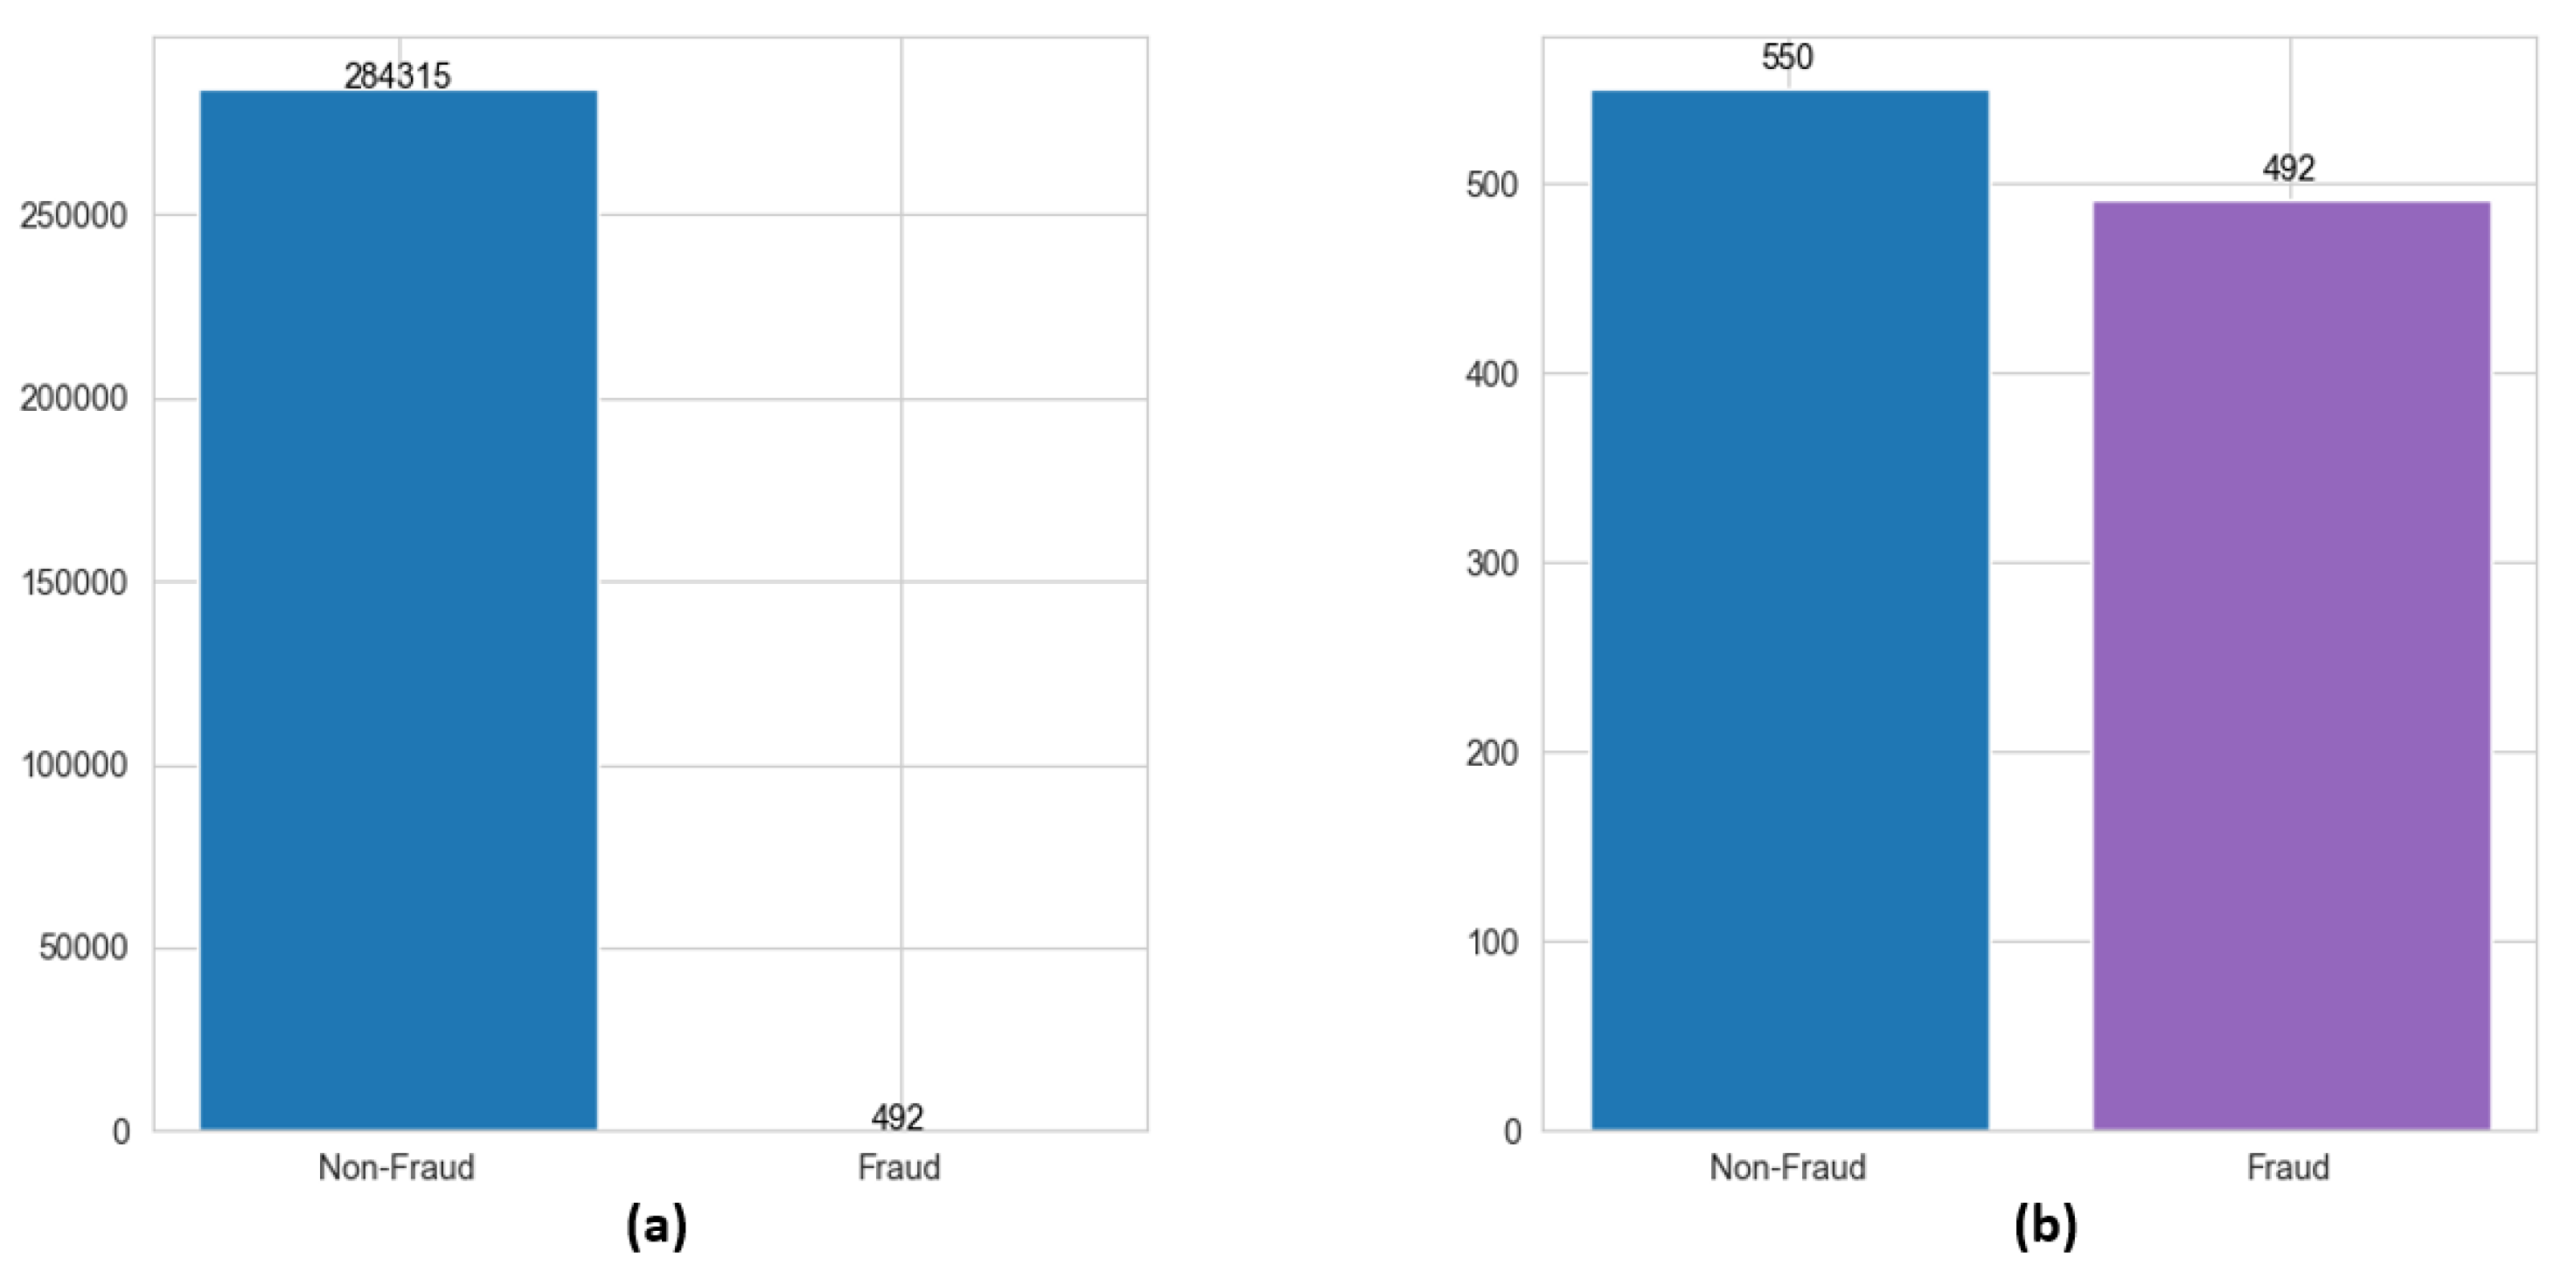
2.1. Data Balancing
2.2. Various Machine Learning Models for Credit Card Fraud Detection
- The random forest (RF) + adaptive boosting (AB) [14] method constructs a stronger classifier through training the random forest model, which is an ensemble learning model consisting of multiple decision trees based on random feature selection and a boot program [24]. This combined model adjusts the weights of samples based on the performance of the previous round’s classifier and strengthens the training of misclassified samples in the next round. The pairing of AdaBoost with the RF method enhances its robustness and improves the quality of classification for imbalanced credit card data.
- The Gradient Boosted Decision Tree (GBDT) [17] model is an ensemble learning algorithm which iteratively trains a series of decision trees to build a powerful predictive model. The GBDT model has also been used in previous papers as a base learner for fixed-size decision trees to overcome the problem of decision trees limiting their depth due to exponential growth.
- A Convolutional Neural Network (CNN) [8] is a deep learning method that is widely used in images, text, audio and time series data, etc. There are six different layers in the CNN model, namely, the input layer, convolutional layer, pooling layer, fully connected layer, SoftMax/Logic layer, and output layer, of which hidden layers with the same structure can have different numbers of channels per layer.
- A Support Vector Machine (SVM) [15] utilizes both classification and regression tasks. The SVM is known for its capability to derive optimal decision boundaries between classes. However, it is not well-suited for datasets exhibiting imbalanced class distribution, noise, and overlapping class samples.
2.3. Various Feature Reduction Methods
- Analysis of Variance (ANOVA) is a statistical method used to compare means across different groups by analyzing data variance. It is commonly used in feature selection to aid in inference and decision-making processes. This method has reused in a previous paper [34].
- The feature importance method is a technique used to evaluate and quantify the importance of features in a machine learning model, which helps the user to understand the critical role of specific features in the predictive performance of a model.
- The correlation heatmap is a graphical representation that visualizes pairwise correlations between variables in a dataset and is generated based on linear correlation coefficients. In the correlation heatmap, darker blue indicates a stronger negative correlation, while darker red indicates a stronger positive correlation.
- The linear correlation coefficient is employed to quantify the strength and direction of the linear relationship between two variables [35].
2.4. Compact Data Learning
2.5. Performance Measures
3. Experiment Results
3.1. Result Comparisons for ML Algorithms
3.2. Result Comparisons for Feature Reduction
3.3. Feature Reduction with CDL
4. Conclusions
Author Contributions
Funding
Data Availability Statement
Acknowledgments
Conflicts of Interest
Appendix A. Correlation Heatmap

Appendix B. Algorithm for CDL Feature Reduction
| Algorithm A1: CDL-based feature reduction algorithm |
 |
References
- Makki, S.; Assaghir, Z.; Taher, Y.; Haque, R.; Hacid, M.S.; Zeineddine, H. An Experimental Study with Imbalanced Classification Approaches for Credit Card Fraud Detection. IEEE Access 2019, 7, 93010–93022. [Google Scholar] [CrossRef]
- Ghaleb, F.A.; Saeed, F.; Al-Sarem, M.; Qasem, S.N.; Al-Hadhrami, T. Ensemble Synthesized Minority Oversampling-Based Generative Adversarial Networks and Random Forest Algorithm for Credit Card Fraud Detection. IEEE Access 2023, 11, 89694–89710. [Google Scholar] [CrossRef]
- Tingfei, H.; Guangquan, C.; Kuihua, H. Using Variational Auto Encoding in Credit Card Fraud Detection. IEEE Access 2020, 8, 149841–149853. [Google Scholar] [CrossRef]
- Salazar, A.; Safont, G.; Vergara, L. Semi-supervised learning for imbalanced classification of credit card transaction. In Proceedings of the 2018 International Joint Conference on Neural Networks (IJCNN), Rio de Janeiro, Brazil, 8–13 July 2018; pp. 1–7. [Google Scholar]
- Nilson Report 2019; HSN Consultants, Inc.: Santa Barbara, CA, USA, 2019.
- Nilson Report 2021; HSN Consultants, Inc.: Santa Barbara, CA, USA, 2021.
- Mullen, C. Card Industry Faces $400B in Fraud Losses Over Next Decade. 2022. Available online: https://www.paymentsdive.com/news/card-industry-faces-400b-in-fraud-losses-over-next-decade-nilson-says/611521/ (accessed on 31 January 2024).
- Alarfaj, F.K.; Malik, I.; Khan, H.U.; Almusallam, N.; Ramzan, M.; Ahmed, M. Credit Card Fraud Detection Using State-of-the-Art Machine Learning and Deep Learning Algorithms. IEEE Access 2022, 10, 39700–39715. [Google Scholar] [CrossRef]
- Dornadula, V.; Geetha, S. Credit Card Fraud Detection Using Machine Learning Algorithms. Procedia Comput. Sci. 2019, 165, 631–641. [Google Scholar] [CrossRef]
- Nguyen, N.; Duong, T.; Chau, T.; Nguyen, V.H.; Trinh, T.; Tran, D.; Ho, T. A Proposed Model for Card Fraud Detection Based on CatBoost and Deep Neural Network. IEEE Access 2022, 10, 96852–96861. [Google Scholar] [CrossRef]
- Intuit Inc. 25 Credit Card Fraud Statistics to Know in 2021; Intuit Inc.: Mountain View, CA, USA, 2022. [Google Scholar]
- Button, M.; Hock, B.; Shepherd, D. Economic Crime: From Conception to Response, 1st ed.; Routledge: London, UK, 2022. [Google Scholar]
- Hock, B.; Button, M. Non-Ideal Victims or Offenders? The Curious Case of Pyramid Scheme Participants. Vict. Offend. 2023, 18, 1311–1334. [Google Scholar] [CrossRef]
- Ileberi, E.; Sun, Y.; Wang, Z. Performance Evaluation of Machine Learning Methods for Credit Card Fraud Detection Using SMOTE and AdaBoost. IEEE Access 2021, 9, 165286–165294. [Google Scholar] [CrossRef]
- Kalid, S.N.; Ng, K.H.; Tong, G.K.; Khor, K.C. A Multiple Classifiers System for Anomaly Detection in Credit Card Data with Unbalanced and Overlapped Classes. IEEE Access 2020, 8, 28210–28221. [Google Scholar] [CrossRef]
- Taha, A.A.; Malebary, S.J. An Intelligent Approach to Credit Card Fraud Detection Using an Optimized Light Gradient Boosting Machine. IEEE Access 2020, 8, 25579–25587. [Google Scholar] [CrossRef]
- Alam, T.M.; Shaukat, K.; Hameed, I.A.; Luo, S.; Sarwar, M.U.; Shabbir, S.; Li, J.; Khushi, M. An Investigation of Credit Card Default Prediction in the Imbalanced Datasets. IEEE Access 2020, 8, 201173–201198. [Google Scholar] [CrossRef]
- Muslim, M.; Nikmah, T.; Pertiwi, D.A.A.; Subhan.; Unjung, J.; Yosza, D.; Iswanto. New Model Combination Meta-learner to Improve Accuracy Prediction P2P Lending with Stacking Ensemble Learning. Intell. Syst. Appl. 2023, 18, 200–204. [Google Scholar] [CrossRef]
- Madaan, M.; Kumar, A.; Keshri, C.; Jain, R.; Nagrath, P. Loan default prediction using decision trees and random forest: A comparative study. IOP Conf. Ser. Mater. Sci. Eng. 2021, 1022, 012042. [Google Scholar] [CrossRef]
- Butaru, F.; Chen, Q.; Clark, B.; Das, S.; Lo, A.W.; Siddique, A. Risk and risk management in the credit card industry. J. Bank. Financ. 2016, 72, 218–239. [Google Scholar] [CrossRef]
- Rajora, S.; Li, D.L.; Jha, C.; Bharill, N.; Patel, O.P.; Joshi, S.; Puthal, D.; Prasad, M. A comparative study of machine learning techniques for credit card fraud detection based on time variance. In Proceedings of the 2018 IEEE Symposium Series on Computational Intelligence (SSCI), Bangalore, India, 18–21 November 2018; pp. 1958–1963. [Google Scholar]
- Tanouz, D.; Subramanian, R.R.; Eswar, D.; Reddy, G.V.P.; Kumar, A.R.; Praneeth, C.V.N.M. Credit card fraud detection using machine learning. In Proceedings of the 2020 4th International Conference on Intelligent Computing and Control Systems (ICICCS), Madurai, India, 13–15 May 2020; pp. 967–972. [Google Scholar]
- El hlouli, F.Z.; Riffi, J.; Mahraz, M.A.; El Yahyaouy, A.; Tairi, H. Credit card fraud detection based on multilayer perceptron and extreme learning machine architectures. In Proceedings of the 2020 International Conference on Intelligent Systems and Computer Vision (ISCV), Fez, Morocco, 9–11 June 2020. [Google Scholar]
- Randhawa, K.; Loo, C.K.; Seera, M.; Lim, C.P.; Nandi, A.K. Credit Card Fraud Detection Using AdaBoost and Majority Voting. IEEE Access 2018, 6, 14277–14284. [Google Scholar] [CrossRef]
- Kim, S.K. Toward compact data from big data. In Proceedings of the 2020 15th International Conference for Internet Technology and Secured Transactions (ICITST), London, UK, 8–10 December 2020; pp. 1–5. [Google Scholar]
- Kim, S.K. Compact Data Learning For ML Classification. Axioms 2024, 13, 137. [Google Scholar] [CrossRef]
- Chawla, N.V.; Bowyer, K.W.; Hall, L.O.; Kegelmeyer, W.P. SMOTE: Synthetic minority over-sampling technique. J. Artif. Int. Res. 2002, 16, 321–357. [Google Scholar] [CrossRef]
- Fernandez, A.; Garcia, S.; Galar, M.; Prati, R.C.; Krawczyk, B.; Herrera, F. Learning from Imbalanced Data Sets; Springer: Cham, Switzerland, 2018. [Google Scholar]
- Oded Maimon, L.R. Data Mining and Knowledge Discovery Handbook; Springer: New York, NY, USA, 2010. [Google Scholar]
- Taghizadeh-Mehrjardi, R.; Nabiollahi, K.; Minasny, B.; Triantafilis, J. Comparing data mining classifiers to predict spatial distribution of USDA-family soil groups in Baneh region, Iran. Geoderma 2015, 253–254, 67–77. [Google Scholar] [CrossRef]
- Akogul, S. A Novel Approach to Increase the Efficiency of Filter-Based Feature Selection Methods in High-Dimensional Datasets With Strong Correlation Structure. IEEE Access 2023, 11, 115025–115032. [Google Scholar] [CrossRef]
- Chandrashekar, G.; Sahin, F. A survey on feature selection methods. Comput. Electr. Eng. 2014, 40, 16–28. [Google Scholar] [CrossRef]
- Chuang, L.Y.; Chang, H.W.; Tu, C.J.; Yang, C.H. Improved binary PSO for feature selection using gene expression data. Comput. Biol. Chem. 2008, 32, 29–38. [Google Scholar] [CrossRef] [PubMed]
- Wu, C.; Yan, Y.; Cao, Q.; Fei, F.; Yang, D.; Lu, X.; Xu, B.; Zeng, H.; Song, A. sEMG Measurement Position and Feature Optimization Strategy for Gesture Recognition Based on ANOVA and Neural Networks. IEEE Access 2020, 8, 56290–56299. [Google Scholar] [CrossRef]
- Biesiada, J.; Duch, W.l. Feature Selection for High-Dimensional Data—A Pearson Redundancy Based Filter; Springer: Berlin/Heidelberg, Germany, 2007; pp. 242–249. [Google Scholar]
- Zhu, H.; You, X.; Liu, S. Multiple Ant Colony Optimization Based on Pearson Correlation Coefficient. IEEE Access 2019, 7, 61628–61638. [Google Scholar] [CrossRef]
- Benesty, J.; Chen, J.; Huang, Y.; Cohen, I. Pearson Correlation Coefficient; Springer: Berlin/Heidelberg, Germany, 2009; pp. 1–4. [Google Scholar]
- Adler, J.; Parmryd, I. Quantifying colocalization by correlation: The Pearson correlation coefficient is superior to the Mander’s overlap coefficient. Cytom. Part A 2010, 77A, 733–742. [Google Scholar] [CrossRef]
- Al-Asadi, M.A.; Tasdemír, S. Empirical Comparisons for Combining Balancing and Feature Selection Strategies for Characterizing Football Players Using FIFA Video Game System. IEEE Access 2021, 9, 149266–149286. [Google Scholar] [CrossRef]


| Dataset/ Classification | Class 0 (Non-Fraud) | Class 1 (Fraud) |
|---|---|---|
| Training | 400 | 369 |
| Testing | 150 | 123 |
| Algorithm | Accuracy | Precision | Recall | F1-Score | Training Time (s) |
|---|---|---|---|---|---|
| RF + AB [14] | 94.14 | 94.61 | 93.72 | 0.940 | 0.345 |
| GBDT [17] | 93.41 | 93.86 | 92.98 | 0.933 | 0.937 |
| SVM [15] | 93.77 | 94.49 | 93.24 | 0.936 | 0.041 |
| CNN [8] | 92.67 | 93.87 | 91.94 | 0.925 | 31.30 |
| KNN [8] | 92.31 | 92.80 | 91.83 | 0.922 | 0.076 |
Disclaimer/Publisher’s Note: The statements, opinions and data contained in all publications are solely those of the individual author(s) and contributor(s) and not of MDPI and/or the editor(s). MDPI and/or the editor(s) disclaim responsibility for any injury to people or property resulting from any ideas, methods, instructions or products referred to in the content. |
© 2024 by the authors. Licensee MDPI, Basel, Switzerland. This article is an open access article distributed under the terms and conditions of the Creative Commons Attribution (CC BY) license (https://creativecommons.org/licenses/by/4.0/).
Share and Cite
Feng, X.; Kim, S.-K. Novel Machine Learning Based Credit Card Fraud Detection Systems. Mathematics 2024, 12, 1869. https://doi.org/10.3390/math12121869
Feng X, Kim S-K. Novel Machine Learning Based Credit Card Fraud Detection Systems. Mathematics. 2024; 12(12):1869. https://doi.org/10.3390/math12121869
Chicago/Turabian StyleFeng, Xiaomei, and Song-Kyoo Kim. 2024. "Novel Machine Learning Based Credit Card Fraud Detection Systems" Mathematics 12, no. 12: 1869. https://doi.org/10.3390/math12121869
APA StyleFeng, X., & Kim, S.-K. (2024). Novel Machine Learning Based Credit Card Fraud Detection Systems. Mathematics, 12(12), 1869. https://doi.org/10.3390/math12121869