Article

A Novel Fuzzy Bi-Clustering Algorithm with Axiomatic Fuzzy Set for Identification of Co-Regulated Genes

School of Electronic Engineering, Xidian University, Xi’an 710071, China
*
Author to whom correspondence should be addressed.
Mathematics 2024, 12(11), 1659; https://doi.org/10.3390/math12111659
Submission received: 25 April 2024 / Revised: 19 May 2024 / Accepted: 24 May 2024 / Published: 26 May 2024
(This article belongs to the Special Issue New Advances in Data Analytics and Mining)

Abstract

:
The identification of co-regulated genes and their Transcription-Factor Binding Sites (TFBSs) are the key steps toward understanding transcription regulation. In addition to effective laboratory assays, various bi-clustering algorithms for the detection of the co-expressed genes have been developed. Bi-clustering methods are used to discover subgroups of genes with similar expression patterns under to-be-identified subsets of experimental conditions when applied to gene expression data. By building two fuzzy partition matrices of the gene expression data with the Axiomatic Fuzzy Set (AFS) theory, this paper proposes a novel fuzzy bi-clustering algorithm for the identification of co-regulated genes. Specifically, the gene expression data are transformed into two fuzzy partition matrices via the sub-preference relations theory of AFS at first. One of the matrices considers the genes as the universe and the conditions as the concept, and the other one considers the genes as the concept and the conditions as the universe. The identification of the co-regulated genes (bi-clusters) is carried out on the two partition matrices at the same time. Then, a novel fuzzy-based similarity criterion is defined based on the partition matrices, and a cyclic optimization algorithm is designed to discover the significant bi-clusters at the expression level. The above procedures guarantee that the generated bi-clusters have more significant expression values than those extracted by the traditional bi-clustering methods. Finally, the performance of the proposed method is evaluated with the performance of the three well-known bi-clustering algorithms on publicly available real microarray datasets. The experimental results are in agreement with the theoretical analysis and show that the proposed algorithm can effectively detect the co-regulated genes without any prior knowledge of the gene expression data.

1. Introduction

Gene expression clustering allows for an open-ended exploration of the data, without getting lost among the thousands of individual genes [1]. Traditional (global) clustering methods only analyze genes under all experimental conditions or only analyze conditions of all the genes. In practice, in numerous cellular processes, many genes are regularly co-expressed (co-regulated) [2] under some special conditions [3] but behave differently under different conditions. Consequently, mining local co-expressed valuable patterns becomes a vital objective in discovering genetic pathways that are not very clear when clustered globally [4]. Designing algorithms to mine bi-clusters (co-regulated genes) is crucial for uncovering gene regulatory networks, identifying biomarkers and drug targets, reducing data dimensionality, and advancing personalized medicine and basic biological research. These algorithms enhance our understanding of complex biological processes and improve clinical practices, holding significant scientific and societal value. This is the so-called bi-clustering problem. Bi-clustering extends the traditional clustering techniques by attempting to find (all) subgroups of genes with similar expression patterns under to-be-identified subsets of experimental conditions when applied to gene expression data.
Bi-clustering can discover valuable co-regulated patterns of genes from plenty of gene expression data, which are more helpful in defining genes functioning together than traditional clustering approaches.
The bi-clustering model measures coherence within the subset of genes and conditions. This model is effective in disclosing the involvement of genes or conditions in multipaths, some of which can only be uncovered under the dominance of more consistent ones [5]. The coherence score is usually defined by building a symmetric function of genes and conditions involved, and therefore bi-clustering is a process of simultaneously clustering genes and conditions. A so-called mean squared residue (MSR), defined by Cheng and Church [6], is first introduced and applied to gene expression data transformed by a logarithm and augmented by the additive inverse. Furthermore, the MSR is also the most commonly used index in bi-clustering, and based on which many bi-clustering algorithms have been developed.

1.1. Literature Review

So far, various algorithms have been developed attempting to solve the bi-clustering problem. Popular bi-clustering algorithms, such as the Cheng and Church (CC) algorithm [6], Flexible Overlapped Clusters (FLOCs) [7], Plaid [8], order-preserving sub-matrix (OPSM) [9], Iterative Signature Algorithm (ISA) [10], conserved gene expression MOTIFs (xMOTIFs) [11], and BiMax [12] have drawn much attention in the literature. Emerging algorithms, such as Bayesian Bi-clustering [13], Maximum Similarity Bi-cluster algorithm (MSB) [14], and QUalitative BI-Clustering algorithm (QUBIC) [15] have not been extensively studied. In a word, as of now, the research on the bi-clustering is still at its initial stage. The real power of this clustering strategy is yet to be fully realized due to the lack of effective and efficient algorithms for reliably solving the general bi-clustering problem.
Among the existing bi-clustering algorithms, the CC and the FLOC algorithms are considered the most effective tools for processing gene expression data to date. The CC algorithm is the earliest and the most studied one, and the emerging algorithms are mostly based on the idea of the CC algorithm. The CC algorithm uses the MSR of a bi-cluster as a similarity measure to greedily extract bi-clusters that satisfy a homogeneity constraint. It generates the row and column cluster randomly and then improves the bi-clusters to minimize the MSR value. Only one bi-cluster is identified each time and then replaced by random numbers before identifying the next cluster [16]. Based on this, and with the aim of improving the generic CC algorithm, Yang et al. proposed another well-known method called FLOC [7], where an additional function is introduced to deal with the missing data and to discover the overlapping bi-clusters [17]. Subsequent studies suggest that the MSR is useful only for identifying certain classes of co-expressed genes, but not adequate to detect other transcriptionally co-regulated genes. Another well-known algorithm named QUBIC [15], which can solve the bi-clustering problem in a more general form, was proposed. The QUBIC algorithm can effectively and efficiently identify all statistically significant bi-clusters that cannot be identified by the other bi-clustering algorithms has turned out to be a more useful tool for the identification of co-regulated genes.
Existing bi-clustering algorithms for mining co-regulated genes face several limitations, including inadequate handling of noise and missing data, sensitivity to parameter selection, high computational complexity, difficulty in interpreting results, poor adaptability to various biological samples, lack of stability and consistency, and limited ability to integrate multiple data types. These issues constrain the effectiveness and reliability of bi-clustering algorithms in practical applications, highlighting the need for further improvement and optimization.

1.2. Brief Introduction of a Fuzzy Bi-Clustering Algorithm with Axiomatic Fuzzy Set

Based on the Axiomatic Fuzzy Set (AFS) theory [18], this paper proposes a novel bi-clustering model for the identification of co-regulated genes. The AFS theory facilitates a way to transform data into fuzzy sets (membership functions) and implement their fuzzy logic operations, which provides a flexible and powerful tool for representing human knowledge and emulating the human recognition process. In recent years, AFS theory has received increasing interest [18]. AFS theory takes the uncertainty of randomness and imprecision of fuzziness as a unified and coherent process so that the membership functions are determined by the observed data. In AFS, the fuzzy sets (membership functions) and their logic operations are impersonally and automatically determined by a consistent algorithm according to the distributions of original data (AFS structures and AFS algebras), which is very different from the traditional fuzzy sets that the membership functions are often given by personal intuition and the logic operations are implemented by a kind of triangular norm (t-norm); the attributes of objects in it can be various data types or sub-preference relations, even human intuition descriptions; the distance function and objective function are not required, and any prior knowledge about the dataset is also not required. For a large dimensionality and a huge number of genes, it is impossible or difficult to define the membership functions just by personal intuition and define distance-based functions to implement fuzzy logic operations. Thus, in this paper, we design a bi-clustering algorithm to discover the co-regulated genes based on AFS theory.
From the design perspective, the sub-preference relations theory of AFS is used to build a fuzzy membership (partition) matrix only based on the distributions of original gene expression data, and it does not require any distance measures and prior knowledge about the gene expression data. Specifically, in the proposed scheme, a reference gene is selected at first. Then, considering the genes as the universe and the conditions as the concept, a fuzzy partition matrix is built by the sub-preference relations theory [18]. Similarly, when considering the genes as the concept and the conditions as the universe, another fuzzy partition matrix can also be built. With the two partition matrices, we define a fuzzy-based similarity criterion to measure the similarity of the co-regulated genes under some special conditions. Subsequently, we design a cyclic optimization algorithm to discover the bi-clusters (co-regulated genes). We believe that this is the first time that such a fuzzy-based similarity criterion has been proposed and the first for solving the bi-clustering problem. In addition, an approach based on Fuzzy C-Means (FCM) [19,20] clustering is proposed to select a number of reference genes. Experimental studies completed on real-world gene expression data demonstrate that the proposed approach achieves better performance compared with that of the several well-known methods used for gene expression.
In brief, the major contribution of the paper is to propose a novel bi-clustering algorithm to discover the co-regulated genes. This algorithm does not require any prior knowledge about the gene expression data. To the best of our knowledge, the idea of the proposed approach has not been exposed in previous studies.
This paper is organized as follows. The bi-clustering-related concepts and novel similarity definitions based on the AFS theory, and the principle of the proposed method are presented in Section 2. Section 3 discusses the performance indexes. Section 4 includes experimental setup and covers an analysis of completed experiments. Section 5 covers some conclusions.

2. Bi-Clustering Algorithm with Axiomatic Fuzzy Set for Identification of Co-Regulated Genes

2.1. Problem Definitions

A commonly used way to visualize microarray data for gene expression analyses is to represent the data set as a matrix with rows representing the genes and columns representing the conditions (or the other way around) with each element of the matrix representing the expression value of a gene under a specific condition. Thus, identifying groups of genes in a microarray data set that share similar expression patterns under to-be-identified conditions is equivalent to finding submatrices with similar properties.
Let A = [ ,   a i j ,   ] R N × M be a microarray expression data matrix with a set of genes G = [ G 1 ,   G 2 ,   ,   G N ] T and a set of conditions O = [ O 1 ,   O 2 ,   ,   O M ] , where a i j represents an expression value of a gene ( G i ) under a condition ( O j ). A bi-cluster is basically a sub-matrix ( A I J ) that exhibits some similar tendency, which can be expressed by A ( I ,   J ) , where I N and J M are subsets of genes and conditions, respectively. Let g G be a reference gene; our goal is to find a subset of genes (co-regulated genes, bi-cluster) that are related to g . When the reference gene is not known, we can enumerate all genes in the matrix or randomly select several genes as the reference gene subsets. Similar ideas are also used in [14].

2.2. Similarity Definitions with Membership Degree Based on the AFS

Consider the aforementioned gene expression data matrix A . First, we use the AFS theory to build two fuzzy partition matrices [21], which are used to define the similarity matrices in this paper. One of the matrices considers the genes as the universe and the conditions as the concept, and the other one considers the genes as the concept and the conditions as the universe. Assume that the two fuzzy partition matrices are U G = [ , μ i j , ] and U C = [ , u i j , ] . The calculation of the membership degree based on the AFS is determined as follows [18,22]:
μ ( x ) = sup i I M A i ( x ) M x
where x X , X is the universe of discourse, M is a finite and positive measure over σ-algebra, and I is a non-empty indexing set [23].
For a gene expression data matrix ( A I J ) and a given reference gene ( g G ), define U G g = U G μ g = [ , δ i j , ] , δ i j = | μ i j μ g j | . Obviously, δ i j can characterize the similarity between the ith gene and the reference gene under the jth condition, and the smaller the δ i j is, the larger the similarity is, and vice versa. Furthermore, U C is used as another similarity to jointly discover the local co-regulated genes, and this is the so-called proposed bi-similarity.
Let U G g ( N , M ) be an N × M gene similarity matrix and U G g ( I , J ) be a bi-cluster (sub-matrix) of U G g ( N , M ) . For column j J , we define the dissimilarity score of the j-column in U G g ( I , J ) as the range of the column, i.e.,
μ I , j = i I max μ I , j min μ I , j
The dissimilarity score of U G g ( I , J ) is
μ I , J = 1 J ( i I ) , j = 1 J max μ I , j min μ I , j
Let U C ( N , M ) be an N × M condition similarity matrix and U C ( I , J ) be a bi-cluster (sub-matrix) of U C ( N , M ) . For row i I , we define the dissimilarity score of the i-row in U C ( I , J ) as the range of the row, i.e.,
u i , J = j J max u i , J min u i , J
The dissimilarity score of U C ( I , J ) is
u I , J = 1 I ( j J ) , i = 1 I max u i , J min u i , J
Consider a bi-cluster A ( I ,   J ) . If the dissimilarity score U G g ( I , J ) is low, and the genes under all the conditions in A ( I ,   J ) will have similar expression values. However, many genes are regularly co-expressed under some special conditions; in other words, mining local co-expressed valuable patterns is more meaningful than that of clustering globally. Thus, we use U G g and U C to jointly discover the local co-expressed valuable patterns. For a bi-cluster A ( I ,   J ) , if both U G g U ¯ G ( I , J ) and U C ( N , M ) are low, then the genes in A ( I ,   J ) under the J conditions are co-expressed.
Thus, we have completed the creation of two similarity (gene similarity and condition similarity) matrices. Based on the above analysis, we will report the proposed algorithm for discovering the bi-clusters.

2.3. Bi-Similarity Criterion Based on the Similarity Matrices

The algorithm is an essentially greedy algorithm, and it starts with the whole gene expression data matrix A ( N , M ) as an initial bi-cluster. In the discovery of bi-clusters, we define a novel bi-similarity criterion based on the similarity matrices above. With the use of the bi-similarity criterion, the co-regulation of the genes in the same bi-clusters becomes enhanced.
Let μ ( N , M ) and u ( N , M ) be the dissimilarity scores of U G g ( N , M ) and U C ( N , M ) , respectively. our goal is to discover a bi-cluster with small dissimilarity scores, such as μ ( N , M ) / α and u ( N , M ) / β , where α and β are the scale factors of the column and row of the bi-cluster. Thus, we can call the bi-cluster an (αβ)-bi-cluster. An excellent bi-cluster is generated by deleting and adding rows and columns with some particular rules. The sketch is as follows (Algorithm 1):
Algorithm 1 (Node Deletion)
Input:  U G and U C , the two fuzzy partition matrices of the gene expression data matrix, and α ,   β , the two scale factors of the column and row for the bi-clusters to be found.
Output:  A ( I ,   J ) , an (αβ)-bi-cluster that is a sub-matrix of A ( I ,   J ) with row set I and column set J with the dissimilarity scores no larger than μ ( N , M ) / α and u ( N , M ) / β , respectively.
Initialization: I and J are initialized to the gene and condition sets in the gene expression data, and A I J = A ; a reference gene g is given by the user; the maximum acceptable dissimilarity scores of the column and row: μ ( N , M ) / α , u ( N , M ) / β .
Iteration:
    (1). Calculate μ ( I , j ) for all j J , u ( i , J ) for all i I , and μ ( I , J ) , u ( I , J ) . If μ ( I , J ) μ ( N , M ) / α and u ( I , J ) u ( N , M ) / β , return A I J .
    (2). Find column j J with largest 
μ I , j = i I max μ I , j min μ I , j
and row i I with largest
u i , J = j J max u i , J min u i , J
remove the column if
α μ I , j μ N , M > β u i , J u N , M
else remove the row by updating either I or J .
Clearly, after node deletion, both the row and column dissimilarity scores of the sub-matrix will be reduced. However, the resulting (αβ)-bi-cluster may not be maximal, in the sense that some rows and columns may be added without increasing the dissimilarity scores. Thus, we design another algorithm (Algorithm 2): to refine the bi-clusters.
Algorithm 2 (Node Addition)
Input:  A I J , a sub-matrix of real numbers; I and J signifying an (αβ)-bi-cluster.
Output:  A ( I ,   J ) , I , and J such that I I and J J with the property that 
μ I , J μ I , J     &     u I , J u I , J
Iteration:
(1). Compute μ ( I , j ) for all j J , recompute μ ( I , J ) and u ( i , J ) , and add the columns j J if μ ( I , J ) μ ( N , M ) / α .
μ I , J μ N , M α     &     u I , J u N , M β
(2). Compute u ( i , J ) for all i I , recompute the u ( I , J ) and μ ( I , J ) , and add the rows i I if 
μ I , J μ N , M α     &     u I , J u N , M β
(3). If nothing is added in the iterate, return the final I and J as I and J .
Obviously, after the execution of the node addition algorithm, neither the row dissimilarity score nor the column dissimilarity score will increase. Sometimes, an addition may decrease the score more than any deletion.

2.4. Selection of the Reference Genes

In the algorithm proposed above, the reference genes we are interested in are known in advance. When the reference genes are unknown, we should select a number of genes as the reference genes. In some cases, the reference genes selected are closely related to the quality of the bi-clusters. Furthermore, we usually prefer the size (number of the co-regulated genes and conditions) of the bi-clusters to be as large as possible (discover more co-regulated genes under more conditions). In other words, if a gene has more similar genes under more conditions, then it is more suitable to be a reference. Based on this, we propose a method to select the reference genes.
Firstly, we calculate the fuzzy similarity matrices of all genes under each (jth) condition, and we obtain M similarity matrices; for example,
S j = s 1 ( j ) ,   s 2 ( j ) ,   , s i ( j )   ,   s N ( j ) s i ( j ) = s 1 ( j i ) ,   s 2 ( j i ) ,   ,   s k ( j i ) ,   ,   s N ( j i ) T i = 1 , 2 , , N ;     j = 1 , 2 , , M ;       k = 1 , 2 , , N
where T stands for the transpose operation. Let V i ( j ) = [ max ( s i ( j ) ) ,   min ( s i ( j ) ) ] T be the prototypes of s i ( j ) ; based on FCM clustering, we transform s i ( j ) into a membership matrix as follows:
Φ i ( j ) = φ k 1 ( j i ) φ k 2 ( j i ) T R 2 × N φ k c ( j i ) = s k ( j i ) v c ( j i ) 2 m 1 h = 1 2 ( 1 s h ( j i ) v c ( j i ) ) 2 m 1 c = 1 , 2 ; k = 1 , 2 , , N
where v c ( j i ) is the c-th element (cluster prototype) of V i ( j ) ; m is a fuzziness exponent (fuzziness coefficient); and | |   | | stands for the Euclidean distance. φ k c ( j i ) [ 0 ,   1 ] is the degree of membership of an individual s k ( j i ) belonging to the cluster c and satisfies the following condition.
c = 1 2 φ k c ( j i ) = 1 for   k = 1 ,   2 ,   ,   N
Then, we construct a function to compute the mean of the large fuzzy similarity of the ith gene under all the M conditions.
ϖ i = j = 1 M k = 1 N s k ( j i ) s i g n φ k 1 ( j i ) 0.5 δ k = 1 N s i g n φ k 1 ( j i ) 0.5 + M k = 1 N s i g n φ k 1 ( j i ) 0.5
where δ is a unit pulse response function. Generally, we consider that the genes with large ϖ values are more suitable to be references, since they have more similar genes under more conditions as previously described.

3. Performance Indexes

In order to evaluate the performance of the proposed algorithm, two commonly used performance indexes are briefly discussed.

3.1. Variance Index

Given a gene expression data matrix ( A ( N ,   M ) ) with a set of rows (genes, N ) and a set of columns (conditions, M ), a bi-cluster is a sub-matrix ( A ( I ,   J ) ,   I N , J M ) of A ( N ,   M ) . a i j is the value in the data matrix A corresponding to row i and column j. We denote by a i J the mean of the ith row in the bi-cluster, a I j the mean of the jth column in the bi-cluster, and a I J the mean of all elements in the bi-cluster. These values are defined by
a i J = 1 J j J a i j
a I j = 1 I i I a i j
a I J = 1 I J i I , j J a i j = 1 I i I a i J = 1 J j J a I j
The variance [22] is used to evaluate the quality of each bi-cluster A ( I ,   J ) :
V A R ( I ,   J ) = i I , j J a i j a I J 2
the lower the value returned, the better the quality of the bi-cluster will be; a perfect bi-cluster is a sub-matrix with variance equal to zero.

3.2. Mean Fluctuation Degree Index

Mean Fluctuation Degree (MFD) is used to evaluate the changing trends of the genes under each condition transition. the MFD of a bi-cluster is defined as
M F D I ,   J = 1 I J i I ,   j J Θ i j 1 I Θ i j 2
where
Θ i j Θ Θ = 180 arctan Δ Ξ / π
Δ = d i a g max ( a 1 j ) min ( a 1 j ) ,   , max ( a i j ) min ( a i j ) ,   M 1 i = 1 , 2 , , N ;     j = 1 , 2 , , M
Ξ = [ ,   a i j a i ( j 1 ) ,   ] R N × ( M 1 ) i = 1 , 2 , , N ;     j = 2 , , M
where subscript † denotes the Moore–Penrose Inverse of the matrix [24]. Obviously, for a bi-cluster, if the genes (rows) have similar changing trends under each condition transition, its MFD will be relatively smaller. Furthermore, if all genes (rows) in the bi-cluster have completely similar (or the same) changing trends under each condition transition, its MFD will be zero.
In particular, for a single-row (or a single-column) “bi-cluster”, its VAR and MFD indexes are also zero; however, such a “bi-cluster” is meaningless. To fairly compare the performance of the algorithms, we will drop the resulting bi-clusters with only one row and one column.

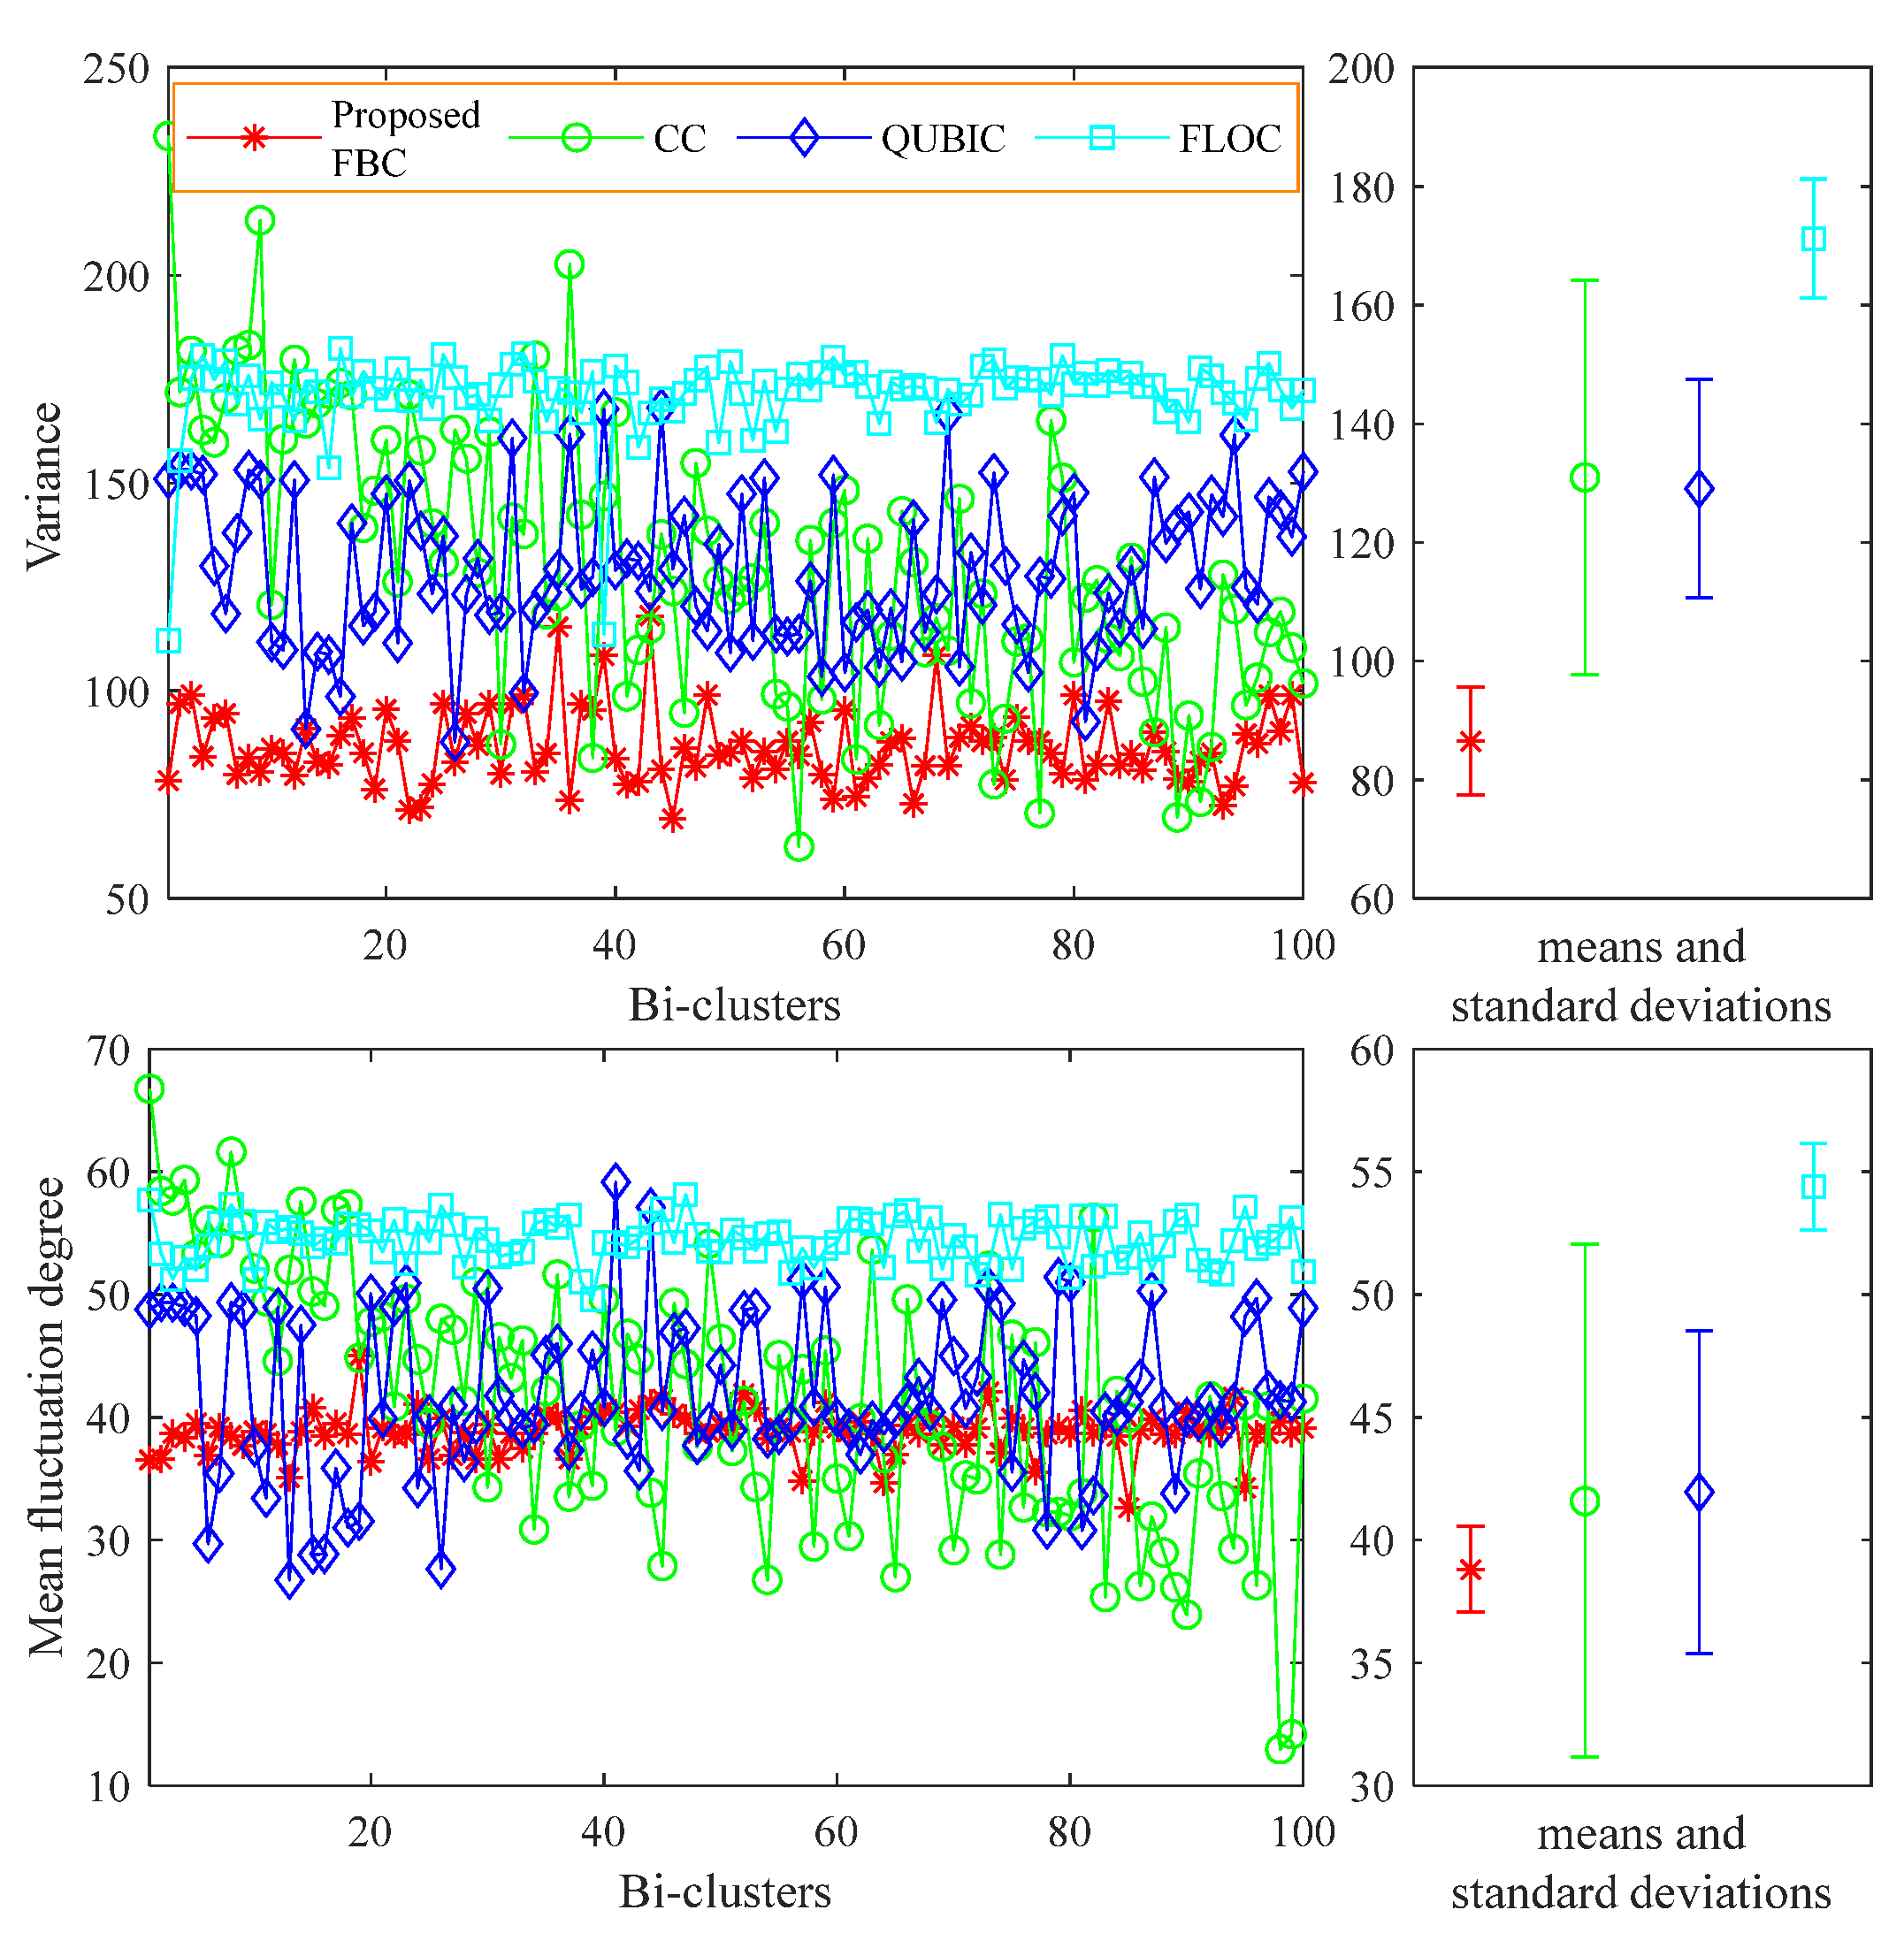
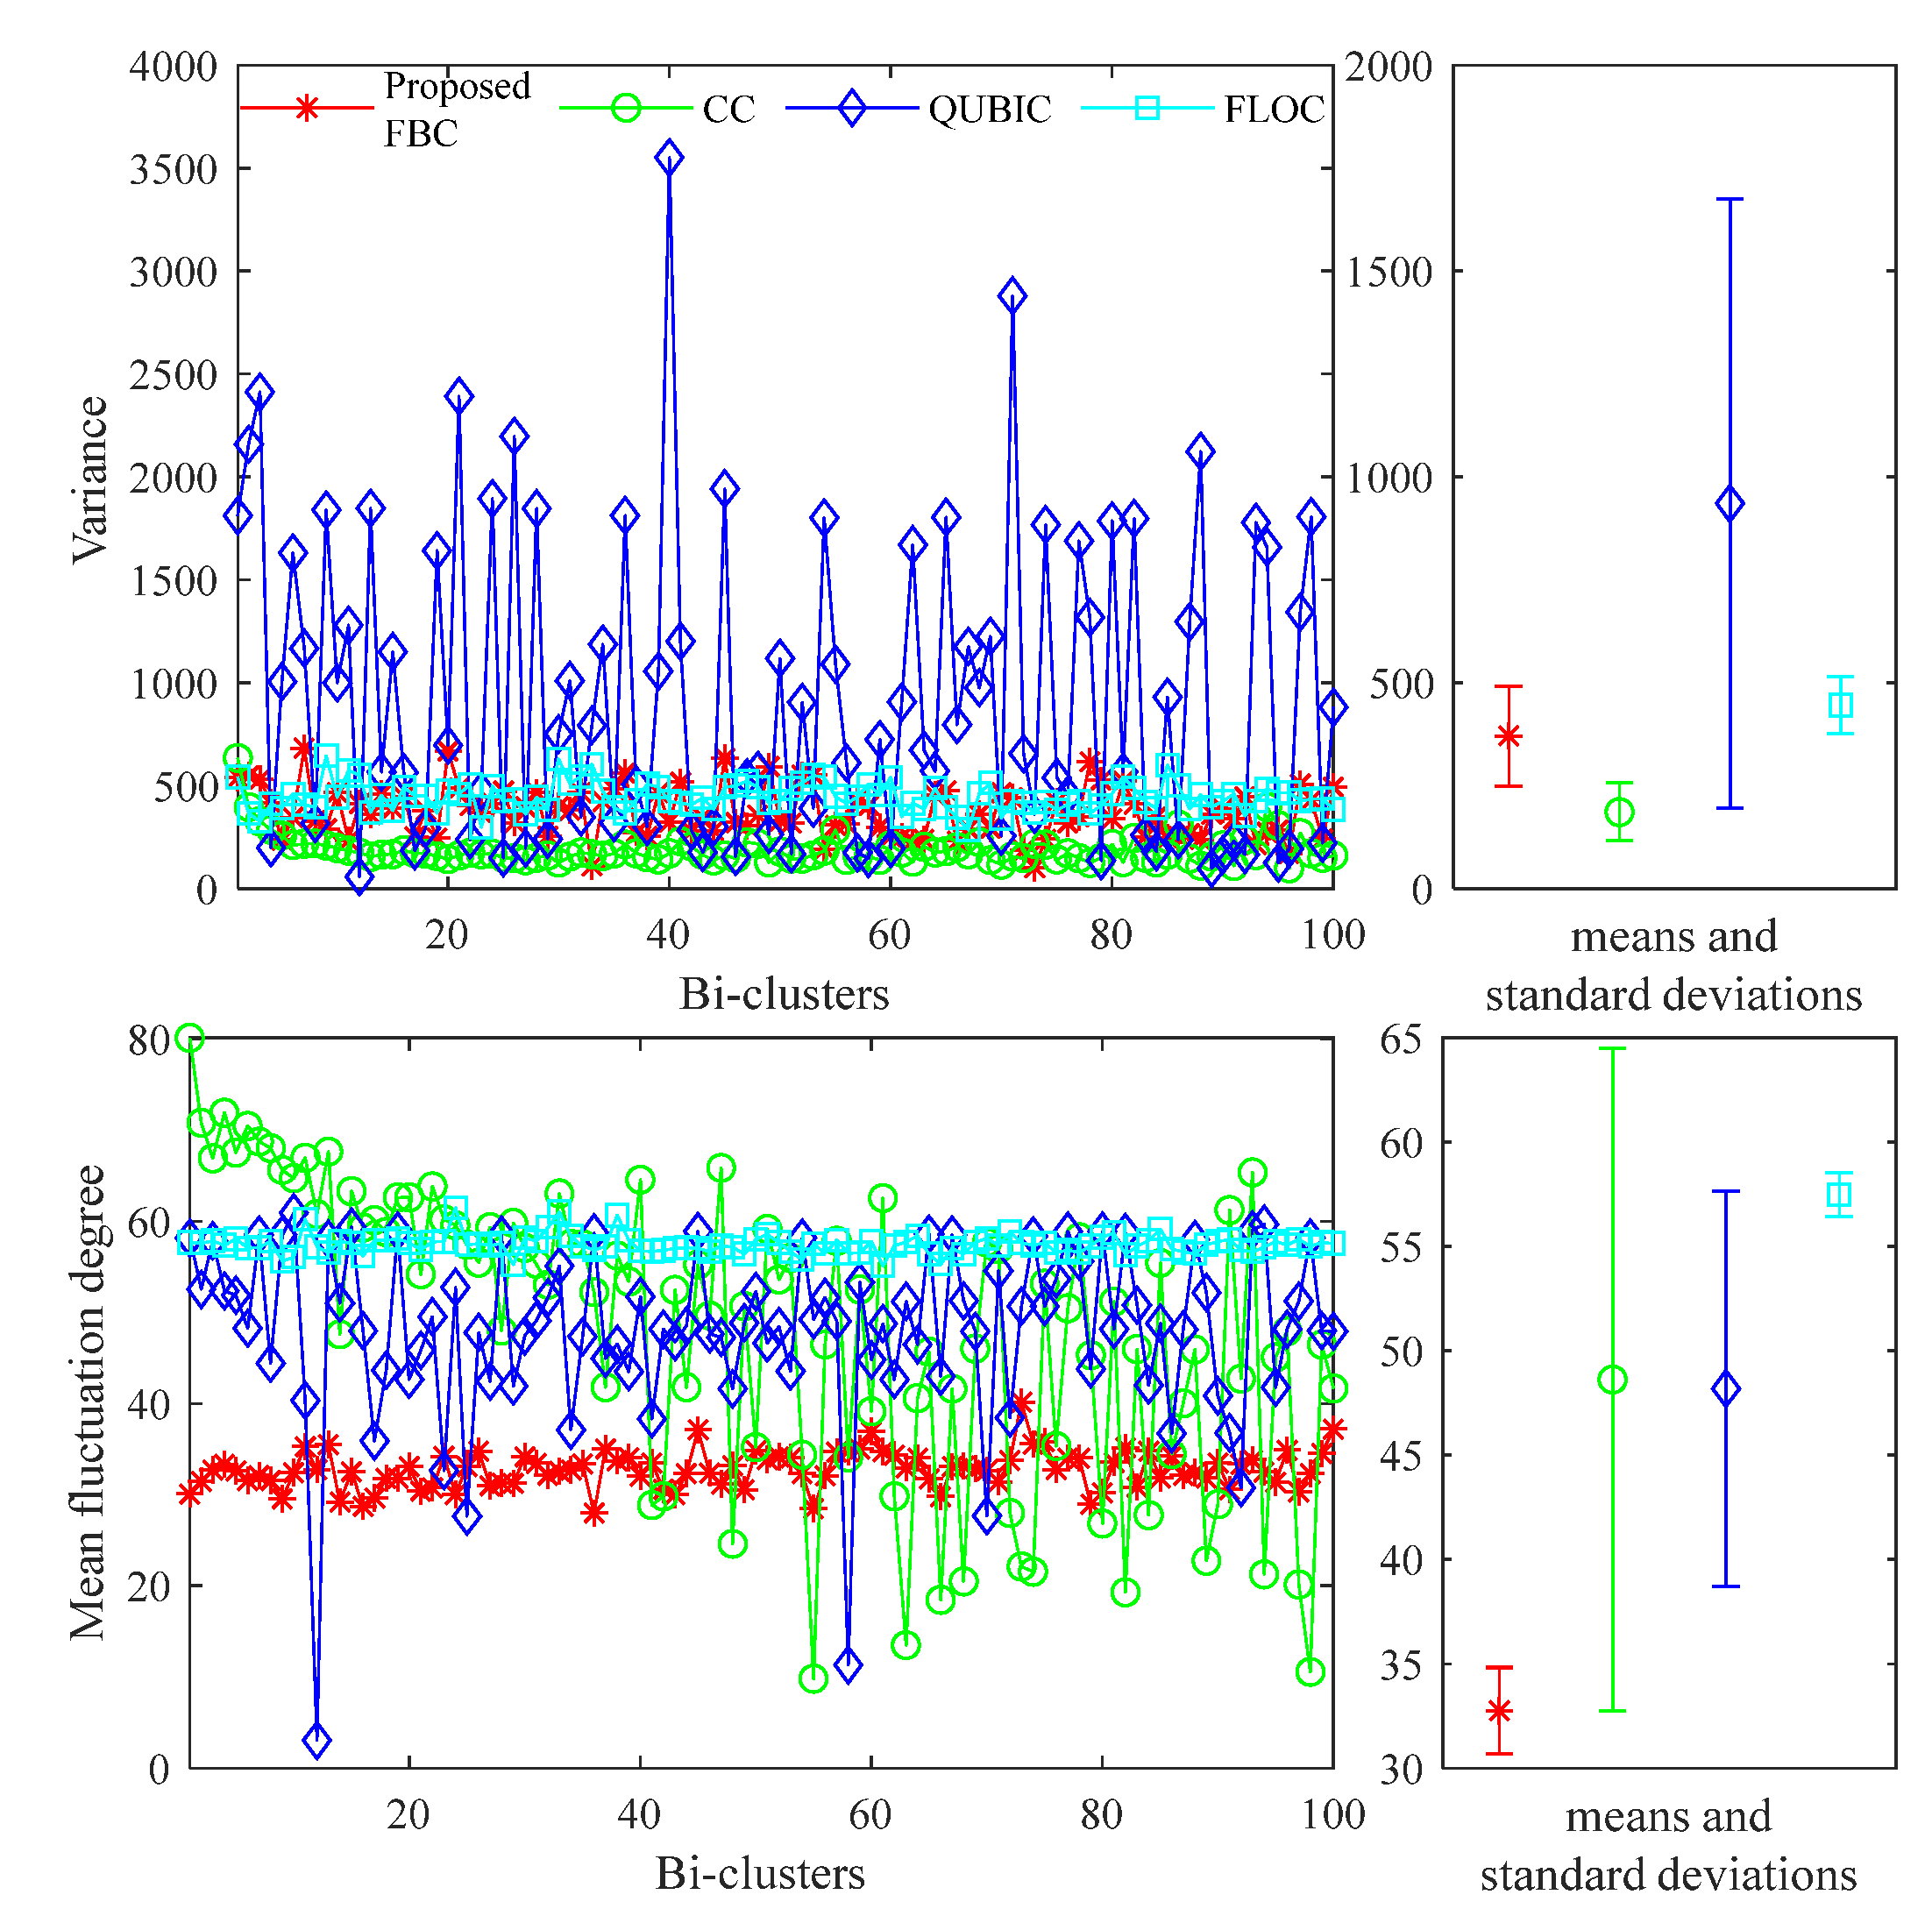
4. Experimental Studies

In the following experiments, we compare the performance of the proposed fuzzy bi-clustering (FBC) method with CC, FLOC, and QUBIC methods, which are the two well-known bi-clustering methods commonly used for gene expression. In the experiments, two well-known publicly available real microarray datasets named Yeast (http://arep.med.harvard.edu/biclustering/yeast.matrix) (Accessed on 5 April 2024) and Gordon 2002 [25] are used, which are the most commonly used datasets in bi-clustering. Both the variance [24] and the mean fluctuation degree are taken as the evaluation indexes which are briefly discussed as follows.
The methods are used to find 100 bi-clusters. A concise description of the values of the parameters used in the experiments is given in Table 1. The methods are repeated 10 times; the means and the standard deviations of the experimental results are presented. The experimental results are plotted in Figure 1 and Figure 2. The left part of each graph displays indicators for several algorithms in discovering all bi-clusters (co-regulated genes), which assess the quality of the identified co-expressed genes. The right part features error bars to evaluate the overall performance of the algorithms, summarizing the effectiveness of all identified bi-clusters.
It is evident that the algorithm proposed in this study excels in discovering bi-clusters (co-regulated genes), outperforming other comparable algorithms. The proposed algorithm is effective in discovering the quality of bi-clusters by grouping together genes that have trends with more similar fluctuation degrees. Compared with the CC, FLOC, and QUBIC clustering methods, the proposed method demonstrates significant advantages. Specifically, the experimental results highlight that our method consistently achieves higher accuracy and quality in identifying co-expressed gene bi-clusters. The proposed algorithm shows improved robustness and reliability, effectively handling diverse and complex datasets where traditional methods may falter.
To sum up, a robust algorithm to mine co-regulated genes is crucial for uncovering gene regulatory networks, identifying biomarkers and drug targets, reducing data dimensionality, and advancing personalized medicine and basic biological research, which can enhance the understanding of complex biological processes and improve clinical practices, holding significant scientific and societal value.

5. Conclusions

In this research, we designed a bi-clustering algorithm for the identification of co-regulated genes via AFS theory. During the design process, the sub-preference relations theory of AFS is introduced to construct two fuzzy membership matrices to define a fuzzy-based similarity criterion. With the similarity criterion, a cyclic optimization algorithm is designed to discover the bi-clusters (co-regulated genes). We conducted theoretical analysis and offered a comprehensive suite of experiments. Both the theoretical and experimental results are presented to verify the validity of the proposed method. Experimental results show that the proposed method outperforms the existing algorithms in finding the bi-clusters, and has demonstrated its outstanding performance and great potential for the development of gene expression. To the best of our knowledge, this research scheme is the first proposed, which steadily improves the performance of the bi-clustering.
At the current stage, we have completed a thorough theoretical analysis and conducted a comprehensive suite of experiments to validate our approach. Our theoretical work has laid a strong foundation, and our experimental results have demonstrated the feasibility and potential of our methods under controlled conditions. However, translating these findings into practical applications presents an exciting and valuable avenue for future research.
Future studies could focus on implementing practical experiments in real-world scenarios to assess the robustness and effectiveness of our algorithms. This could involve collaborating with biologists to apply our methods to actual biological datasets, such as those derived from clinical samples or environmental studies. Additionally, exploring the integration of our algorithms with existing bioinformatics tools and pipelines could enhance their usability and impact [26].
Moreover, practical experiments could help identify any unforeseen challenges or limitations that may arise in real-world applications, providing valuable insights for further refinement and optimization of our methods. By bridging the gap between theoretical analysis and practical implementation, we aim to contribute to the development of more robust, reliable, and widely applicable tools for gene expression analysis and other areas of computational biology.

Author Contributions

The authors confirm their contribution to the paper as follows. K.X.: methodology, writing—original draft, software, and visualization; Y.W.: investigation, writing—review and editing, and validation; K.X.: supervision. All authors have read and agreed to the published version of the manuscript.

Funding

This research was supported by the National Natural Science Foundation of China (Nos. 62101400, 72101075, 72171069, and 92367206), in part by the China Postdoctoral Science Foundation under Grant 2023M732743, and in part by the Shaanxi Fundamental Science Research Project for Mathematics and Physics under Grant 22JSQ032.

Data Availability Statement

Data will be made available upon request.

Conflicts of Interest

The authors declare no conflicts of interest.

References

  1. Dhaeseleer, P. How does gene expression clustering work? Nat. Biotechnol. 2005, 23, 1499–1501. [Google Scholar] [CrossRef] [PubMed]
  2. Pattini, L.; Sassi, R.; Cerutti, S. Dissecting heart failure through the multiscale approach of systems medicine. IEEE Trans. Biomed. Eng. 2014, 61, 1593–1603. [Google Scholar] [CrossRef] [PubMed]
  3. Mulqueen, R.M.; Pokholok, D.; Norberg, S.J.; Torkenczy, K.A.; Fields, A.J.; Sun, D.; Sinnamon, J.R.; Shendure, J.; Trapnell, C.; O’Roak, B.J.; et al. Highly scalable generation of DNA methylation profiles in single cells. Nat. Biotechnol. 2018, 36, 428–431. [Google Scholar] [CrossRef] [PubMed]
  4. Mishra, D.; Shaw, K.; Mishra, S. Gene expression network discovery: A pattern based biclustering approach. In Proceedings of the 2011 International Conference on Communication, Computing & Security, ACM, Rourkela, Odisha, India, 12–14 February 2011; pp. 307–312. [Google Scholar]
  5. Yang, J.; Wang, H.; Wang, W. Enhanced biclustering on expression data. In Proceedings of the Third IEEE Symposium on Bioinformatics and Bioengineering, Bethesda, MD, USA, 10–12 March 2003; pp. 321–327. [Google Scholar]
  6. Cheng, Y.; Church, G.M. Biclustering of expression data. In Proceedings of the Conference on Intelligent Systems for Molecular Biology (ISM), San Diego, CA, USA, 19–23 August 2000; pp. 93–103. [Google Scholar]
  7. Yang, J.; Wang, H.; Wang, W.; Yu, P.S. An improved biclustering method for analyzing gene expression profiles. Int. J. Artif. Intell. Tools 2005, 14, 771–789. [Google Scholar] [CrossRef]
  8. Lazzeroni, L.; Owen, A. Plaid models for gene expression data. Stat. Sin. 2000, 12, 61–86. [Google Scholar]
  9. Ben-Dor, A.; Chor, B.; Karp, R.; Yakhini, Z. Discovering local structure in gene expression data: The order-preserving submatrix problem. J. Comput. Biol. 2003, 10, 373–384. [Google Scholar] [CrossRef] [PubMed]
  10. Bergmann, S.; Ihmels, J.; Barkai, N. Iterative signature algorithm for the analysis of large-scale gene expression data. Phys. Rev. E Stat. Nonlinear Soft Matter Phys. 2003, 67, 031902. [Google Scholar] [CrossRef]
  11. Murali, T.M.; Kasif, S. Extracting conserved gene expression motifs from gene expression data. In Proceedings of the Pacific Symposium on Biocomputing, Lihue, HI, USA, 3–7 January 2003; pp. 77–88. [Google Scholar]
  12. Prelić, A.; Bleuler, S.; Zimmermann, P.; Wille, A.; Bühlmann, P.; Gruissem, W.; Hennig, L.; Thiele, L.; Zitzler, E. A systematic comparison and evaluation of biclustering methods for gene expression data. Bioinformatics 2006, 22, 1122–1129. [Google Scholar] [CrossRef]
  13. Gao, C.; McDowell, I.C.; Zhao, S. Context specific and differential gene co-expression networks via Bayesian biclustering. Comput. Biol. 2016, 12, e1004791. [Google Scholar] [CrossRef]
  14. Liu, X.; Wang, L. Computing the maximum similarity bi-clusters of gene expression data. Bioinformatics 2006, 23, 50–56. [Google Scholar] [CrossRef]
  15. Li, G.; Ma, Q.; Tang, H.; Paterson, A.H.; Xu, Y. QUBIC: A qualitative biclustering algorithm for analyses of gene expression data. Nucleic Acids Res. 2009, 37, e101. [Google Scholar] [CrossRef] [PubMed]
  16. Shruthi, M.P.; Saravana, K.E. A survey on biclustering. Int. J. Innov. Res. Sci. Technol. 2016, 3, 2349–6010. [Google Scholar]
  17. Khalid, B.; Allab, K. Bi-clustering continuous data with self-organizing map. Neural Comput. Appl. 2013, 22, 1551–1562. [Google Scholar]
  18. Liu, X.; Jia, W.; Wang, Y.; Guo, H.; Ren, Y.; Li, Z. Knowledge discovery and semantic learning in the framework of axiomatic fuzzy set theory. WIREs Data Min. Knowl. Discov. 2018, 8, 1268–1292. [Google Scholar] [CrossRef]
  19. Lian, C.; Ruan, S.; Denoeux, T.; Li, H.; Vera, P. Spatial evidential clustering with adaptive distance metric for tumor segmentation in FDG-PET images. IEEE Trans. Biomed. Eng. 2018, 65, 21–30. [Google Scholar] [CrossRef] [PubMed]
  20. Xu, K.; Pedrycz, W.; Li, Z.; Nie, W. Constructing a virtual space for enhancing the classification performance of Fuzzy clustering. IEEE Trans. Fuzzy Syst. 2018, 27, 1779–1792. [Google Scholar] [CrossRef]
  21. Xu, K.J.; Pedrycz, W.; Li, Z.W.; Nie, W.K. High-accuracy signal subspace separation algorithm based on gaussian kernel. IEEE Trans. Ind. Electron. 2019, 66, 491–499. [Google Scholar] [CrossRef]
  22. Madeira, S.C.; Oliveira, A.L. Biclustering algorithms for biological data analysis: A survey. IEEE/ACM Trans. Comput. Biol. Bioinform. (TCBB) 2004, 1, 24–45. [Google Scholar] [CrossRef]
  23. Ren, Y.; Song, M.; Liu, X. New approaches to the fuzzy clustering via AFS theory. Int. J. Inf. Syst. Sci. 2007, 3, 307–325. [Google Scholar]
  24. Stanev, D.; Moustakas, K. Simulation of constrained musculoskeletal systems in task space. IEEE Trans. Biomed. Eng. 2017, 65, 307–318. [Google Scholar] [CrossRef]
  25. Li, X.; Wong, K.-C. Evolutionary multiobjective clustering and its applications to patient stratification. IEEE Trans. Cybern. 2019, 49, 1680–1693. [Google Scholar] [CrossRef] [PubMed]
  26. Shrimankar, D.D.; Durge, A.R.; Sawarkar, A.D. Heuristic analysis of genomic sequence processing models for high efficiency prediction: A statistical perspective. Curr. Genom. 2022, 23, 299–317. [Google Scholar] [CrossRef] [PubMed]
Figure 1. Comparison of the performance of methods on the Yeast dataset.
Mathematics 12 01659 g001
Figure 2. Comparison of the performance of methods on the Gordon 2002 dataset.
Mathematics 12 01659 g002
Table 1. Datasets and parameters used in the experiments.
DatasetsYeastGordon-2002
Number ofGenes28841626
Conditions17181
Threshold of MSR3003000
α5.05.5
β1.83.0
Disclaimer/Publisher’s Note: The statements, opinions and data contained in all publications are solely those of the individual author(s) and contributor(s) and not of MDPI and/or the editor(s). MDPI and/or the editor(s) disclaim responsibility for any injury to people or property resulting from any ideas, methods, instructions or products referred to in the content.

