1. Introduction
The China Railway Express (CRE) serves as an innovative intercontinental trade link, fostering economic integration between China, Europe, and Central Asia [
1,
2]. As of September 2023, the CRE operated over 77,000 trains, serving 217 cities across 25 European countries [
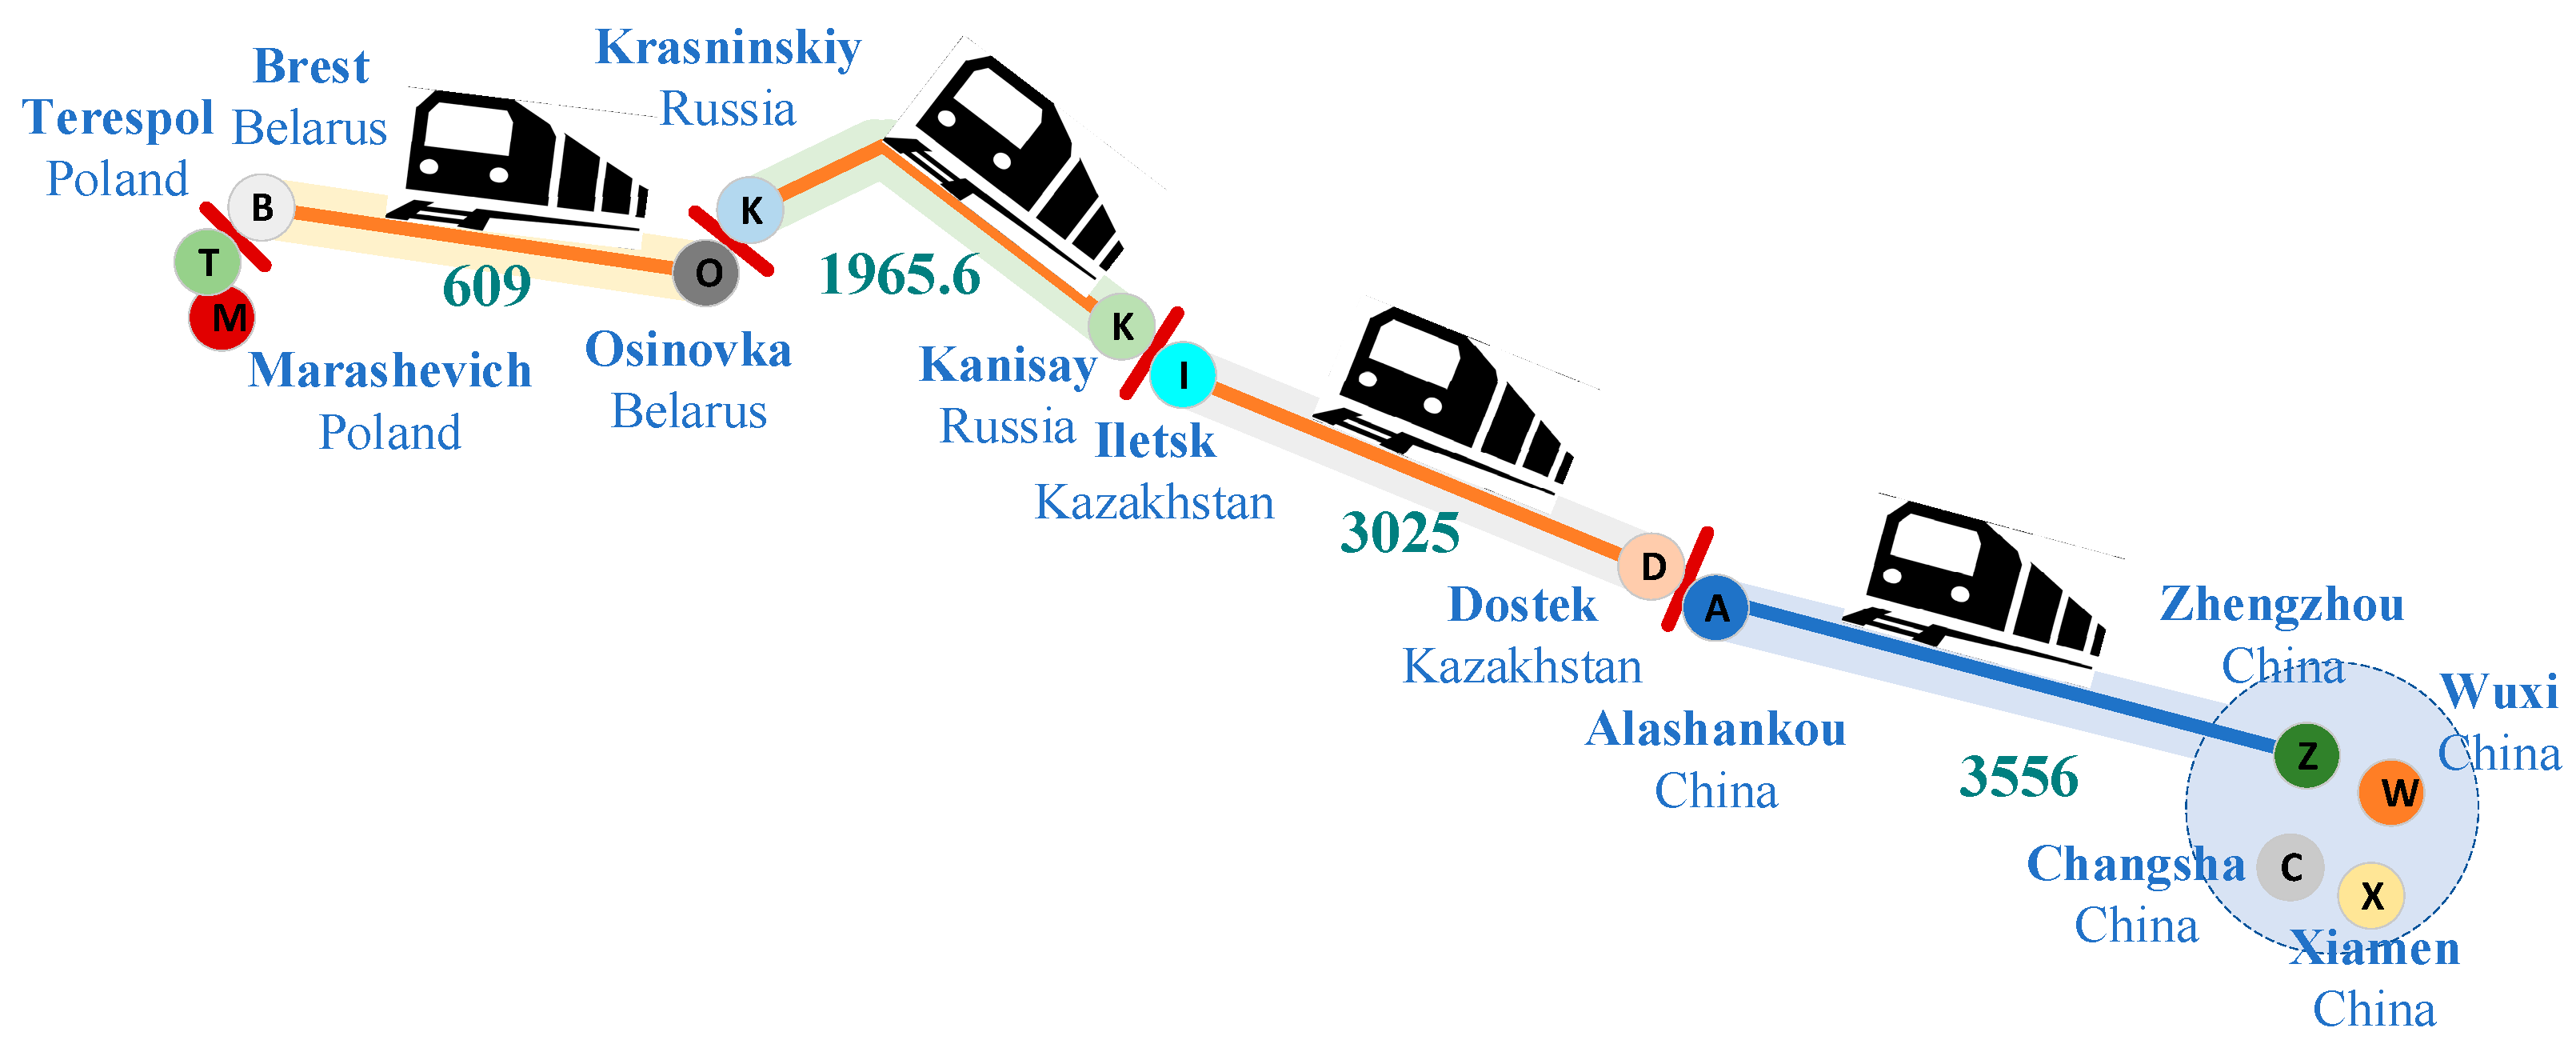
3]. The expanding network of CRE routes involves multiple stakeholders, including operating-platform enterprises (OPEs), local governments (LGs), and other groups, forming a dynamic market ecosystem. Different cities have different positionings of the CRE liner. Xi’an and Zhengzhou, which are farther away from the seaport, position the CRE as an important channel for foreign-export transport, while Xiamen and other cities have developed maritime transport, and the CRE liner is only used as a supplement to this mode of transport. LG’s supportive policies for the CRE liner have made a significant difference, resulting in a variety of types of OPEs and LGs.
Since the initiation of CRE services in 2011, numerous LGs in various Chinese cities have consistently provided substantial subsidies to support CRE operations. This initiative aims to promote the route and catalyze local economic development. LGs base their subsidies on factors such as the number of containers or the converted column count, directly supporting OPEs responsible for CRE operation and management [
4]. However, this subsidy mechanism has led to intense competition for cargo sources and market disorder [
5,
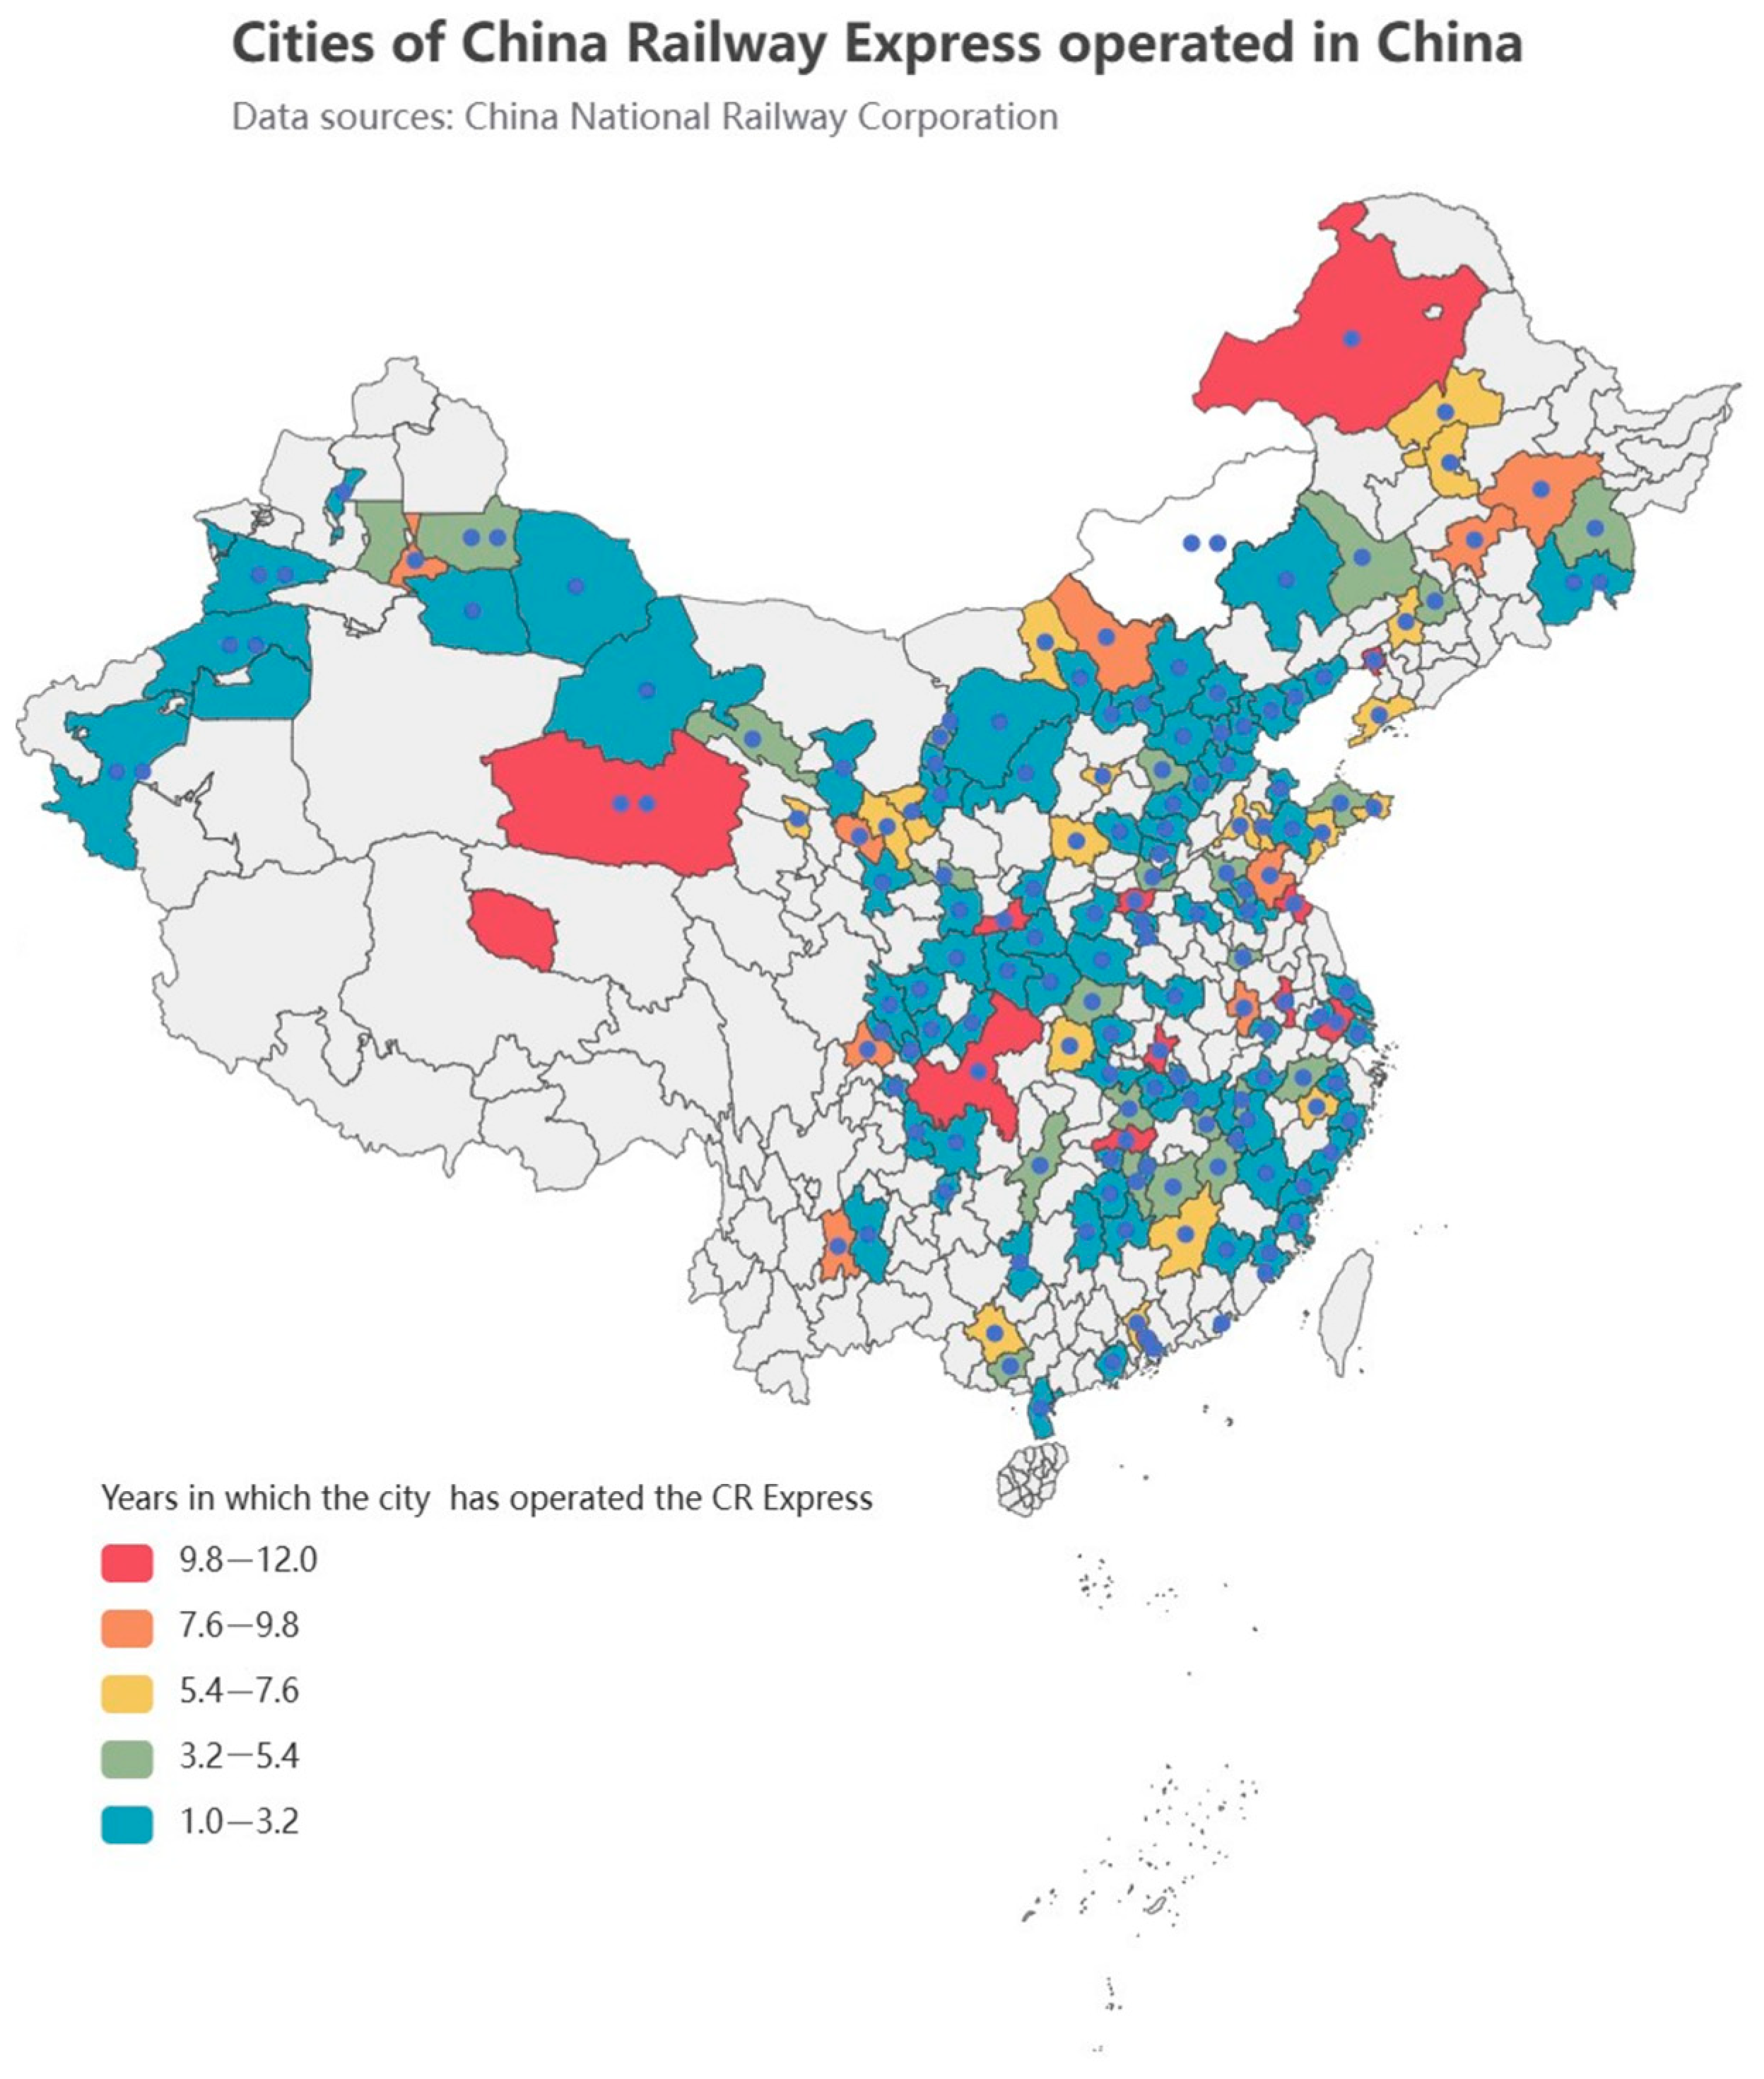
6]. Additionally, to secure government subsidies, some OPEs engage in practices such as carrying empty loads and submitting fraudulent subsidy claims. This has resulted in financial pressure on LGs. Meanwhile, the number of Chinese cities operating the CRE continues to rise, as illustrated in
Figure 1, showing substantial variations in the years of their operations. This disparity in operational histories creates a contrast in the developmental statuses and support policies for the CRE between cities. Disparities in the start-of-operation timelines across different cities have led to significant variations in the subsidy standards, as depicted in
Table 1.
In response to market disorder, many LGs have gradually begun to set up monitoring and auditing teams to supervise the distribution of subsidies, the operation of liner trains financed by subsidies, and the application of subsidies. For example, Guangzhou, Zhengzhou, and other cities have publicly released the results of the monitoring and auditing of the distributions of their subsidies. Scholars advocate steering the CRE’s development toward maximizing the market’s decisive role in resource allocation [
7,
8]. To achieve this, a gradual subsidy exit policy is being considered by the national financial department of China. However, studies suggest that subsidy withdrawal could significantly impact the operational model of CRE trains [
9]. Confronting the backdrop of subsidy withdrawal, it becomes apparent that recently initiated OPEs will encounter intensified development pressures with the cessation of government support. A uniform “one-size-fits-all” subsidy withdrawal strategy lacks suitability for OPEs and LGs at diverse developmental stages.
After subsidy withdrawal, concerns about social benefits, such as decreases in freight volumes and the suspension of certain routes due to elevated freight rates, have left many LGs indecisive about their courses of action. LGs and OPEs, as key stakeholders in subsidy dynamics, focus on understanding how their subsidy–operation strategies will evolve. This paper seeks to address three primary research questions:
(1) What are the interaction relationships and evolution mechanisms between different types of OPEs and LGs in the CRE market within the market dynamics?
(2) What impacts do key market influences, such as subsidy amounts, the monitoring intensity, different costs, etc., have on the stability of the CRE operation market for different types of OPEs and LGs?
(3) How can OPEs and LGs optimize their strategies to foster stability and promote development in the marketization direction for various types of CRE operation markets?
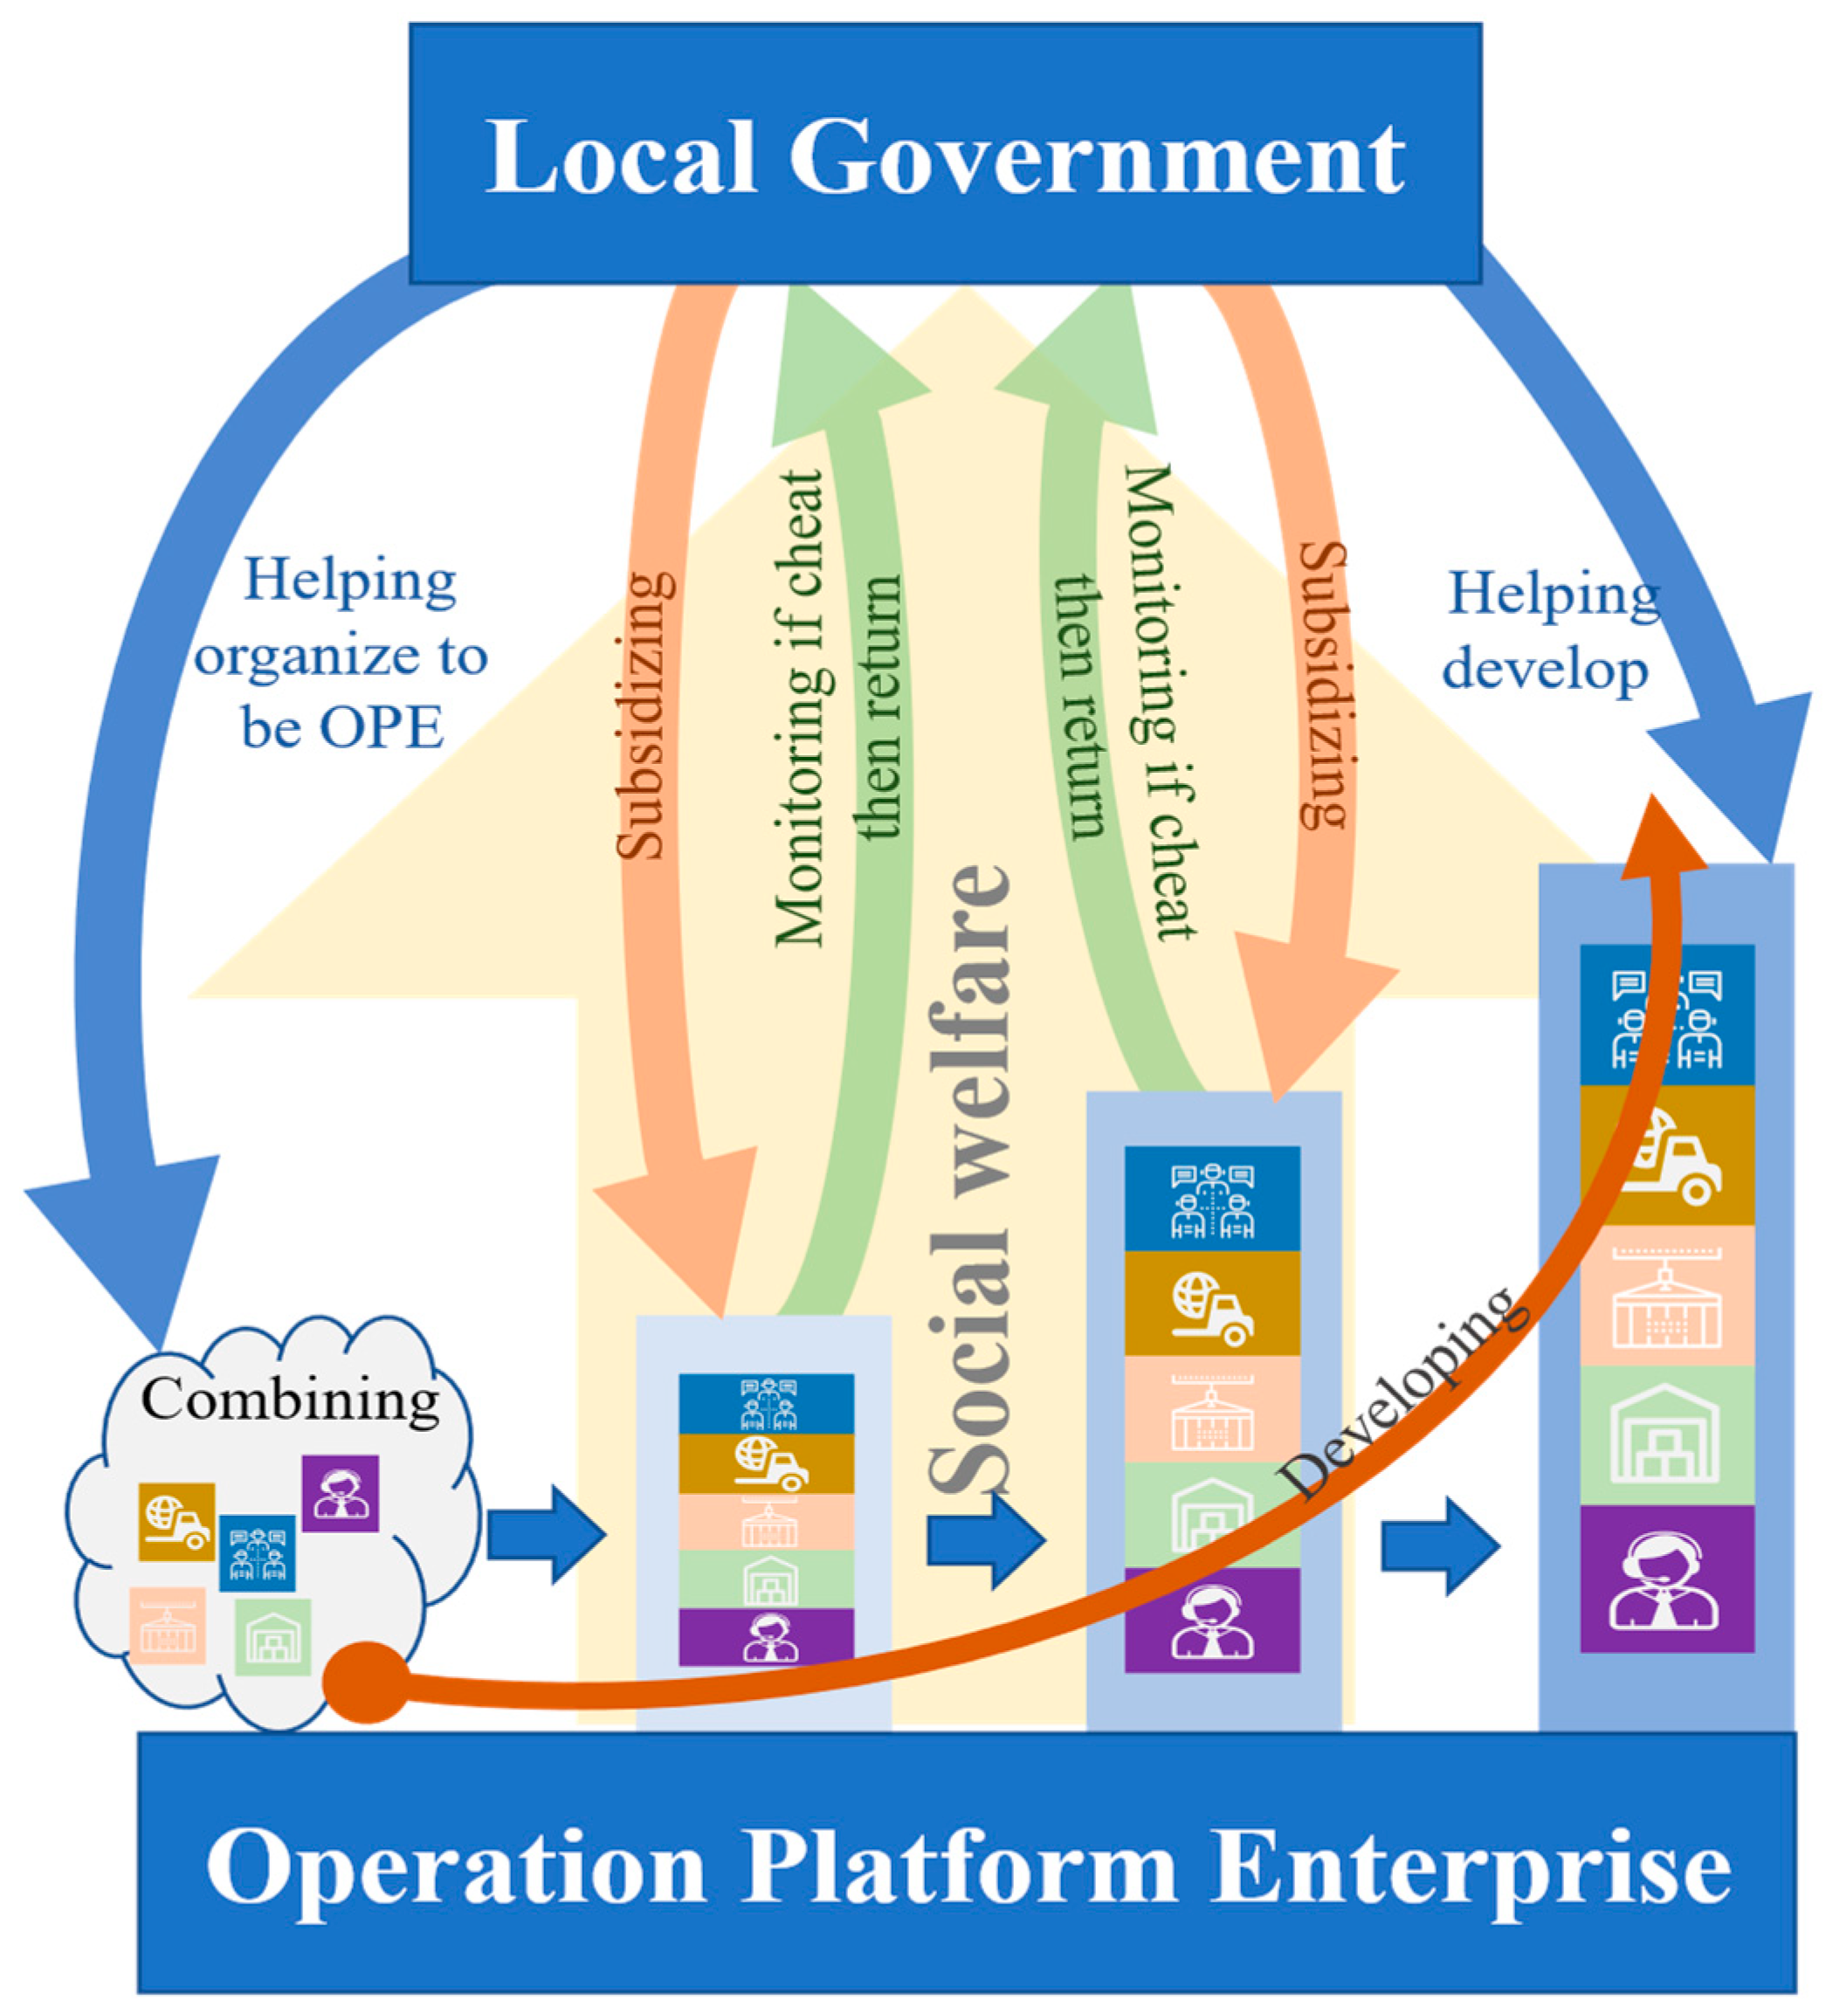
To solve the above problems, we analyzed the characteristics of the operation system of the CRE. By combing the modes of operation of the CRE in various cities, the subjects related to the subsidy-operation behavior are the local government and the CRE operating enterprises. The CRE market’s daily operations constitute a dynamic gaming process, involving LGs employing subsidies and other supportive policies to aid OPEs in their formation, development, and growth. OPEs, in turn, decide whether to operate the liner, aiming to maximize their interests and generate social welfare, such as tax revenue and employment opportunities for society. This game involves dynamic flows of capital and information within the operational market, and the subsidy policy and operational status of the CRE undergo continual and dynamic evolution, as expressed in
Figure 2. It has been explained that the number of cities where the CRE operates has reached 217 (i.e., there are no less than 217 LGs). The number of OPEs is even larger. Therefore, the ever-increasing number of cities and enterprises operating the CRE has obvious characteristics of the population.
In response to the dynamic evolution within the operating system, evolutionary game theory excels at resolving dynamic games involving multiple subjects [
10]. Furthermore, information asymmetry between LGs and OPEs introduces limited rationality, intensifying the complexity of the game. Notably, scant attention has been given to the characteristics of their limited rationality in the existing studies. Additionally, the subsidization and operation of the CRE involve learning and imitation, wherein new routes and platforms borrow insights from established route models. This aligns with the concept of population imitation learning under finite rationality. Hence, the theoretical framework of EGT proves advantageous for analyzing dynamic game strategies related to the subsidy–operation dynamics of the CRE. Nevertheless, EGT typically addresses abstract and overarching strategies [
11]. Decision-making guidance in a macrosense is limited for operating-platform companies and local governments that want to take concrete action. If the OPEs choose to operate the China–Europa liner, a series of operations will be generated in the process of daily operations, including sending and arriving operations, documentation operations, loading and unloading operations, etc. If the decision needs to be optimized to a more detailed level, it is necessary to meticulously measure the operation process. The Activity-Based Costing method is a costing method that allocates costs more accurately to operating activities. This paper integrates EGT with the Activity-Based Costing (ABC) method. This integration translates the outcomes of game analysis under EGT into tangible decision-making recommendations, enhancing the refinement and practical applicability of EGT.
The main contributions of this paper are as follows: (1) The establishment of a game system for CRE operators, utilizing EGT to model the dynamic game process involving subsidy–operation strategies between LGs and CRE OPEs under four typical evolutionary scenarios. This research aims to reveal the dynamic evolution process and the trend of strategy selection in different types of markets. (2) The combination of EGT and the ABC methodology. In constructing the evolutionary gaming system, transport costs are broken down into fixed costs, operating costs, and service change costs. Then, the Activity-Based Costing (ABC) method is applied to measure these three types of costs from the perspective of segmented activities. The combination of macro- and microapproaches around the key factor of transport costs improves the decision maker’s ability to identify the cost drivers. (3) An analysis of four representative operation instances of cities hosting the CRE within China and the use of the coefficient-of-variation method to gauge the monitoring intensities of LGs. This study involved simulating and analyzing the evolutionary processes in these instances, elucidating the interaction dynamics between multi-type OPEs and LGs, conducting sensitivity analyses on key factors influencing the evolution system, and presenting decision-making optimization suggestions for both OPEs and LGs.
The subsequent sections of the paper are organized as follows:
Section 2 details the establishment of the fundamental modeling framework, incorporating evolutionary game theory (EGT) and the Activity-Based Costing (ABC) method;
Section 3 scrutinizes the evolutionary strategies of OPEs and LGs and analyzes the evolutionary game process under four distinct cases;
Section 4 executes a case analysis and simulation within the context of the four instances, accompanied by a detailed discussion of the sensitivity analysis of the key factors.
2. Materials and Methods
2.1. Evolutionary Game Model: Interactions between LGs and OPEs
In China’s CRE system, each city’s LG partners with an OPE, offering policies like container-based subsidies to enhance CRE services. OPEs leverage these benefits to lower rates and upgrade services, driving economic growth. LGs also ensure market stability by backing alternative transport when CRE operations falter. Stringent subsidy oversight with penalties deters misuse yet balances autonomy for OPEs. This dynamic interplay is captured in an evolutionary game model assessing the strategic interactions between OPEs and LGs:
(1) The strategy set of the OPEs encompasses the strategies of operating or not operating the CRE; is denoted by corresponding probabilities of x and 1 − x. Simultaneously, the strategy set of the LGs includes the strategies of subsidizing or not subsidizing the CRE; is represented by corresponding probabilities of y and 1 − y. The resulting decision space of the evolutionary game model for the OPEs and the LGs is ;
(2) The revenue of the OPEs comprises two primary components: the operation of the CRE and other railroad freight-forwarding activities. In the absence of LG subsidies, the standard transport price for the CRE is denoted as . Conversely, when the LGs opt to provide subsidies, the subsidy amount directly offsets the transport price, also resulting in a price of , , while the income from other railroad freight-forwarding businesses remains at R;
(3) The regular transportation volume of the OPEs is denoted as
q, and
a represents the market gain coefficient. This coefficient signifies the growth rate in the transportation volume achievable through enhancements in the service level of the OPEs, and it may assume positive or negative values. Consequently, the container transportation volume of the OPEs during the operation of the CRE is expressed as follows:
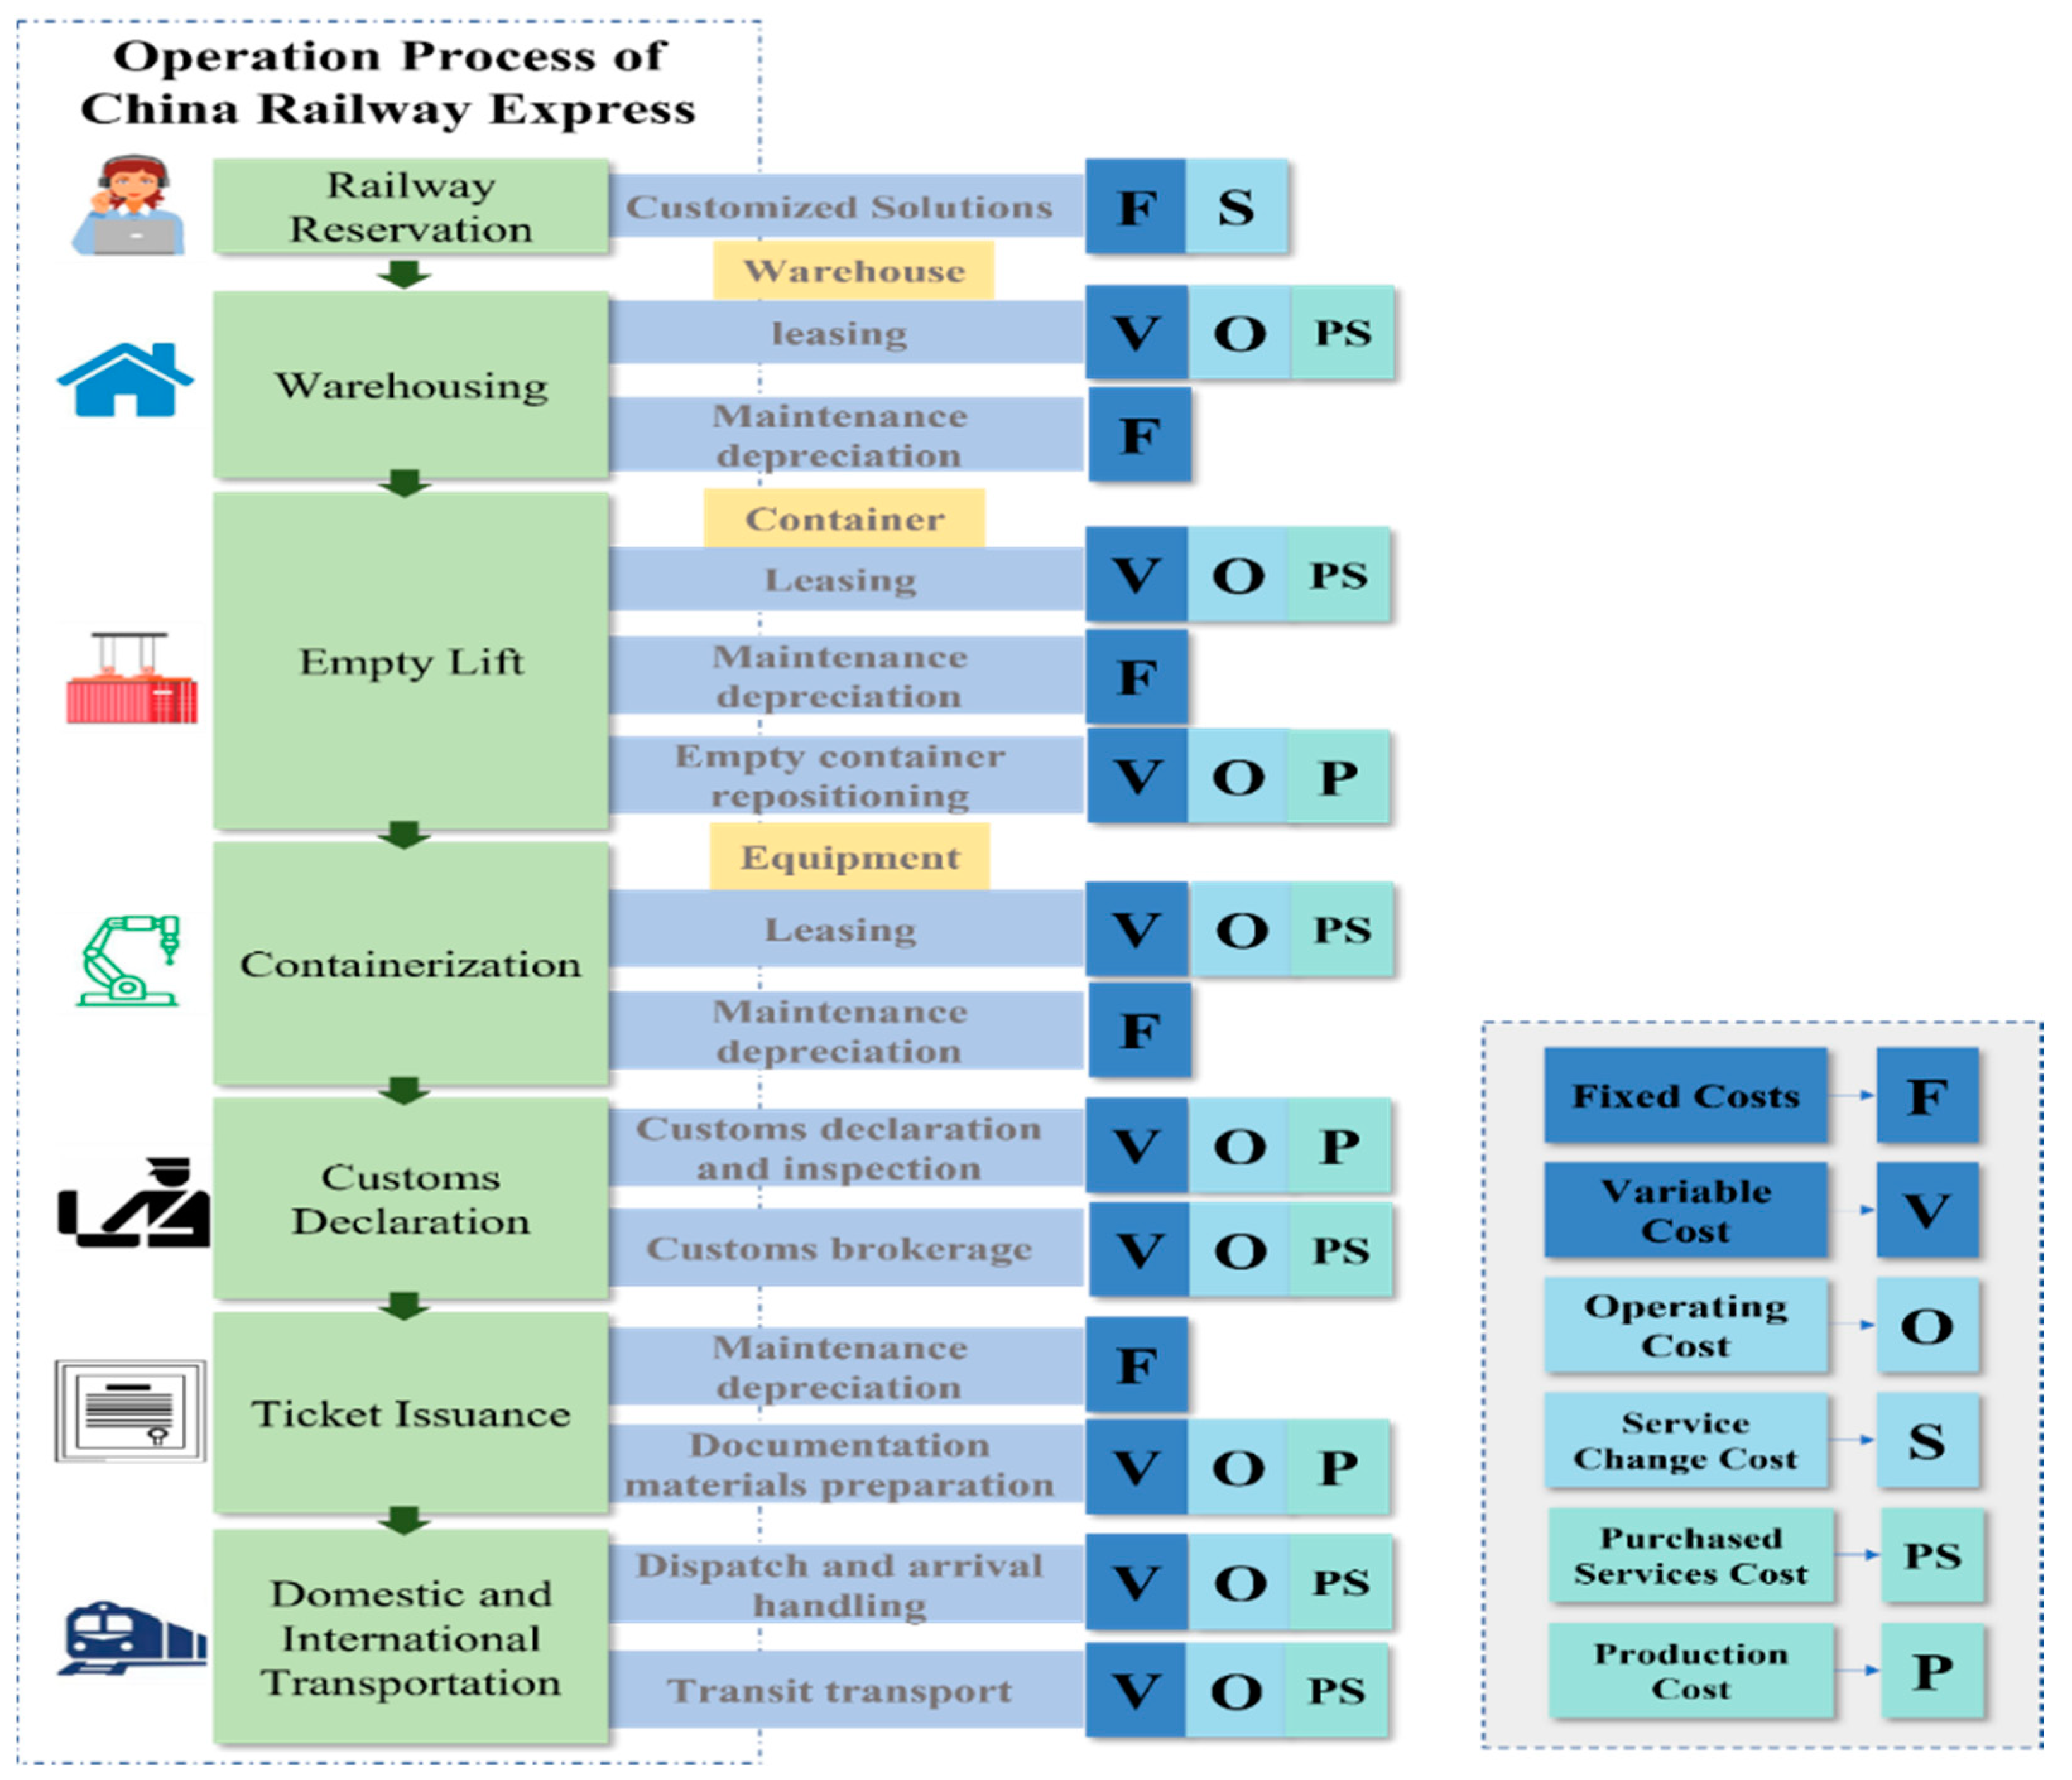
(4) Integrated with the operational dynamics of the CRE and drawing insights from extant research on railway operational cost measurements, the operational costs are categorized into fixed costs, variable costs, operating costs, service change costs, purchased services costs, and production costs.
Figure 3 illustrates the detailed operational process alongside the associated costs.
Fixed costs (
) encompass labor for the platform operation, equipment and facility depreciation costs, and platform maintenance costs. Variable costs comprise operating costs (
) and service change costs. Operating costs include purchased service costs (
) (comprising domestic, transit, arrival railroad transportation service fees, etc.) and production costs (
) (entailing expenses associated with the direct provision of logistics services, such as online booking, document production, etc.). Service change costs (
) are allocated to enhance service levels, directly impacting the improvement in the market gain coefficient. However, their incremental increase exhibits diminishing marginal effects, as indicated by the following functional relationship for the influence coefficient:
(5) If the enterprise does not operate the CRE, the LGs incur specific social governance costs () to support the development of alternative transportation modes, like sea and air transport. Conversely, when the enterprise operates the CRE, it generates a clustering effect for the cargo source, significantly boosting the local economy’s level. This enhancement is quantified as a social benefit ();
(6) When the government subsidizes the CRE, the subsidy process unfolds as follows: after the OPEs begin to operate the CRE, they report the operational details to the LGs. Subsequently, the LGs provide a subsidy (
) for each container. To ensure transparency and prevent deceptive subsidy claims, the LGs maintain a certain level of monitoring intensity (
) over the CRE operations by the enterprise [
12]. The supervising cost is denoted as
. When OPEs misrepresent their operations in order to obtain subsidies, it is assumed that the fraud is immediately detected, and penalties are imposed as long as the LGs are monitoring the market. In such instances, the subsidy (
) is recovered, and a penalty, denoted by
F,
, is imposed as a penalty coefficient:
Table 2 details the parameters, with
Figure 4 depicting OPE-LG game interactions. Using EGT, we modeled the CRE’s LGs and OPEs as finite rational players seeking profit maximization through a dynamic, two-population evolutionary game.
Based on the above model, the benefits of the LGs and OPEs were calculated separately when each of them chose subsidy and operation strategies, with a total of four strategy combinations. This resulted in a benefit matrix, as shown in
Table 3.
2.2. Cost Measurement of CRE Using Activity-Based Costing Method
The core of evolutionary game theory (EGT) lies in participants adjusting strategies based on a comparison of individual versus average benefits, aiming for an evolutionary equilibrium where benefits are optimized [
13]. This theory is deeply rooted in economic analysis and is particularly relevant for examining strategic interactions between governments and businesses, and within enterprises [
14,
15,
16,
17], making cost management a crucial aspect of the game.
In the context of the CRE, accurately determining costs from individual OPEs is challenging. To navigate the potential crisis of withdrawal from reduced freight volumes post-subsidy, this study adopted the Activity-Based Costing (ABC) method for the detailed cost assessment. OPEs, as logistics entities, incur costs mainly from resource-intensive activities, known as active costs.
The ABC method systematically assigns costs to specific objects through a two-stage process. Initially, resource costs are allocated to activities using resource drivers. Subsequently, these costs are distributed to cost objects using appropriate activity drivers, which measure the cost objects’ activity consumption, providing a comprehensive and accurate cost management framework for CRE operations [
18].
2.2.1. Establishing an Activity Cost Pool for the CRE
Resources underpin the costs of operational activities. Key processes in a “station-to-station” CRE transport operation are identified and categorized into distinct Activity Centers, as outlined in
Table 4, laying the foundation for accurate resource allocation.
In
Section 4, we detail the cost categories corresponding to the operational processes, matching the resource use with expenses. The cost resource base includes the following
Table 5.
2.2.2. Cost Measurement of CREs
Costs are determined by the resource usage in each operation, with the resource drivers quantifying the intensity and frequency of consumption for an activity (
i), thereby measuring its resource use. We calculate a unit resource cost (
) by monetizing the consumed resources. In the CRE’s operational process, which includes both mandatory and optional services, the resource factor quantity (
) for an activity is zero if that service is unnecessary. These resources are detailed in
Table 6.
Based on the cost types, we divided the 28 resources into three subsets: the fixed cost () corresponds to the fixed-unit resource costs and factors: ; the operating cost () corresponds to the operating-unit resource costs and factors: N = }; the service change cost () corresponds to the service-change-unit resource costs and factors: {}.
Thus, the cost of all types is as follows:
The detailed cost measurement process is illustrated in
Appendix B. This information will be utilized in the subsequent evolutionary game analysis to support the extension of EGT and the optimization strategy for the CRE operation in the market.
3. Results
3.1. Analysis of the Evolution Strategy for OPEs
The revenue matrix of OPEs is defined as
H from
Table 3 as follows:
When OPEs choose to operate the CRE, their expected revenue is as follows:
When OPEs choose not to operate the CRE, their expected revenue is as follows:
The average revenue of OPEs is as follows:
According to the Malthusian equation, the replicator dynamic equation for OPEs to make a strategy is as follows:
Take the first-order partial derivative of
with respect to
x, as follows:
Observing Equation (9), , , and are the roots of . Based on the stability theory, when , is the ESS. The following discussion is presented.
If , then for any , ; that is, all values of x are in a steady state, and the OPE will remain stable regardless of the strategy that it carries out.
If , then the different cases are analyzed as follows:
Case 1: if , there are two situations:
When , , and is the only ESS;
When , , and is the only ESS.
In Case 1, it is observed that when the cost for the OPEs falls below the combined income of the OPEs and LGs during the subsidized operation yet surpasses the income obtained by the OPEs in operating the CRE without subsidies, the inclination of the OPEs to operate the train shifts towards non-operation as the willingness of the LGs to subsidize it declines. In this scenario, the OPEs face a lack of independent profitability and require subsidies for support;
Case 2: if , there are two situations:
When , , and is the only ESS;
When , , and is the only ESS.
In Case 2, if the aggregated transportation costs for the OPEs surpass the revenues of both the OPEs and LGs during the subsidized operation yet fall short of the earnings that the OPEs could achieve by operating the CRE without subsidies, the OPEs are more likely to abstain from the operation of the CRE as the LGs’ inclination to subsidize it grows. In this case, the OPEs possess the capability to generate profits independently, and the escalating willingness to subsidize, in turn, curtails market development;
Case 3: if or , then is constant. For the two solutions of and for Equation (9), , ; thus, is the only ESS.
In Case 3, the OPEs and LGs engage in the subsidy process with very substantial revenues or when the overall transportation costs are exceedingly high. During this phase, the OPEs opt to actively operate the CRE regardless of the LGs’ choices, which does not align with the actual situation.
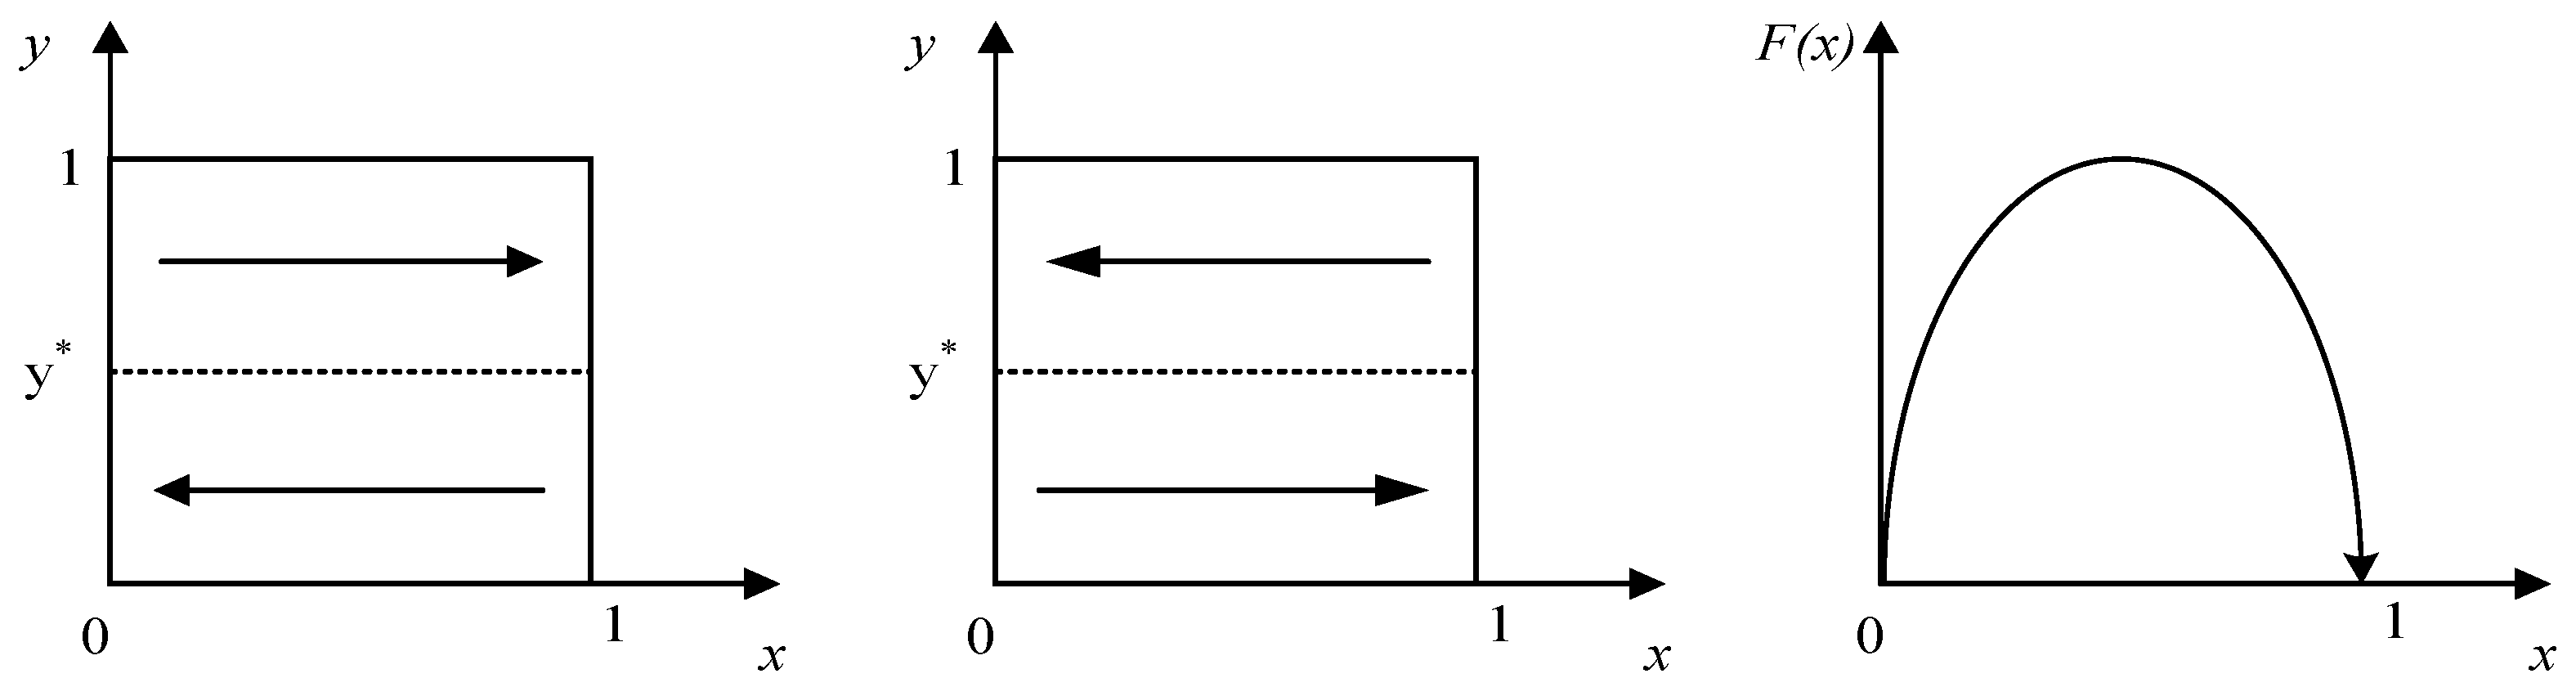
The dynamic evolution paths of the CRE operators under these three scenarios are illustrated in
Figure 5.
3.2. Analysis of the Evolutionary Strategy for LGs
Similarly, the replicator dynamic equation for LGs to make a strategy is as follows:
Take the first-order partial derivative of
with respect to
y, as follows:
Similarly, if , then for any , , , and the LG will remain stable regardless of the strategy that it carries out.
If , then the different cases are analyzed as follows:
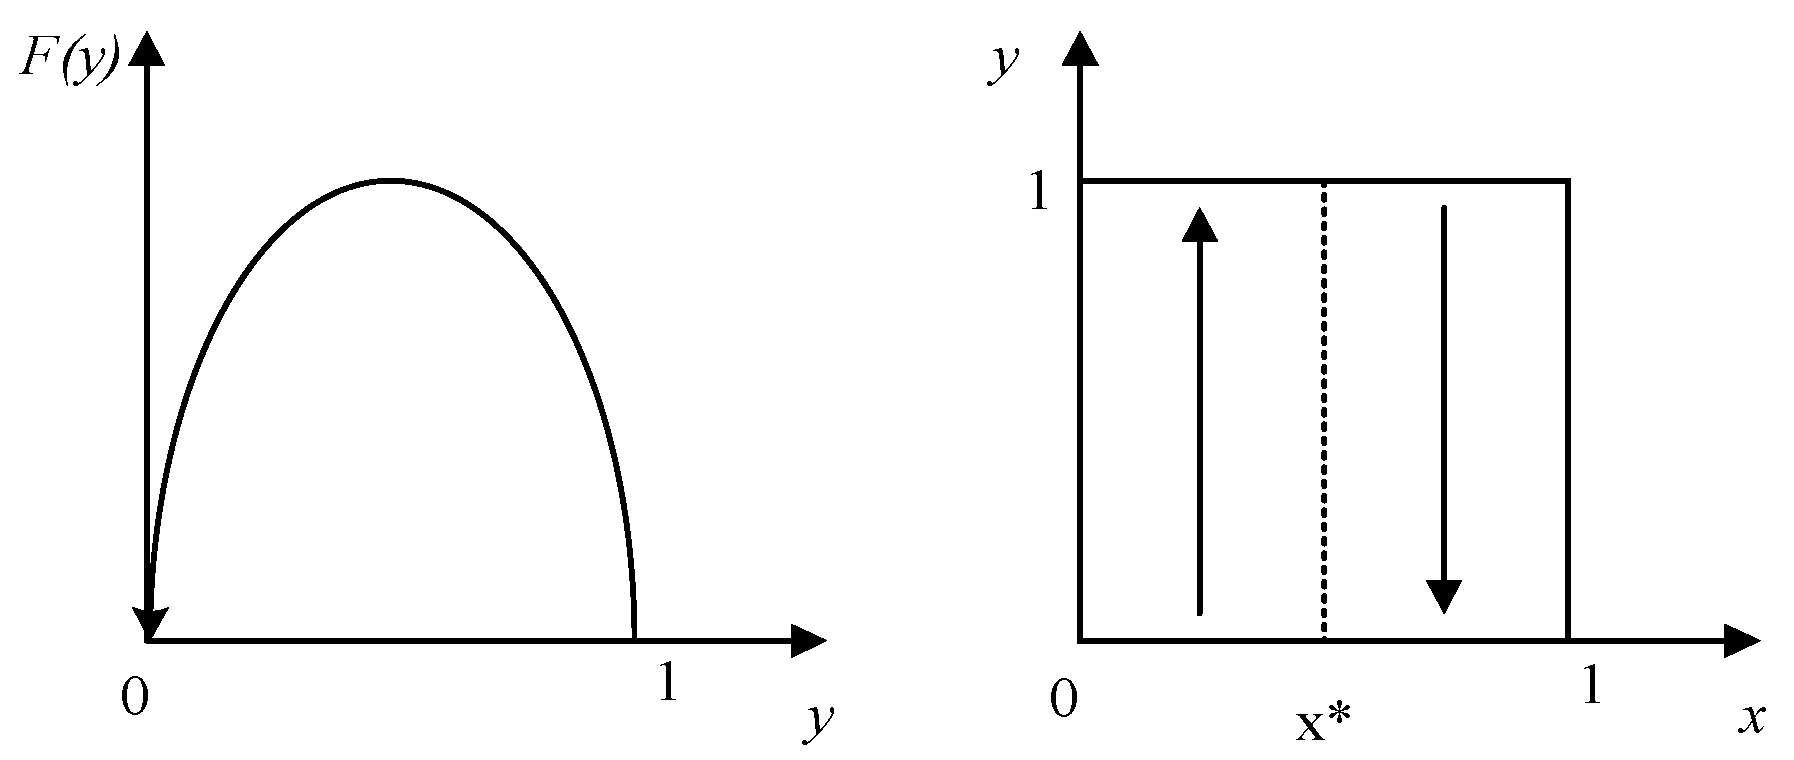
Case 4: if , that is, , then , and for the two solutions and for Equation (11), , ; then, is the only ESS, and LGs will adopt a non-subsidy strategy.
Case 4 means that if the LGs are in a state of non-profitable subsidies for a long time, they will stop subsidizing the CRE.
represents the average fines that LGs can derive through the punishment of cheating behavior. It is also the multiplication of the monitoring intensity and the quantity of the cheating punishment, denoted as the cheating-punishment intensity. In Case 4, when the penalty intensity for LG subsidies is lower than the subsidy and supervision costs, with a higher subsidy intensity and milder penalty for the subsidies, the LGs sustain elevated subsidy and supervision costs over an extended period, resulting in significant financial pressure. From a self-interest perspective, discontinuing subsidies to OPEs would be a rational decision, aligning with the actual situation;
Case 5: Since holds constant, if , that is, , then there are two situations:
When , , and is only ESS;
When , , and is only ESS.
In Case 5, if the total expenditure on subsidies and supervision costs by LGs is lower than the cheating-punishment intensity, specifically when the penalty is notably severe, the government’s subsidy strategy aligns with the probability of OPEs operating the CRE. Consequently, the firms’ strategy shifts from subsidization to no subsidization over time.
Figure 6 illustrates the evolutionary trajectory of the LGs in the cities where the CRE operates under the two cases.
3.3. Analysis of the Evolution Game between LGs and OPEs
The evolutionary game process for Case 3 of OPEs is not examined in this paper, as it lacks correspondence to reality. Cases 1 and 2 represent OPEs with varying subsidy reliance levels, corresponding to asset-light and asset-heavy entities, as per
Table 7. Cases 4 and 5 in the LG strategy evolution differ by the severity of penalties for subsidy fraud, with Case 4 featuring a lenient government and Case 5 featuring a stringent one.
Deriving from Equations (9) and (11), a system of two-dimensional replicated dynamic equations is formulated, as presented in Equation (13):
Four replicated dynamic systems, representing diverse evolutionary scenarios, emerge by combining the two cases for both OPEs and LGs. The associated scenarios and equilibrium conditions for each system are detailed in
Table 8.
Following Friedman’s theory, the stability of equilibrium points in group dynamics, as described by differential equations, is determined through Jacobian matrix local stability analysis. We extend this analysis to the equilibrium point stability assessment of the four systems.
The Jacobian matrix
J is obtained as follows:
The equilibrium points for the four systems are ,,,, and , where and .
As an illustrative example,
Table 9 displays the stability analysis for each equilibrium point of System (I), according to Lyapunov’s stability theory.
Consequently, in System (I), representing asset-light OPEs and LGs with weak penalties, both parties will eventually lean towards adopting the no-operation–no-subsidization strategy. This tendency is not favorable for the development of the CRE market. The stability analysis for the equilibrium points of Systems (II), (III), and (IV) is presented in
Table 10.
4. Discussion
In order to verify the model evolution, we chose four representative operational market instances in CRE cities corresponding to the four systems in the model, and the CRE market evolutions in other cities were extrapolated by analogy according to the different evolution conditions. The key parameters, including the subsidy amounts, transportation costs, and monitoring intensities, were examined and measured in a one-month cycle. The evolutionary game simulation was conducted using MATLAB 2021b.
4.1. Data and Parameters
4.1.1. Evolutionary-Instance Selection
We evaluated CRE markets in each city based on the asset levels of OPEs and the penalty intensity for subsidy cheating by LGs. The asset levels were determined by comparing the registered capital of typical OPEs, classifying them as higher or lower. For LGs, the penalty intensity (
γF), crucial in
Section 3.2, was measured by examining the subsidy amount and regular transport volume. Additionally, the LGs’ monitoring intensities were assessed using a four-indicator system, including subsidy management documents issued post-2020, public announcements on implementation, and other relevant news. The indicator values are analyzed in
Appendix A. The coefficient-of-variation method was applied to derive the weights for these indicators, quantifying the LGs’ monitoring intensities in Xiamen, Wuxi, Changsha, and Zhengzhou, as detailed in
Table 11.
Finally, the penalty intensities for cheating (
γF) in the context of CRE operations were assessed for the four cities. We found that there are quantum and multiplier differences between the penalty intensities in the different cities. For example, the penalty intensity in Wuxi is about twice as high as those in Xiamen and Changsha; the penalty intensity in Zhengzhou is about four–five times as high as those in Xiamen and Changsha. The resulting synthesis of the relative penalty intensity and asset level for each city is shown in
Table 12.
Consequently, four instances, representing the CRE in Xiamen, Wuxi, Changsha, and Zhengzhou, were selected to align with the distinct evolutionary systems outlined in
Section 3.3 for the CRE operation market. Subsequently, individual evolutionary simulations were initiated for each instance.
4.1.2. Activity-Based Costing Method to Measure Costs
We measured the costs for each OPE in the four evolutionary instances, focusing on the rail transport segments for the lines from Zhengzhou, Wuxi, Changsha, and Xiamen to Malaszewicze, using the OSJD’s “Unified Transit Tariff Regulations” tariff mileage table. The domestic railroad mileages were assumed equal for these cities, excluding intermodal collection and evacuation. The cost distribution to Malaszewicze is shown in
Figure 7. The detailed Activity-Based Costing (ABC) measurements are presented in
Appendix B, with the results summarized in
Table 13.
4.1.3. Other Data for Instances
We gathered pertinent operational data through extensive research. To ensure that the initial strategies in the government–enterprise operation subsidy game did not unduly influence the simulation, both sides’ strategy selection probabilities were initialized as
x = 0.50,
y = 0.50. In summary, the simulation data for the cases of four cities operating the CRE are presented in
Table 14.
4.2. Model Validation
Initially, the evolutionary game simulations corresponding to the four evolving systems were subjected to verification.
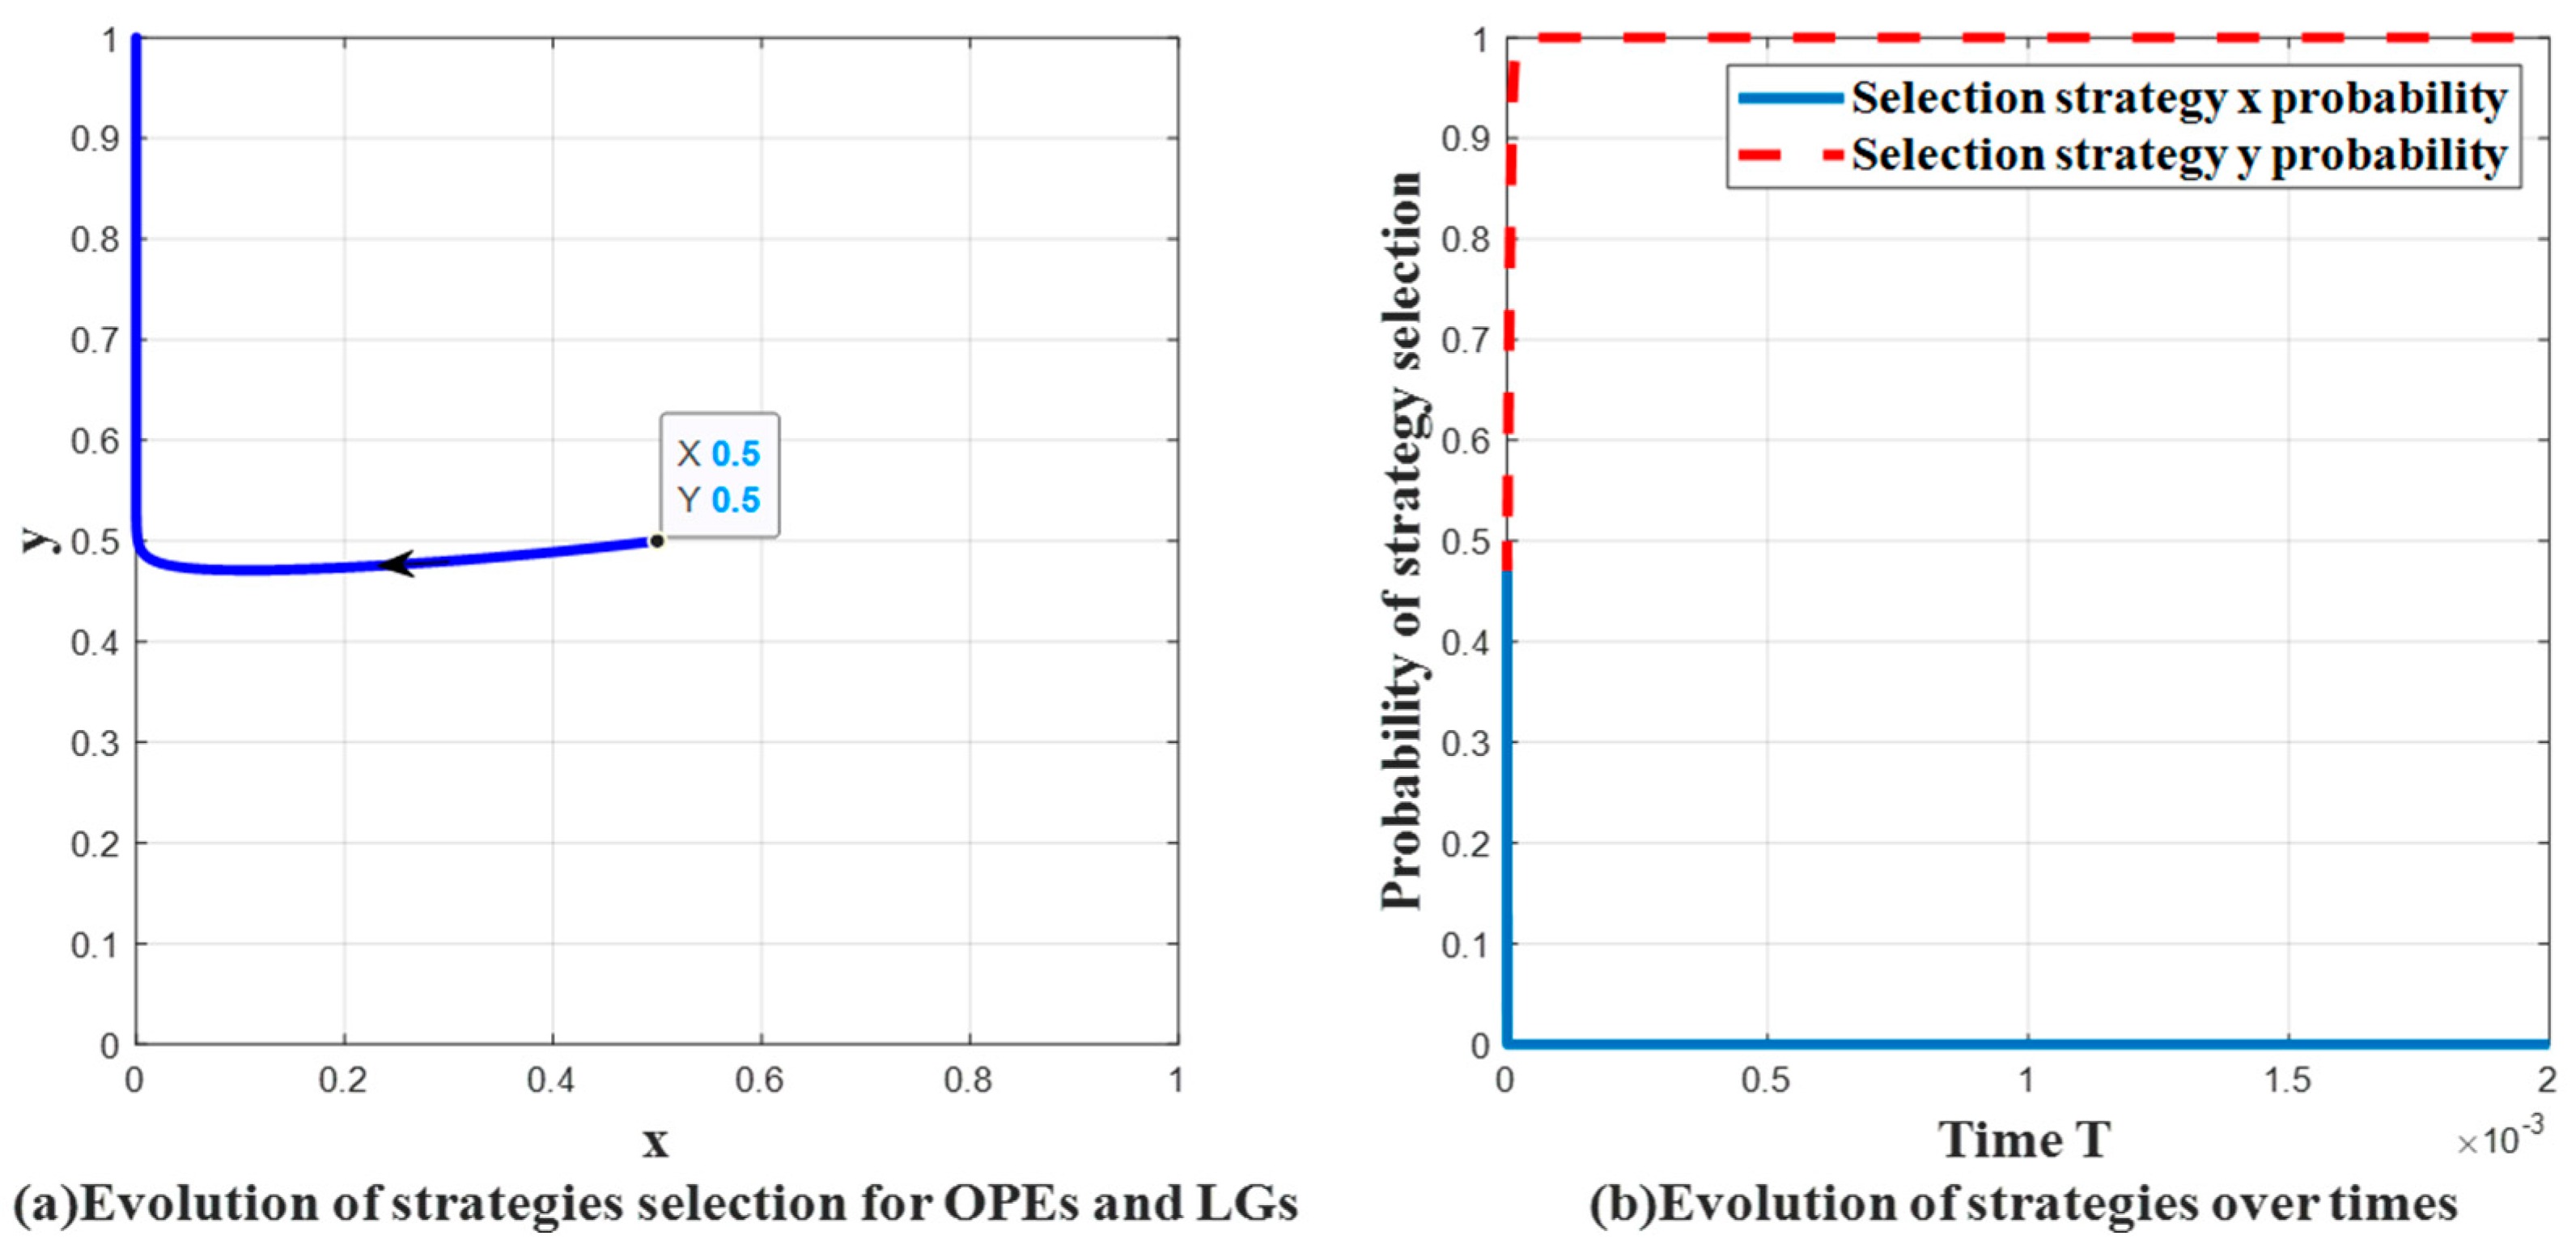
(1) Verification of System (I) for CRE (Xiamen) Operation Subsidy Instance with Evolutionary Stability Points at (0, 0).
As illustrated in
Figure 8, the evolutionary trajectory of System (I) swiftly progresses from origin
to
, with the LGs adapting their strategies at a pace notably faster than that of the OPEs. The strategies of the OPEs and LGs rapidly converge to a state of no subsidy and no operation. Typically observed in coastal port cities, these markets feature alternative transportation products to the CRE, well-established ocean transportation, and high levels of customer loyalty to maritime services. In such cities, LGs often lack adequate supervision and support for CRE development, and local OPEs tend to diversify their operations by offering various logistics products alongside the CRE. Consequently, this instance leads to a no-subsidy–no operation market state.
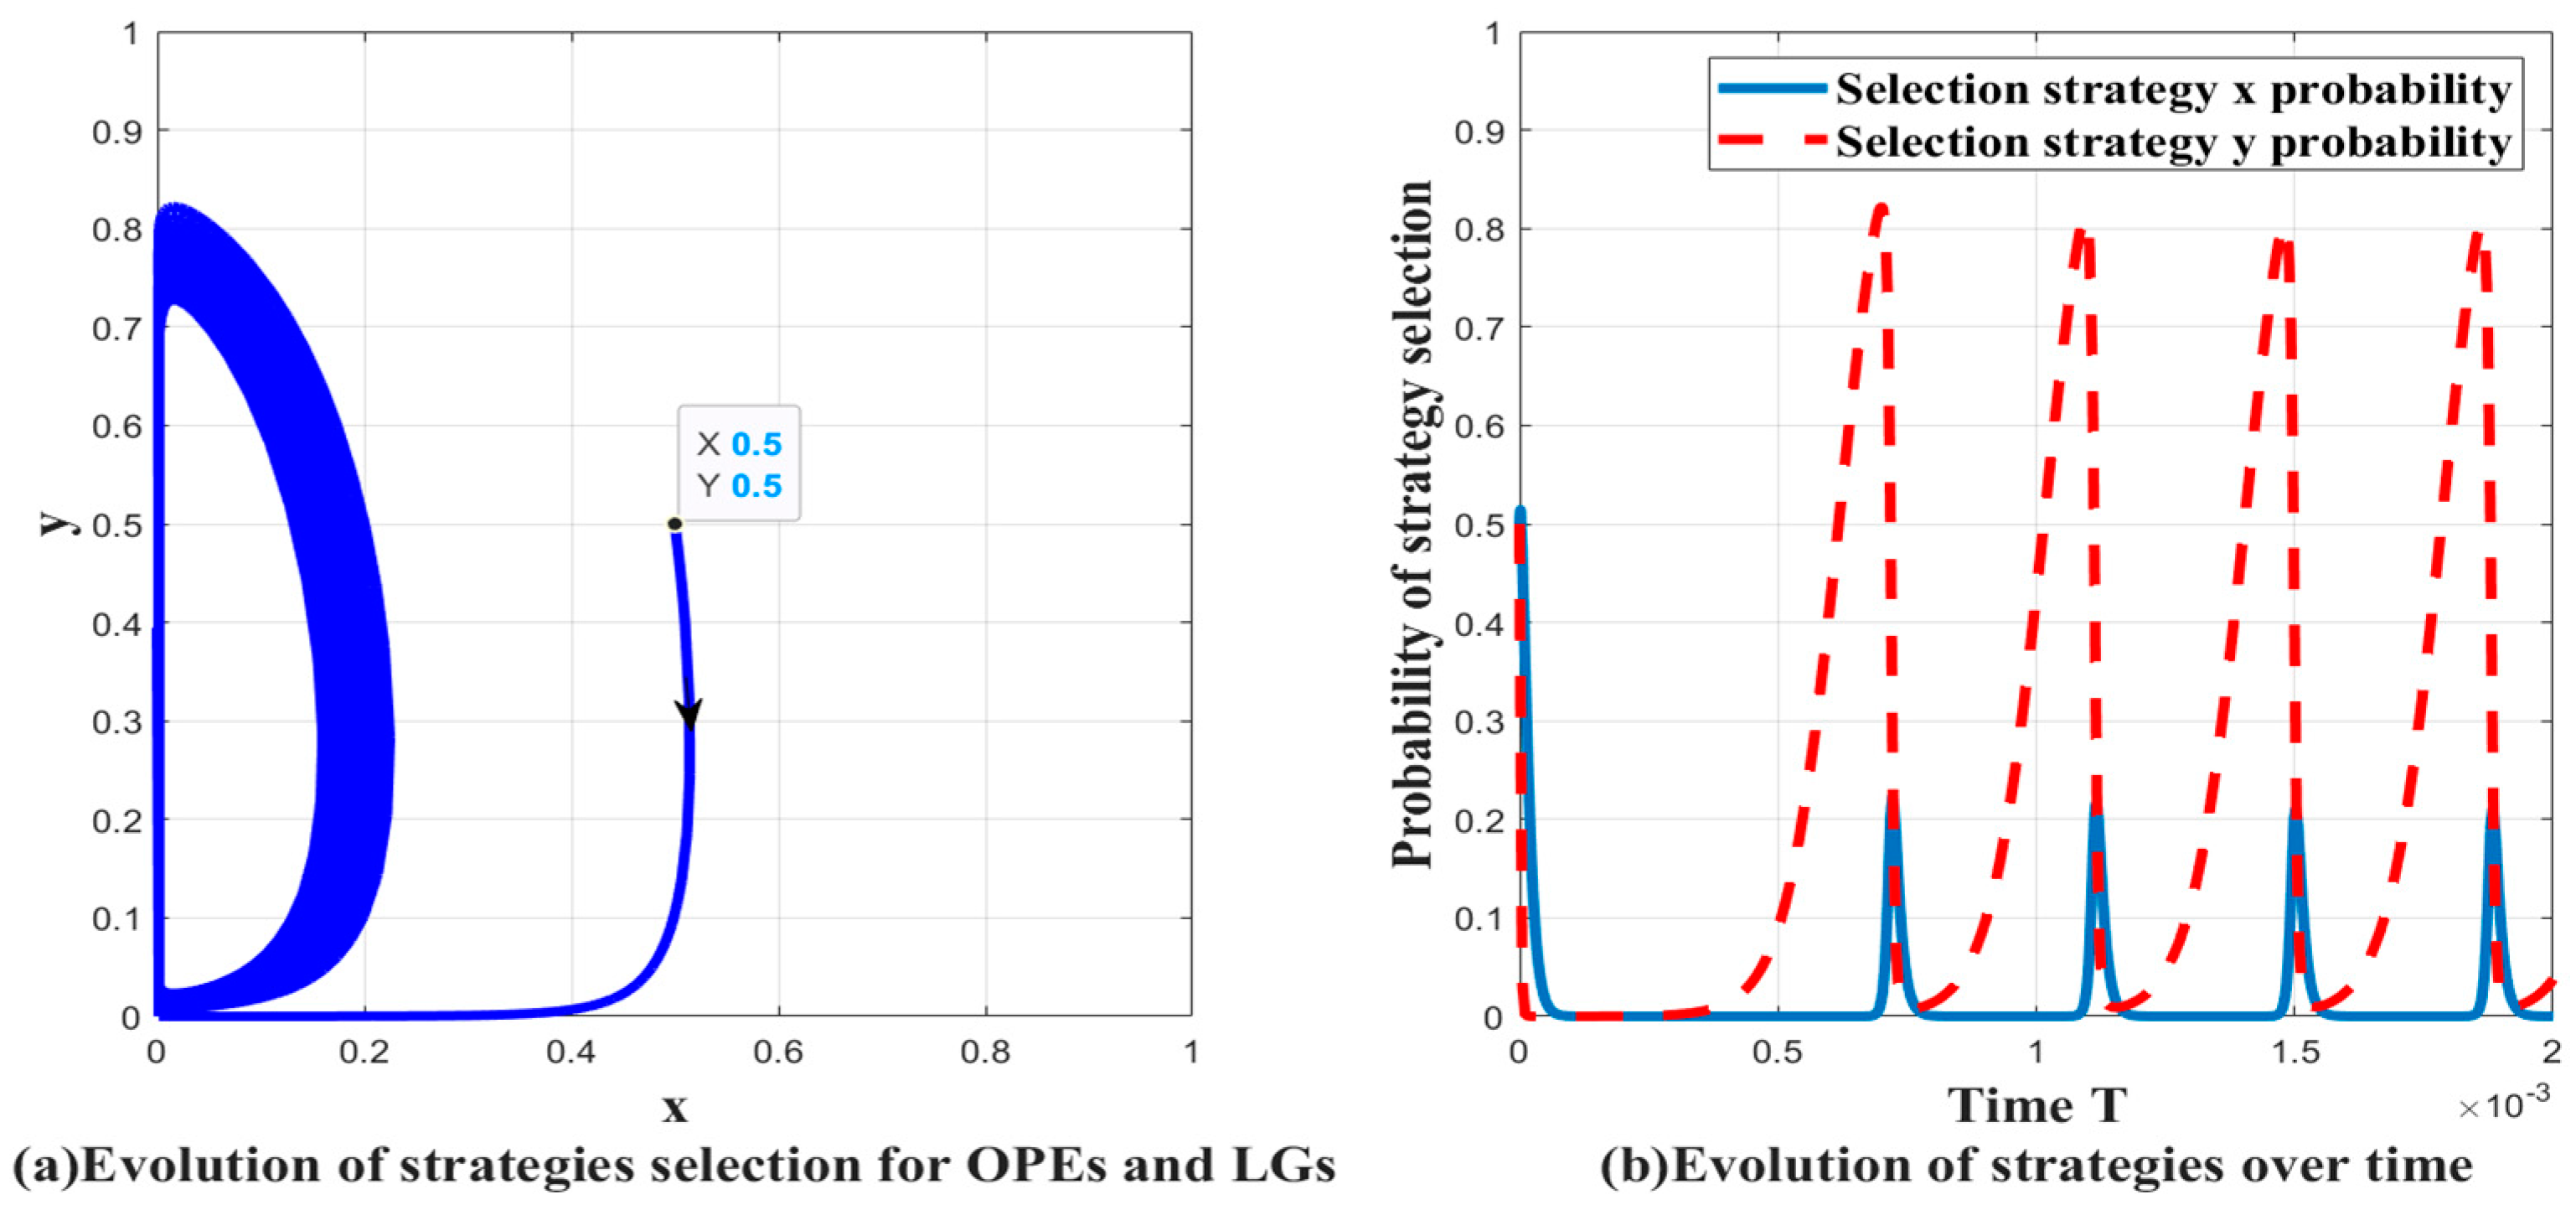
(2) Verification of System (II) for CRE (Wuxi) Operation Subsidy Instance with No Evolutionary Stable Point.
As depicted in
Figure 9, the evolutionary trajectory of System (II) forms a closed-loop pattern around a central point, indicating the absence of an asymptotic evolutionarily stable strategy between LGs and OPEs. OPEs incur significant service costs for procurement due to their limited organizational and operational capabilities. The CRE (Wuxi) is in its initial developmental stage, with an unstable cargo volume and a high reliance on LG financial support. Consequently,
Figure 9b illustrates that when the LG willingness to subsidize is low, OPEs demonstrate a correspondingly low inclination to operate the CRE, given their financial constraints. As
y increases, the probability (
x) of OPEs operating the CRE proportionally rises. The strategies of both market participants undergo constant fluctuations, showing no stable strategy.
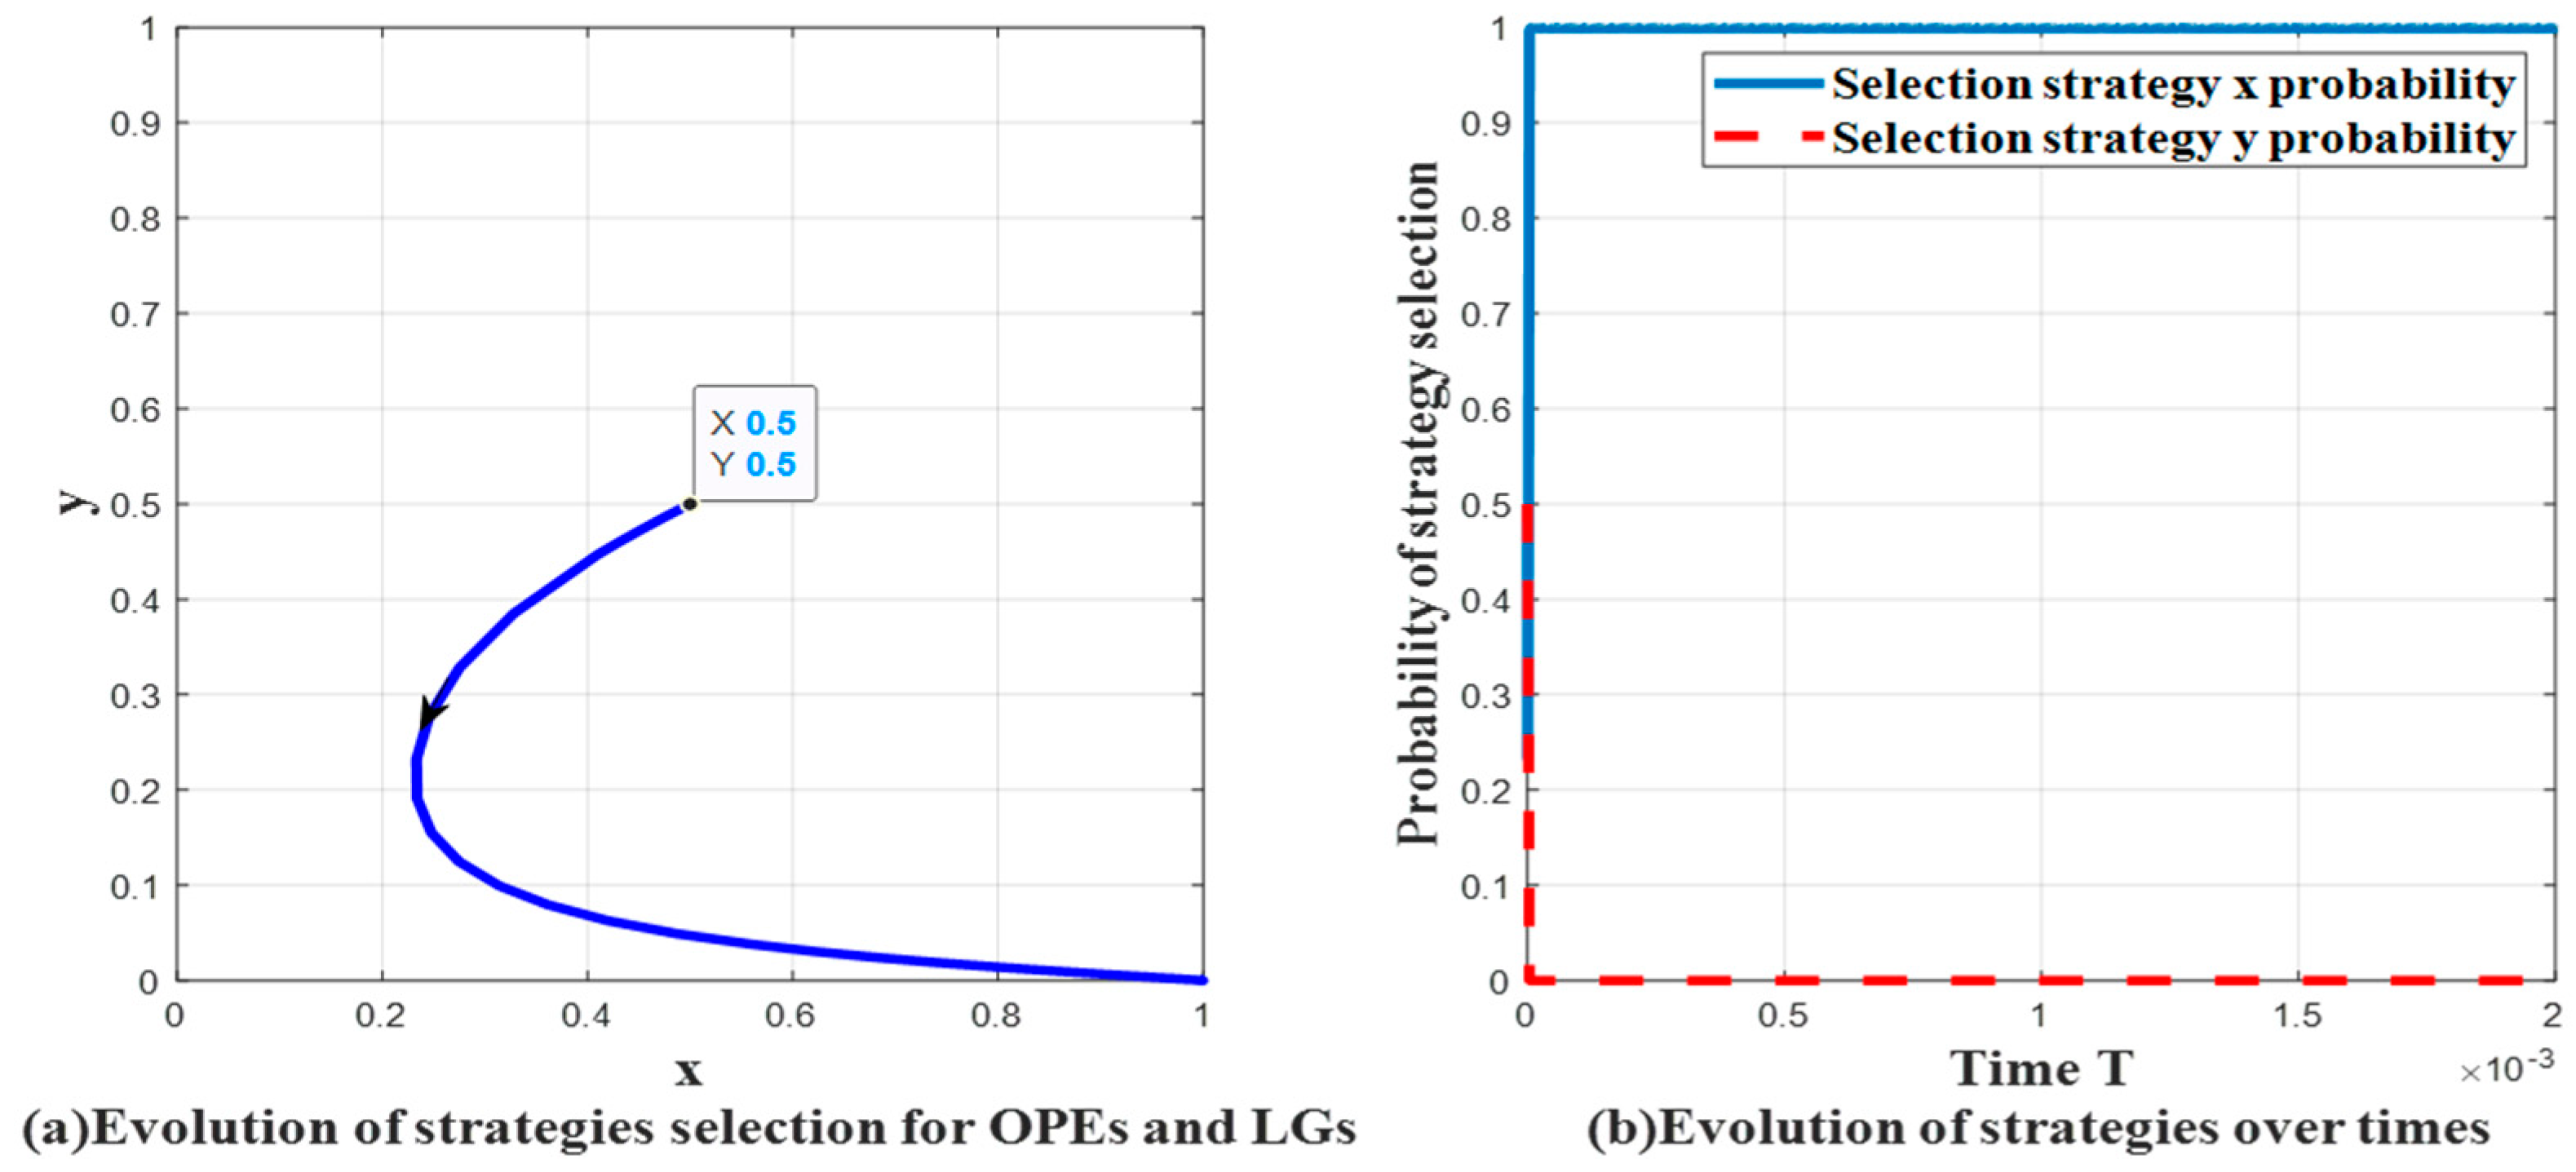
(3) Verification of System (III) for CRE (Changsha) Operation Subsidy Instance with Evolutionary Stability Point at (1, 0).
As depicted in
Figure 10, the evolutionary trajectory of System (III) rapidly progresses from the origin
to
, with the strategy selection times of the OPEs and LGs being nearly identical. In this high-asset, weak-penalty CRE operation market, the OPEs boast substantial fixed assets, enabling them to independently handle critical aspects of CRE operations, including cargo warehousing and source organization. The LGs, recognizing the self-sufficiency of the OPEs and the market orientation of liner operations, provide minimal support and withdraw subsidies after offering slight assistance. This strategy ensures the marketization of operations and facilitates the evolution towards a stable state, aligning with the actual operational scenario of the CRE in Changsha.
(4) Verification of System (IV) for CRE (Zhengzhou) Operation Subsidy Instance with Evolutionary Stability Points at (1, 0) or (0, 1).
As illustrated in
Figure 11, the evolutionary trajectory of System (IV) rapidly progresses from the origin
to
, with the strategy evolution of the OPEs outpacing that of the LGs. In the high-asset and strong-penalty operation market of the CRE, characterized by substantial subsidies and rigorous regulations, the level of market liberalization is relatively low. Considering the self-interests of enterprises, OPEs may opt not to operate the CRE to preserve operational autonomy.
4.3. Evolutionary Game Strategy Sensitivity Analysis
In this section, we analyze the sensitivity of each parameter from the evolution of the game system to the stable strategy.
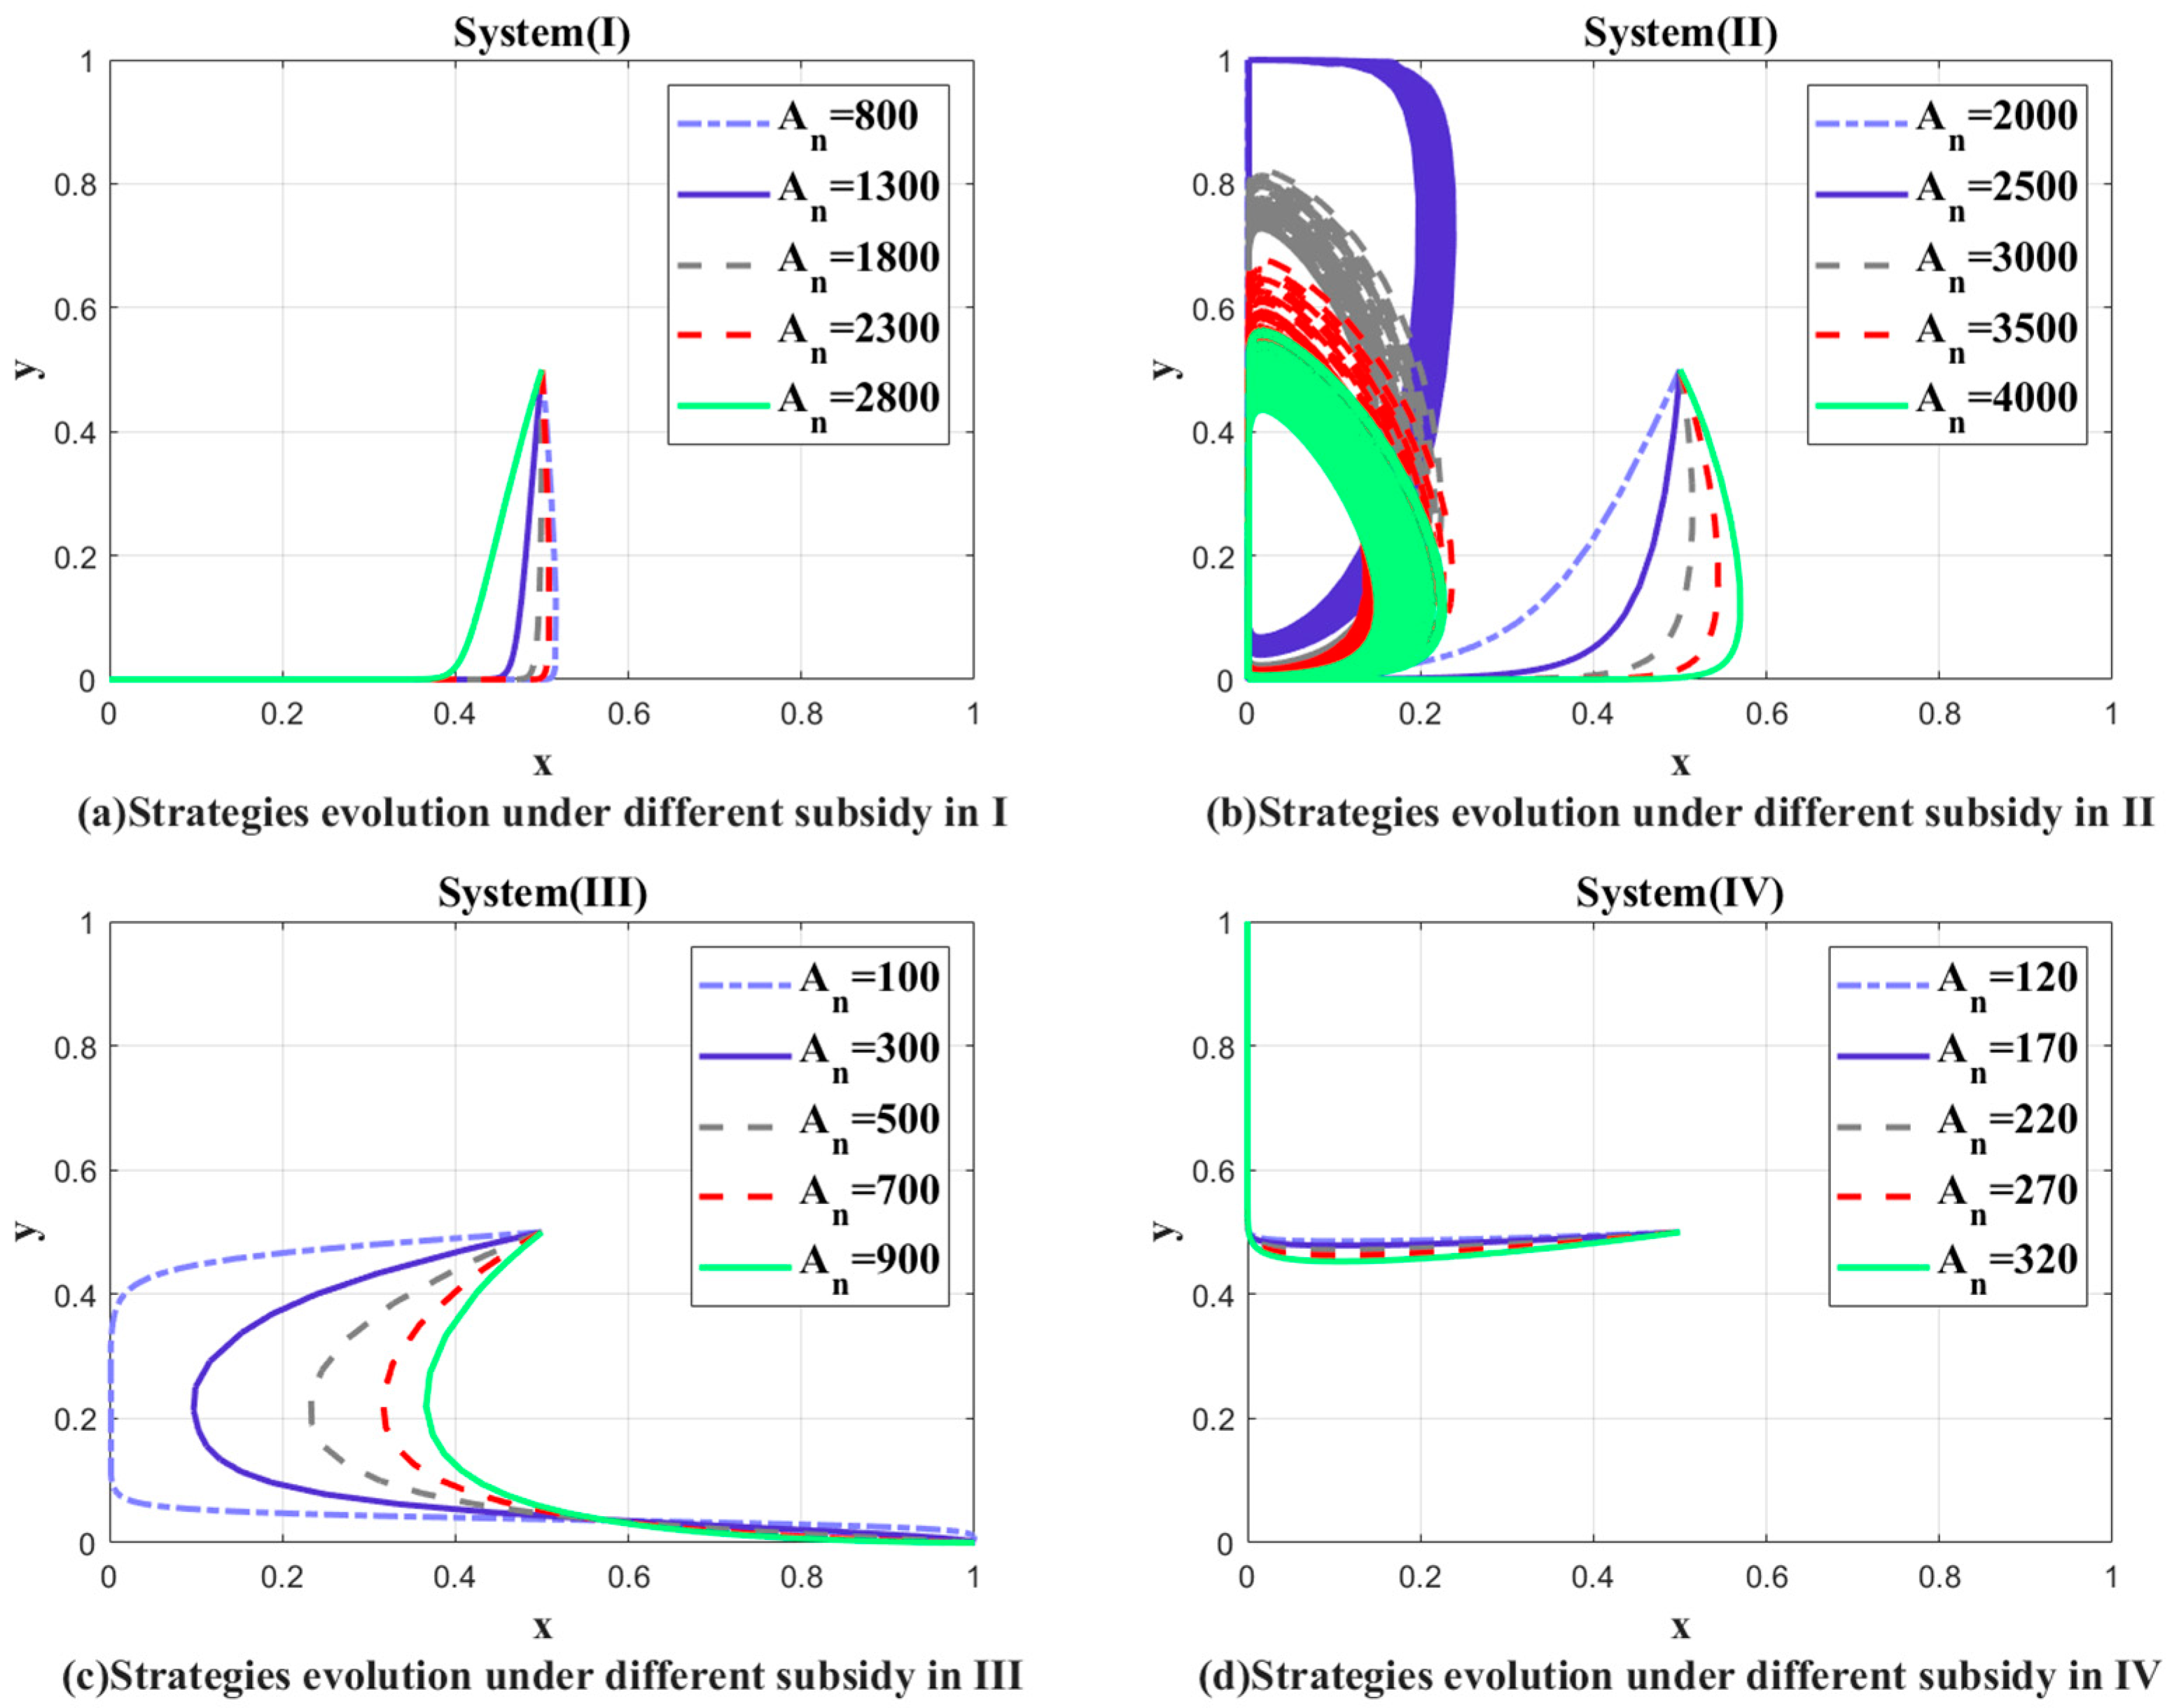
4.3.1. Subsidy Amount ()
As illustrated in
Figure 12, System (I) demonstrates that a subsidy reduction prompts OPEs to cease CRE operations more rapidly. Simultaneously, low subsidies accelerate the system’s evolution toward the stability point (0, 0), indicating a scenario in which neither participant supports the continued operation of the CRE.
In the case of System (II), a diminished subsidy tilts the system evolution strategy towards the non-operation of the liner, coupled with LGs subsidizing the CRE. However, regardless of the subsidy amount variations, System (II) lacks an evolutionary stability point, leaving both players in a continuous changing-strategy state.
System (III) experiences a slowdown in the OPEs’ speed to opt for CRE operations with a reduced subsidy. Nonetheless, a low subsidy amount can still drive the entire system towards an evolutionary stable state in which “LGs do not need to subsidize, and OPEs actively operate the CRE”.
For System (IV), subsidy fluctuations have minimal impact on the system’s evolution speed. An increased subsidy can marginally slow down the strategic decision making of enterprises hesitant to operate liner trains. This suggests that in a stringent penalty environment with robust government monitoring, the operational autonomy of OPEs is limited, and increased subsidies cannot alter OPEs’ inclination to operate liner trains.
In summary, asset-light OPEs exhibit a greater dependence on higher LG subsidies to regularize CRE operations, while heavy-asset OPEs can autonomously reach a stable state even with reduced subsidies.
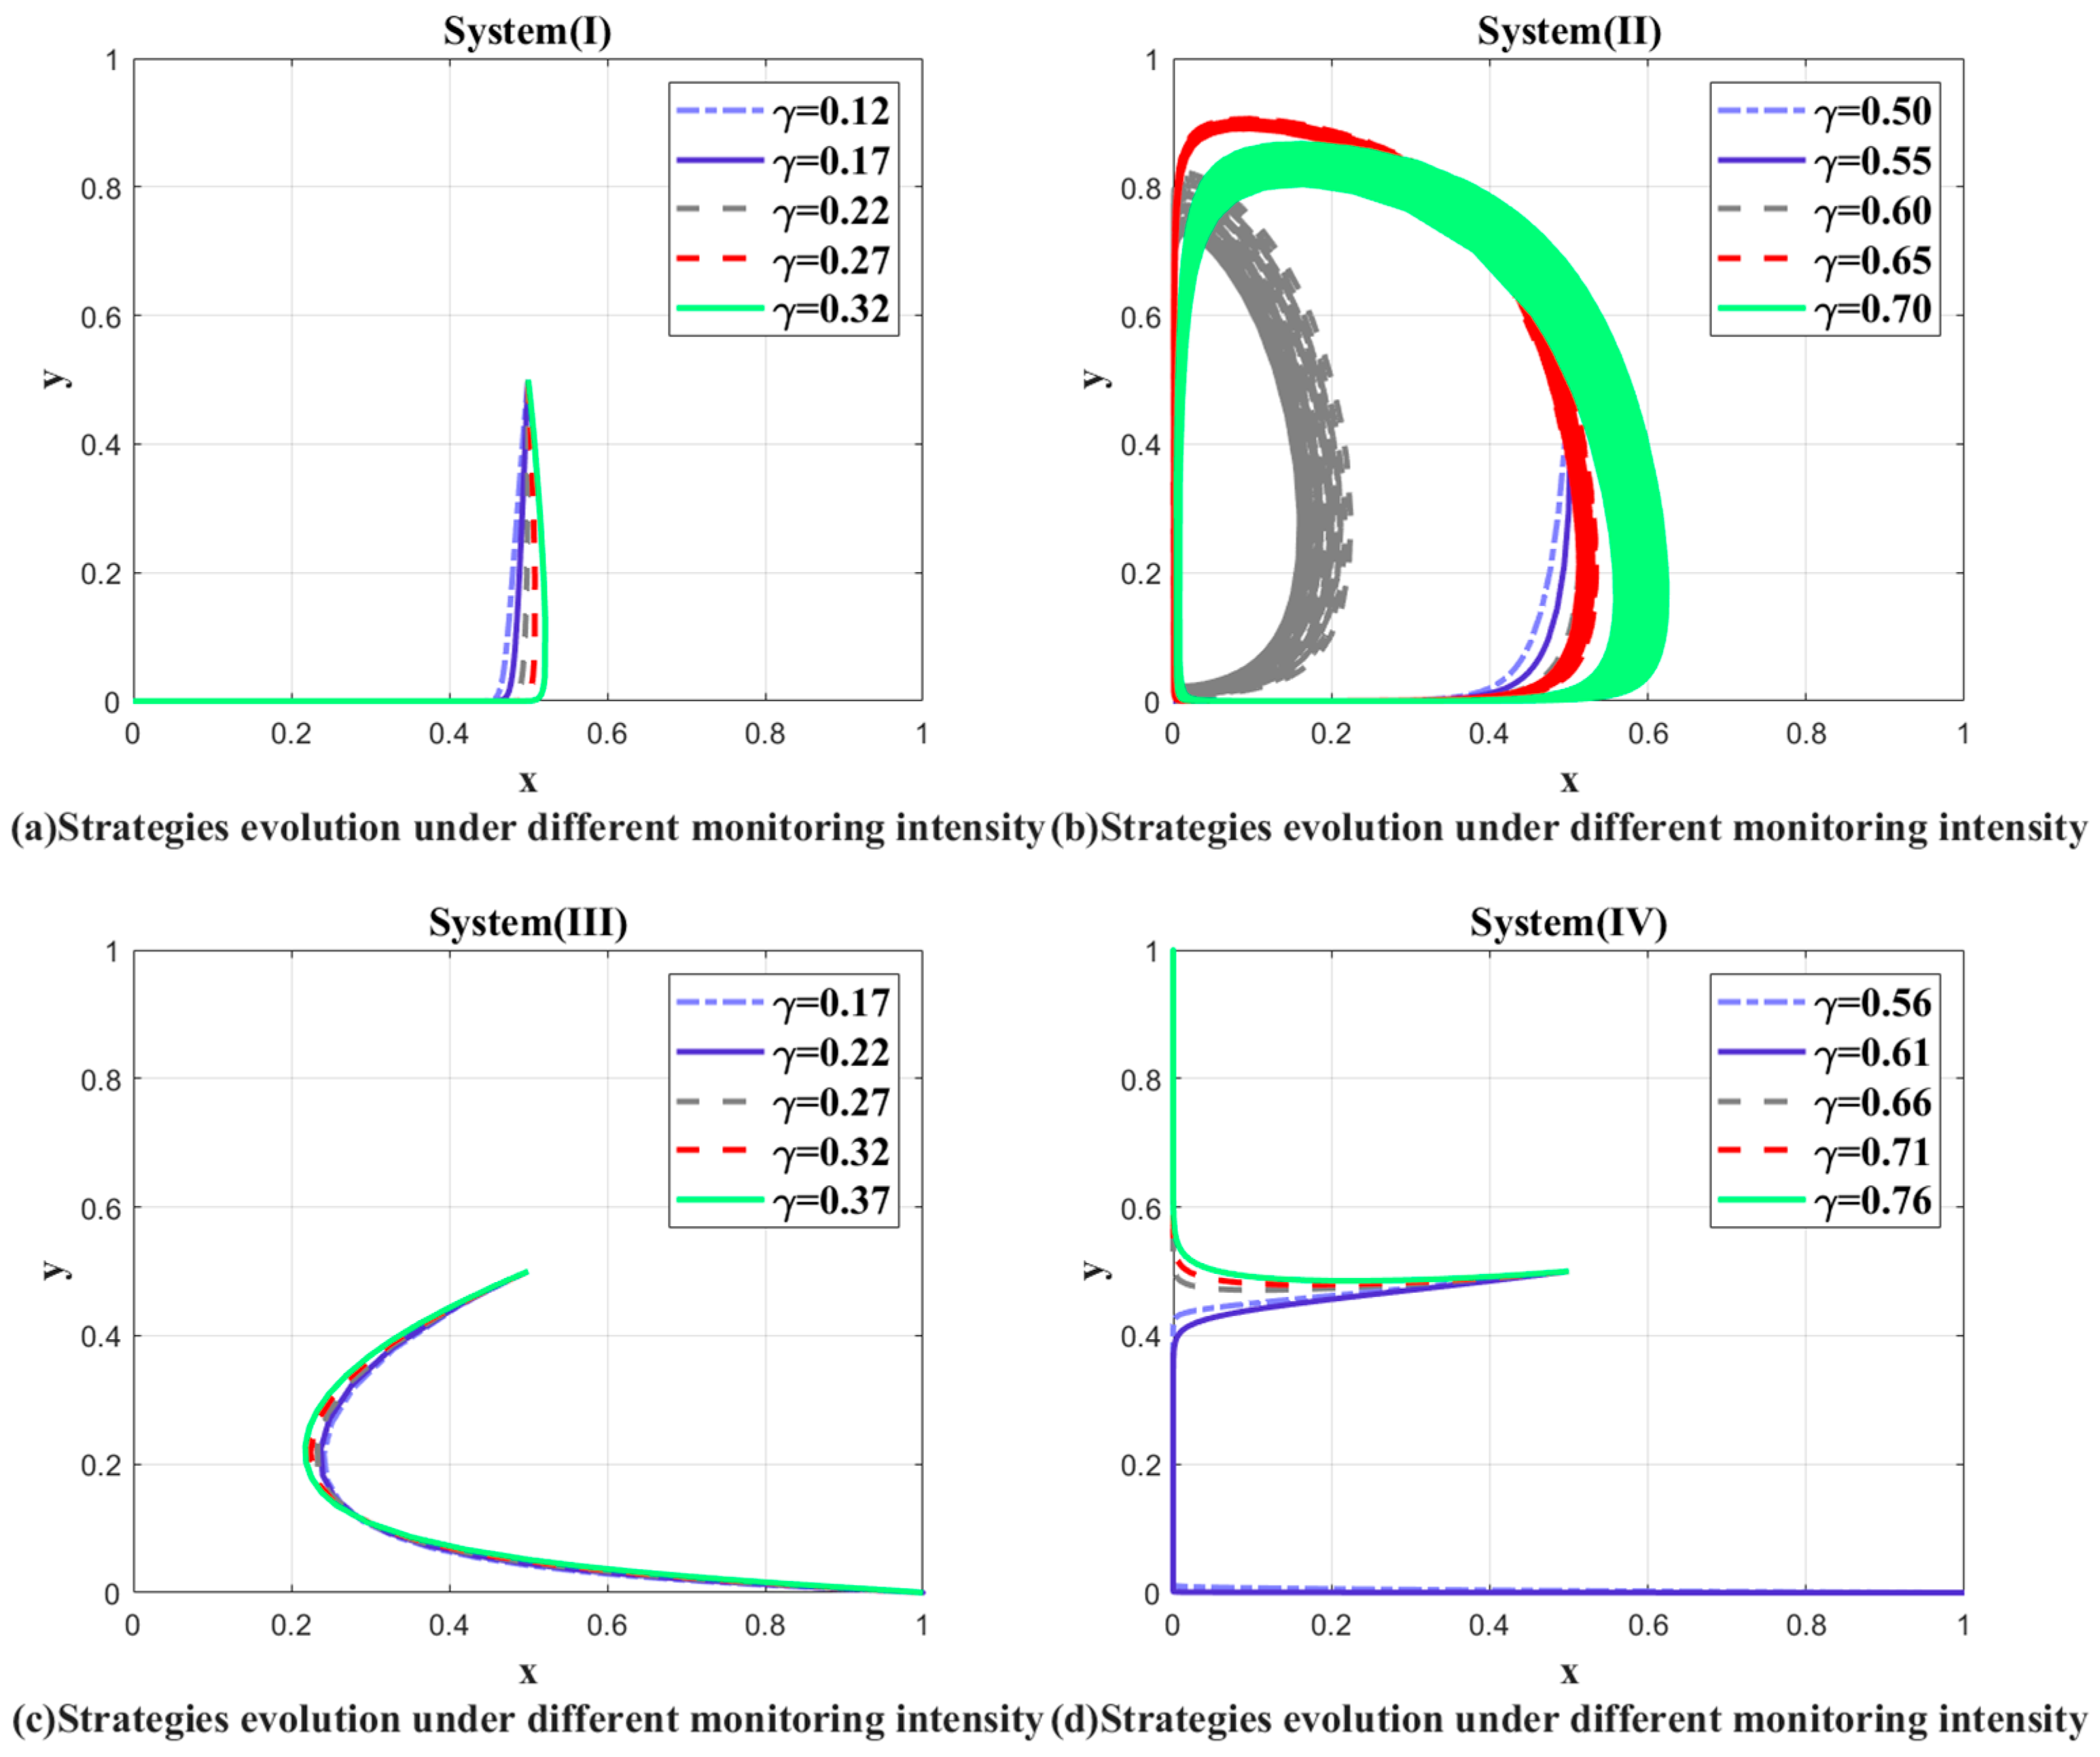
4.3.2. Monitoring Intensity ()
As depicted in
Figure 13, in the context of System (I), a reduction in LG supervision accelerates the system evolution to some extent. The strategies of both OPEs and LGs evolve towards non-operation and non-subsidization more rapidly. This observation suggests that appropriately enhancing LG supervision will foster a greater willingness among OPEs to engage in CRE operations.
For System (II), when and , the system can evolve to a stable state at (0, 0). This indicates that, during the initial developmental phase, OPEs still require policy guidance and support; otherwise, they lack the capability to operate the CRE. Moreover, when OPEs rely on subsidies, the high monitoring intensity leads to an unstable system.
Concerning System (III), the system’s strategy evolution speed is marginally higher under low supervision than it is under high supervision. This suggests that when OPEs depend less on subsidies, a reduction in government supervision encourages greater motivation among OPEs to operate independently.
For System (IV), when and , the stability point of the system evolution changes from (0, 1) to (1, 0). This indicates that high-asset OPEs, owing to their autonomous profit-making abilities, swiftly transition into the active operation of the CRE with a slight reduction in supervision.
In summary, low-asset OPEs with high subsidy dependence still require the government to maintain a certain degree of supervision over the subsidized operations to facilitate the formation and development of market order. In contrast, high-asset OPEs with low subsidy dependence already possess strong autonomous operational abilities, necessitating a reduction in the supervision intensity by LGs to promote market liberalization.
In the preceding section, the indicators “whether the government has issued specialized documents on subsidy management since 2020” and “the number of public announcements on implementation status” exert the greatest impact on the monitoring intensity. LGs need to pay more attention to the regulation of subsidy management documents for the monitoring intensity. The adjustment of LGs to monitoring intensity should prioritize the real-time updating and abolition of subsidy management documents.
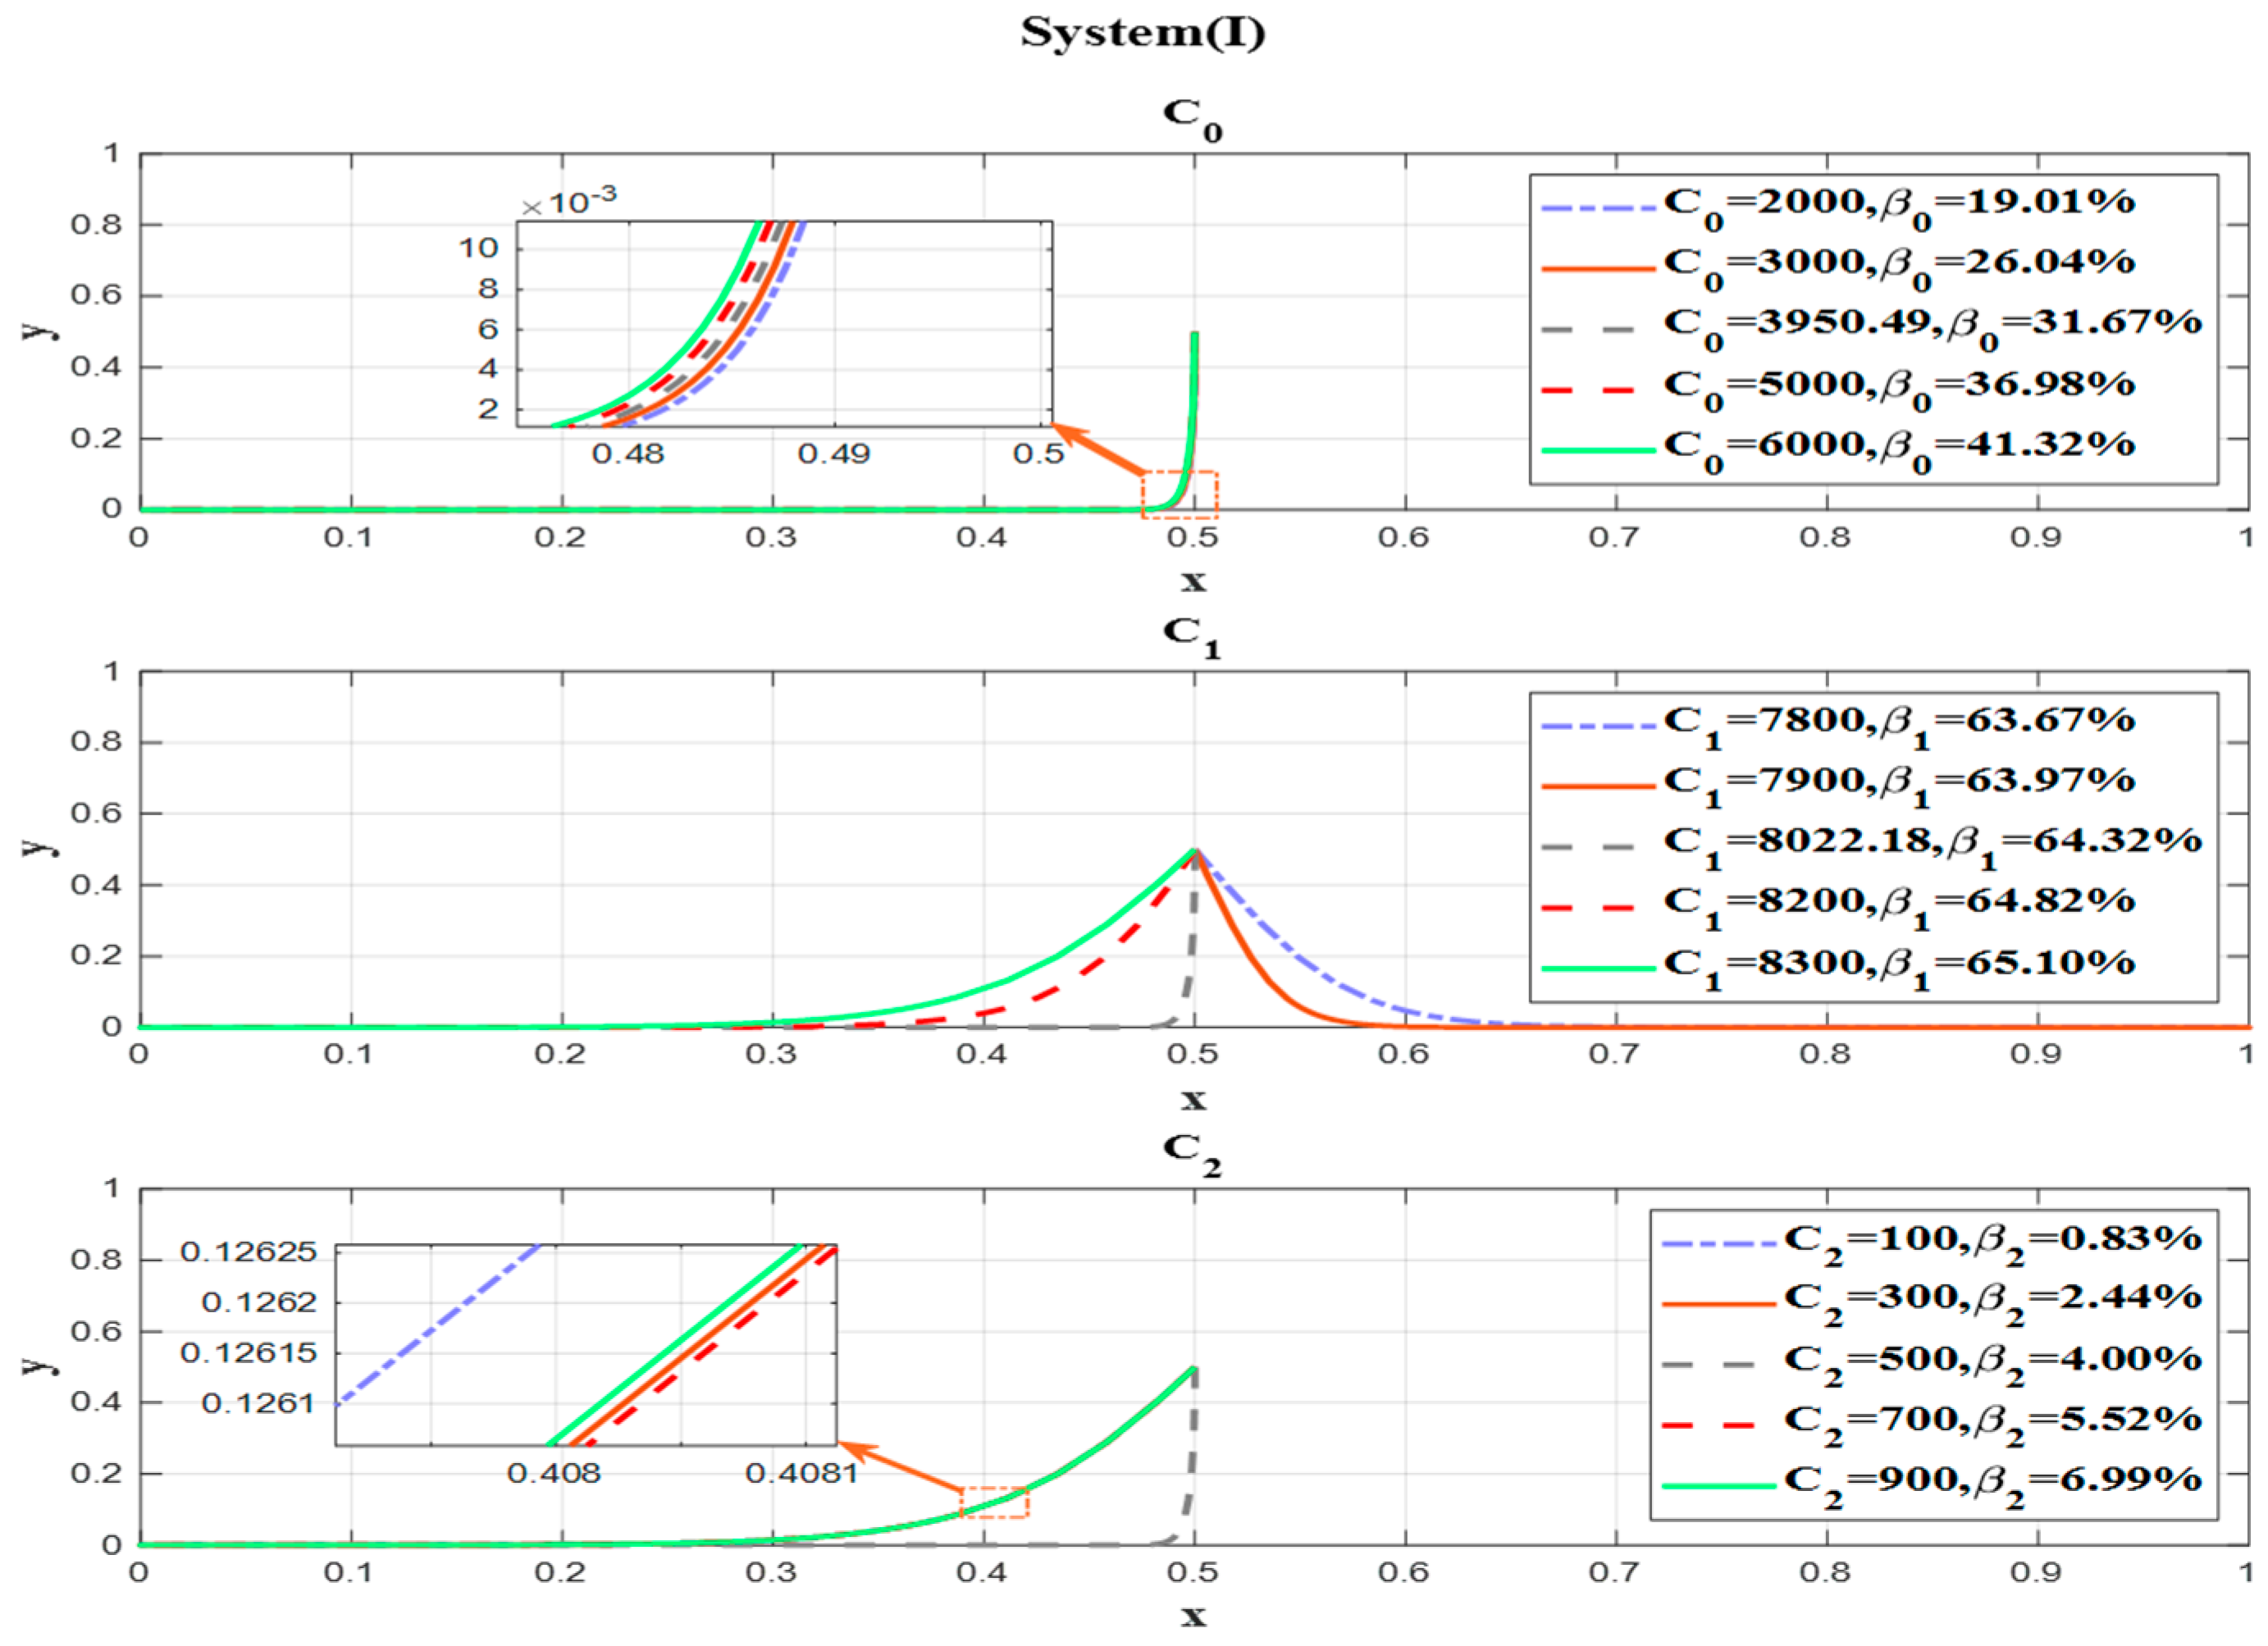
4.3.3. The Costs
To illustrate the effect of alterations in the cost structure on the evolutionary game process, we modified one category of costs while holding the others constant and determined the proportion of the total cost represented by that specific cost, denoted as
. The specific changes in the evolutionary state are depicted in
Figure 14,
Figure 15,
Figure 16 and
Figure 17.
In the context of System (I), where both OPEs and LGs exhibit light assets and light penalties, the operational cost constitutes over 50% of the total cost, with the service change cost having the smallest impact. The fixed cost and service change cost exert a minimal influence on the evolutionary process. However, lower fixed costs expedite LGs’ selection of the unsubsidized strategy. When the operating cost equals or exceeds 8022.18 USD/TEU, OPEs are reluctant to operate. A higher operating cost correlates with a greater proportion of transportation costs, prompting OPEs to opt for non-operation more swiftly to safeguard their interests.
Conversely, when the operating cost drops below 7900.00 USD/TEU, OPEs shift from reluctance to active operation. For instance, the calculated cost for the CRE (Xiamen) in System (I), encompassing yard warehouse fees, loading and unloading equipment charges, and container utilization fees as purchased service resources, is notably high at 594.2 USD/TEU. This underscores that insufficient government supervision and support from LGs, coupled with OPEs’ inherent disinclination to operate the CRE, necessitate a strategic focus on optimizing critical aspects such as cargo warehousing, loading and unloading processes, and container flow. By reducing OPEs’ operational costs for the CRE, the motivation to engage in liner operations can be heightened in System (I).
In the context of System (II), encompassing OPEs and LGs with light assets and heavy penalties, the operational expenses constitute over 50% of the total costs. Elevated operating costs lead to unpredictable fluctuations in LGs’ inclination to subsidize the CRE, creating substantial oscillations between the decisions of non-subsidization and subsidization. The LGs’ subsidy policy becomes more dynamic with the frequent traverses between these two choices. A reduction in operational costs tends to sway LGs towards a non-subsidization stance. Additionally, a lower operational cost correlates with a more concentrated and cohesive evolution process, depicting a higher level of alignment in strategic choices during the evolutionary game. Thus, mitigating operational costs contributes to steering the operational market towards a more stable trajectory.
Within the framework of System (III), involving OPEs and LGs with heavy assets and light penalties, OPEs opt not to operate the CRE when the fixed costs surpass or fall below 180,631.31 USD/month. The fixed costs for the CRE (Changsha), as established in the preceding cost measurement process, encompass wages for warehousing staff, the depreciation costs of storage yards and warehouses, wages for loading and unloading staff, and depreciation costs for the maintenance of loading and unloading equipment and containers. An escalation in fixed costs implies that OPEs can bypass procuring warehousing services, loading and unloading services, and container usage, leading to a reduction in their operating costs and proportional shares. This reduction in both the amount and proportion of operating costs prompts OPEs and LGs to transition toward the active operation of the CRE, expediting LGs’ withdrawal from subsidies. In the short term, the influence of service change costs on the game’s evolution is negligible.
Within the context of System (IV), involving OPEs and LGs with heavy assets and penalties, the proportion of operating costs has already descended below 5%. Although elevated operating costs may induce LGs to actively subsidize the CRE to some extent, a market characterized by stringent regulatory penalties may dissuade them from operating the CRE, considering their self-interests. Moreover, augmenting fixed costs and service change costs may heighten the likelihood that LGs will subsidize the liner while decelerating the pace at which OPEs opt not to operate the liner.
5. Conclusions
This study sought to explore the evolutionary dynamics of subsidy–operation strategies within distinct developmental stages of various China Railway Express (CRE) operation markets. The primary objective was to derive the optimal decisions for both operating-platform enterprises (OPEs) and local governments (LGs) within their specific developmental contexts. Our methodology involved constructing an evolutionary game system encompassing OPEs and LGs. We integrated the Activity-Based Costing method with evolutionary game theory to scrutinize stabilizing strategies across four scenarios representing diverse OPE and LG types. Through the refined cost measurement of the CRE, including sensitivity analysis, we investigated the evolutionary impacts of crucial factors such as the subsidy amount, monitoring intensity, and cost structure on distinct operating markets. Corresponding to the research questions posed in Part I, the analysis yielded the following conclusions:
(1) After the research and model simulation verification, it was clear that the interaction mechanism between LGs and OPEs is that LGs regulate the market by subsidies and supervision, and OPEs respond to the market demand through the operation of the CRE or not;
(2) A sensitivity analysis was conducted to assess the impacts of the variations in the subsidy amounts, monitoring intensities, and different types of costs on the four types of CRE operation markets. As shown in
Figure 12, asset-light OPEs exhibit a greater dependence on higher subsidies to regularize CRE operations, while asset-heavy OPEs can autonomously reach a stable state even with reduced subsidies. From
Figure 13, it can be seen that asset-light OPEs with high subsidy dependences still require the government to maintain a certain degree of supervision over their subsidized operations to facilitate the formation and development of market order. In contrast, asset-heavy OPEs with low subsidy dependences already possess strong autonomous operational abilities, necessitating a reduction in the supervision intensity by LGs to promote market liberalization. Asset-light OPEs have a higher proportion of operating costs and are willing to operate the liner only when the operating costs are reduced to a certain extent. The proportion of fixed costs is higher for high-asset enterprises. For light-penalty OPEs, when the fixed costs are controlled within a certain range, they will keep operating the liner, and their willingness to operate will increase with the reduction in operating costs. For heavy-penalty OPEs, the increase in fixed costs and service change costs increases the probability of subsidization by LGs and, at the same time, slows down the speed at which the OPEs will choose not to operate the liner;
(3) With regard to the current different situations’ evolution directions, the asset-light OPE and penalty-weak LG market (System (I)) evolves towards a state in which the OPEs are disinclined to operate the liner and the LGs are disinclined to subsidize it. The asset-light OPE and penalty-strong LG market (System (II)) exhibits continuous fluctuations without reaching an evolutionary stabilization point. Conversely, the asset-heavy OPE and penalty-light LG market (System (III)) evolves towards a state in which OPEs operate liner trains and LGs refrain from subsidizing them. The asset-heavy OPE and penalty-light LG market (System (IV)) evolves towards a state in which OPEs abstain from operating liner trains and LGs refrain from subsidizing them.
Asset-light OPEs exhibit a higher dependency on LGs for substantial subsidies to achieve normalized CRE operations, whereas asset-heavy OPEs demonstrate stability under reduced subsidies. The former necessitates sustained government supervision to facilitate market order formation and development, while the latter, with robust independent operational capabilities, benefits from reduced oversight to foster market liberalization. Fixed costs and service change costs wield a more significant influence on the overall operational market and are proportionally smaller for asset-light OPEs compared to their asset-heavy counterparts. Across all the OPE types, the diminished operation costs and proportions thereof heighten the OPE motivation in CRE operations, concurrently reducing the likelihood of LGs subsidizing the CRE. This trend aligns with the diminished probability of LGs subsidizing the CRE.
We acknowledge several limitations in the underlying assumptions of our model. This study employed the Activity-Based Costing method alongside evolutionary game theory to investigate strategy optimization amid the current subsidy withdrawal landscape, with a focus on short- and medium-term evolution. In instances in which the investigation spans long-term evolution and planning, the continuous adjustment of cost allocation using this method may prove impractical due to the heightened complexity. In this case, the long term can be divided into short and medium phases using the Activity-Based Costing method as well as evolutionary game theory, while combining them with time-series forecasting to complete a more accurate long-term evolutionary analysis.


