
Retinex Jointed Multiscale CLAHE Model for HDR Image Tone Compression


Abstract
1. Introduction
2. Related Work
2.1. Retinex-Based Tone Processing
2.2. Contrast Limited Adaptive Histogram Equalization
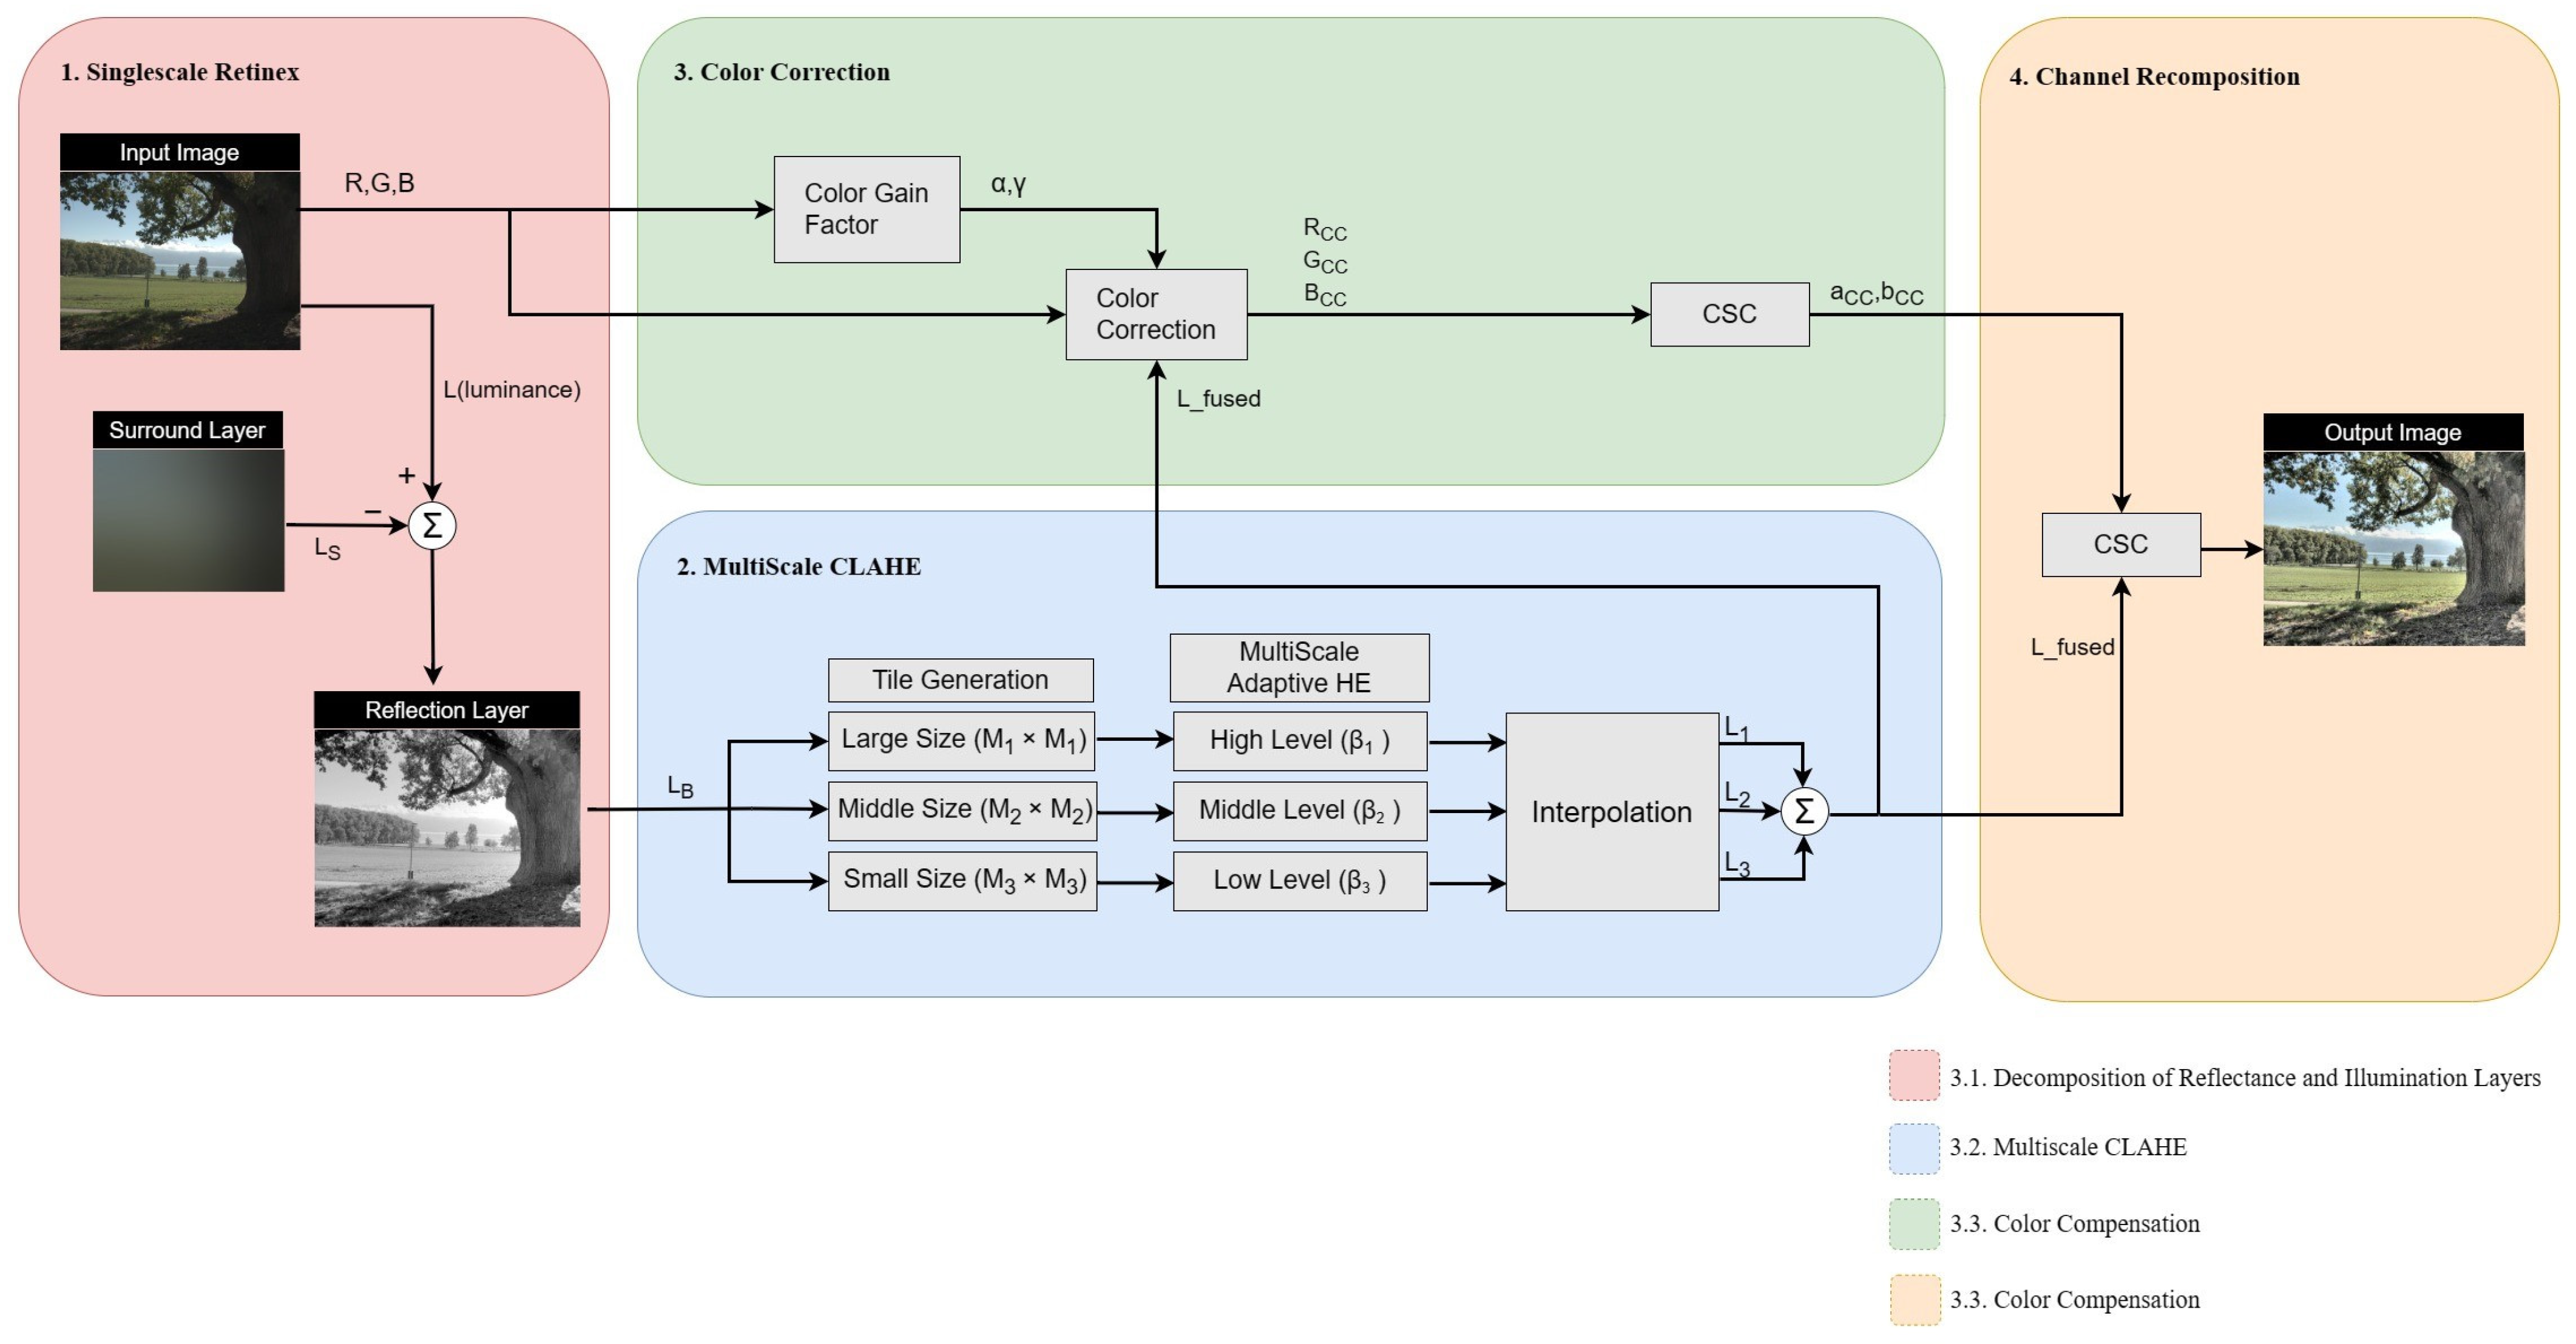
3. Proposed Method
- To effectively address the halo artifact and noise issues that arise in conventional multi-blurring techniques, high-scale SSR is performed.
- To compensate for visibility while maintaining image quality, we perform CLAHE on multiple scales.
- To restore some distorted colors due to the previous procedure, the color correction method, MSRCR, is performed.
3.1. Decomposition of Reflectance and Illumination Layers
3.2. Multiscale CLAHE
3.3. Color Compensation
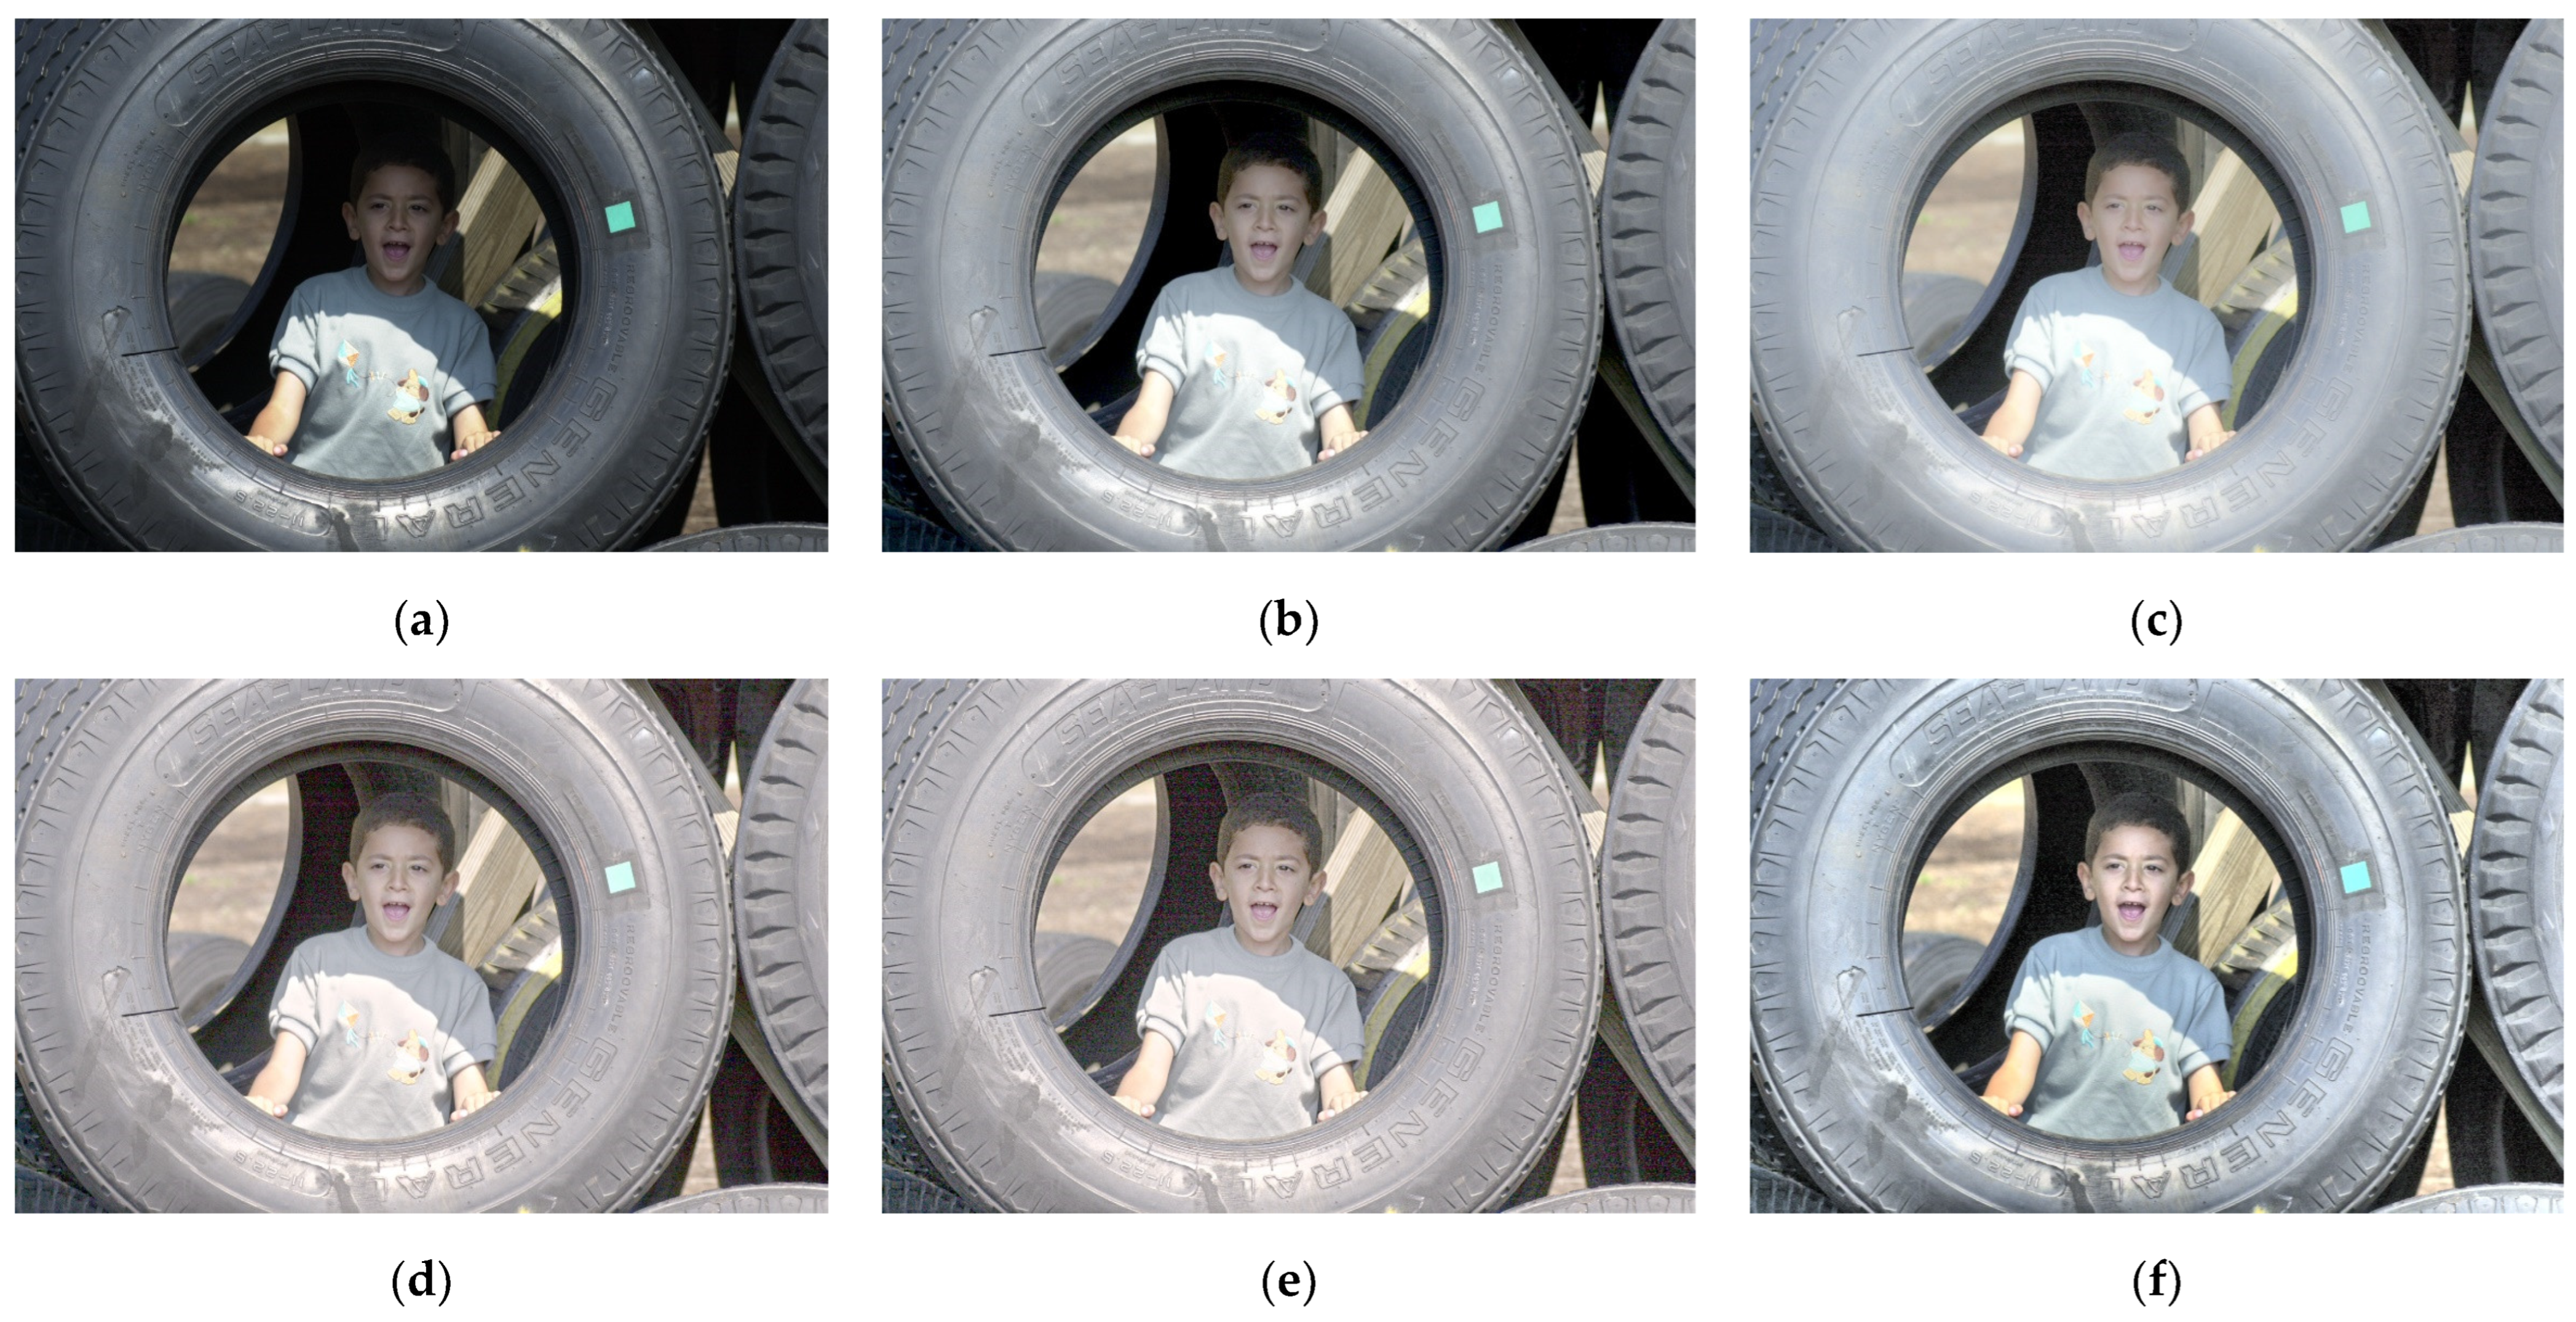
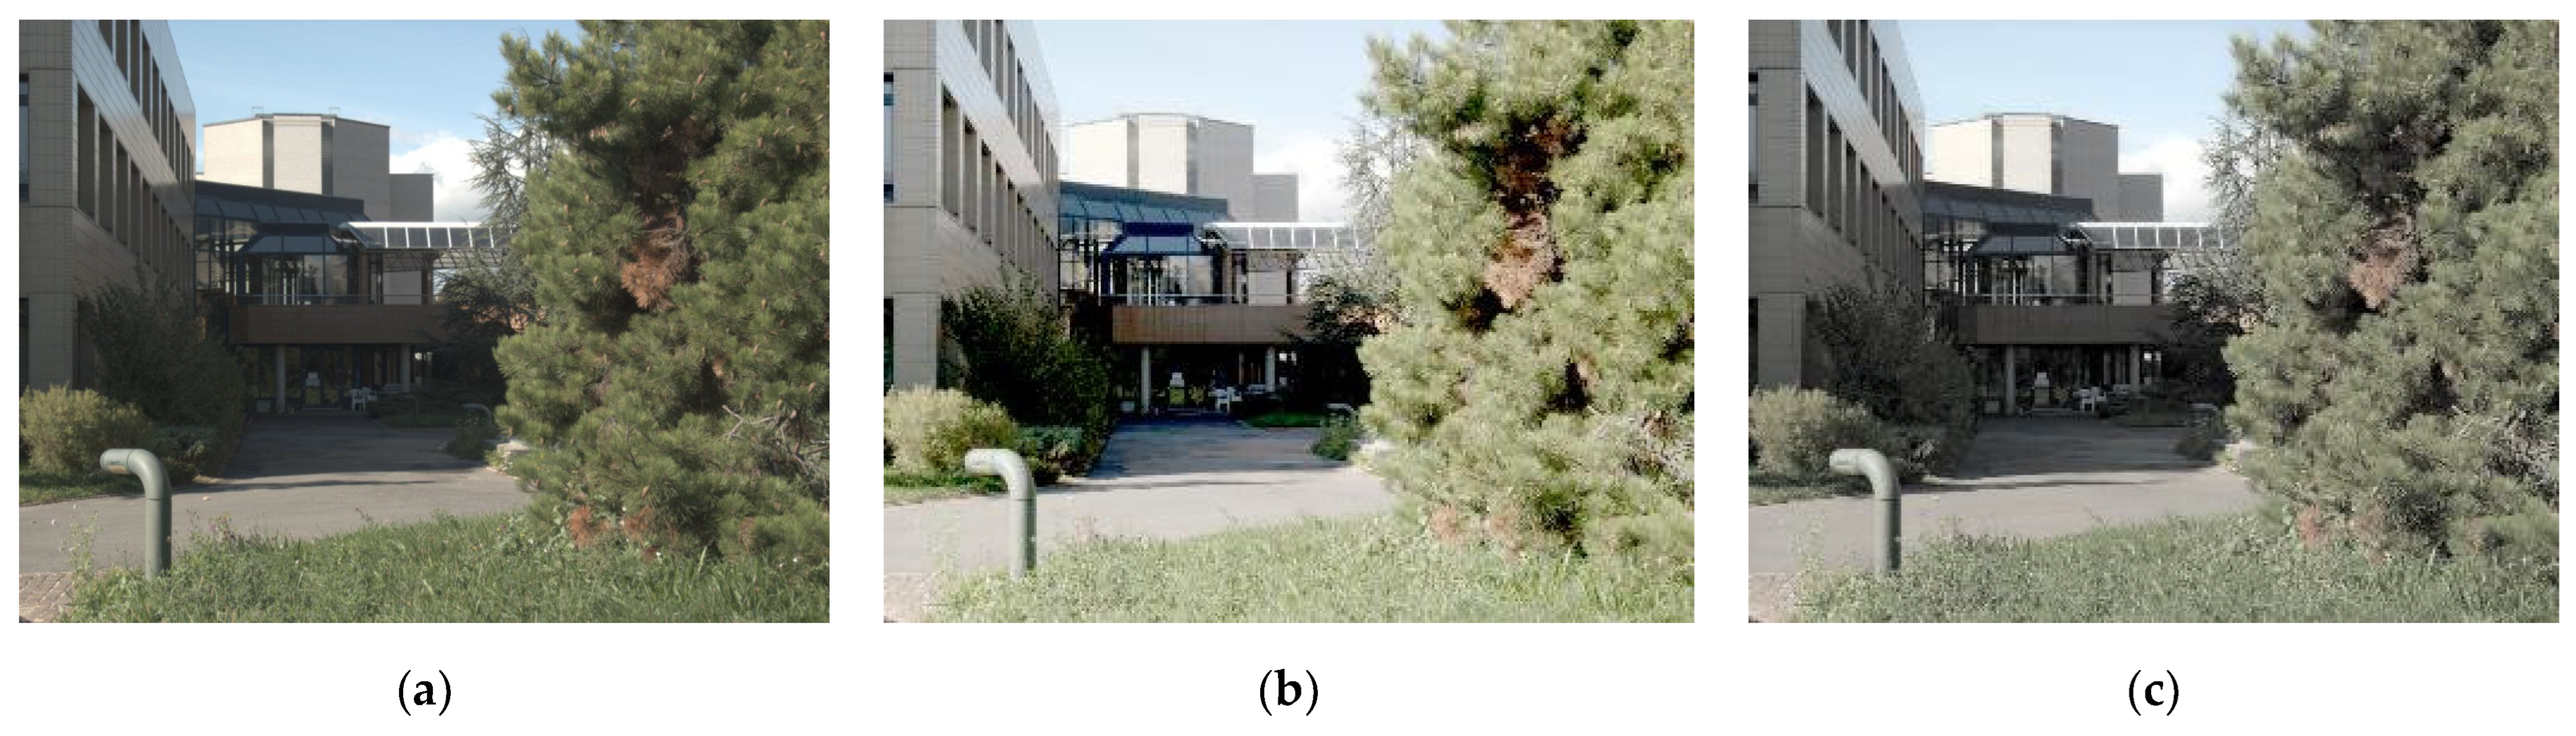
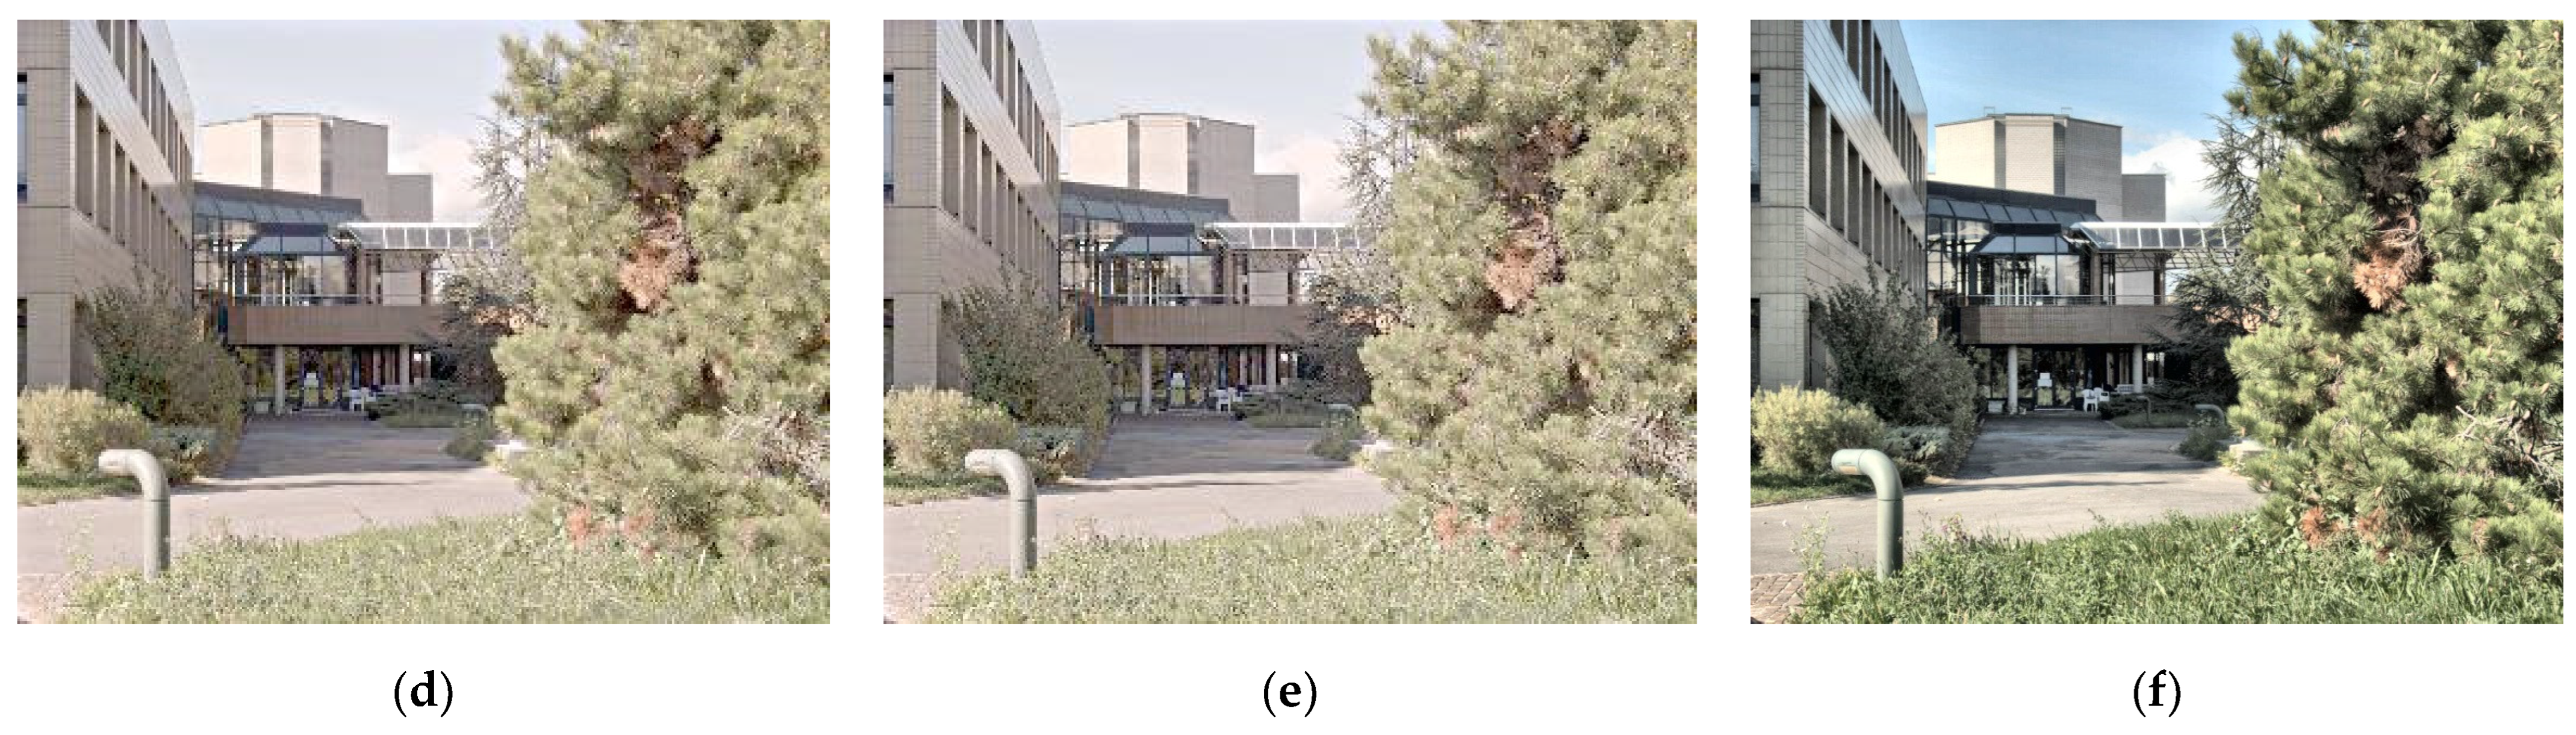
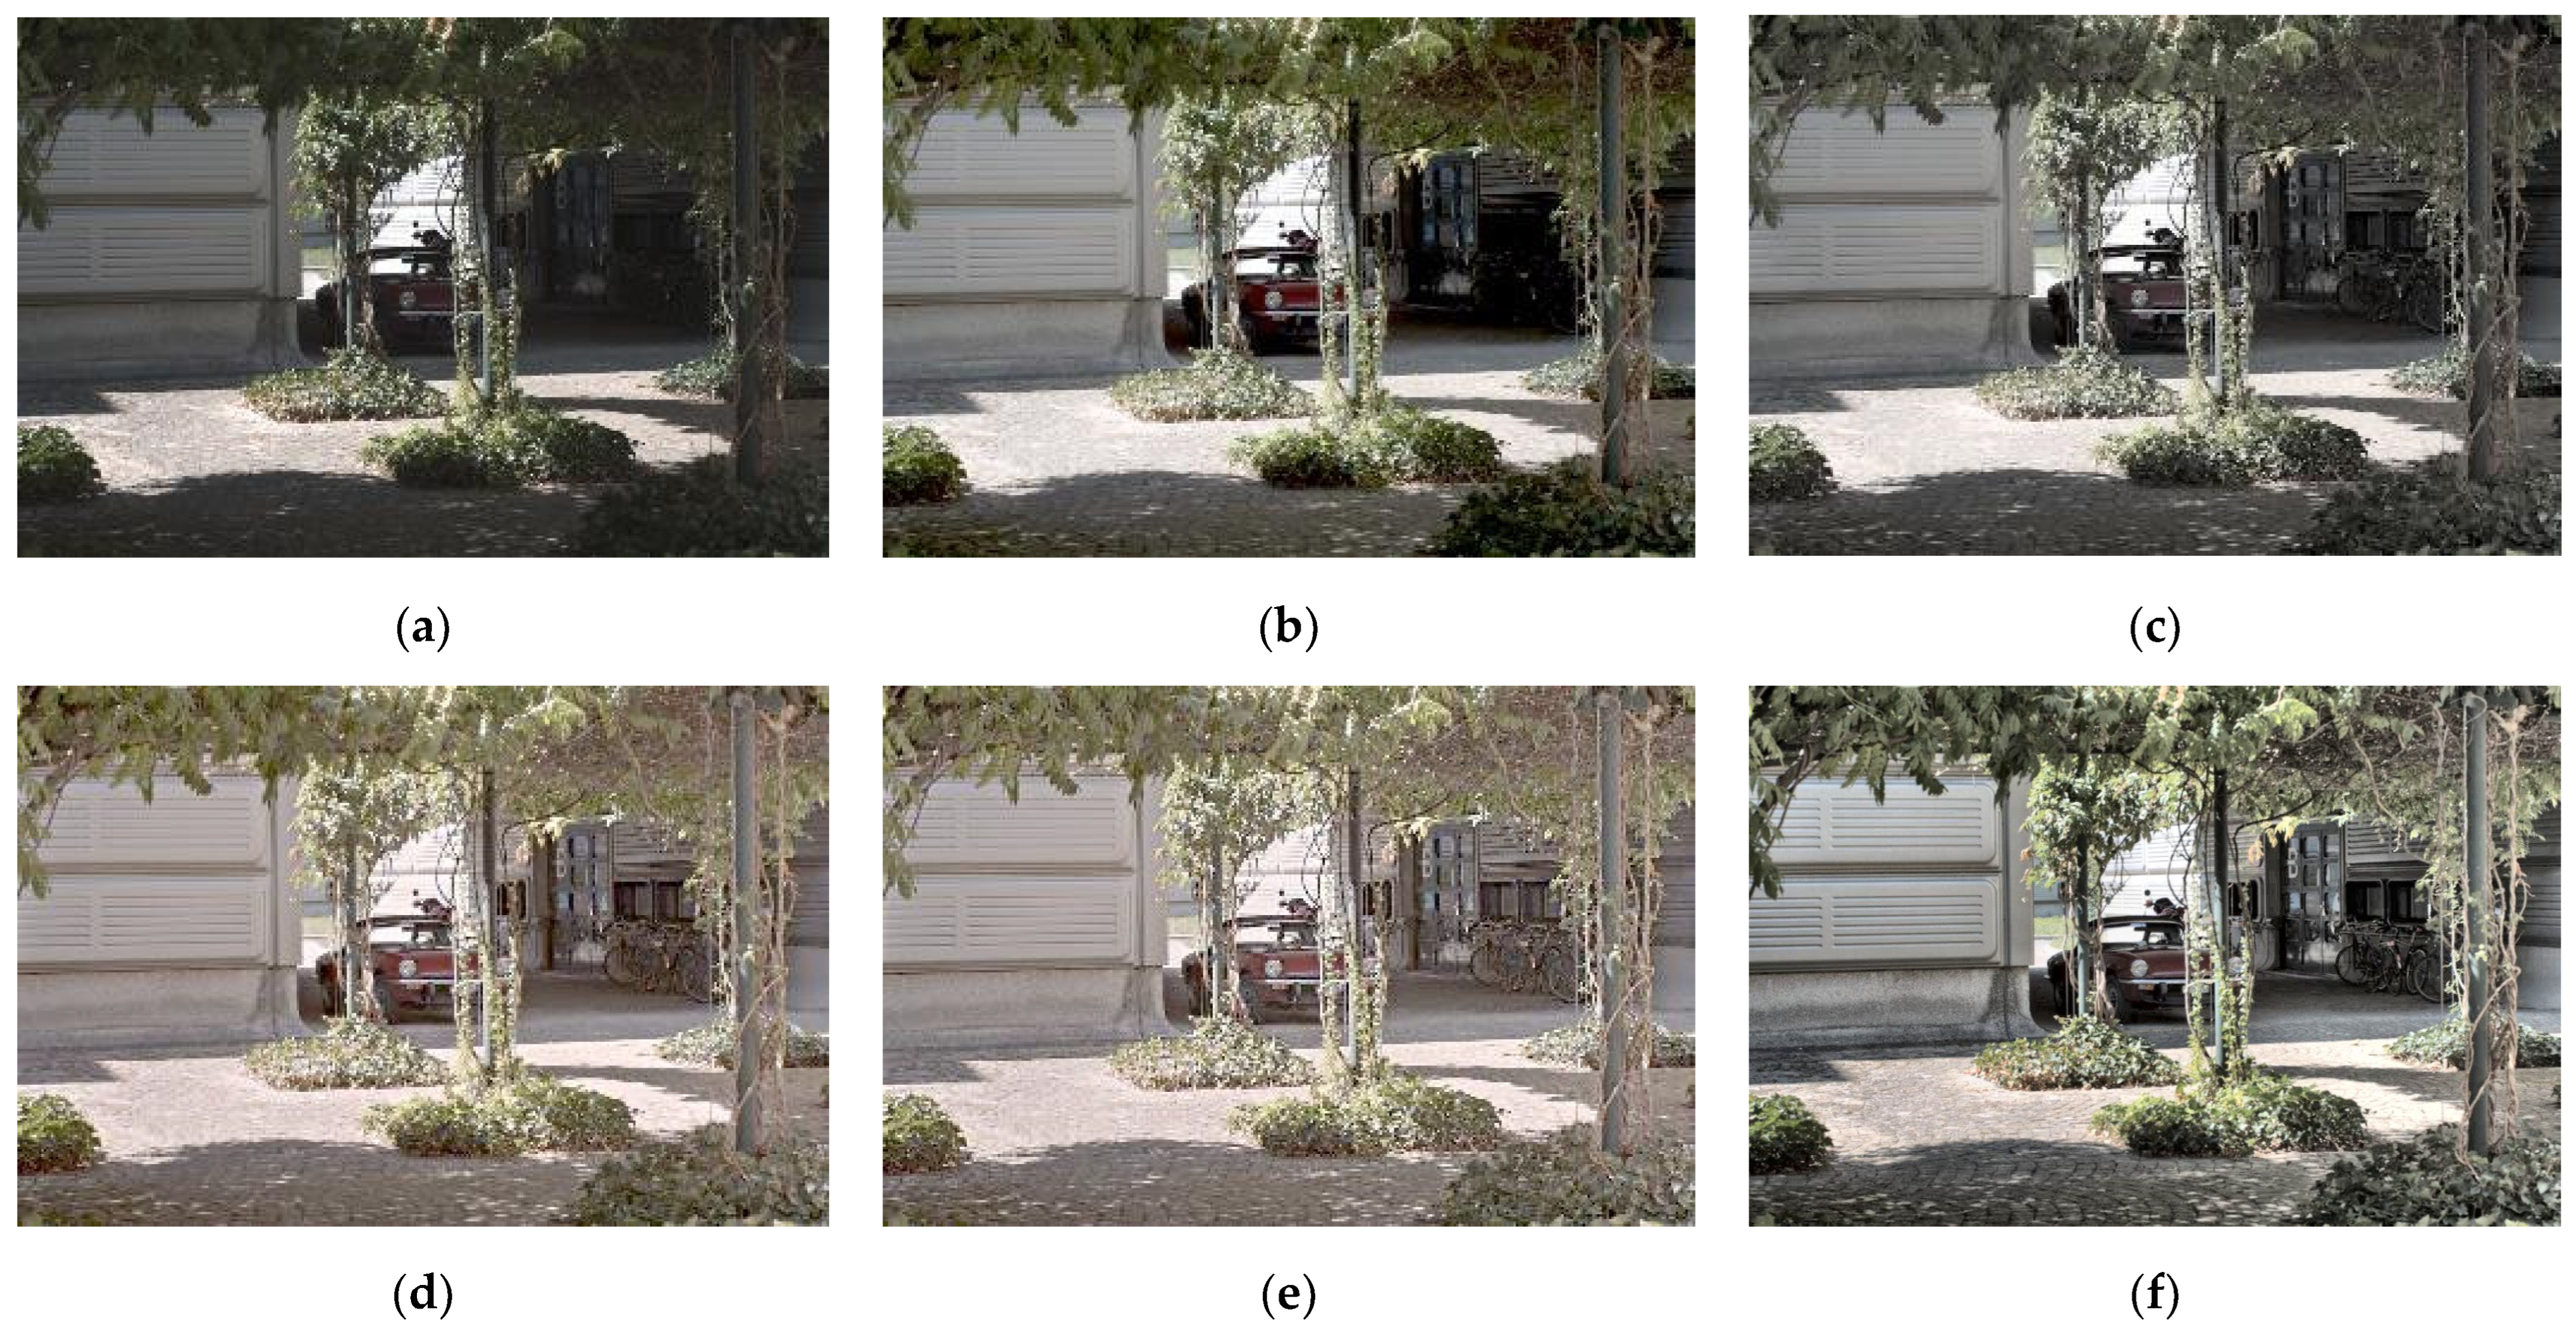
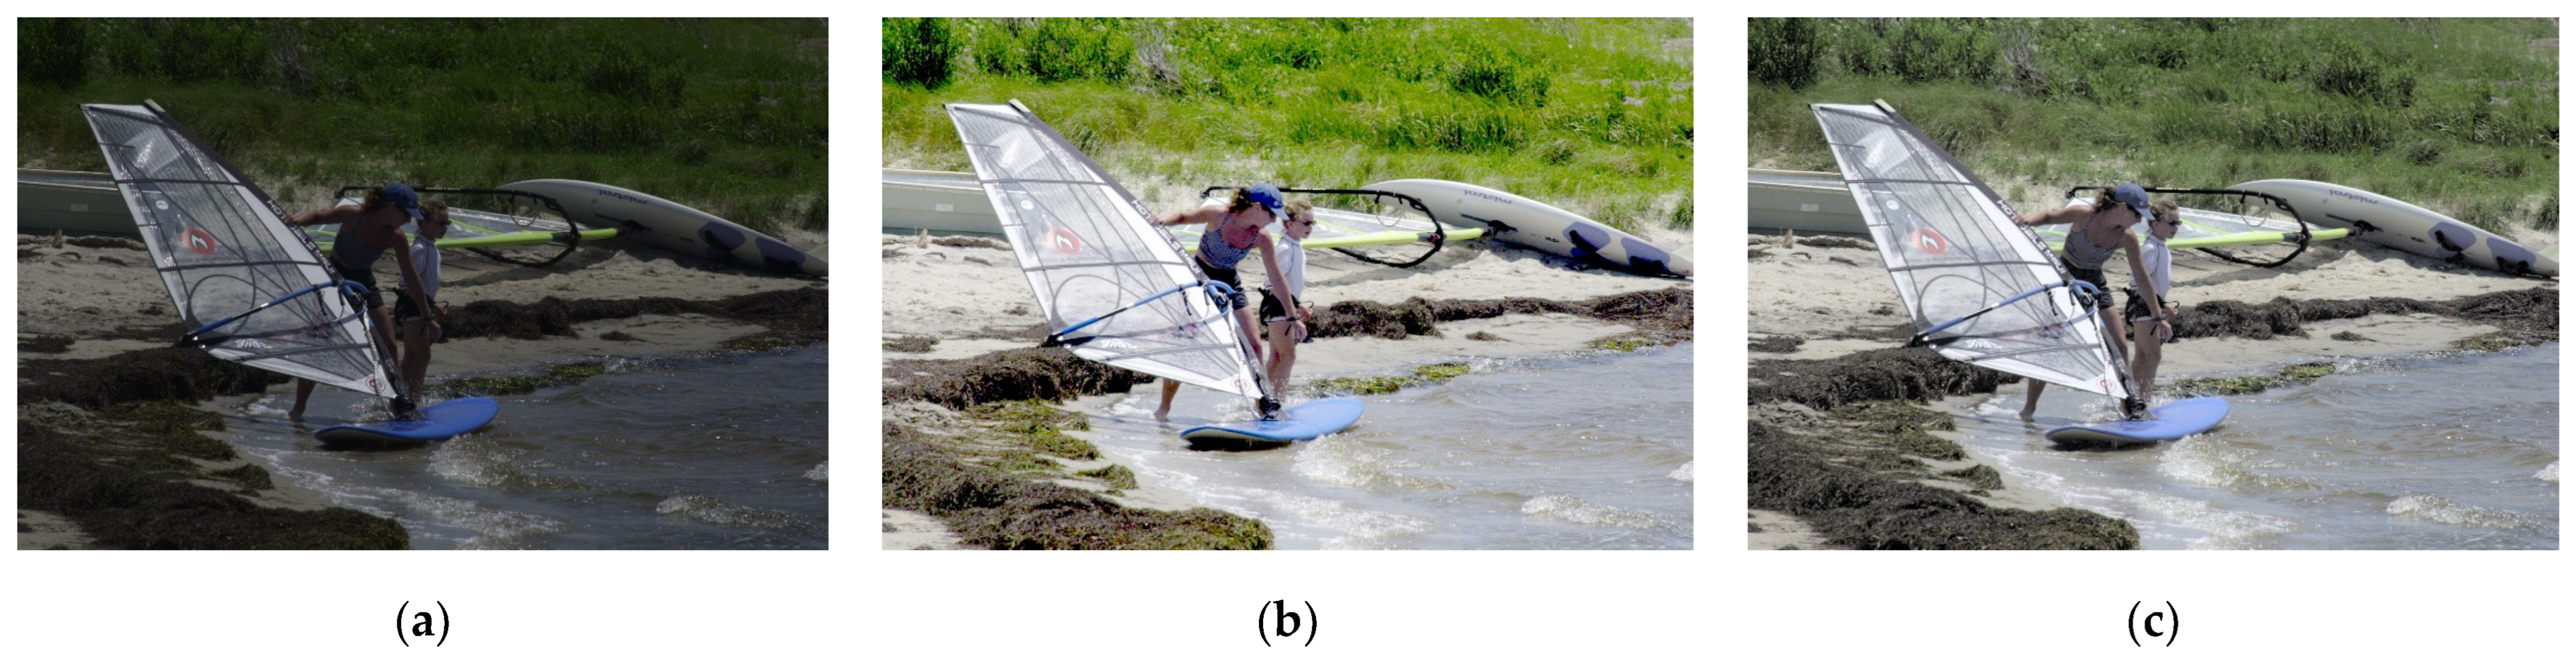
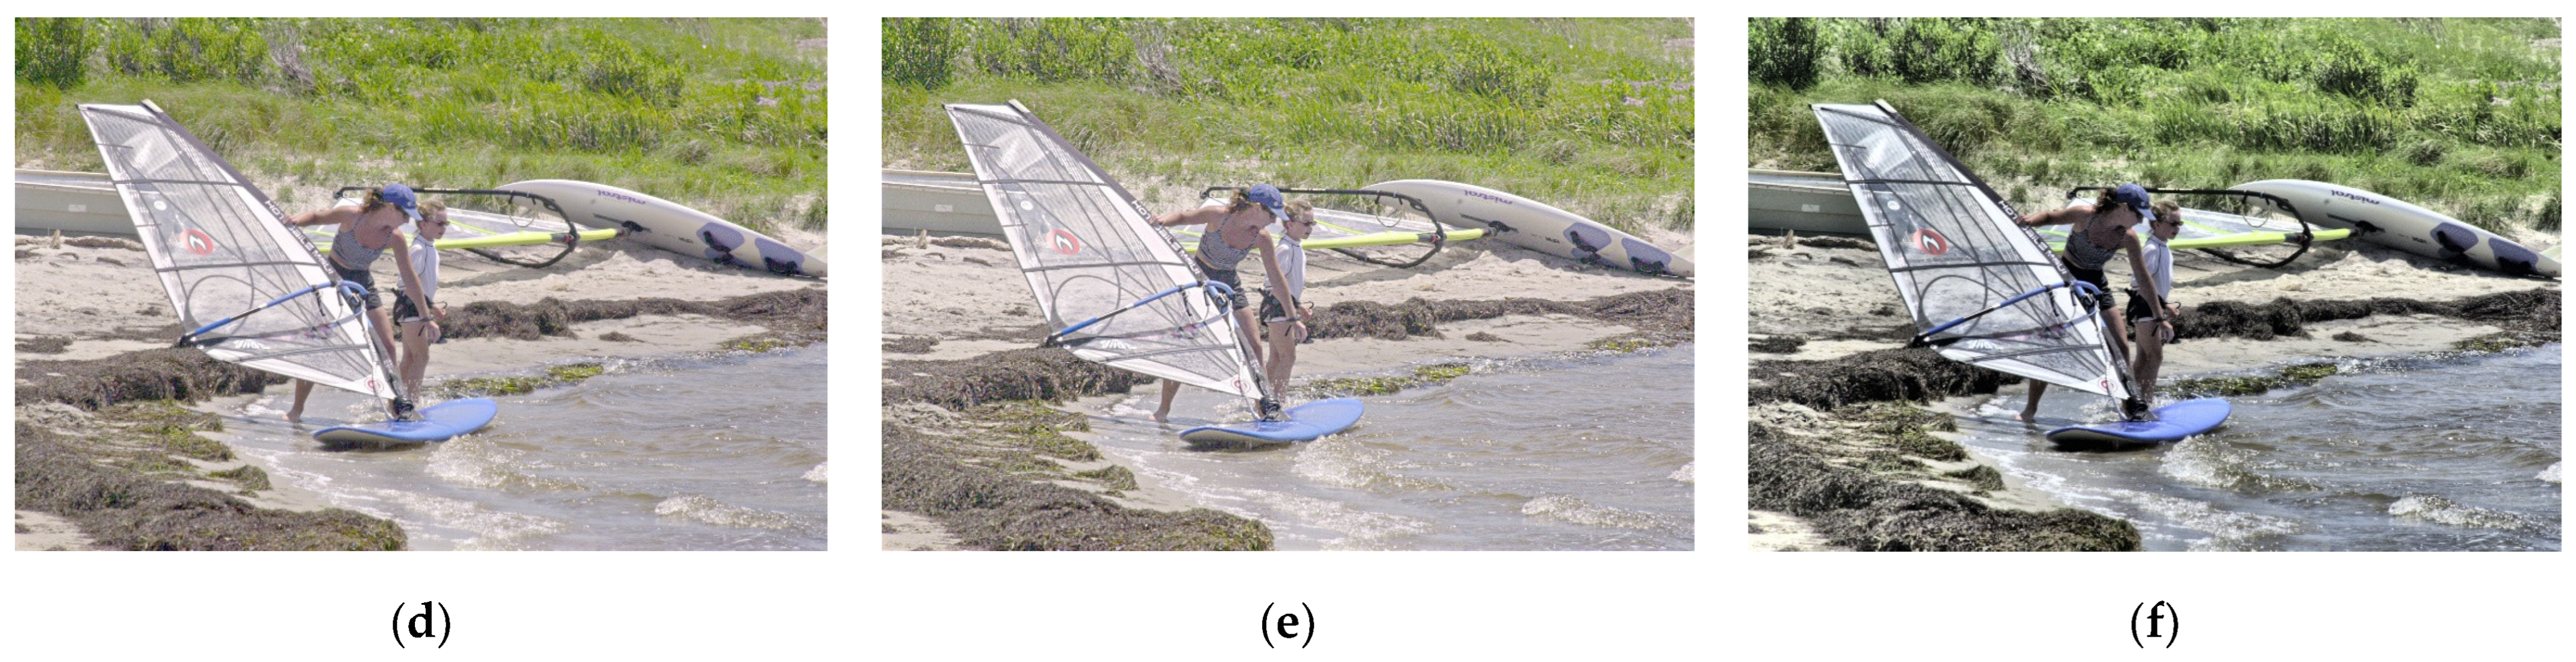
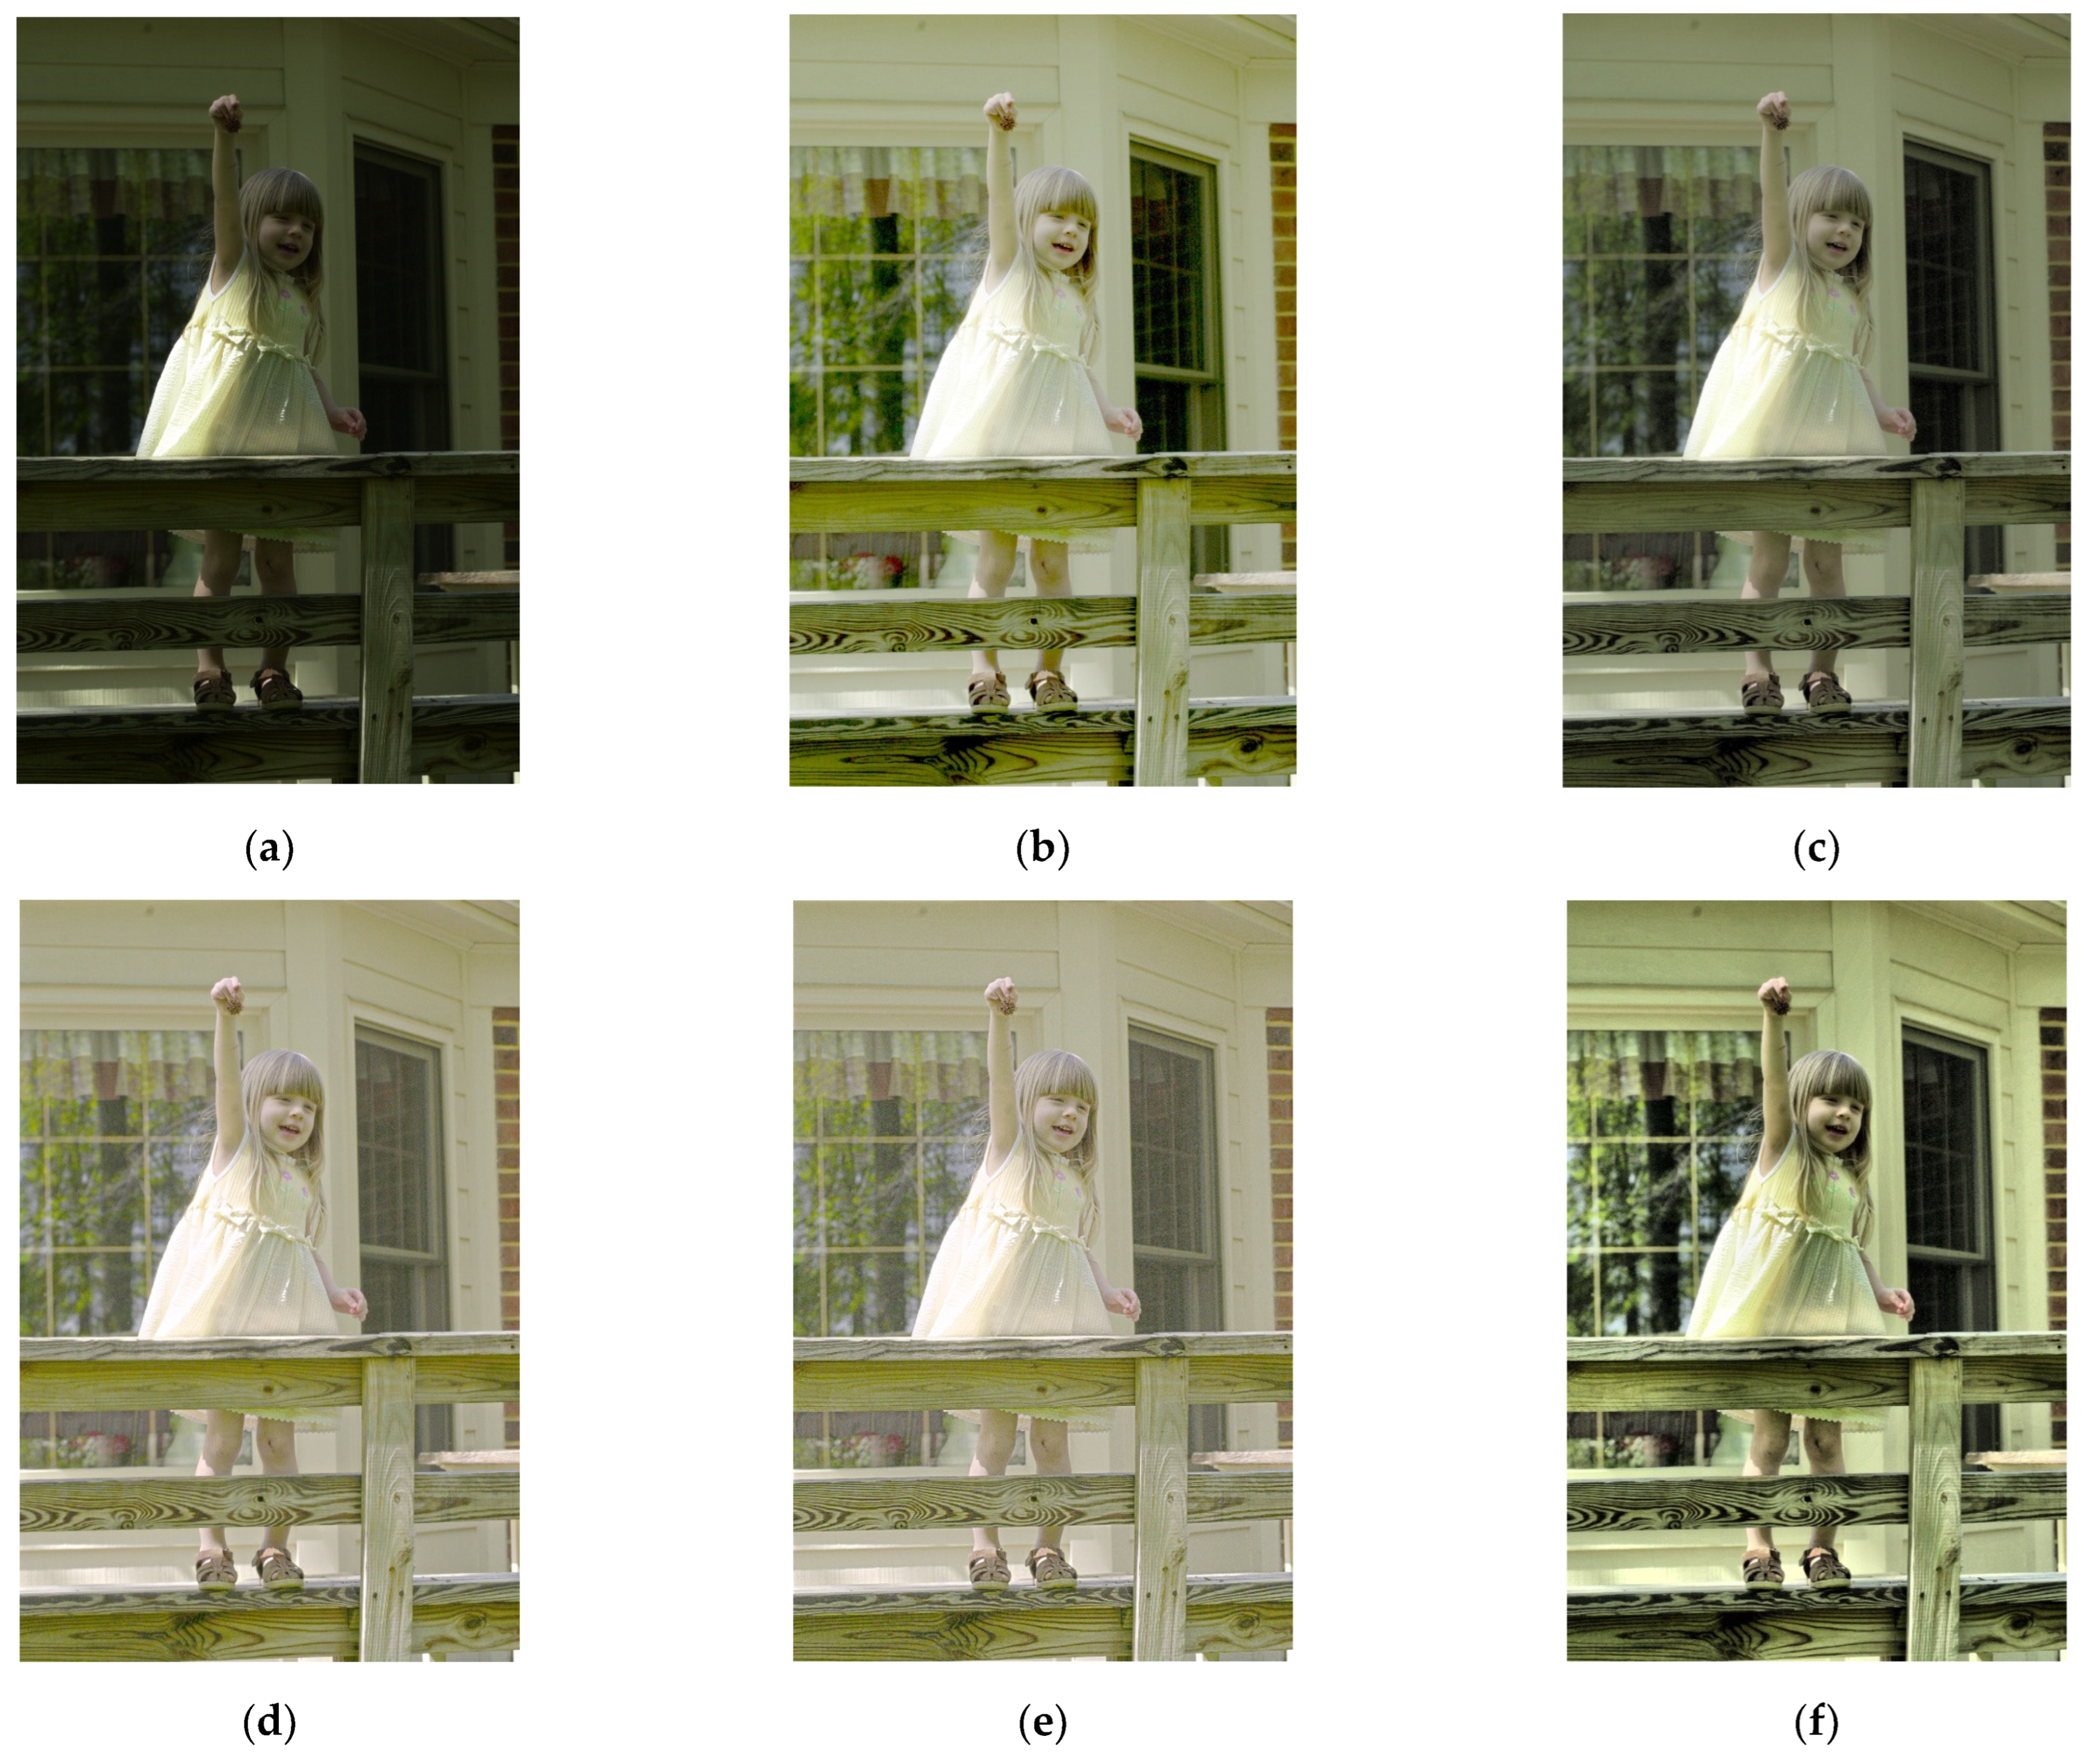
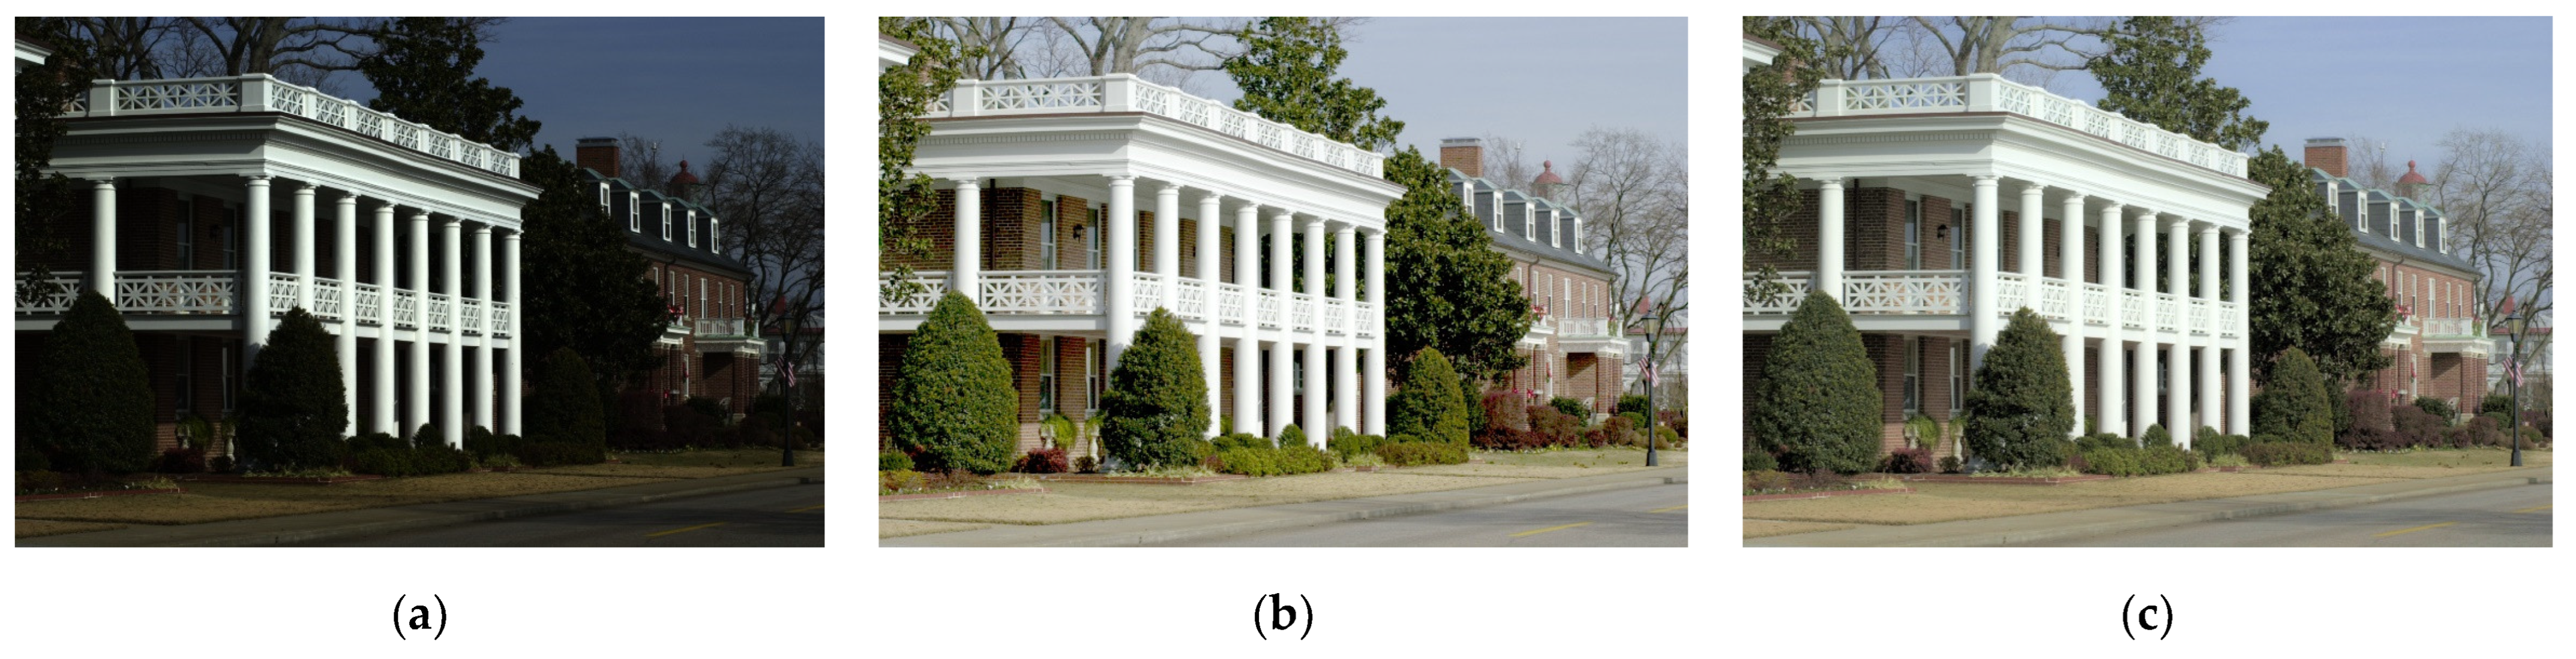
4. Simulations
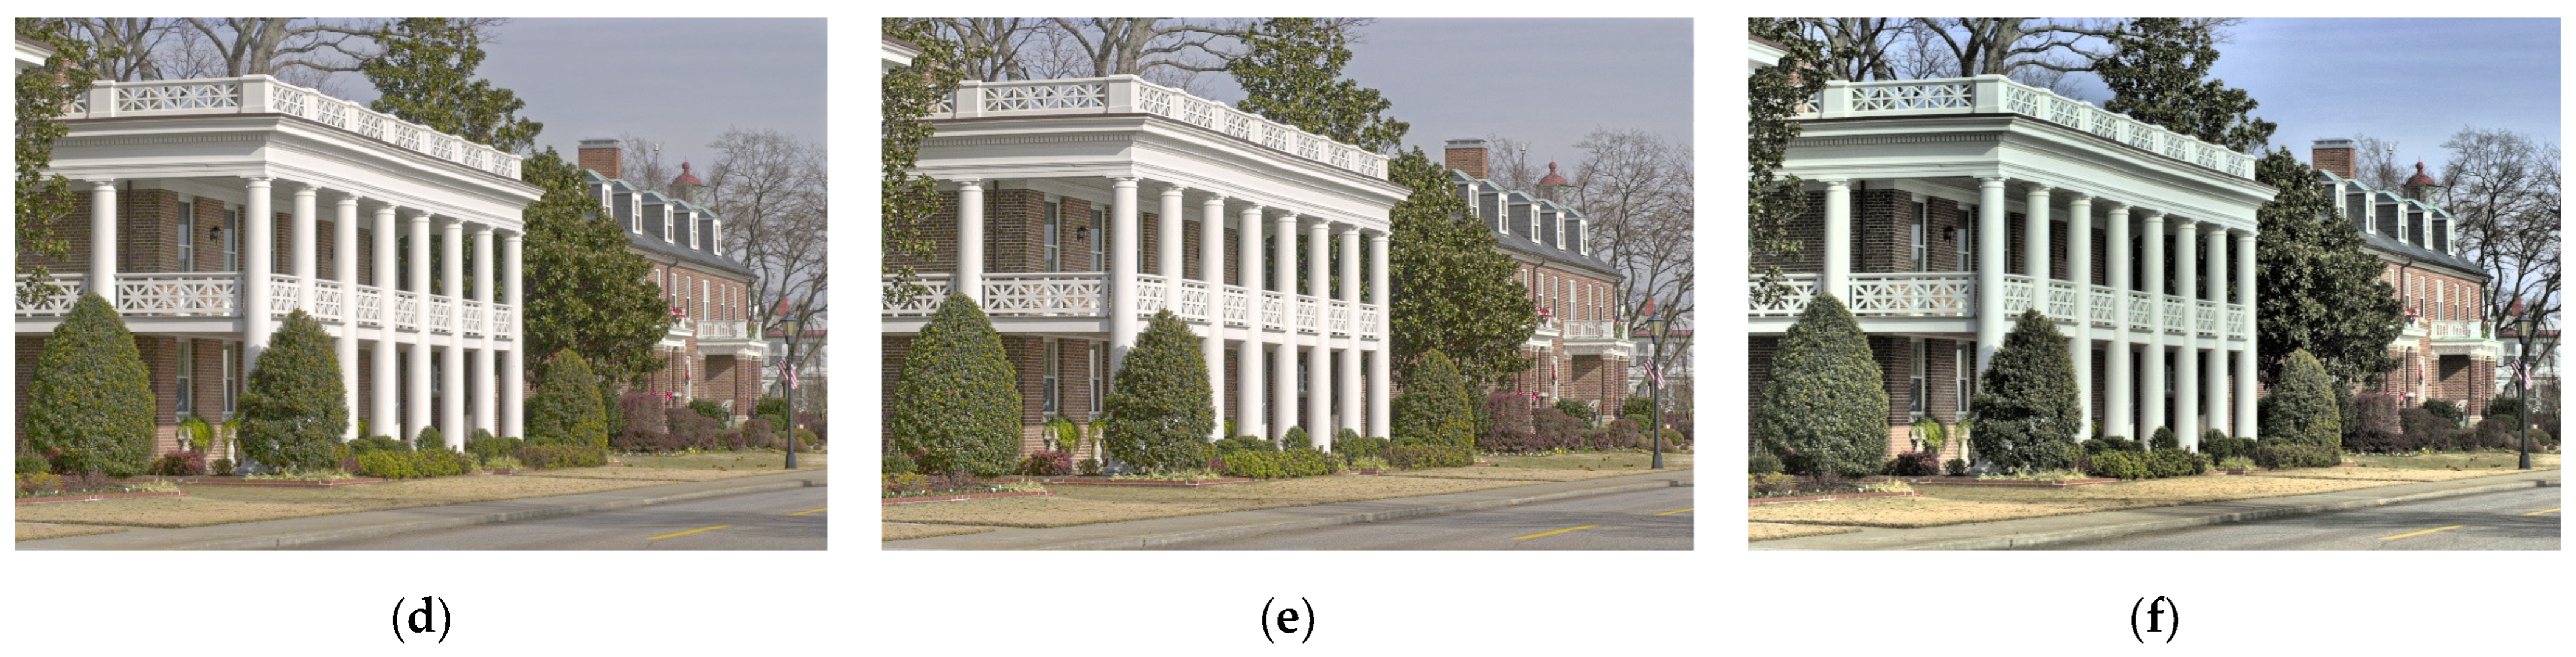
4.1. Experimental Results
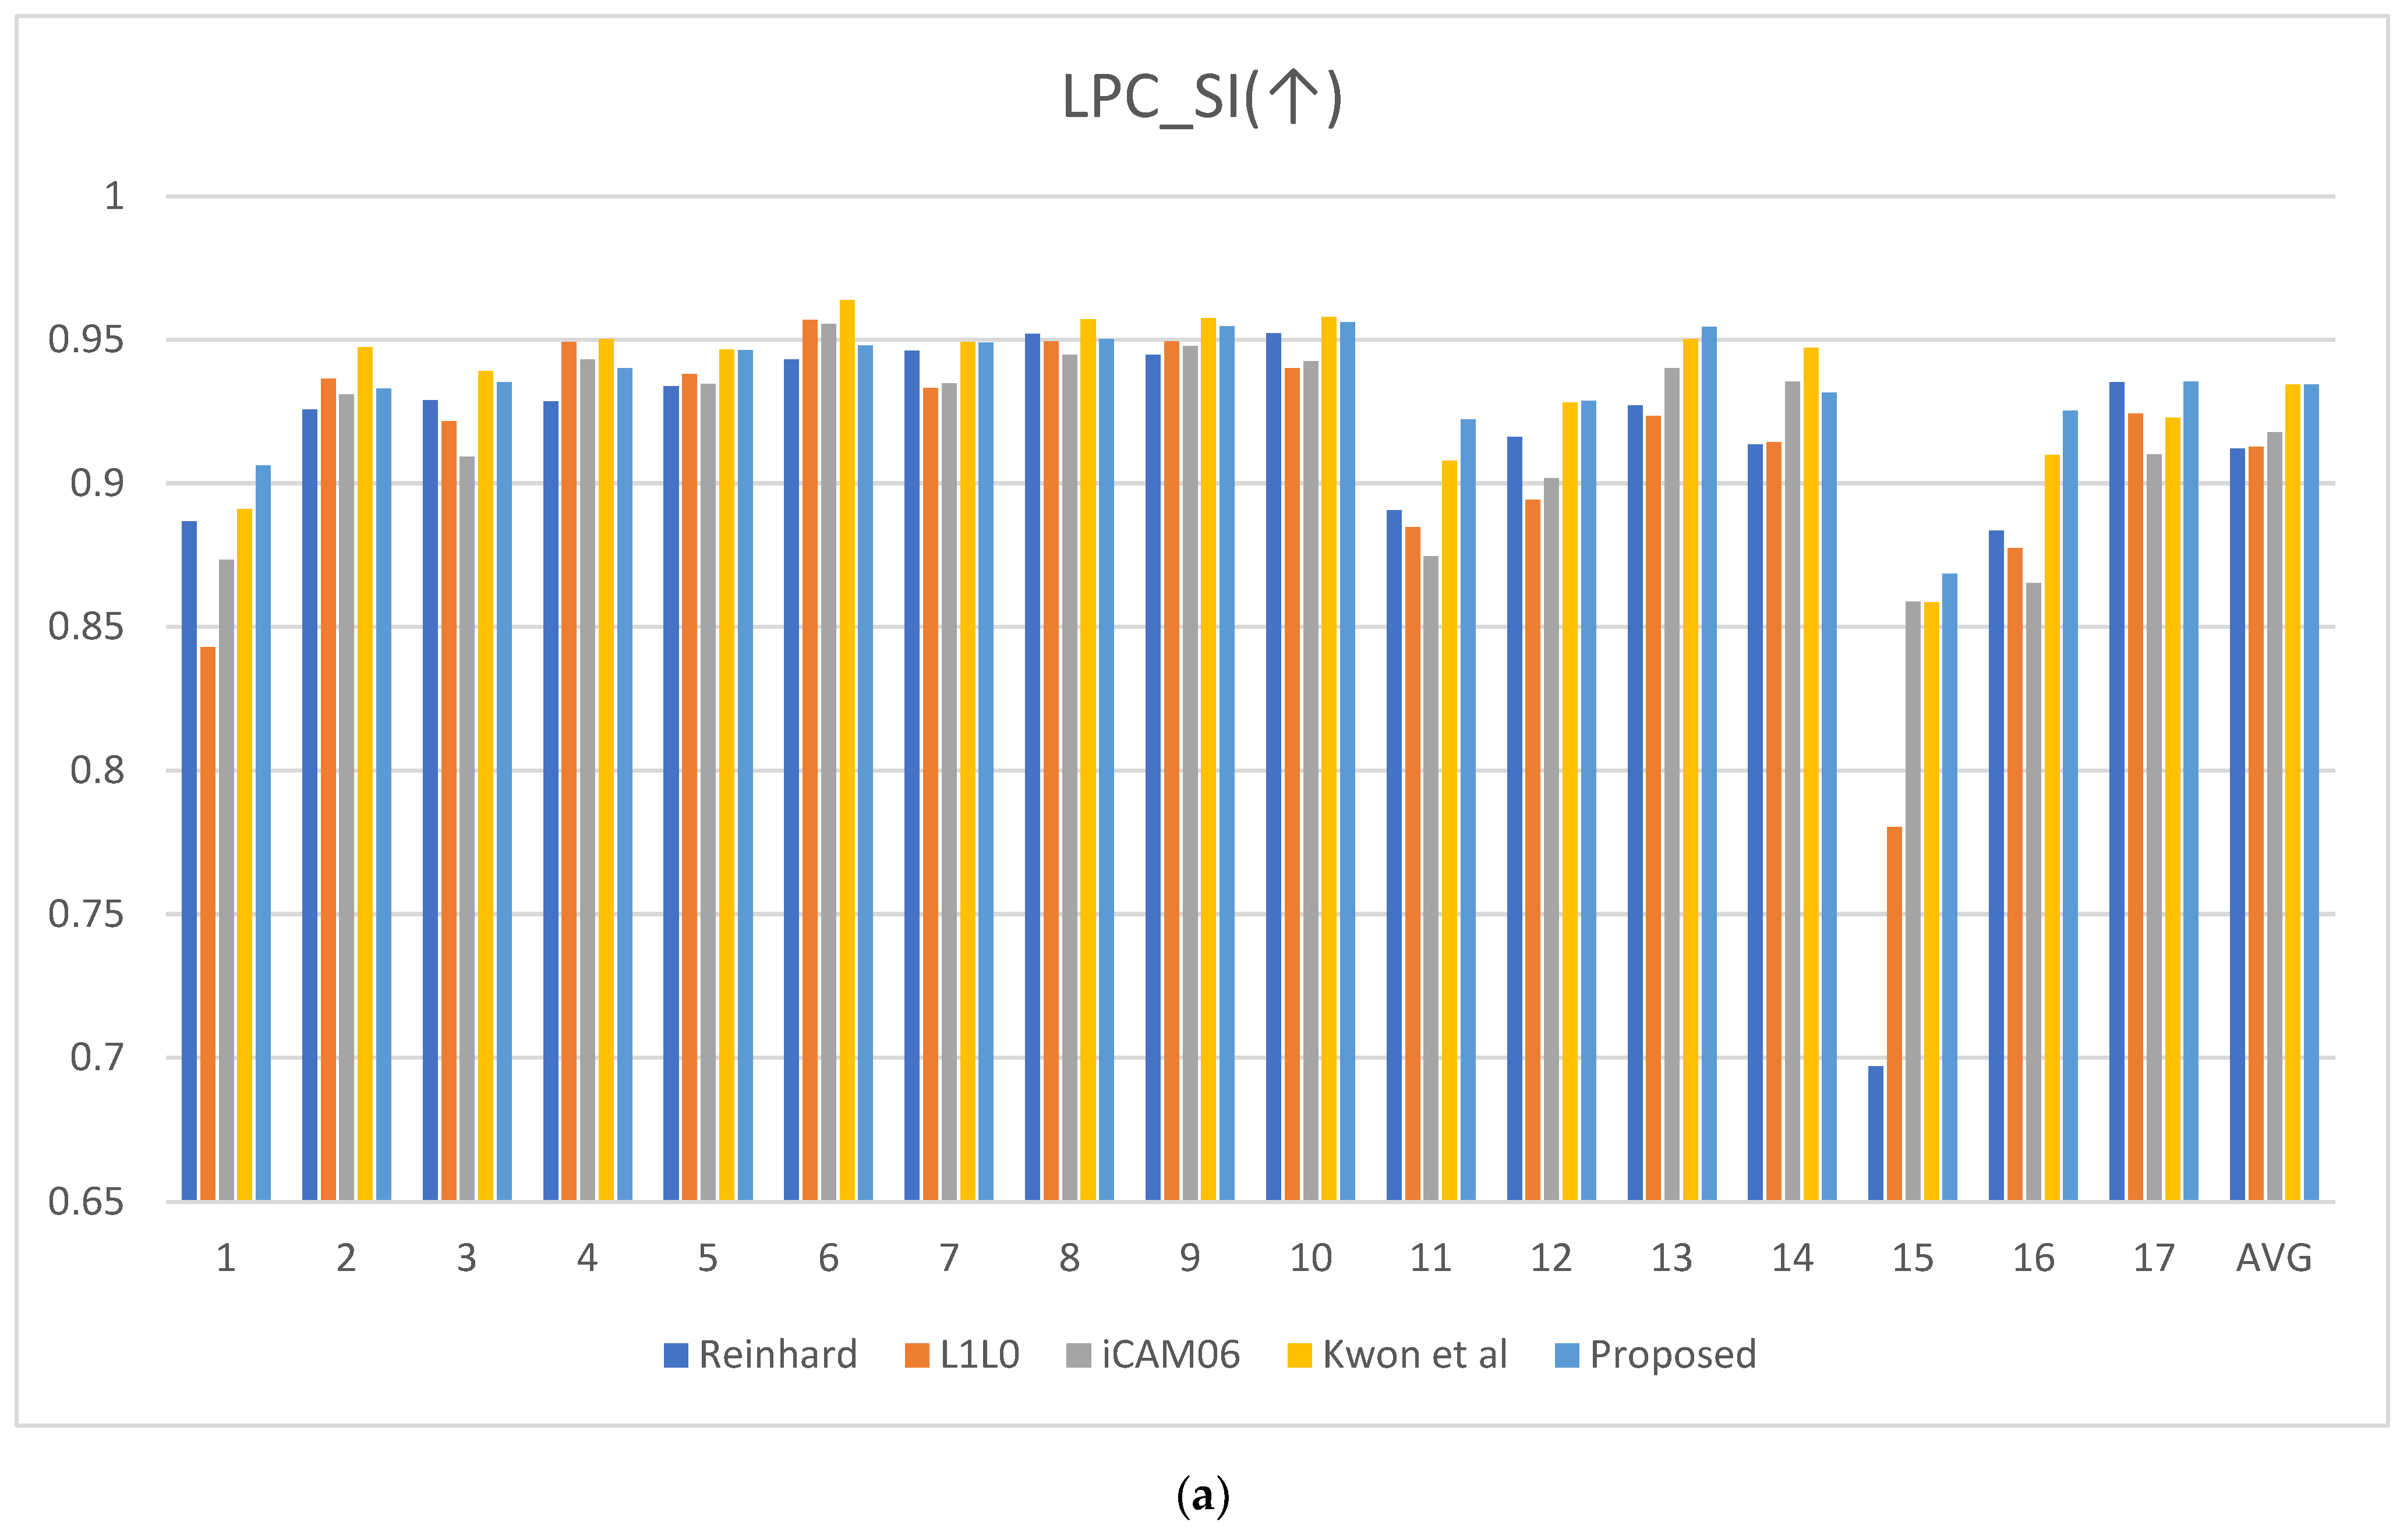
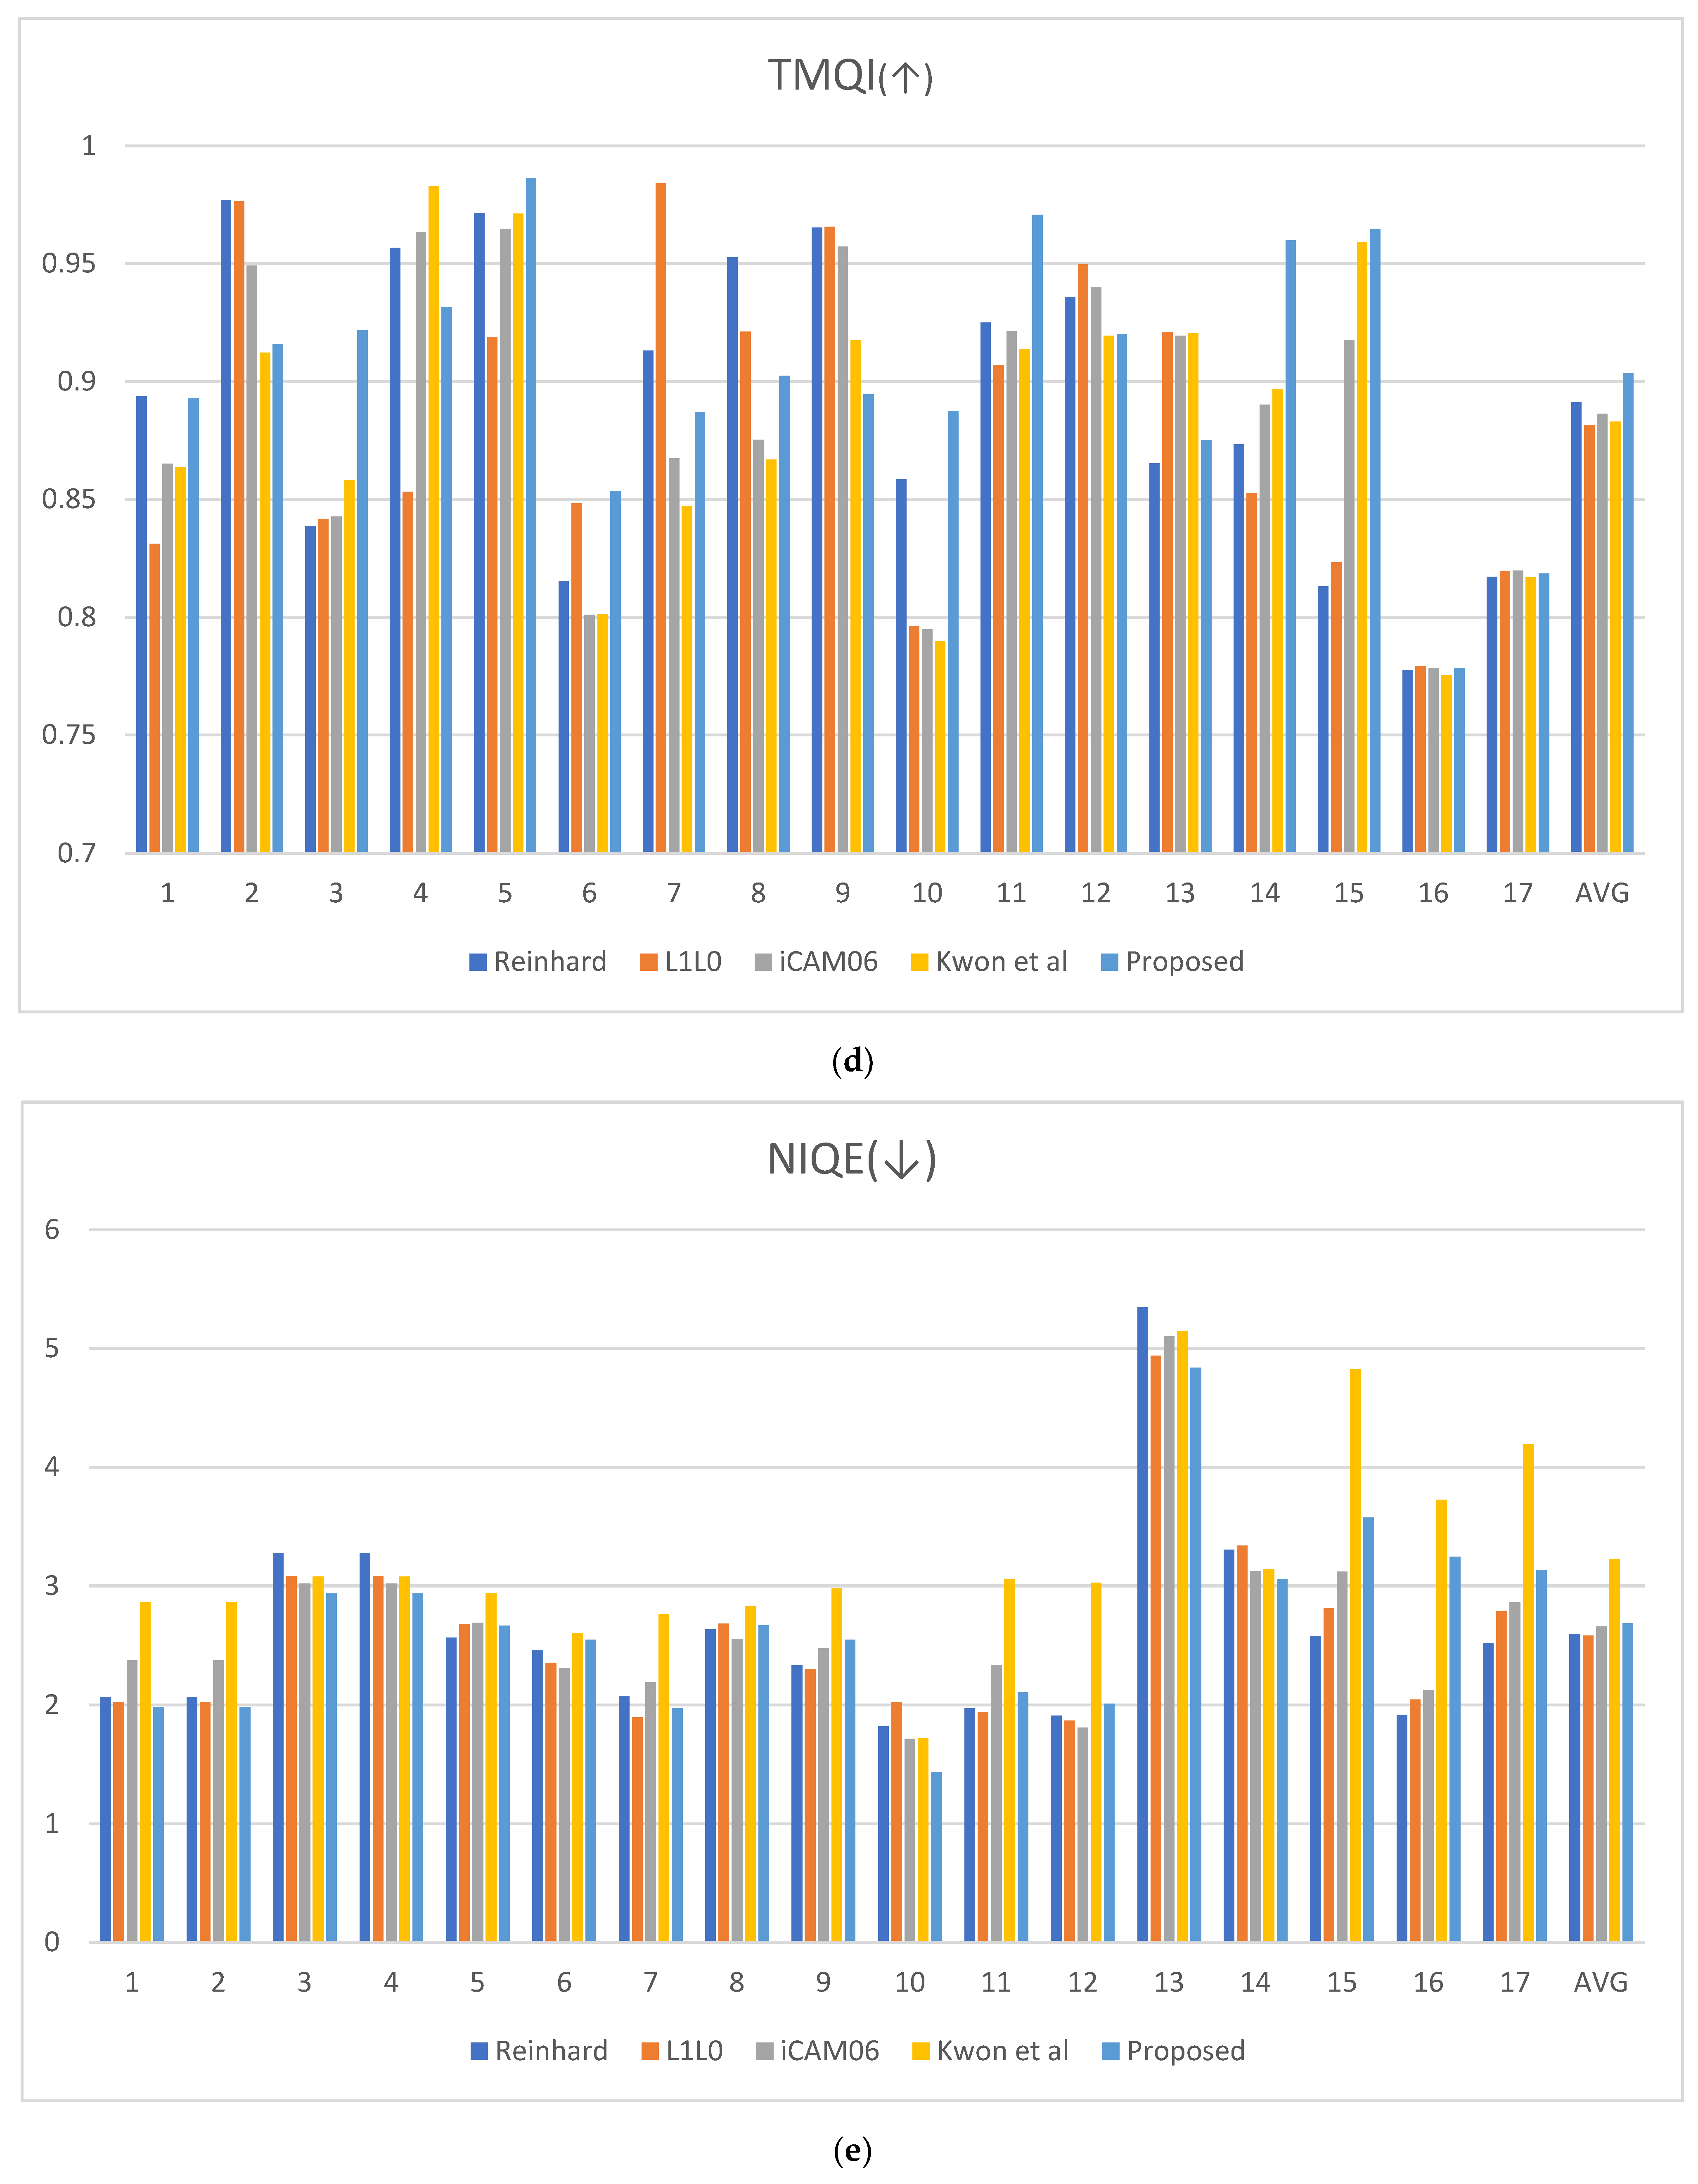
4.2. Objective Assessment
5. Conclusions
Author Contributions
Funding
Data Availability Statement
Conflicts of Interest
References
- Land, E.; McCann, J.J. Lightness and Retinex theory. J. Opt. Soc. Am. 1971, 61, 1–11. [Google Scholar] [CrossRef] [PubMed]
- Gonzalez, R.C.; Woods, R.E. Digital Image Processing, 2nd ed.; Prentice-Hall: Upper Saddle River, NJ, USA, 2002. [Google Scholar]
- Land, E. An Alternative Technique for The Computation of The Designator in The Retinex Theory of Color Vision. Proc. Natl. Acad. Sci. USA 1986, 83, 3078–3080. [Google Scholar] [CrossRef] [PubMed]
- Jobson, D.J.; Rahman, Z.-U.; Woodell, G.A. A Multiscale Retinex for Bridging the Gap Between Color Images and the Human Observation of Scenes. IEEE Trans. Image Process. 1997, 6, 965–976. [Google Scholar] [CrossRef] [PubMed]
- Reinhard, E.; Stark, M.; Shirley, P.; Ferwerda, J. Photographic Tone Reproduction for Digital Images. Semin. Graph. Pap. Push. Bound. 2002, 2, 661–670. [Google Scholar]
- Tumblin, J.; Turk, G. LCIS: A boundary hierarchy for detailpreserving contrast reduction. In Proceeding of the 26th Annual Conference on Computer Graphics and Interactive Techniques, Los Angeles, CA, USA, 8–13 August 1999; pp. 83–90. [Google Scholar]
- Farbman, Z.; Fattal, R.; Lischinski, D.; Szeliski, R. Edge-preserving decompositions for multi-scale tone and detail manipulation. ACM Trans. Gr. 2008, 27, 67. [Google Scholar] [CrossRef]
- Durand, F.; Dorsey, J. Fast Bilateral Filtering for the Display of High-Dynamic-Range Images. In Proceedings of the 29th Annual Conference on Computer Graphics and Interactive Techniques, San Antonio, TX, USA, 21–26 July 2002. [Google Scholar]
- Kwon, H.J.; Lee, S.H.; Lee, G.Y.; Sohng, K.I. Enhanced high dynamic-range image rendering using a surround map based on edge-adaptive layer blurring. IET Comput. Vis. 2016, 10, 689–699. [Google Scholar] [CrossRef]
- Lee, G.Y.; Kwon, H.J.; Lee, S.H. HDR image reproduction based on visual achromatic response. Opt. Rev. 2020, 27, 361–374. [Google Scholar] [CrossRef]
- Kuang, J.; Johnson, G.M.; Fairchild, M.D. iCAM06: A refined image appearance model for HDR image rendering. J. Vis. Commun. Image Represent. 2007, 18, 406–414. [Google Scholar] [CrossRef]
- Kwon, H.J.; Lee, S.H. Contrast sensitivity based multiscale base-detail separation for enhanced HDR imaging. Appl. Sci. 2020, 10, 2513. [Google Scholar] [CrossRef]
- Jobson, D.J.; Rahman, Z.; Woodell, G.A. Properties and Performance of A Center/surround Retinex. IEEE Trans. Image Process. 1997, 6, 451–462. [Google Scholar] [CrossRef] [PubMed]
- Gonzalez, R.; Wood, R. Digital Image Processing, 3rd ed.; Pearson Education: London, UK, 2009. [Google Scholar]
- Zuiderveld, K. Contrast limited adaptive histogram equalization. Graphics Gems 1994, 8, 474–485. [Google Scholar]
- Computer Vision Test Images. Available online: https://www.cs.cmu.edu/afs/cs/project/cil/ftp/html/v-images.html (accessed on 5 May 2024).
- Meylan, L.; Susstrunk, S. High dynamic range image rendering with a retinex-based adaptive filter. IEEE Trans. Image Process. 2006, 15, 2820–2830. [Google Scholar] [CrossRef] [PubMed]
- Meylan, L. Tone Mapping for High Dynamic Range Images. Ph.D. Thesis, École Polytechnique Fédérale de Lausanne, Lausanne, Switzerland, 2016. [Google Scholar] [CrossRef]
- YuJoong/Retinex-Jointed-Multiscale-CLAHE. Available online: https://github.com/YuJoong/Retinex-jointed-multiscale-CLAHE/tree/main/self-image (accessed on 10 May 2024).
- Hassen, R.; Wang, Z.; Salama, M.M.A. Image sharpness assessment based on local phase coherence. IEEE Trans. Image Process. 2013, 22, 2798–2810. [Google Scholar] [CrossRef] [PubMed]
- Narvekar, N.D.; Karam, L.J. A no-reference perceptual image sharpness metric based on a cumulative probability of blur detection. In Proceedings of the 2009 International Workshop on Quality of Multimedia Experience, San Diego, CA, USA, 29–31 July 2009; pp. 87–91. [Google Scholar]
- Abdoli, M.; Nasiri, F.; Brault, P.; Ghanbari, M. A Quality Assessment tool for Performance Measurement of Image Contrast Enhancement Methods. IET Image Process. 2019, 13, 833–842. [Google Scholar] [CrossRef]
- Yeganeh, H.; Wang, Z. Objective quality assessment of tone-mapped images. IEEE Trans. Image Process. 2013, 22, 657–667. [Google Scholar] [CrossRef] [PubMed]
- Venkatanath, N.; Praneeth, D.; Bh, M.C.; Channappayya, S.S.; Medasani, S.S. Blind image quality evaluation using perception based features. In Proceedings of the 2015 Twenty First National Conference on Communications (NCC), Mumbai, India, 1 March 2015; pp. 1–6. [Google Scholar]
- Mittal, A.; Soundararajan, R.; Bovik, A.C. Making a “Completely Blind” Image Quality Analyzer. IEEE Signal Process. Lett. 2013, 20, 209–212. [Google Scholar] [CrossRef]


| Reinhard (2012) [5] | L1L0 | iCAM06 | Kwon et al. [12] | Proposed | |
|---|---|---|---|---|---|
| LPC_SI (↑) | |||||
| CPBD (↑) | |||||
| MCMA (↑) | |||||
| TMQI (↑) | |||||
| NIQE (↓) | |||||
| PIQE (↓) |
Disclaimer/Publisher’s Note: The statements, opinions and data contained in all publications are solely those of the individual author(s) and contributor(s) and not of MDPI and/or the editor(s). MDPI and/or the editor(s) disclaim responsibility for any injury to people or property resulting from any ideas, methods, instructions or products referred to in the content. |
© 2024 by the authors. Licensee MDPI, Basel, Switzerland. This article is an open access article distributed under the terms and conditions of the Creative Commons Attribution (CC BY) license (https://creativecommons.org/licenses/by/4.0/).
Share and Cite
Kim, Y.-J.; Son, D.-M.; Lee, S.-H. Retinex Jointed Multiscale CLAHE Model for HDR Image Tone Compression. Mathematics 2024, 12, 1541. https://doi.org/10.3390/math12101541
Kim Y-J, Son D-M, Lee S-H. Retinex Jointed Multiscale CLAHE Model for HDR Image Tone Compression. Mathematics. 2024; 12(10):1541. https://doi.org/10.3390/math12101541
Chicago/Turabian StyleKim, Yu-Joong, Dong-Min Son, and Sung-Hak Lee. 2024. "Retinex Jointed Multiscale CLAHE Model for HDR Image Tone Compression" Mathematics 12, no. 10: 1541. https://doi.org/10.3390/math12101541
APA StyleKim, Y.-J., Son, D.-M., & Lee, S.-H. (2024). Retinex Jointed Multiscale CLAHE Model for HDR Image Tone Compression. Mathematics, 12(10), 1541. https://doi.org/10.3390/math12101541