Article

From Cell–Cell Interaction to Stochastic and Deterministic Descriptions of a Cancer–Immune System Competition Model

1
Laboratoire de Physique Théorique de la Matière Condensée, Sorbonne Université-CNRS, 4 Place Jussieu, Case Courrier 121, CEDEX 05, 75252 Paris, France
2
EFREI Research Lab, Université Paris-Panthéon-Assas, 30/32 Avenue de la République, 94800 Villejuif, France
*
Author to whom correspondence should be addressed.
Mathematics 2023, 11(9), 2188; https://doi.org/10.3390/math11092188
Submission received: 19 April 2023 / Revised: 29 April 2023 / Accepted: 3 May 2023 / Published: 6 May 2023
(This article belongs to the Section Mathematical Biology)

Abstract

:
We consider a cell–cell interaction model of competition between cancer cells and immune system cells, first introduced in the framework of the thermostatted kinetic theory, and derive a master equation for the probability of the number of cancer cells and immune system cells for a given activity. Macroscopic deterministic equations for the concentrations and mean activities of cancer cells and immune system cells are deduced from the kinetic equations. The conditions for which the 3Es of immunotherapy (elimination, equilibrium, and escape) are reproduced are discussed. Apparent elimination of cancer followed by a long pseudo-equilibrium phase and the eventual escape of cancer from the control of the immune system are observed in the three descriptions. The macroscopic equations provide an analytical approach to the transition observed in the simulations of both the kinetic equations and the master equation. For efficient control of activity fluctuations, the steady states associated with the elimination of either cancer or immune system disappear and are replaced by a steady state in which cancer is controlled by the immune system.

1. Introduction

Boosting the immune system to fight against cancer is one of the strategies developed in oncology [1,2,3,4]. In the presence of antigens released by pathogens such as viruses and cancer cells, the adaptive immune system produces specific lymphocytes, B cells, able to synthesize antibodies and label an invasive cell for destruction by other lymphocytes, killer T cells, whose production and learning is activated. Simultaneously, regulatory T cells are produced to prevent an excess of killer T cells and are detrimental autoimmune reactions. Fighting cancer in the framework of immunotherapy is nevertheless complex because of an analogous adaptation of cancer cells, which learn to protect against the attack of killer T cells [3,5]. For some cancers, immunotherapy results in a long remission that eventually leads to a fatal outcome, reflecting the complex relationships between cancer and the immune system. This phenomenon, known as the 3Es—elimination, equilibrium, and escape of cancer—begins with an apparent elimination of cancer cells, successfully attacked by killer T cells, before cancer cells learn to deceive the immune system and wrongly incite regulatory T cells to decimate killer T cells [6,7].
Biological models traditionally describe the interactions between cancer and the immune system at either the molecular scale [8,9,10] or the macroscopic scale [11,12]. Typically, these models incorporate intricate interaction networks between numerous actors, such as molecules, tissues, organs, and the lymphatic and vascular systems. These networks involve feedback loops, enabling qualitative conclusions about the stimulation or inhibition of a particular effect [1,2,4,13,14,15].
In parallel, physicists have developed a large number of macroscopic models, including the description of oscillations in the population of cancer cells [16,17,18,19,20,21,22,23] and the mechanical coupling between a tumor and the surrounding tissue [24,25,26] without, however, weaving direct links with the phenomena occurring at a lower scale, while insisting on the multi-scale nature of the problem [27,28,29]. Reference [30] provides a recent review. We developed a model of competition between cancer and immune system at the cellular scale in the framework of the thermostatted kinetic theory, which reproduces cell proliferation and learning during appropriate cell–cell interactions, possibly leading to an increase in a real quantity called cell activity [31,32,33,34,35]. The originality of the model consists of introducing a thermostat that controls activity fluctuations in order to reproduce the dissipation of information induced by cell death and, more generally, all processes that are not explicitly taken into account in the chosen model of cell–cell interactions.
We have shown that the simulations of the kinetic equations for the distribution functions of the activity in a homogeneous system [36,37] and the distribution functions of activity, position, and velocity for the different cell types in an inhomogeneous system [38] satisfactorily account for the 3Es. In this context, an inhomogeneous description refers to a spatial description, including the shape and evolution of cell clusters, whereas homogeneous refers to a uniform system in which cell interactions are supposed to be independent of space. The assumption of homogeneity is reasonable at an early stage of cancer development as well as for a solid tumor and blood cancers, before the onset of metastasis.
The simulations, based on the direct simulation Monte Carlo (DSMC) method [39,40,41,42,43], also revealed the existence of a transition as activity thermalization becomes more efficient. For large fluctuations of cell activity, the final states correspond to the elimination of either cancer or the immune system, while cancer is controlled by the immune system for a sufficiently strong thermalization [37].
Our goal in this paper is to link the different scales, from the kinetic equations to the macroscopic equations, through a stochastic description. Bridging the gap between cell–cell interactions and differential equations for macroscopic quantities can help to establish the credibility of what were, until now, phenomenological models. The analytical calculations were carried out under different assumptions, from the small number of different cell types and processes to the absence of spatial dependence. However, a minimal framework offers the possibility of relating an ingredient of the model with an outcome without ambiguity, leading to a clear relationship between a cause and an effect through a precise mechanism. In addition, we propose a general method to derive a macroscopic model from kinetic equations, which can be applied to more complex, space-dependent models of cell interactions in order to account for observed effects that would not be included in the present minimal model.
The paper is organized as follows. The various approaches are presented in Section 2. Section 2.1 recalls the main lines of the model that we initially introduced in the framework of the thermostatted kinetic theory [36,37,38]. The kinetic equations for the activity distributions of each cell type are given in Section 2.2 in the case of a homogeneous system. We develop a stochastic approach in Section 2.3. The cell–cell interactions are interpreted as elementary processes with well-defined transition rates for which a master equation for the number of cancer cells and immune system cells of given activity can be derived. We propose a kinetic Monte Carlo algorithm inspired by Gillespie to solve the master equation and address the problem of prohibitive computation times induced by the possible interaction of a cell with all cells of smaller activity [44]. The macroscopic deterministic equations for the concentrations and mean activities of cancer cells and immune system cells are derived from the kinetic equations in Section 2.4.
Section 3 is devoted to the comparison of the results of the three approaches. Special attention is given to the 3Es in the descriptions at different scales. The transition toward cancer control predicted by the simulations of the kinetic equations for an efficient control of activity fluctuations is interpreted in the framework of an analytical macroscopic approach.
Section 4 contains conclusions and perspectives.

2. Descriptions of Cancer and Immune System Competition at Three Different Scales

2.1. A Model at Cell Scale

The interactions between cancer and the immune system are complex and involve different types of immune system cells, such as dendritic cells, B cells, killer T cells, and regulatory T cells. Dentritic cells, present in the innate immune system, are able to ingest cancer cells, isolate antigens, and incite the production of B cells. B cells produce antibodies specific to a pathogen, which bind to the surface of an invading cell and mark it for destruction by T cells. Effector T cells, also known as killer T cells, attack cancer cells, learn during interaction, and modify their behavior accordingly [45,46]. In addition to actively proliferating cells, quiescent cancer stem cells [47,48] have recently been shown to pre-exist treatment and to play a role in the escaping phenomenon [49,50].
In the minimal framework chosen, the model governing cell dynamics introduces a small number of processes that combine several phenomena, such as interactions, activation, proliferation, and death through binary encounters. The proliferation of cells of a certain nature is accompanied by the death of cells of another nature, in an analogous way to an autocatalytic chemical process. In chemical kinetics, autocatalysis [51] refers to the formation of a product that is also a reactant, so that the presence of the product influences the rate of its own formation. Specifically, an initially small amount of product first results in a small formation rate. Then, as the product is formed, the reaction accelerates. Autocatalysis is a key ingredient in observing a dynamic behavior with an induction period before an explosion [43,52], which typically characterizes the 3Es of immunotherapy, i.e., the final escape of cancer from immunosurveillance after a long apparent equilibrium phase. Hence, the model introduces binary, autocatalytic cell–cell interactions inspired by the Fisher–Kolmogorov–Petrovsky–Piskunov (FKPP) model [11,53,54,55]. Typically, the FKPP model involves two species, A and B, which interact to lead to the formation of 2 A species and has been introduced to model the propagation of a favored trait or a virus into a population.
In order to replicate the activation and learning processes that impact both immune system and cancer cells, we incorporate the findings of various research groups [31,32,56,57]. We link each cell to a quantity called activity, which is expected to rise during specific cellular interactions. A cell with high activity denotes an educated cell. For a cell of the immune system, the activity measures the degree of learning acquired by exposure to an antigen [45,46]. For a cancer cell, the activity measures the degree of invisibility achieved by learning from contact with cells of the immune system [58]. The activity of a normal cell reflects its stage of evolution, from a fully healthy cell to a precancerous cell.
Interactions between antigen-presenting cells and cancer cells can lead to the proliferation of killer T cells, i.e., increased activity of immune system cells, as well as to the proliferation of cancer cells that have learned to hide, i.e., increased activity of cancer cells [48,50]. Hence, the model introduces autocatalytic processes inspired by the FKPP model in which the interaction between an immune system cell and a cancer cell may lead to the formation of either two immune system cells or two cancer cells. The choice between these two options depends on the activity of the interacting cells. During an interaction, the more active cell is supposed to lead to its autocatalytic formation, to the detriment of the less active cell. Moreover, the interaction is involved in the learning process and increases the activity of the interacting cell with an already larger activity than the encounter.
Modeling the proliferation of cancer cells requires a source of cells. To meet this goal, we introduce a reservoir of normal cells and an interaction between a cancer cell and a normal cell that leads to two cancer cells. The reservoir of normal cells keeps their number constant but not their activities. The results given in the following show that the mean activity of the normal cells varies, although to a lesser extent than the average activities of the cancer cells and immune system cells.
The activity-dependent interactions among cancer cells c, immune cells i, and normal cells n are schematically represented in Figure 1 and will be more precisely described subsequently.
Modeling cancer escape typically requires a far-from-equilibrium system [51]. In particular, if the total number of cells is not conserved, neither is the total activity of the system. In agreement with biological requirements, we initially introduce some variability in the activation state of the cells. By analogy with the distribution of the norm of the velocity of a particle in the case of a dilute gas and to ensure a distribution of the activity over real positive numbers, a Maxwellian distribution for the activity u should be chosen [59]. For simplicity and for a mean value u j 0 that is large in the face of the standard deviation σ , the initial activities of the cells of type j are sampled from Gaussian distribution P j ( u ) :
P j ( u ) = 1 2 π σ exp ( u u j 0 ) 2 2 σ 2 .
In addition, we assume the system to be homogeneous, i.e., that each cell has the same environment so that the probability of a cell encountering another cell does not depend on their position and velocity.
In the case of a solid tumor, the immune system cells migrate in the circulatory system toward the cancer cells at a fast rate [14] compared to the interaction rates with cancer cells, so that a space-averaged description of cell interactions is sufficient. Under this condition, space can be omitted from the description. Clearly, this hypothesis prevents the deformation of the solid tumor shape. However, the homogeneous model interestingly gives access to the evolution of the total number of cancer cells. It therefore accounts for the evolution of the size of a localized tumor during its early development, before the formation of metastases. Basal cell carcinoma, the most common type of skin cancer, is unlikely to spread to distant areas [60]. Distant metastasis from laryngeal cancer is also not often observed [61]. Moreover, at the beginning of their formation, cancers of most organs, still at the stage of carcinoma in situ, do not present lymph node invasion and can therefore be described locally, without recourse to the notion of metastases.
The homogeneous model is also valid in the opposite case of efficient cancer cell migration as in the case of blood cancers, such as leukemia and lymphoma, for which blood homogeneity is precisely ensured by the fast spreading of cells, including malignant cells, in the circulatory system. The further evolution of leukemia is known to possibly induce invasion into specific tissues that can obviously not be described in the homogeneous case and would require a space-dependent model [62].
Too many variables associated with different parameters may blur the information that can be deduced from the model, preventing us from clearly relating a hypothesis to a given behavior. As a consequence, we chose to introduce three cell types, immune system cells i, cancer cells c, and normal cells n. The immune system cells i with a high activity have some of the properties of the killer T cells since they are able to destroy cancer cells. Cancer cells c with a high activity can be considered actively proliferating cells. However, introducing cell activity amounts to considering a large number of cell types. Specifically, cancer cells with a small activity maintain some properties of quiescent cancer cells, likely to slowly acquire a larger activity. Moreover, the model should possess a kind of modulatory mechanism in order to ensure that cancer proliferation or, in contrast, cytokine storm [63] is not the only outcome. In some way, the model should include the notion of regulatory T cells able to limit the production of killer T cells. As explained below, the notion of thermostat plays the role of regulator of activity fluctuations, and the activity-dependent rates of interaction processes also ensure a certain feedback loop [64]. It should be noted that the minimal framework chosen did not prevent the model from reproducing the escape of cancer from immunosurveillance as well as coexistence [36,37].
Bearing all the above in mind, we introduce the three following autocatalytic processes:
i ( u ) + c ( u ) k i c ( u u ) H ( u u ) i ( u + ϵ ) + i ( u )
c ( u ) + i ( u ) k c i ( u u ) H ( u u ) c ( u + ϵ ) + c ( u )
c ( u ) + n ( u ) k c n ( u u ) H ( u u ) c ( u + ϵ ) + c ( u ) R n ( u )
where the constants k i c , k c n , and k c i do not depend on space according to the assumption of homogeneity, and ϵ is a small activity increase compared to the initial mean value u j 0 . In the first (second, resp.) process, an immune system (cancer, resp.) cell of activity u kills a cancer (immune system, resp.) cell of activity u , and two immune system (cancer, resp.) cells are produced. In the third process, a normal cell of activity u is killed by a cancer cell of activity u and, simultaneously, another normal cell is injected in the system by the reservoir R, which maintains the total number of normal cells constant. The activity u of the injected normal cell is sampled from the Gaussian distribution P n ( u ) given in Equation (1) for j = n .
The binary interactions given in Equations (2)–(4) gather different effects and should not be interpreted literally in terms of biological phenomena. Specifically, cancer cells do not need to kill immune cells as in Equation (3) or to kill normal cells as in Equation (4) to proliferate. However, active cancer cells are likely to slow down the production of killer T cells by deceiving the immune system. Hence, Equation (3) incorporates both the action of active cancer cells on the immune system and the proliferation of cancer cells, which is in turn favored by the slightest alertness of the immune system. Similarly, Equation (4) accounts for the proliferation of cancer cells as well as the transformation of precancerous normal cells into cancer cells. In addition, the process given in Equation (4) offers a minimal framework to incorporate a reservoir of activity into the system. Each of the three processes only occurs for u > u , as indicated by the Heaviside step function H ( u u ) . In order to introduce an activity-dependent rate in addition to the Heaviside function, we assumed the rate to be proportional to the difference of cell activities u u . This property may induce a nontrivial feedback loop [64]. Assume that, at a given time, the activities of the cancer cells become larger than the activities of the immune system cells on average. Then, the rate constant of Equation (3) associated with the autocatalytic production of cancer cells increases and, as desired, cancer cells of high activity reproduce faster, and the number of cancer cells increases. However, the realization of the process given in Equation (3) tends to remove the immune system cells with a small activity from the system. Depleting the population of immune system cells from their low-activity members leads to an increase in their mean activity. When the mean activity of the immune system cells becomes larger than the mean activity of the cancer cells, the process given in Equation (3) becomes less probable and slower, whereas the process given in Equation (2) associated with the killing of cancer cells becomes more probable and faster. The number of cancer cells then tends to decrease. Hence, the activity-dependence of the rate constants introduces a certain regulation into the system.
Despite this kind of regulation and, due to the activity increase by the small amount ϵ for the interacting cell with an already larger activity than the other encounter, the minimal scheme of cell–cell interactions inherently includes the possible increase of cell activity in an uncontrolled, unrealistic manner. Many other events than the processes given in Equations (2)–(4) affect cell fate. As already mentioned, the production of regulatory T cells limits the number of killer T cells and prevents immune system overactivity [3,5]. More generally, cell death due to activity-independent processes also removes poorly, moderately, and highly educated cells from the system, which reduces the standard deviation of activity and controls activity fluctuations [65]. Cell death due to causes other than the interactions given in Equations (2)–(4) dissipates information and regulates the fluctuations of activity. Cell death affects all cell types. Even memory T cells, first believed to live for years, have a relatively short lifespan of a few months. The dynamic view of the population of memory T cells accounts for memory transmission over years within a group of cells in perpetual renewal without requiring very long lifetimes [66]. An efficient way to incorporate the effect of hidden, activity-independent processes without needing to identify them is to introduce a so-called thermostat of activity [32,33,34,35,67].
In analogy to Newton’s law in a dissipative system of friction α in the presence of a field E, the cell activity u is supposed to obey
d u d t = E α u
exactly as the velocity v of a massive particle governed by friction in a gravitational field E. For a mechanical system containing a large number of particles, dissipation regulates the fluctuations of kinetic energy, i.e., the second moment v 2 of the velocity, where . denotes an ensemble average [67,68]. The proportionality of v 2 to temperature explains the use of the word thermostat [59]. In the case of the interactions between cancer and immune system cells, dissipation of information through cell death and other non-explicit, activity-independent processes regulates the fluctuations of the second moment u 2 of the activity. By stating that u 2 remains constant, i.e., u d u d t = 0 , and using Equation (5), we find
α = E u / u 2 ,
which relates the friction α to the field E.
We consider a single field E and the same friction coefficient α for all cell types. A field E j and a friction coefficient α j associated with the thermalization of activity of each cell type j = i , c , n could be introduced in order to account for the different hidden dissipative processes that may differently affect cells depending on their nature. However, this would increase the number of parameters unnecessarily in a model aimed at showing qualitative behaviors. If application to specific clinical results and quantitative predictions is desired, the minimal model could be extended, and an analogous study could then be conducted for different fields E j .

2.2. Thermostatted Kinetic Theory Framework

We developed a description of the interactions between immune system cells i, cancer cells c, and normal cells n based on the model presented in the previous section and in the framework of the thermostatted kinetic theory [36,37]. In the case of the minimal model developed in this paper, the spatial dependence is omitted so that the distribution function f j ( t , u ) of each cell type j = i , c , n depends on time and cell activity u but not on cell position and velocity. In such a homogeneous description, the distribution function obeys the following kinetic equation [32,38,59,67,68]:
t f j ( t , u ) = u ( ( E α u ) f j ( t , u ) ) + I j ,
where I j represents the interaction operator. For the interaction scheme described in Equations (2)–(4), the interaction operators are defined as follows:
I i = R + k i c ( u ϵ u ) H ( u ϵ u ) f i ( t , u ϵ ) f c ( t , u ) d u R + k i c ( u u ) H ( u u ) f i ( t , u ) f c ( t , u ) d u + R + k i c ( u u ) H ( u u ) f c ( t , u ) f i ( t , u ) d u R + k c i ( u u ) H ( u u ) f c ( t , u ) f i ( t , u ) d u
for the immune system cells i,
I c = R + k c n ( u ϵ u ) H ( u ϵ u ) f c ( t , u ϵ ) f n ( t , u ) d u R + k c n ( u u ) H ( u u ) f c ( t , u ) f n ( t , u ) d u + R + k c n ( u u ) H ( u u ) f c ( t , u ) f n ( t , u ) d u R + k i c ( u u ) H ( u u ) f i ( t , u ) f n ( t , u ) d u + R + k c i ( u ϵ u ) H ( u ϵ u ) f c ( t , u ϵ ) f i ( t , u ) d u R + k c i ( u u ) H ( u u ) f c ( t , u ) f i ( t , u ) d u + R + k c i ( u u ) H ( u u ) f c ( t , u ) f i ( t , u ) d u
for the cancer cells c, and
I n = R + k c n ( u u ) H ( u u ) f c ( t , u ) f n ( t , u ) d u + P n ( u ) R + R + k c n ( u u ) H ( u u ) f c ( t , u ) f n ( t , u ) d u d u
for the normal cells n. The interaction operators, denoted by I j , play a crucial role in accounting for the cellular processes that alter the behavior of cells of type j, where j represents one of the three cell types: i , c , n . For instance, we explain the construction of the interaction operator I i associated with immune cells. In Equation (8), the first three terms correspond to the process described in Equation (2). The first and third terms account for the positive contributions to the immune cell’s distribution function, representing the evolution of immune cell activity after the interaction between immune and cancer cells. The first term represents the formation of an immune cell of activity u from an immune cell of activity u ϵ before interaction, while the third term assigns the activity u of the disappearing cancer cell to a newly formed immune cell. In contrast, the second term is negative and signifies the loss of immune cells with activity u due to their transformation into immune cells of activity u + ϵ . The fourth accounts for the process described in Equation (3). Eventually, these contributions are obtained by integrating over all activities the u of the interacting cancer or immune cells. The construction of the interaction operator I c is similar to that of I i , and the interaction operator I n has a specific term related to the effect of the normal cell reservoir. In Equation (10), the second term represents the introduction of normal cells of activity u into the system at a rate given by the consumption of normal cells k c n ( u u ) H ( u u ) associated with the interaction between a cancer cell and a normal cell. The activity u of the introduced normal cell is sampled from the distribution P n ( u ) given in Equation (1).
We have modified the direct simulation Monte Carlo (DSMC) method [39,40], originally devised to simulate the Boltzmann equations for a dilute gas [59], to simulate cell dynamics [36,37,38]. We have shown that, for appropriate parameter values, the evolution of the number of cancer cells reproduces a clinically observed phenomenon, the so-called 3Es—elimination, equilibrium, and escape of cancer—of immunotherapy [7]. The number of cancer cells initially drops then remains in a pseudo-steady state and finally explodes [36,37,38]. We observed the 3Es in both a homogeneous system [36,37] and an inhomogeneous system [38]. In the next section, we focus on the derivation of the master equation associated with the elementary processes given in Equations (2)–(4) and the thermostat defined in Equation (5) in a homogeneous system.

2.3. Stochastic Description by a Master Equation

The model of competition between cancer cells and immune system cells that we introduced involves two types of phenomena: binary cell interactions and thermalization of cell activities. The interactions given in Equations (2)–(4) can be considered elementary random processes associated with well-defined transition rates, for which a master equation can be a priori derived. We admit that the action of the thermostat occurs at a larger timescale than cell–cell interactions and concentrate on the stochastic description of the binary interactions between cells.
The main difficulty is related to the dependence of the transition rates on the activities of two interacting cells. According to the process given in Equation (2), an immune system cell of activity u may interact with all the cancer cells of activity smaller than u. Similarly, according to Equations (3) and (4), a cancer cell of activity u may interact with all immune system cells and normal cells of activity smaller than u. Moreover, cell activity may exponentially increase due to the autocatalytic nature of the processes. Considering all the possible interactions between a cell and cells of appropriate type of smaller activity, this implies an exponentially increasing computation time. We solve the problem by introducing a discretized activity according to a logarithmic scale of base b
u ( k ) = u 0 b k
where k is an integer and where we assume a lower bound of activity u 0 = u ( 0 ) .
The transition rates w j j ( N j ( u ( k ) ) , N j ( u ( k ) ) ) associated with the elementary processes given in Equations (2)–(4) are written as
w j j ( N j ( u ( k ) ) , N j ( u ( k ) ) ) = k j j Ω 2 u ( k ) u ( k ) H ( k k ) N j ( u ( k ) ) N j ( u ( k ) )
where j , j = i , c , n , Ω is the size of the system (typically, the volume), and N j ( u ( k ) ) is the number of cells of type j with activity u ( k ) . The master equation reads
d P ( ϕ ) d t = k = 1 k = 0 k 1 w i c ( N c ( u ( k ) ) + 1 , N i ( u ( k ) ) + 1 ) P ( ϕ i c ) + w c i ( N i ( u ( k ) ) + 1 , N c ( u ( k ) ) + 1 ) P ( ϕ c i ) + w c n ( N n ( u ( k ) ) + 1 , N c ( u ( k ) ) + 1 ) k = 0 P ( ϕ c n ) w i c ( N c ( u ( k ) ) , N i ( u ( k ) ) ) + w c i ( N i ( u ( k ) ) , N c ( u ( k ) ) ) + w c n ( N n ( u ( k ) ) , N c ( u ( k ) ) ) P ( ϕ )
where the configurations ϕ , ϕ i c , ϕ c i , and ϕ c n are given by
ϕ = { N i ( u ( 0 ) ) , N c ( u ( 0 ) ) , N n ( u ( 0 ) ) , . . . , N i ( u ( k ) ) , N c ( u ( k ) ) , N n ( u ( k ) ) , . . . , N i ( u ( k ) ) , N c ( u ( k ) ) , N n ( u ( k ) ) , . . . }
ϕ i c = { N i ( u ( k ) ) 1 , N c ( u ( k ) ) + 1 , N i ( u ( k ) ) + 1 , N i ( u ( k ) + ϵ ) 1 }
ϕ c i = { N i ( u ( k ) ) + 1 , N c ( u ( k ) ) 1 , N c ( u ( k ) ) + 1 , N c ( u ( k ) + ϵ ) 1 }
ϕ c n = { N c ( u ( k ) ) 1 , N n ( u ( k ) ) + 1 , N c ( u ( k ) ) + 1 , N c ( u ( k ) + ϵ ) 1 , N n ( u ( k ) ) 1 } .
Only the number of cells differing from the default values shown in ϕ are explicitly written in ϕ i c , ϕ c i , and ϕ c n . In Equation (17), u ( k ) is the activity of the normal cell injected into the system by the reservoir R according to the Gaussian distribution given in Equation (1). The configurations ϕ i c , ϕ c i , and ϕ c n involve increased activities u ( k ) + ϵ that need to be associated with an integer l such that u ( k ) + ϵ = u ( l ) , with u ( l ) obeying Equation (11). The trivial expression
l = log b u ( k ) + ϵ u 0 ,
where . is the floor function, is acceptable as soon as it leads to an integer different from k . However, for a high activity u ( k ) ϵ , using Equation (18) would lead to l = k , which would amount to ignoring learning during interactions. In this case, the problem is solved by imposing l = k + 1 with probability p = ϵ u ( k + 1 ) u ( k ) and l = k with probability 1 p .
The Gillespie algorithm is used to simulate stochastic trajectories for the number of cells of a given activity [44]. Specifically, an interaction process is randomly chosen with the appropriate probability after an exponentially distributed transition time t G . Thermalization is performed at a larger time scale than the interactions. A constant time step, Δ t , larger than the typical transition time t G associated with an interaction, is introduced. The friction coefficient α is updated each Δ t using Equation (6), and the activities are thermalized according to the equation
u ( k , t + Δ t ) = u ( k , t ) + Δ t ( E α u ( k , t ) ) , k
in a similar manner as in DSMC simulations [36,37].

2.4. Derivation of the Macroscopic Equations from the Kinetic Equations

In this section, we derive the deterministic equations governing the evolution of the concentrations and activities of the different cell types from the kinetic equations given in Equation (7).
The macroscopic quantity A j associated with species j = i , c , n is the average of the microscopic quantity a, obtained by integrating the product of a and the distribution function f j ( t , u ) over u
A j = a = 1 ρ j R + a ( t , u ) f j ( t , u ) d u
where
ρ j = R + f j ( t , u ) d u
is the concentration of cells of type j in the system. The activity of the j cells is then
U j = 1 ρ j R + u f j ( t , u ) d u .
Integrating the kinetic equations given in Equation (7) over u, we derive the macroscopic equations for the concentrations ρ j . Multiplying the kinetic equations by u and integrating over u, we obtain the macroscopic equations of the activities U j as:
d ρ j d t = R + I j d u
d U j d t = ( E α U j ) U j ρ j d ρ j d t + 1 ρ j R + u I j d u .
The main hypothesis allowing us to derive simple analytical deterministic equations is the following. We assume that the distribution function f j depends on the activity according to the following Dirac distribution:
f j ( t , u ) = ρ j δ ( u U j ) .
Using the expression of the interaction operators given in Equations (8)–(10), we find that the deterministic equations of the concentrations ρ i , ρ c , and ρ n and the activities U i , U c , and U n are given by:
d ρ i d t = k i c ( U i U c ) H ( U i U c ) ρ i ρ c k c i ( U c U i ) H ( U c U i ) ρ i ρ c
d ρ c d t = k c n ρ n ( U c U n ) H ( U c U n ) ρ c k i c ( U i U c ) H ( U i U c ) ρ i ρ c + k c i ( U c U i ) H ( U c U i ) ρ i ρ c
d ρ n d t = 0
d U i d t = E α U i + k i c ( U c U i + ϵ ) ( U i U c ) H ( U i U c ) ρ c
d U c d t = E α U c + k c n ρ n ( U n U c + ϵ ) ( U c U n ) H ( U c U n ) + k c i ( U i U c + ϵ ) ( U c U i ) H ( U c U i ) ρ i
d U n d t = E α U n + k c n ( U c U n ) H ( U c U n ) ( U n 0 U n ) ρ c .
In the macroscopic description, the first and second moments of activity fluctuations are meaningless, and the friction term α cannot be computed according to Equation (6). Consequently, the comparison of the results deduced from the macroscopic equations and the master equation requires that Equations (29)–(31) are solved for α values deduced from the master equation.

3. Results

The master equation given in Equation (13) and the deterministic equations given in Equations (26)–(31) are solved for the same parameter values, and the typical behaviors obtained are compared to the results that we previously deduced from the direct simulation of the kinetic equations given in Equations (7) using the direct simulation Monte Carlo (DSMC) method [36,37,38].

3.1. Kinetic Monte Carlo Simulations of the Master Equation

The simulation of the kinetic equations has revealed the crucial role played by the thermostat in the cancer–immune system competition [36,37,38]. All types of behaviors encountered when varying all parameters that have been obtained simply by increasing the field E, with all other parameters being set. Specifically, a transition is observed as the field exceeds a critical value associated with the 3Es. For smaller fields, i.e., a poor thermalization of cell activity, the system eliminates either all cancer cells or all immune system cells. For fields larger than the critical field, i.e., efficient thermalization of cell activity, the system ends in a steady state with both cancer cells and immune system cells; cancer is controlled.
In this section, we investigate the behavior of the system deduced from the master equation for variable field E.
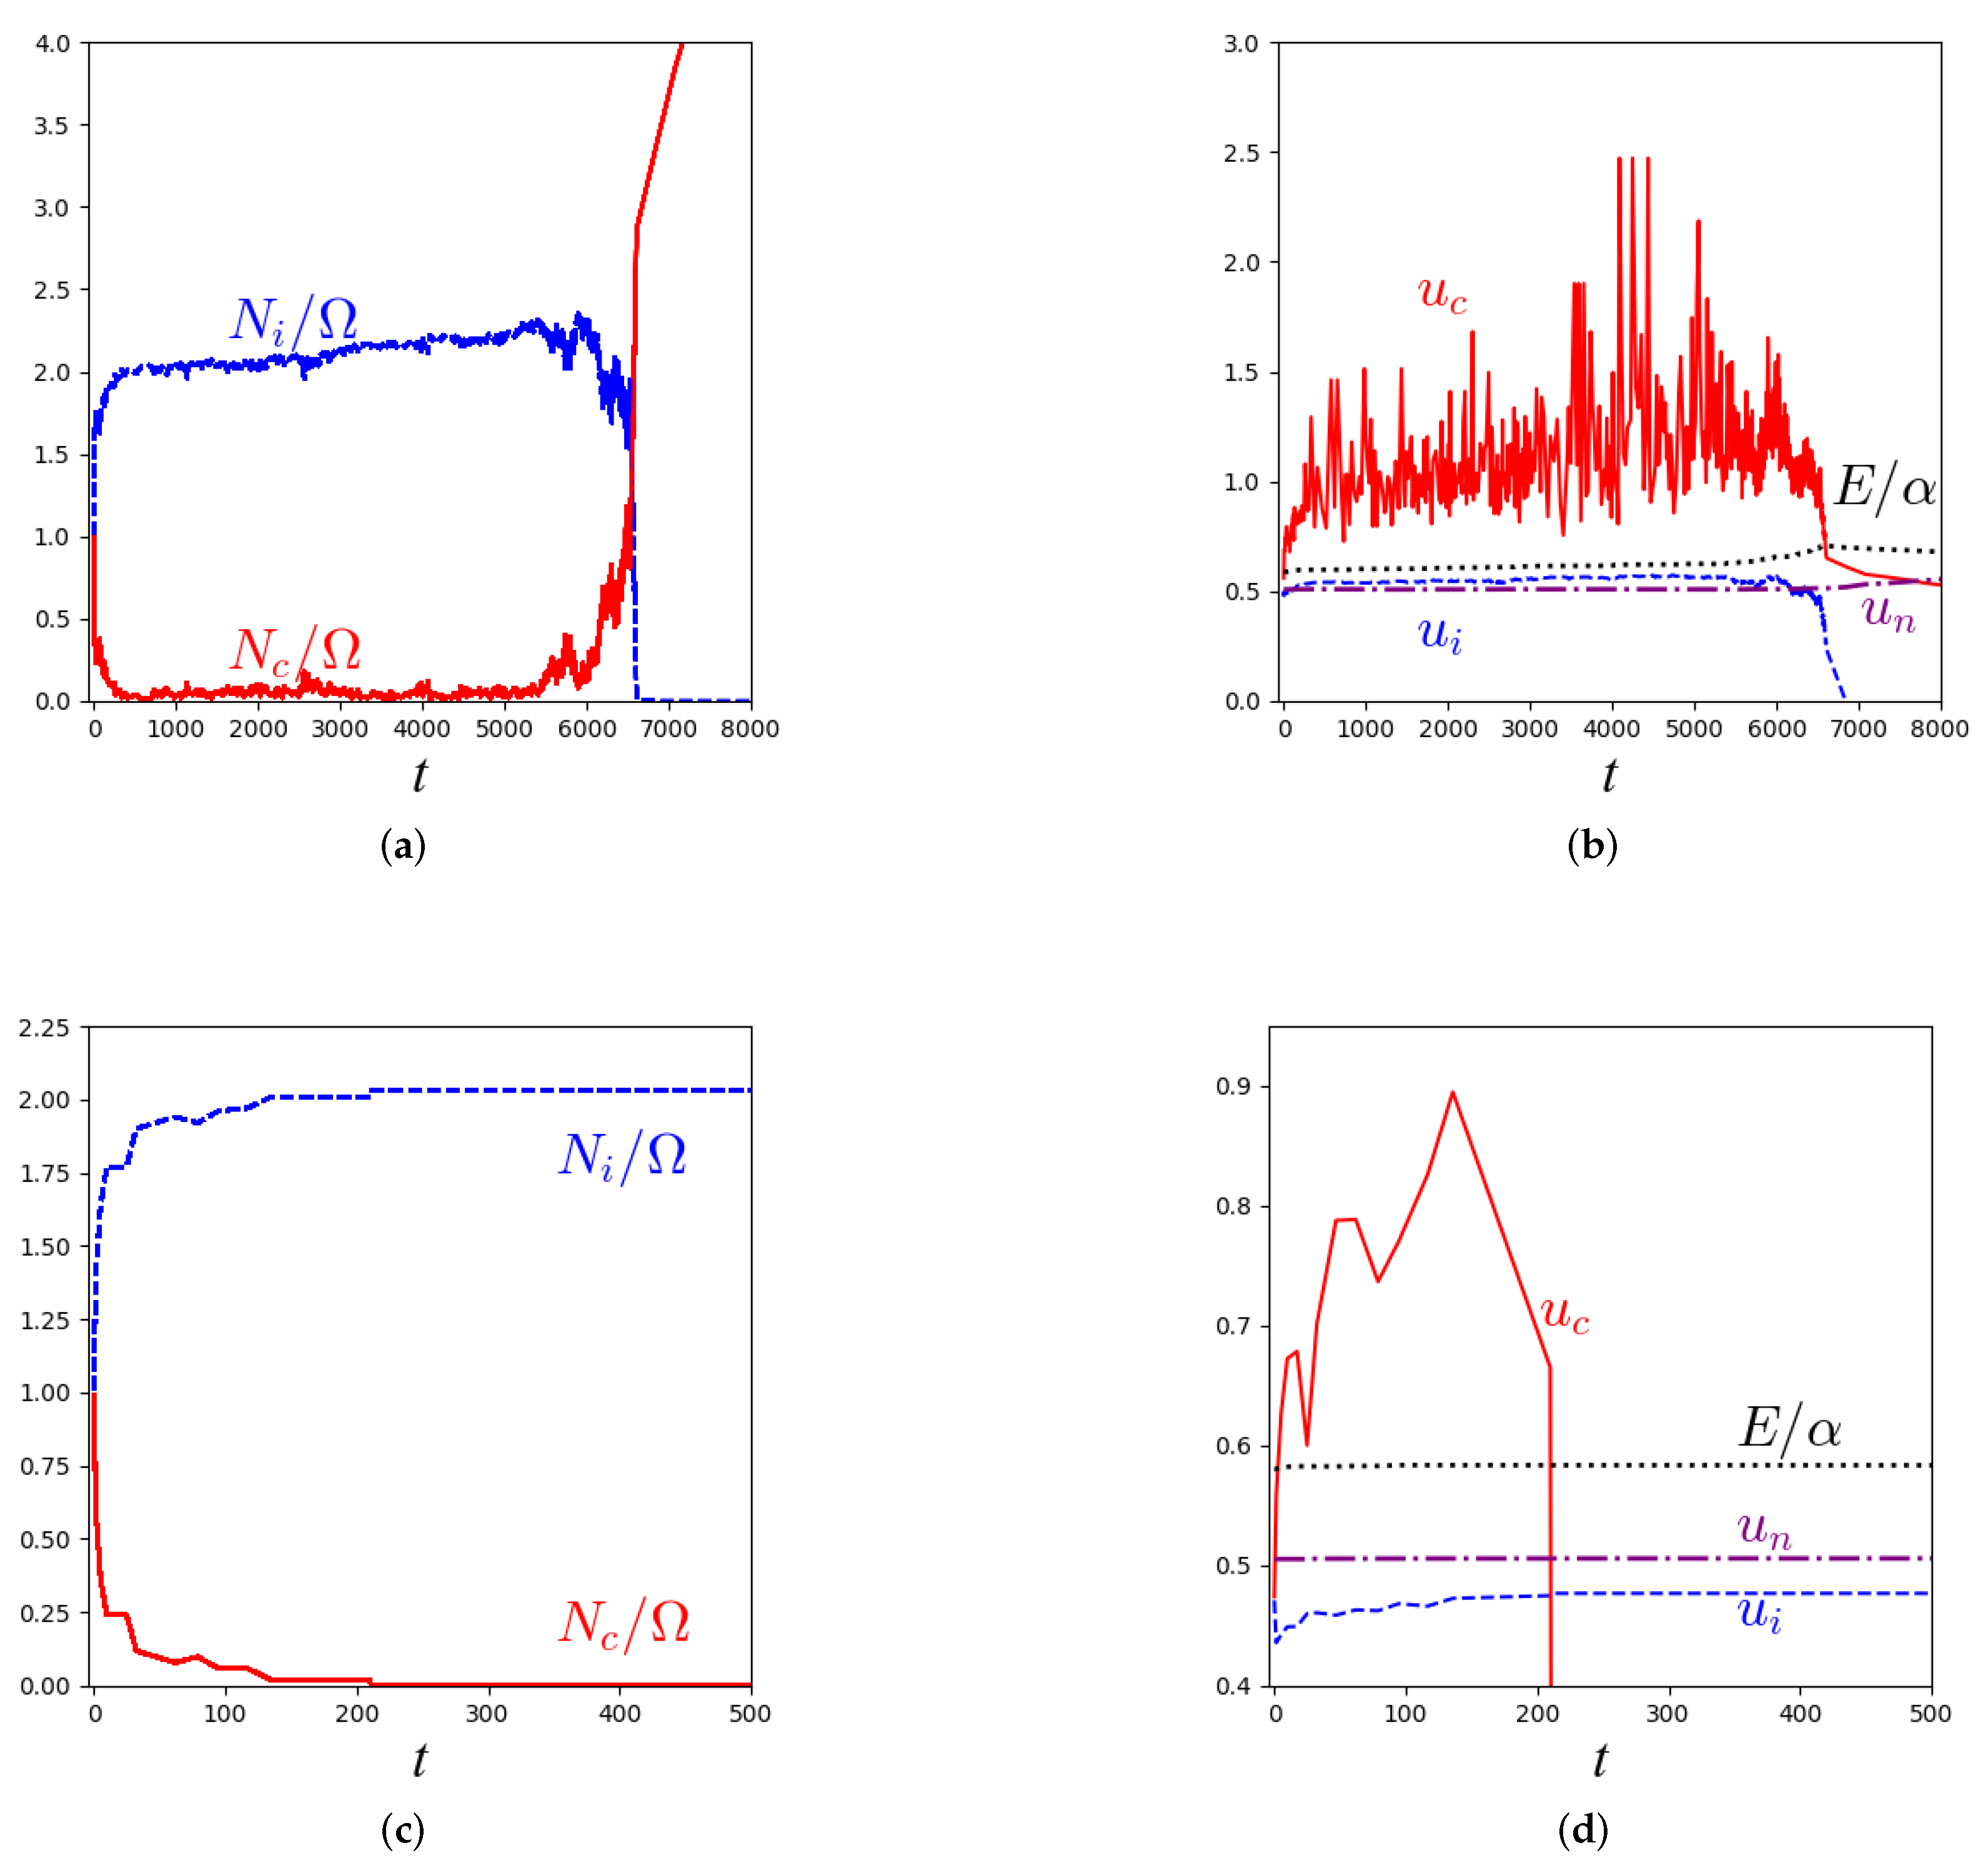
Figure 2 gives the evolution of the total number N c of cancer cells, the total number N i of immune system cells, the mean activities u c of cancer cells, and the mean activities u i of immune system cells in a homogeneous system deduced from the master equation for a small value of the field E. We observe two typical behaviors depending on the seed of the random number generator. Figure 2a,b illustrates the 3Es of immunotherapy, i.e., a quasi-instantaneous decrease of the number of cancer cells followed by an induction period and the final divergence of N c , while the final number of immune system cells N i end vanishes. If the field is sufficiently small, the system does not reach a steady state, since u c is driven far from E / α due to the learning process and the interactions with the reservoir of normal cells.
Figure 2c,d illustrates the stabilization into an absorbing state associated with a final vanishing number of cancer cells and activities u i and u n frozen at the values reached when N c = 0 . Interestingly, the friction coefficient α is found to be of the same order of magnitude as the field E during the evolution. We observe that the final steady state corresponding to N c end = 0 results from a fluctuation during the period associated with a small N c value, which would have been followed by the explosion of N c as in Figure 2a,b otherwise. It should be noted that, for all 30 seeds of the random number generator that we considered, the final states are characterized by either N i end = 0 or N c end = 0 .
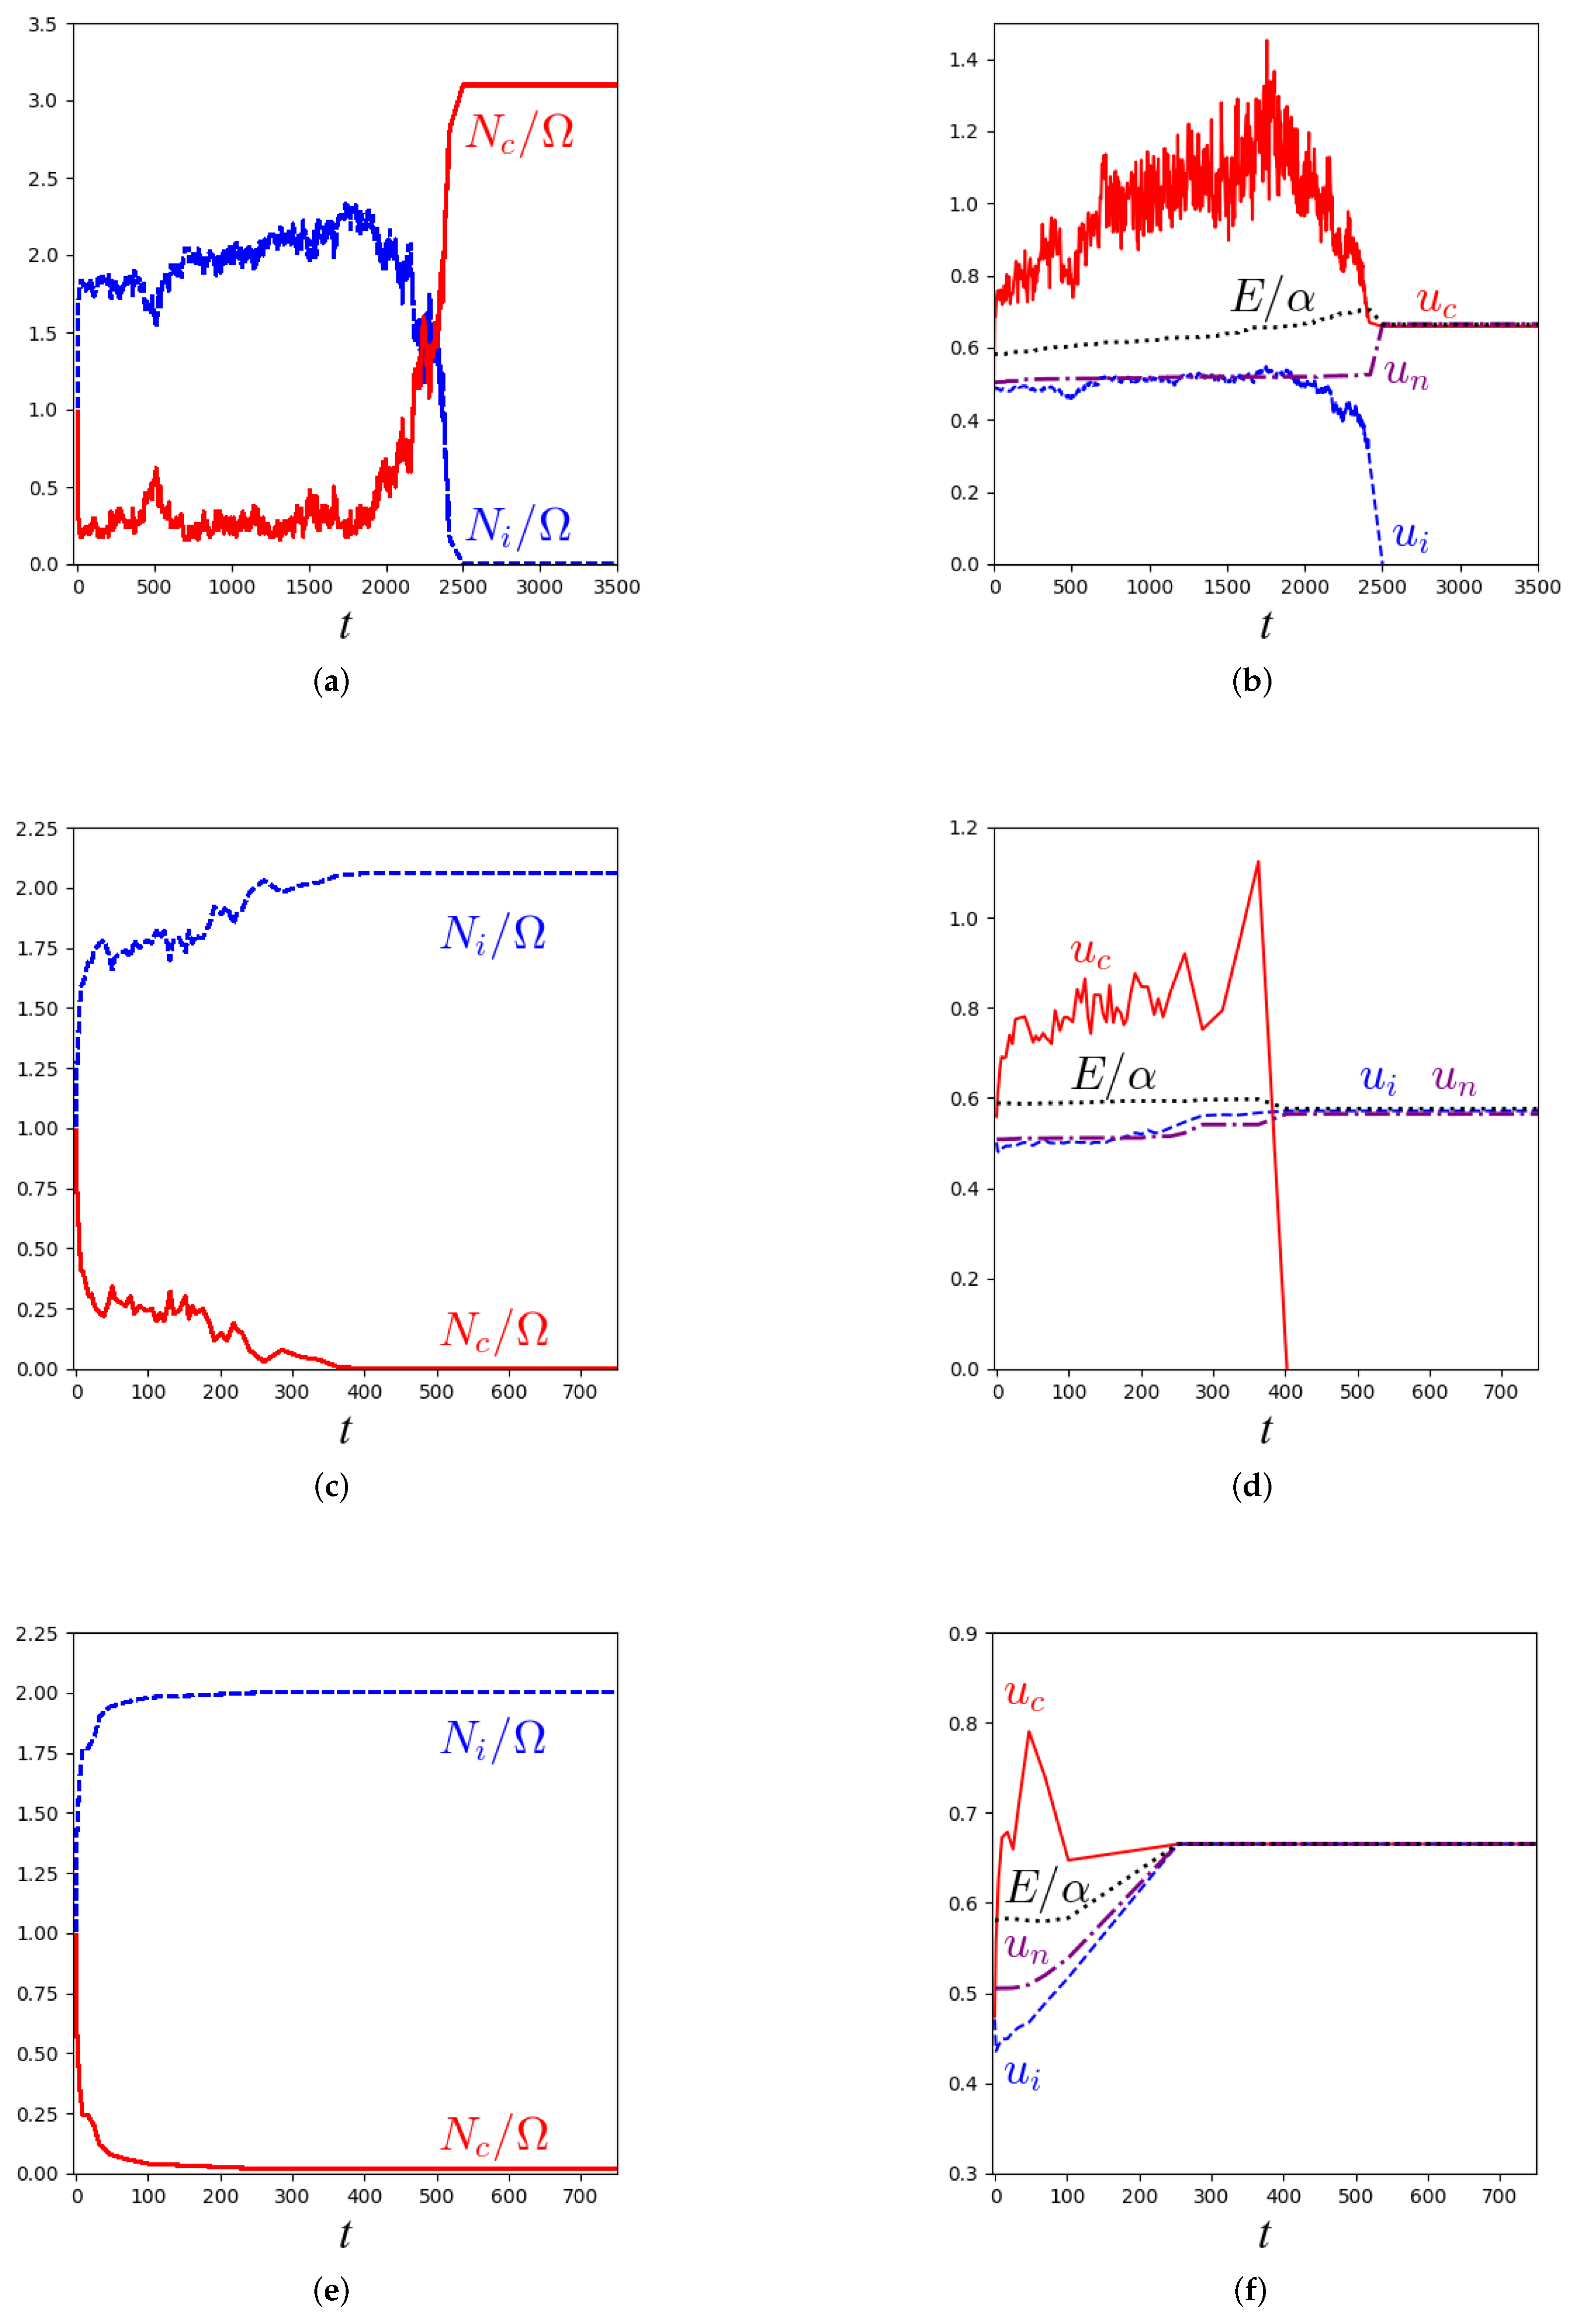
The results obtained for an intermediate field value are given in Figure 3. In addition to the final vanishing of either N i or N c , a third behavior corresponding to the stabilization into a steady state with N i end N c end 0 is observed. As shown in Figure 3f, the activities in the asymptotic state obey u i end = u c end = u n end = E / α . It is worth noting that the state reached in Figure 3a differs from the 3Es shown in Figure 2a. Indeed, Figure 3a reveals the stabilization into a steady state with u i end = 0 and u c end = u n end = E / α without divergence of N c . The increase in the field E when switching from Figure 2a to Figure 3a leads to the control of cancer according to the master equation. Such a behavior was not obtained when simulating the kinetic equations for which the induction period increases as the field E increases [37]. For a critical field value, DSMC simulations led to the divergence of the induction period, followed by an explosion of cancer [37]. As shown in Figure 3a–d, the evolution of the mean activities and populations of cancer cells and immune system cells displays random spikes before eventual stabilization. The DSMC simulations already revealed this phenomenon possibly followed by eventual divergence of the number of cancer cells [37,38]. As explained in Section 2.1, the activity dependence of the rate constants introduces a feedback mechanism, making possible the decrease in mean cancer cell activity and then cancer cell number after a fluctuation that initiates their rapid increase.
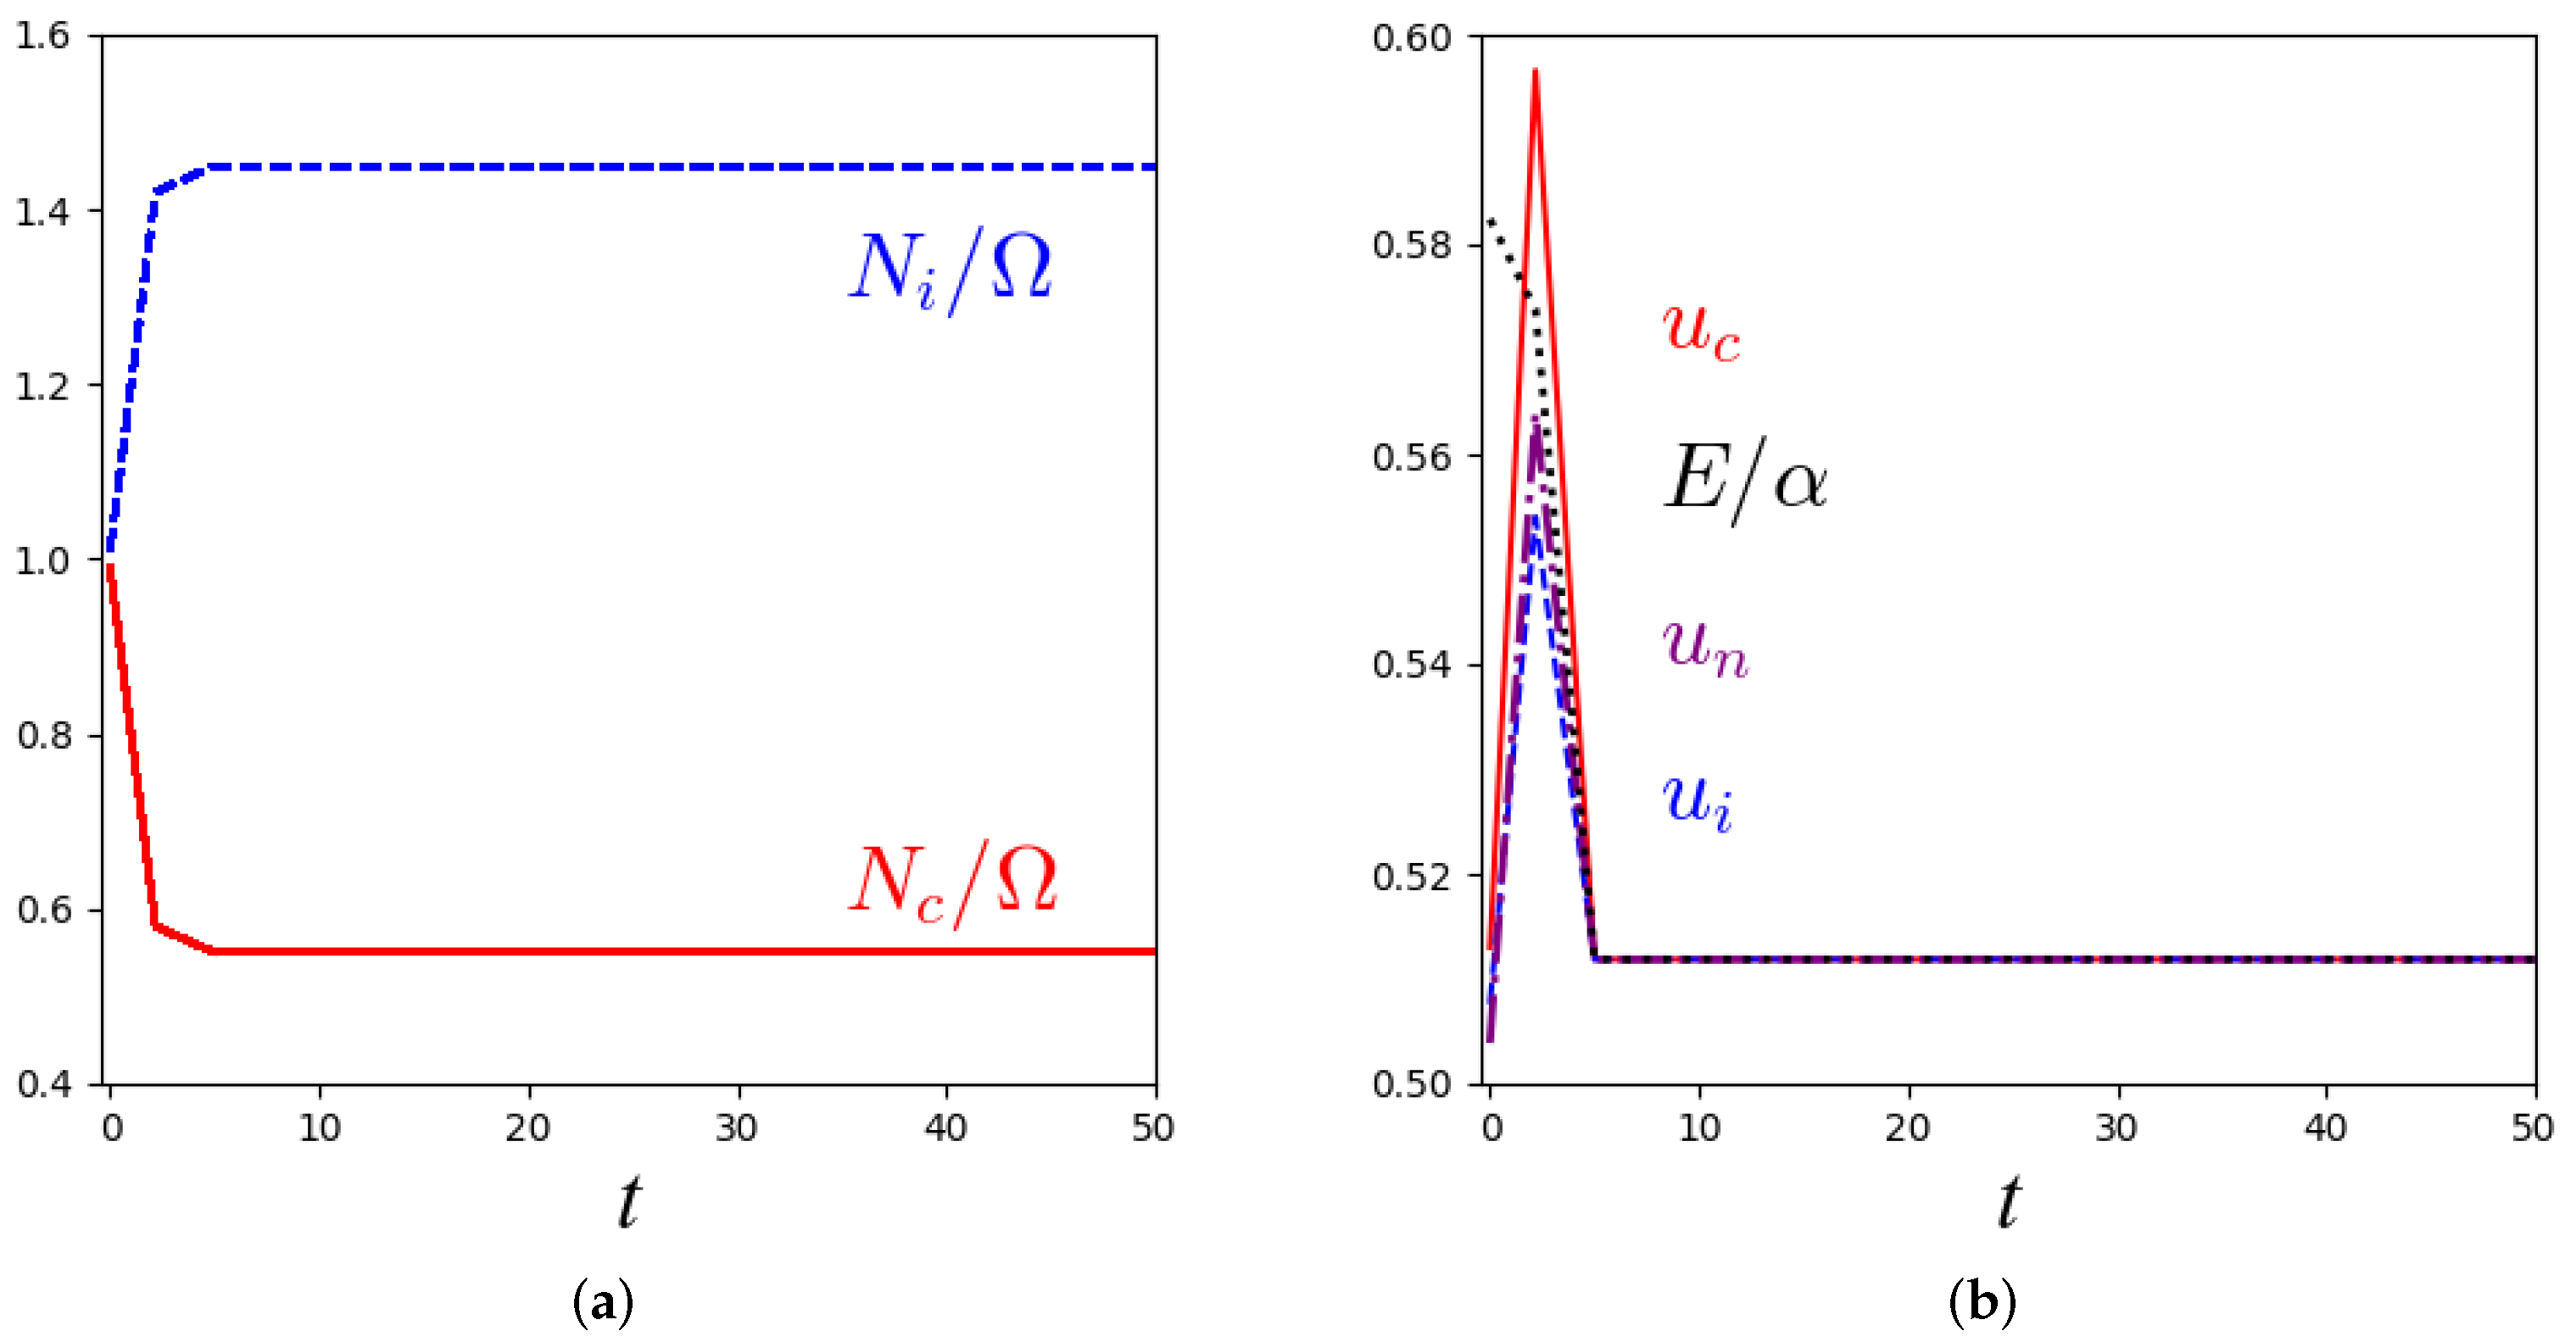
The results of the master equation for a large field E are given in Figure 4. A strong thermalization induces the fast stabilization into a steady state associated with N i end N c end 0 and u i end = u c end = u n end = E / α in a similar way as in DSMC [37]. In both approaches, the efficient control of activity fluctuations always leads to the control of cancer.
Although more complex, our model of cell–cell interactions has analogies with 2-strategy × 2-player evolutionary game dynamics used in sociophysics of epidemics [69]. Due to the application to a specific biological context, the model involves the control of cell activity fluctuations, three cell types i, c, and n, and the three processes given in Equations (2)–(4) with activity-dependent rate constants. In a crude approximation neglecting the action of the thermostat and the evolution of the activity of the normal cells, the model reduces to Equations (2) and (3) for the two cell types i and c, i.e., a 2 × 2 game. The stationary states of the system have some features in common with those of a 2 × 2 game. However, neglecting the thermostat and the source of activity provided by the normal cells in the model of immune system–cancer interactions is too rough an approximation that would be detrimental to the description of the dynamics of such a far-from-equilibrium system.
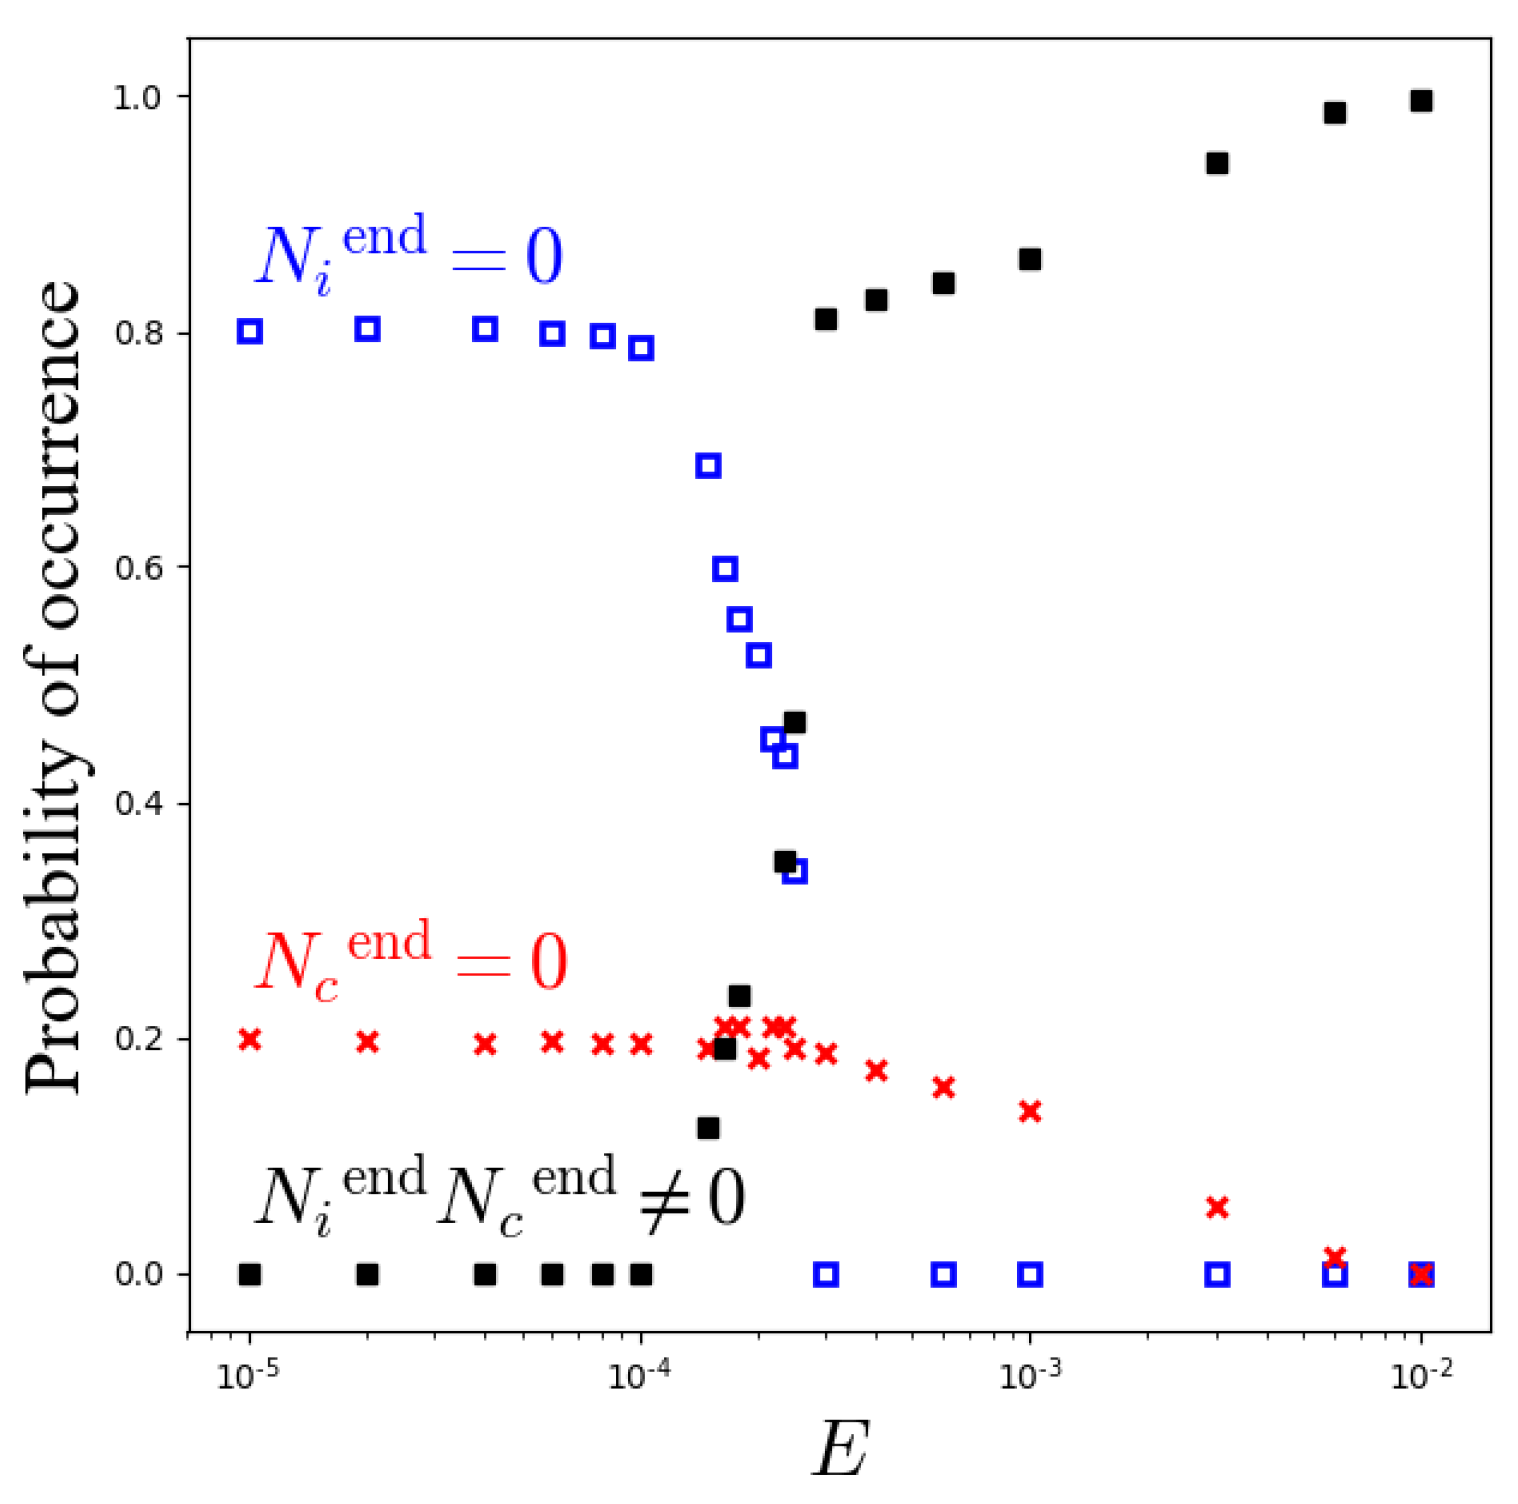
The results of the master equation regarding the variation of the probability of occurrence of the three typical behaviors corresponding to N i end = 0 , N c end = 0 , or N i end N c end 0 versus the field E are given in Figure 5a. As in the DSMC results [37], a transition is observed for an intermediate value of E. For a small field E, the total elimination of cancer associated with N c end = 0 is obtained in about 25 % of the cases after a favorable fluctuation in the considered system of 1000 initial cells. On the contrary, the control of cancer, i.e., a steady although not vanishing value of N c end , is observed with a probability of 1 for a large field E, i.e., provided thermalization is strong enough.
The dependence of the results on the base b used to discretize the logarithm of the activities is studied in Figure 5b for a given value of the field E = 10 3.2 . Choosing a value of E close to the transition observed in Figure 5a a priori ensures a good sensitivity of the results to parameters and fluctuations [51]. As b increases, coarse graining is more important. As a consequence, fluctuations are smoothed, and the final state is unique: 100 % of the stochastic trajectories lead to coexistence ( N i end N c end 0 ) and control of cancer for b > 1.5 . As b decreases, a plateau is reached, with about 27 % of trajectories leading to the escape of cancer ( N i end = 0 ) and 73 % of the trajectories leading to the control of cancer. This plateau is nearly reached for b = 1.3 . The small differences between the results observed for different values of b in the range b 1.3 can only be due to the possible observation of cancer elimination ( N c end = 0 ), which occurs to the detriment of either coexistence or cancer escape. Moreover, we have investigated the vicinity of the transition toward the control of cancer as E varies and observed that, for b 1.3 , the transition occurs for nearly the same value of the field E, whereas it occurs for a smaller value of E as b becomes larger than 1.3 .
Even though a value of the base b that is as small as possible ensures a better description of the fluctuations, it also leads to an exponentially diverging computation time. The value b = 1.3 used to derive the results shown in Figure 2, Figure 3, Figure 4 and Figure 5a corresponds to a balance between the independence of the results with respect to b and the increase in computation time.
As evidenced by comparing Figure 5a obtained for the master equation and Figure 6 obtained for DSMC [37], the statistical results deduced from the two descriptions agree very well. However, the disappearance of solutions associated with N i end = 0 as E increases differently occurs in the case of DSMC and the master equation. As shown in Figure 7, the transition is associated with the divergence of the mean induction time preceding the divergence of N c in DSMC. In the case of the master equation, the explosion of the number of cancer cells is observed only for E 10 4.5 . For larger E values and seeds of the random number generator leading to N i end = 0 , the master equation predicts the stabilization into a steady state without divergence of either N c or the induction time, as already shown in Figure 3a,b. This phenomenon could be an intrinsic property of the master equation or an artifact induced by the logarithmic discretization of activities introduced to maintain reasonable computation times.

3.2. Stability Analysis and Numerical Solutions for the Macroscopic Equations

We first determine the steady states of the deterministic equations given in Equations (26)–(31). Three families of steady states, I, II, and III, are found:
ρ i I = 0 , U c I = U n I = E / α , U i I = E / α + ϵ α k i c ρ c I for ρ c I α k i c ( E / α + ϵ )
ρ c II = 0 , U i II = U n II = E / α , U c II = E / α + ϵ α k c n ρ n + k c i ρ i II , for ρ i II α k c i ( E / α + ϵ ) k c n k c i ρ n
U i III = U c III = U n III = E / α , ρ i III , ρ c III .
All values of ρ c I obeying the condition given in Equation (32) are associated with a steady state such that ρ i I = 0 . Similarly, all values of ρ i II obeying the condition given in Equation (33) are associated with a steady state such that ρ c II = 0 . An infinite number of steady states obey Equation (34) without condition on the values of ρ i III and ρ c III .
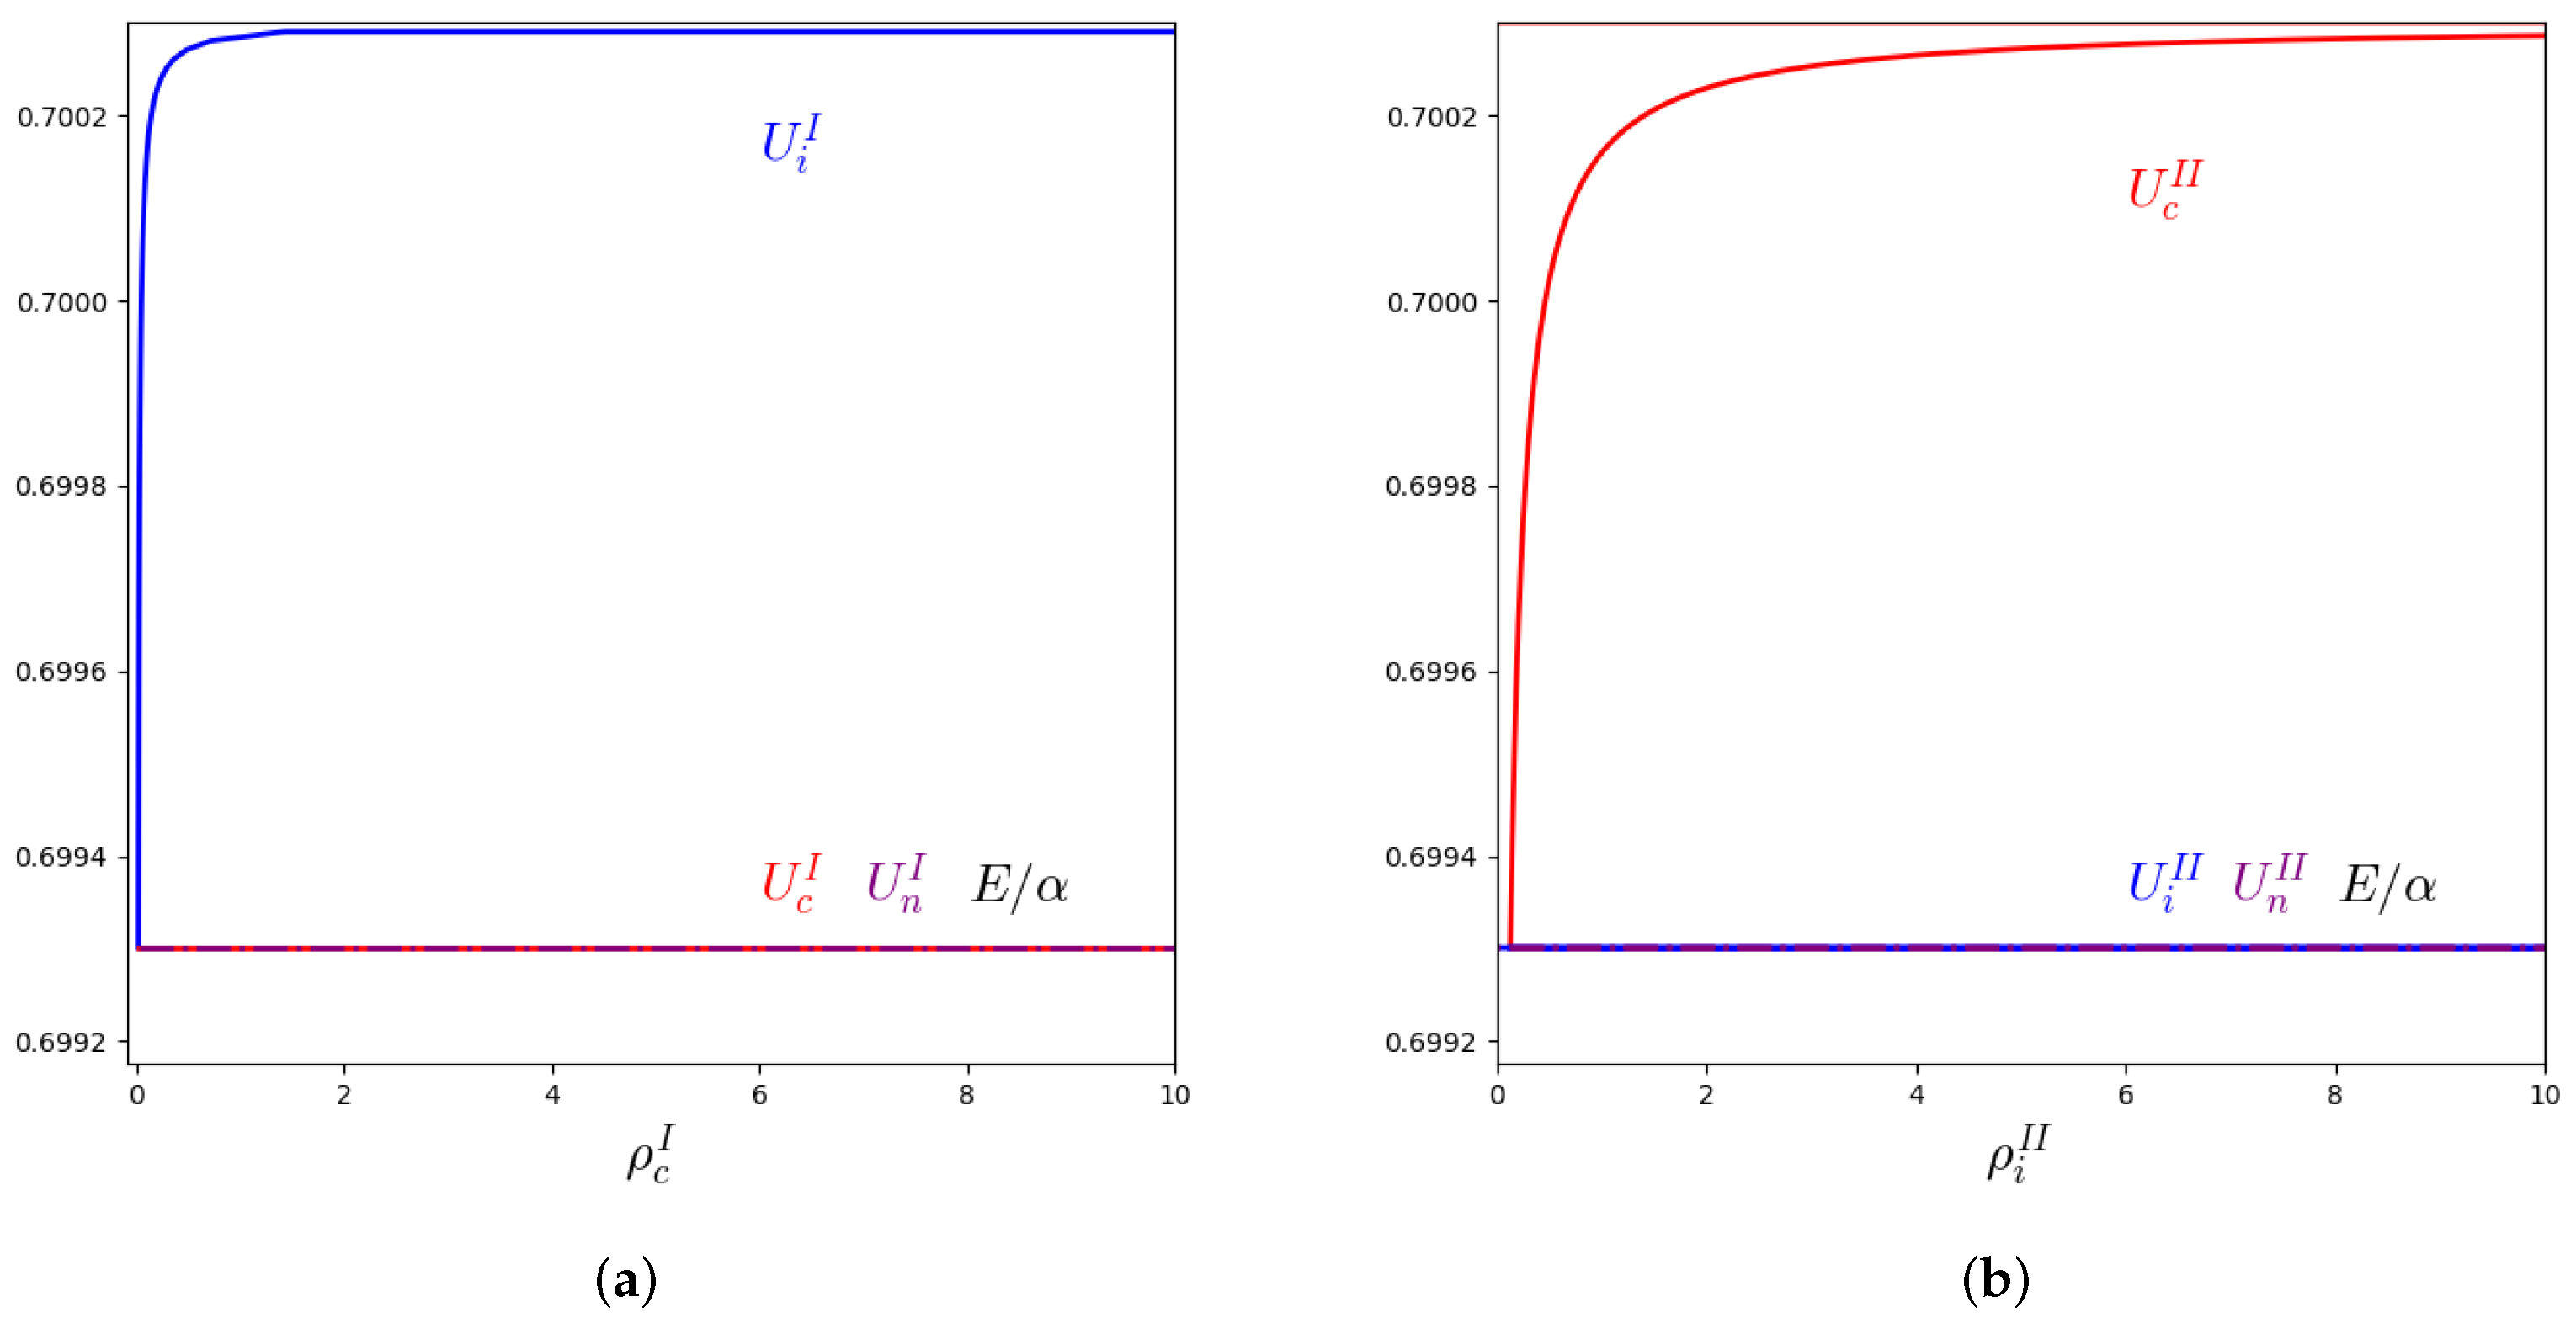
The two families given in Equations (32) and (33) are displayed in Figure 8 for the same parameters as those chosen to obtain Figure 2 in the case of the master equation. The field is small and given by E = 10 5 . The friction coefficient, α , that can be arbitrarily chosen in the deterministic description is set at the value α = 1.43 × 10 5 , deduced from the master equation at the end of the simulation associated with the 3Es (cf., Figure 2b, leading to E / α 0.699 ). For larger E values, the master equation leads to larger α values. Specifically, we find α = 1.95 × 10 2 for E = 10 2 . Hence, the lower limit of the interval of acceptable ρ c I ( ρ i II , resp.) increases in the case of the family of steady states given in Equation (32) (Equation (33), resp.).
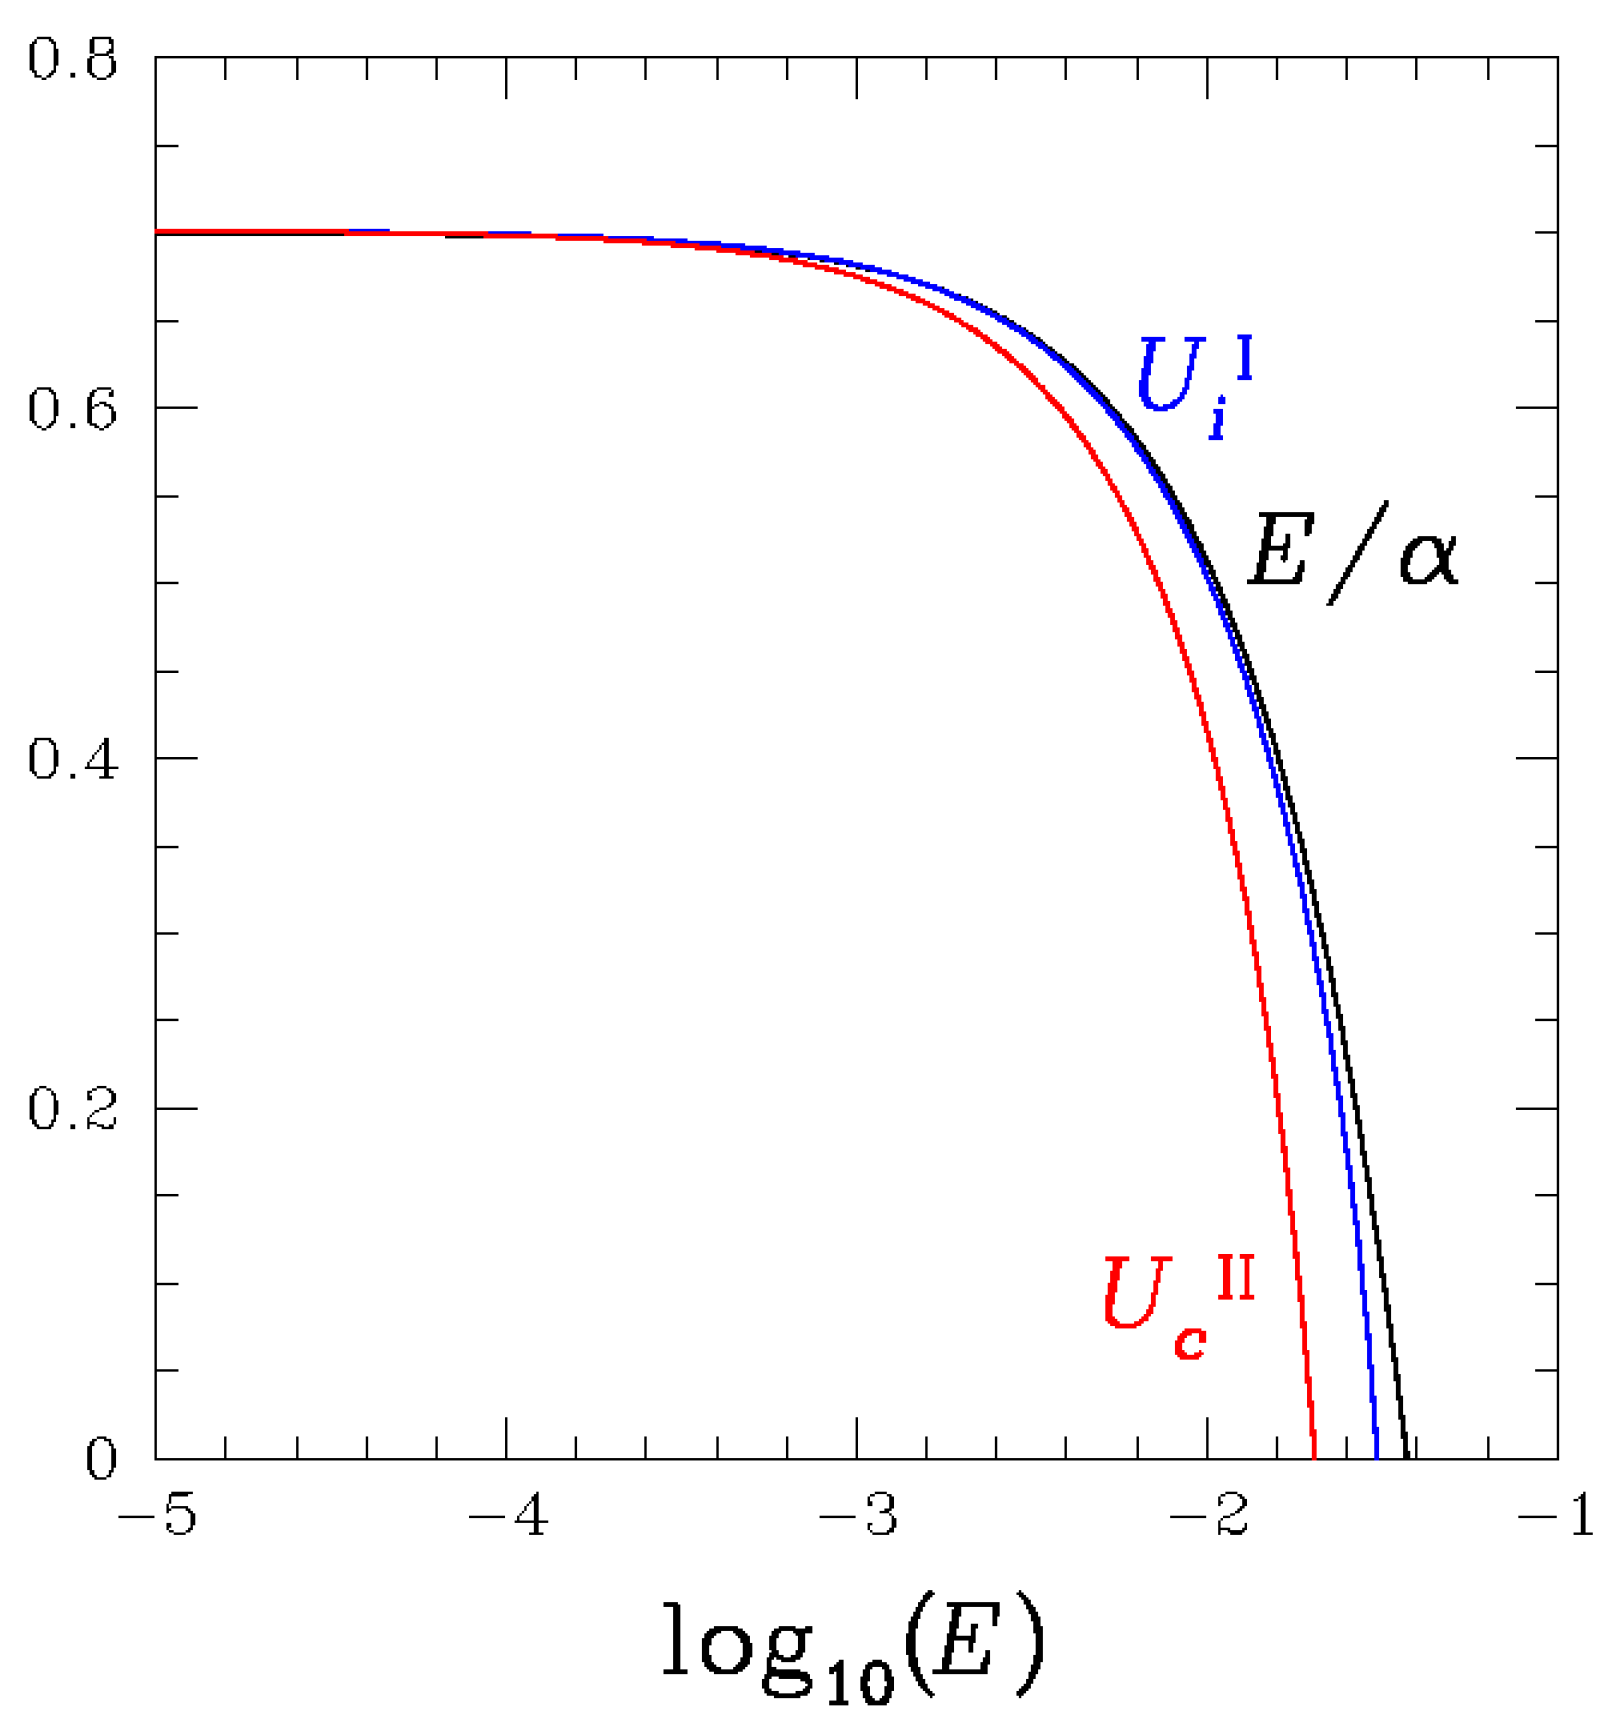
According to the results of the master equation, we allow that E / α increases linearly with E. Following Figure 2 and Figure 3, we allow that ρ c I ρ i II 2 for the chosen parameter values. Figure 9 shows the variation of U i I and U c II versus log 10 ( E ) . According to the conditions given in Equations (32) and (33), the steady states of type I do not exist above the critical field value E c I 10 1.5 , slightly larger than the critical value E c II 10 1.7 associated with the steady states of type II. The critical field values E c I and E c II correspond to critical values α c I and α c II of the friction coefficient, above which the steady states of types I and II disappear.
The stability analysis of the steady states can be partially performed for the states of types I and II. Equation (26) is easily linearized around the states of type I leading to
d ρ i / d t λ I ρ i
with
λ I = ( α I α ) H ( α I α ) ( α α I ) H ( α α I ) k c i / k i c , α I = ϵ k i c ρ c I .
The eigenvalue λ I associated with the variable ρ i is positive for α < α I so that the steady states of type I are unstable in this domain of the parameter space, whereas λ I < 0 for α I < α < α c I . At least in the direction of ρ i , the steady states of type I are stable before disappearing as α exceeds the critical value of α c I .
Similarly, Equation (27) is easily linearized around the states of type II, leading to
d ρ c / d t λ II ρ c
with
λ II = ( α II α ) H ( α II α ) ( α α II ) H ( α α II ) k i c ρ i II / ( k c i ρ i II + k c n ρ n ) α II = ϵ ( k c i ρ i II + k c n ρ n ) .
The eigenvalue λ II associated with the variable ρ c is positive for α < α II so that the steady states of type II are unstable in this domain of the parameter space, whereas λ II < 0 for α II < α < α c II . At least in the direction of ρ c , the steady states of type II are stable before disappearing as α exceeds the critical value of α c II .
The stability analysis of the steady states of type III is straightforward for sufficiently large fields and consequently for friction coefficients. According to Equations (29)–(31), the eigenvalues then obey λ III α in the directions of the three activities, U i , U c , and U n . The steady states of type III are therefore stable as the field exceeds a critical value denoted as E III . If necessary, E III could be analytically evaluated using a linearization of Equations (29)–(31) around a steady state of type III.
According to the results of the statistical studies shown in Figure 5a and Figure 6, the two approaches based on a master equation and kinetic equations lead to the observation of only steady states of type III for sufficiently large fields. Interestingly, the macroscopic approach provides the analytical proof that efficient thermalization leads to a single type of stable steady state obeying ρ i III ρ c III 0 , i.e., a control of cancer. Moreover, the macroscopic equations and the analysis of the conditions of existence of the steady states provide an explanation for the transition observed in Figure 5a and Figure 6, when performing simulations of the master equation and the kinetic equations, respectively. Observing solutions associated with N c end = 0 or N i end = 0 for small field values and stationary solutions obeying N c end N i end 0 for large fields corresponds to crossing the critical field values E c I or E c II , above which the steady states of type I or II disappear. From the comparison of Figure 5a, Figure 6 and Figure 9, we conclude that the analytical macroscopic approach overestimates the critical field values of E c I and E c II , possibly due to the fact that α evolves in the simulations, whereas it is a parameter in the macroscopic description.
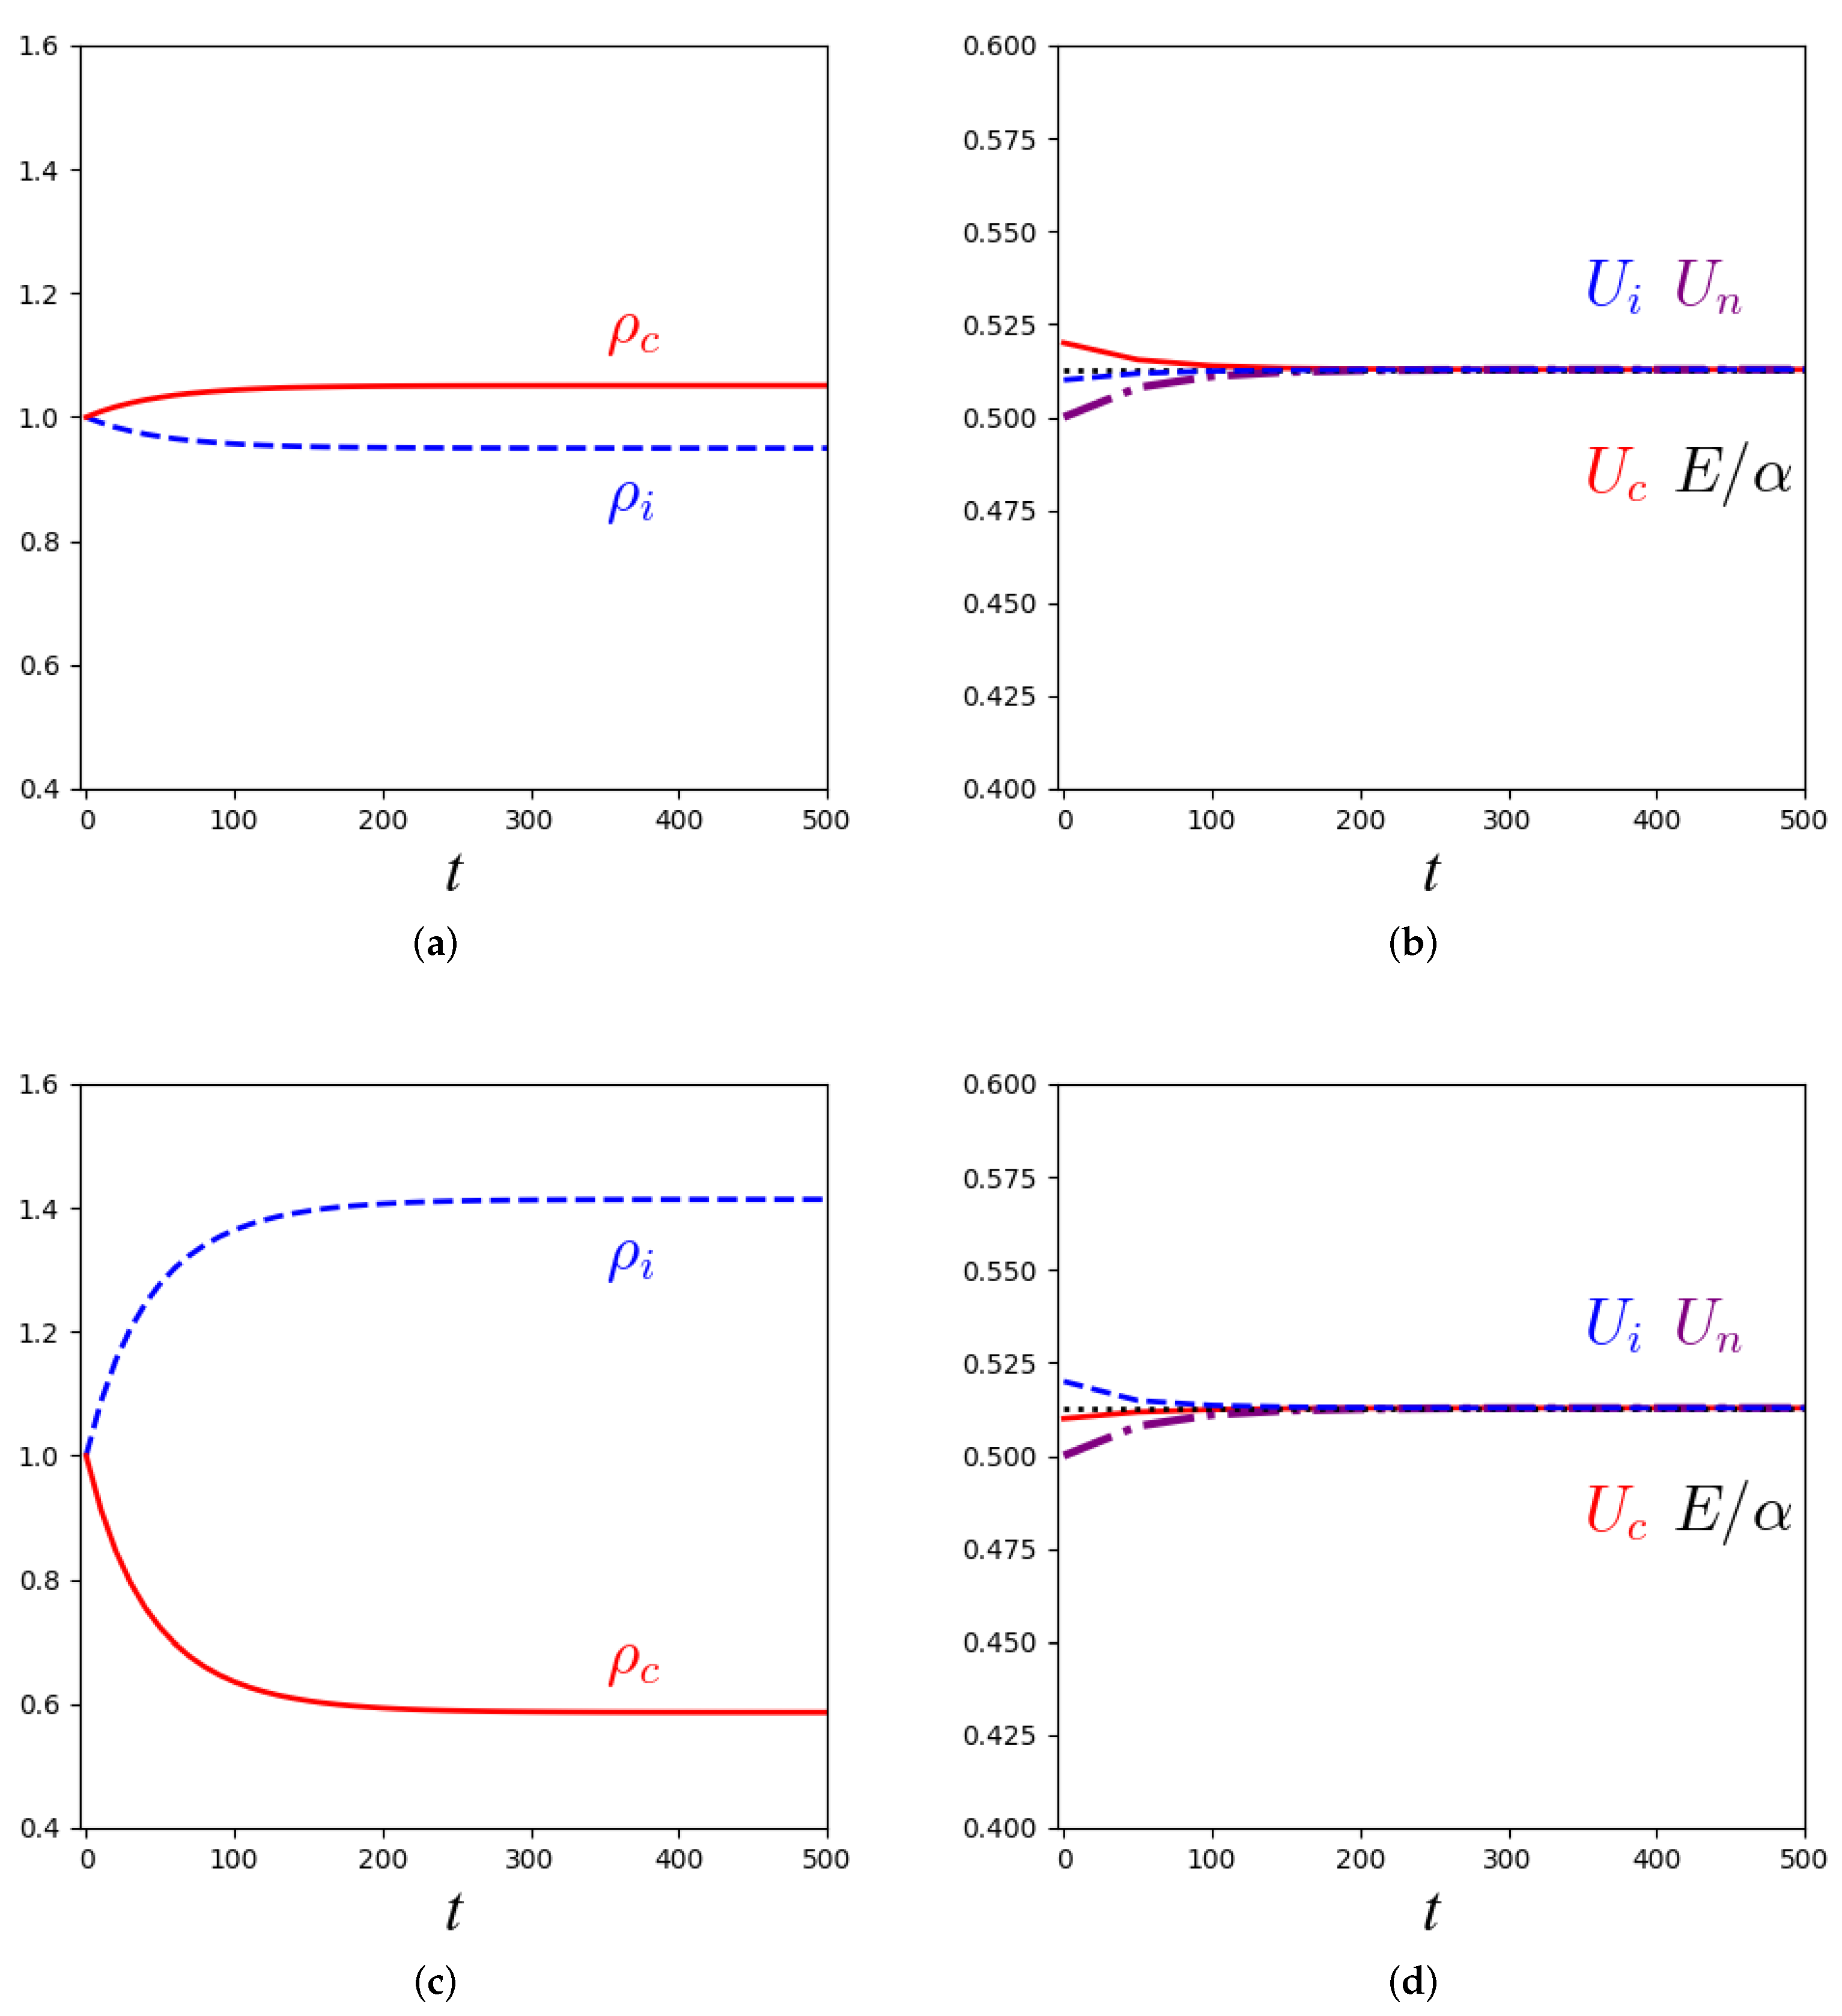
We then use the Euler method to solve the macroscopic equations given in Equations (26)–(31) with α values deduced from the master equation. Figure 10 is obtained for the same parameter values as those chosen to obtain Figure 2 in the case of the master equation. Whereas different behaviors were observed depending on the seed of the random number generator in the stochastic description, it is necessary to change the initial conditions ( ρ i 0 , ρ c 0 , U i 0 , U c 0 , U n 0 ) to obtain different outcomes in the deterministic case. Specifically, for a small field E, two different behaviors are observed whether the initial activity U c 0 of the cancer cells is larger or smaller than the initial activity U i 0 of the immune system cells. For U i 0 < U c 0 , the final state is characterized by ρ i end 0 and has increasing activities obeying U i < U c = U n at the time at which the computation is stopped. Figure 10a,b illustrates the rapid convergence of the concentrations towards steady values of type I (Equation (32)), whereas the activities are far from having relaxed to U c I = U n I = E / α and U i I = E / α + ϵ α k i c ρ c I 0.701 , slightly larger than E / α . For U c 0 < U i 0 , the final state obeys ρ c end 0 and U c end < U i end = U n end . Figure 10c,d illustrates the rapid convergence of the concentrations towards steady values of type II (Equation (33)). For a much longer integration time on the order of 10 5 , the activities would converge toward U i II = U n II = E / α and U c II = E / α + ϵ α k c n ρ n + k c i ρ i II 0.701 .
As the field E exceeds a critical value, two kinds of steady states of type III obeying ρ i end ρ c end 0 are observed depending on the relative values of U c 0 and U i 0 , as shown in Figure 11. The final values of the concentrations and activities sensitively depend on the initial conditions U i 0 , U c 0 , and U n 0 . Specifically, we find that ρ i end < ρ c end if U i 0 < U c 0 and ρ c end < ρ i end if U c 0 < U i 0 . In both cases, we have U i end = U c end = U n end = E / α . The initial conditions select a given steady state in the family of type III and determine the final values of the concentrations ρ i III and ρ c III . The convergence of the activities toward steady values is faster in Figure 11 than in Figure 10. Indeed, for sufficiently large field values, the stability analysis deduced from the macroscopic approach predicts that the typical timescale of thermalization, 1 / | λ III | 1 / α , becomes smaller as E and, consequently, α increase.
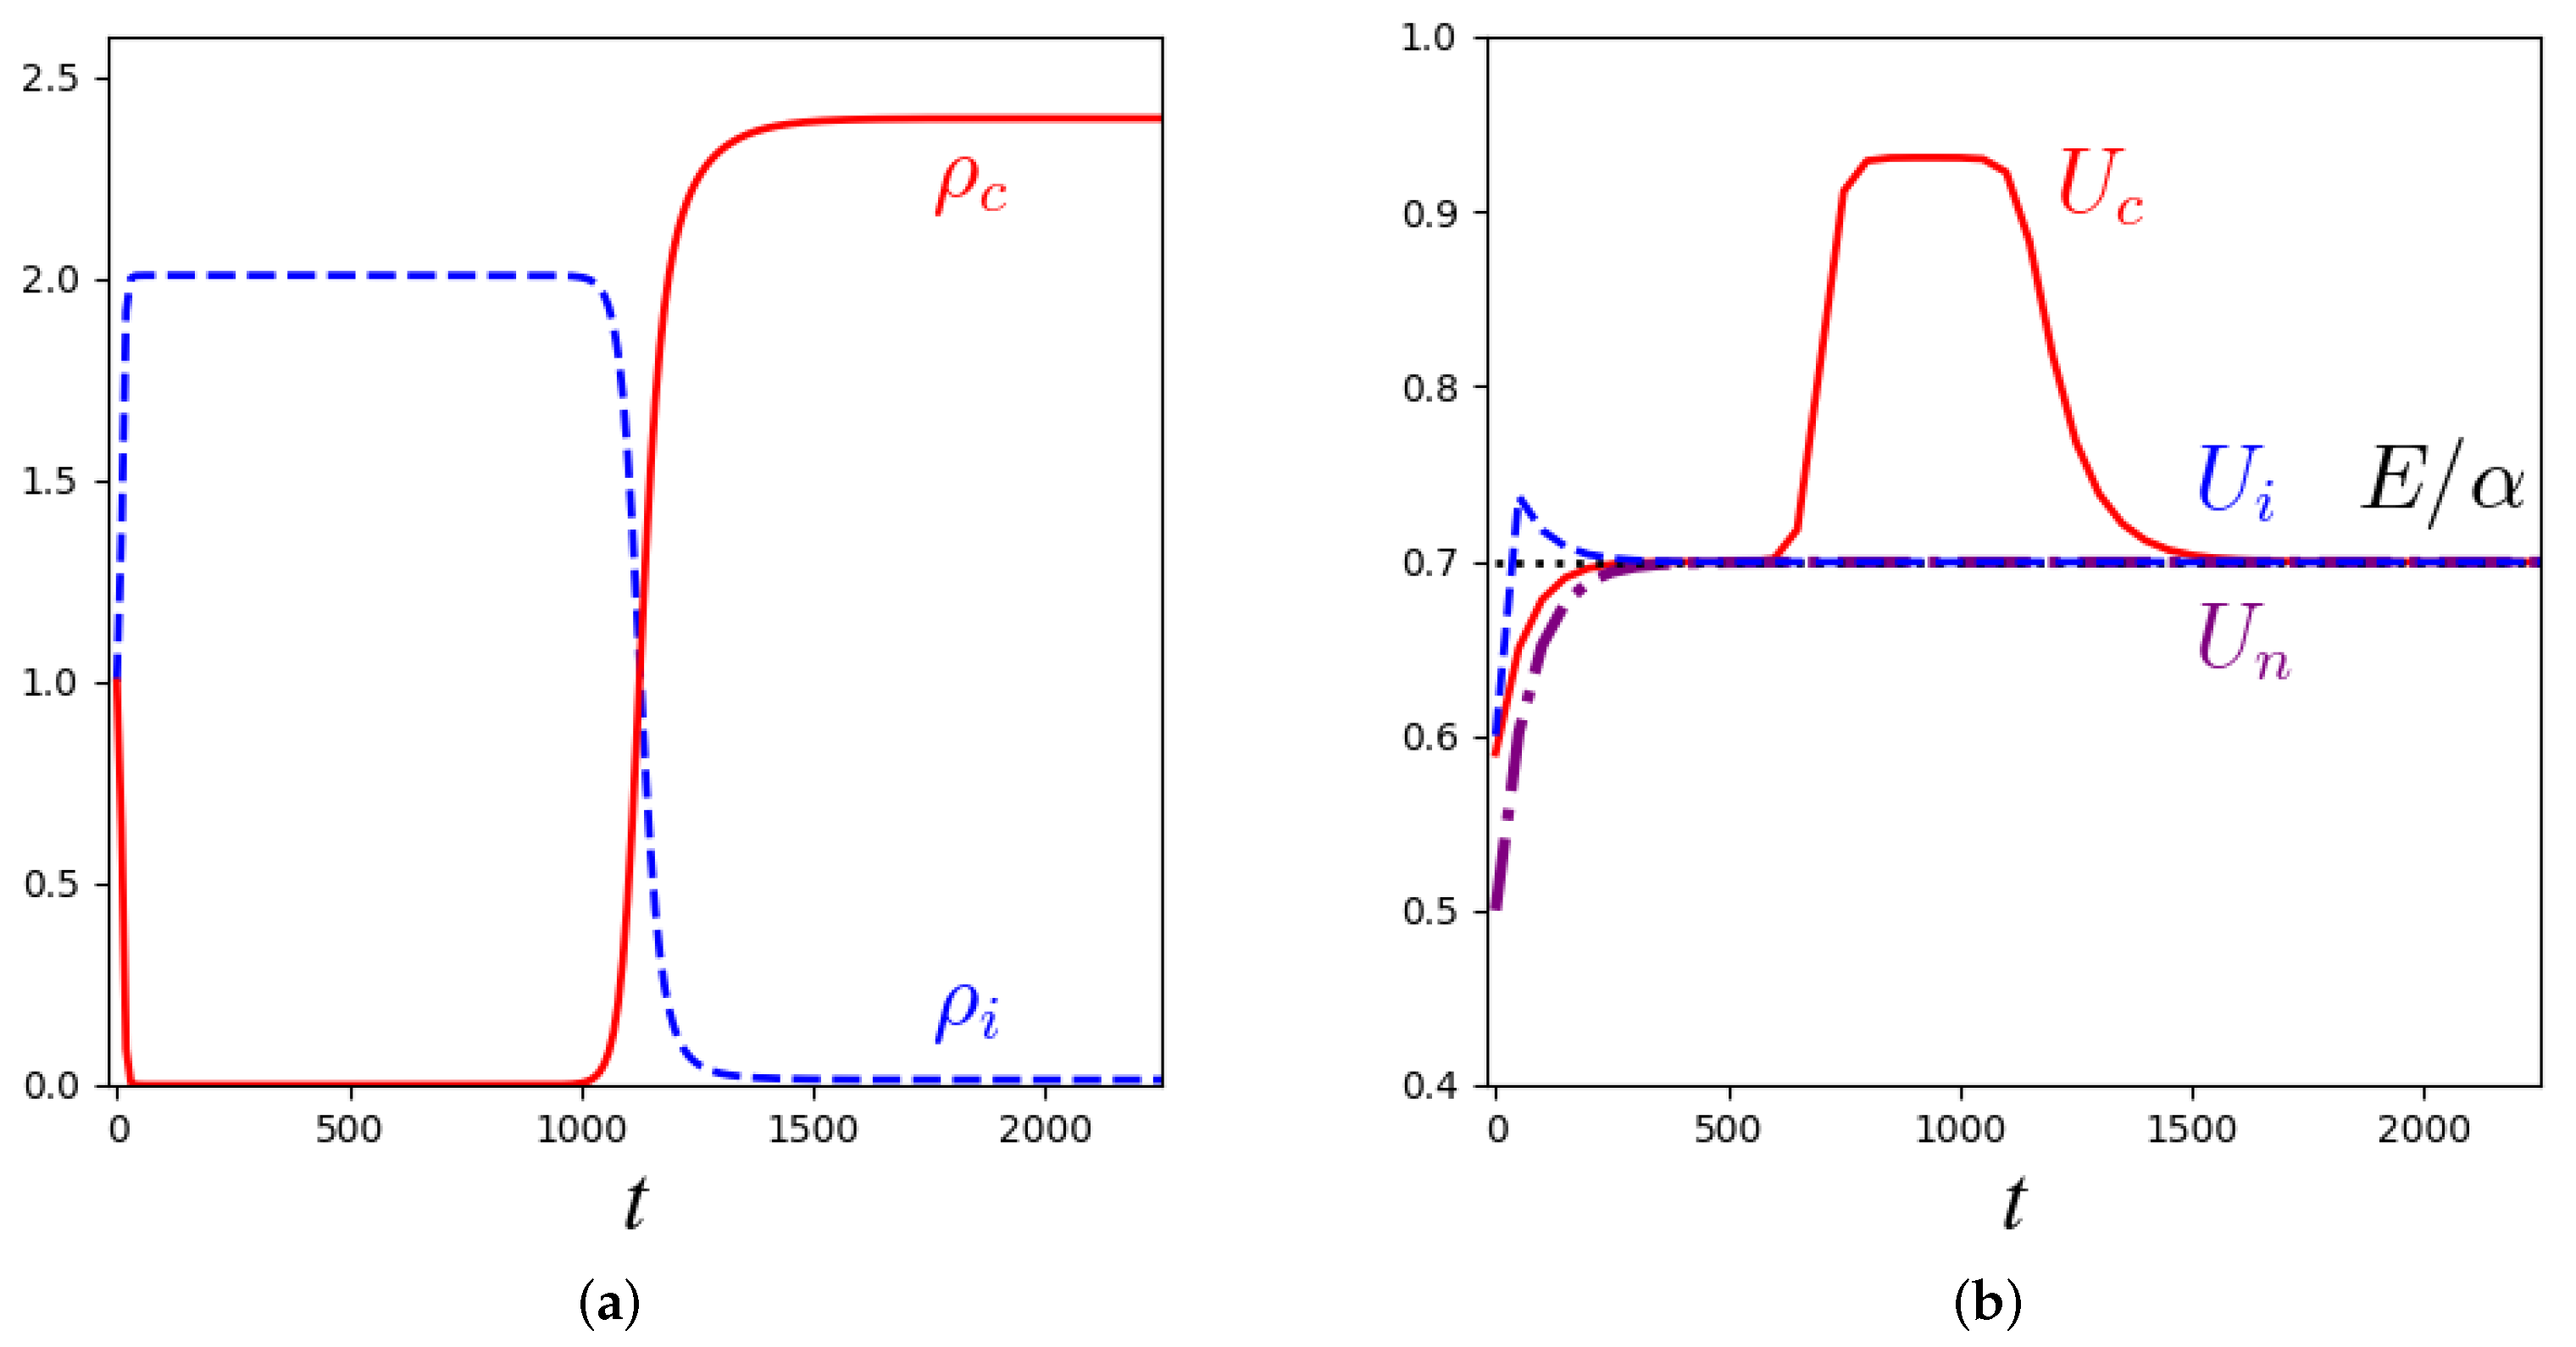
When solving the deterministic equations, we did not observe the 3Es for the same parameter values as for the master equation. As displayed in Figure 12, the 3Es are obtained in the deterministic case for larger values of the activity increase ϵ and the concentration of normal cells ρ n , with the other parameters being the same as in Figure 2 and Figure 10. In these conditions, cancer escapes from the control of the immune system, ρ c diverges, and U c is larger than E / α . Thermalization is too weak compared to the autocatalytic formation of cancer cells and to the increase of activity to maintain the system in a steady state.
The behavior observed for a larger field value is shown in Figure 13 in the deterministic case, which is close to the results of the master equation displayed in Figure 3a,b. In both cases, the induction period is followed by a steady value of N c end and ρ c end . The immune system is destroyed in the case of the master equation, and ρ i end tends to zero in the deterministic case. Both descriptions predict that cancer is nevertheless controlled. All activities, if defined, converge toward the steady value E / α , due to the efficient thermalization reached for such a high E value. Hence, the deterministic approach confirms the results of the master equation shown in Figure 3 that were not obtained in DSMC simulations of the kinetic equations [37].
To sum up, all behaviors encountered when simulating the master equation are recovered when solving the deterministic equations but not necessarily for the same parameter values. Actually, the results deduced from the master equation and the macroscopic equations are inherently different, since the friction coefficient α is variable in the case of the master equation, whereas α is a parameter set at a constant value in the deterministic equations. This feature explains some of the differences between the results of the master equation and those of the macroscopic equations, in particular in situations that are highly sensitive to small perturbations, such as the induction period observed in the 3Es.

4. Conclusions

In this paper, we derived the master equation and the deterministic equations associated with a homogeneous model of competition between cancer and the immune system, initially designed at the cellular scale in the framework of thermostatted kinetic theory [36,37]. The model introduced cell–cell interactions accounting for cell mutation, proliferation, or death, as well as learning. Implicit processes regulating cell activity and dissipation of information were modeled by a field and a friction coefficient. The stochastic description involved an infinite number of processes, due to the possible interactions of a cell with cells of smaller activity. We controlled the computation time of kinetic Monte Carlo simulations of the master equation by introducing a discretization of cell activity in logarithmic scale.
We found that the results of simulations of the kinetic equations [36,37] and the master equation are in excellent agreement. Specifically, both approaches account for a transition as activity is more efficiently thermalized, i.e., as the field controlling activity fluctuations exceeds a critical value.
For a small field, the final state is associated with the elimination of either the cancer or the immune system. Hence, our cell-scale model, which includes non-trivial fluctuation effects, predicts that a large standard deviation of cell activity, including the development of some very aggressive cancer cells, can lead to the total disappearance of cancer, albeit with a lower probability than the destruction of the immune system. This surprising result could be related to the rare, unexpected recovery of some cancer patients, a phenomenon that is still not fully elucidated from a clinical point of view [70].
For a large field, the thermostatted model predicted that the system rapidly evolves toward a steady state in which both cancer and the immune system coexist; that is, strong activity thermalization leads to the control of cancer. The link between the control of cancer and the control of cell activity fluctuations means that the elimination of cells both more and less aggressive than average, whether cancer cells or immune system cells, leads to stabilization into a state of coexistence, i.e., a constant tumor size in the case of a solid cancer and a constant concentration of malignant cells in blood in the case of a blood cancer. The result could be related to the efficiency of different treatments, such as chemotherapy or radiotherapy, which kill cells regardless of their nature and activity, leading to the dissipation of information acquired by learning during specific cell interactions, the decrease of activity standard deviation, and the eventual control of cancer.
We derived the macroscopic deterministic equations for concentrations and mean activities of cancer and immune system cells. The existence conditions and the stability analysis of the steady states of the macroscopic equations provide an analytical interpretation of the transition associated with a critical field.
Moreover, the three descriptions, based on kinetic equations, a master equation, and deterministic equations, account for the 3Es of immunotherapy, i.e., reproduce the apparent elimination of cancer followed by a long pseudo-equilibrium phase and, eventually, cancer evasion. However, the simulations of the kinetic equations for fields close to the critical value lead to the divergence of the induction time and explosion of the number of cancer cells, whereas the simulations of the master equation lead to finite induction time and number of cancer cells. Both the 3Es and the eventual convergence toward a steady state without an immune system after a phase of quasi-elimination of cancer are included in the deterministic description, but for parameter values significantly different from the values used to solve the master equation. It should be noted that the friction coefficient is a parameter in the macroscopic description, whereas it is variable and continuously updated in the simulations of both the kinetic equations and the master equation, in such a way that the second moment of cell activity fluctuations is controlled. This could explain the main differences between the results of the macroscopic equations and the descriptions at a smaller scale.
The fluctuations present in the simulations of the kinetic equations and inherent to the stochastic description by the master equation may lead to spikes during the pseudo-equilibrium phase of the 3Es that may appear with a certain regularity for some parameter values [37,38]. Such apparently periodic oscillations of the level of C-reactive protein (CRP) expression have been observed in patients with advanced cancers [71,72]. CRP is used as a marker of inflammation in response to antigen exposure in relation to the progression of many cancers, such as melanoma and lung cancer. Apparent oscillations of CRP have been interpreted by immune regulatory cycles [73]. Although designed as a minimal model, it introduces activity-dependent rate constants for the interaction processes given in Equations (2)–(4) which induce a non-trivial feedback mechanism: the model accounts for the non-monotonic evolution of the mean activities and numbers of both cancer cells and immune system cells. The model is sufficiently complex to reproduce the clinically observed occurrence of spikes during the progression of some cancers.
It should be noted that the macroscopic equations that we derived are not associated with a Hopf bifurcation [51] that could have been related to periodic oscillations as assumed in many phenomenological models [16,17,18,19,20,21]. In the future, we suggest to derive Langevin equations [74] with internal noise [75] from the master equation and studying whether they account for excitability of the system with possible synchronization of the spikes for an adapted noise level, in relation to a phenomenon of coherence resonance [76,77,78].

Author Contributions

Conceptualization, C.B.; methodology, A.L.; software, G.M.; validation, G.M.; formal analysis, G.M. and A.L.; resources, A.L.; writing—original draft preparation, G.M. and A.L.; writing—review and editing, C.B.; visualization, G.M.; supervision, A.L.; project administration, A.L.; funding acquisition, A.L. All authors have read and agreed to the published version of the manuscript.

Funding

This research received no external funding.

Data Availability Statement

Not applicable.

Conflicts of Interest

The authors declare no conflict of interest.

Abbreviations

The following abbreviations are used in this manuscript:
FKPPFisher–Kolmogorov–Petrosky–Piskunov
DSMCDirect Simulation Monte Carlo
CRPC-reactive protein

References

  1. Chen, D.S.; Mellman, I. Oncology Meets Immunology: The Cancer-Immunity Cycle. Immunity 2013, 39, 1–10. [Google Scholar] [CrossRef] [PubMed]
  2. Farkona, S.; Diamandis, E.P.; Blasutig, I.M. Cancer immunotherapy: The beginning of the end of cancer? BMC Med. 2016, 14, 73. [Google Scholar] [CrossRef] [PubMed]
  3. Oiseth, S.J.; Aziz, M.S. Cancer immunotherapy: A brief review of the history, possibilities, and challenges ahead. J. Cancer Metastasis Treat. 2017, 3, 250–261. [Google Scholar] [CrossRef]
  4. Waldman, A.; Fritz, J.; Lenardo, M. A guide to cancer immunotherapy: From T cell basic science to clinical practice. Nat. Rev. Immunol. 2020, 20, 651–668. [Google Scholar] [CrossRef] [PubMed]
  5. Sharma, P.; Hu-Lieskovan, S.; Wargo, J.A.; Ribas, A. Primary, Adaptive, and Acquired Resistance to Cancer Immunotherapy. Cell 2017, 168, 707–723. [Google Scholar] [CrossRef]
  6. Dunn, G.P.; Bruce, A.T.; Ikeda, H.; Old, L.J.; Schreiber, R.D. Cancer immunoediting: From immunosurveillance to tumor escape. Nat. Immunol. 2002, 3, 991–998. [Google Scholar] [CrossRef]
  7. Dunn, G.P.; Old, L.J.; Schreiber, R.D. The Three Es of Cancer Immunoediting. Annu. Rev. Immunol. 2004, 22, 329–360. [Google Scholar] [CrossRef]
  8. Alberts, B.; Johnson, A.; Lewis, J.; Raff, M.; Roberts, K.; Walter, P. Molecular Biology of the Cell; Garland: New York, NY, USA, 2002. [Google Scholar]
  9. Yizhak, K.; Chaneton, B.; Gottlieb, E.; Ruppin, E. Modeling cancer metabolism on a genome scale. Mol. Syst. Biol. 2015, 11, 817. [Google Scholar] [CrossRef]
  10. Sivapatham, S.; Selvaraj, L. Currently available molecular analyses for personalized tumor therapy (Review). Biomed. Rep. 2022, 17, 95. [Google Scholar] [CrossRef]
  11. El-Hachem, M.; McCue, S.W.; Simpson, M.J. Travelling wave analysis of cellular invasion into surrounding tissues. Phys. D Nonlinear Phenom. 2021, 428, 133026. [Google Scholar] [CrossRef]
  12. Pozzi, G.; Grammatica, B.; Chaabane, L.; Catucci, M.; Mondino, A.; Zunino, P.; Ciarletta, P. T cell therapy against cancer: A predictive diffuse-interface mathematical model informed by pre-clinical studies. J. Theor. Biol. 2022, 547, 111172. [Google Scholar] [CrossRef] [PubMed]
  13. Topalian, S.L.; Taube, J.M.; Pardoll, D.M. Neoadjuvant checkpoint blockade for cancer immunotherapy. Science 2020, 367, eaax0182. [Google Scholar] [CrossRef]
  14. Huntington, N.D.; Cursons, J.; Rautela, J. The cancer-natural killer cell immunity cycle. Nat. Rev. Cancer 2020, 20, 437–454. [Google Scholar] [CrossRef] [PubMed]
  15. Sové, R.J.; Jafarnejad, M.; Zhao, C.; Wang, H.; Ma, H.; Popel, A.S. QSP-IO: A Quantitative Systems Pharmacology Toolbox for Mechanistic Multiscale Modeling for Immuno-Oncology Applications. CPT Pharmacomet. Syst. Pharmacol. 2020, 9, 484–497. [Google Scholar] [CrossRef]
  16. Lejeune, O.; Chaplain, M.A.J.; Akili, I.E. Oscillations and Bistability in the Dynamics of Cytotoxic Reactions Mediated by the Response of Immune Cells to Solid Tumours. Math. Comput. Model. Int. J. 2008, 47, 649–662. [Google Scholar] [CrossRef]
  17. D’Onofrio, A.; Gatti, F.; Cerrai, P.; Freschi, L. Delay-Induced Oscillatory Dynamics of Tumour-Immune System Interaction. Math. Comput. Model. Int. J. 2010, 51, 572–591. [Google Scholar] [CrossRef]
  18. Liu, D.; Ruan, S.; Zhu, D. Stable periodic oscillations in a two-stage cancer model of tumor and immune system interactions. Math. Biosci. Eng. 2012, 9, 347–368. [Google Scholar] [CrossRef] [PubMed]
  19. Bi, P.; Ruan, S.; Zhang, X. Periodic and chaotic oscillations in a tumor and immune system interaction model with three delays. Chaos 2014, 24, 023101. [Google Scholar] [CrossRef]
  20. Li, W.; Jin, W. Uncovering the underlying mechanism of cancer tumorigenesis and development under an immune microenvironment from global quantification of the landscape. J. R. Soc. Interface 2017, 14, 20170105. [Google Scholar] [CrossRef]
  21. Dritschel, H.; Waters, S.; Roller, A.; Byrne, H. A mathematical model of cytotoxic and helper T cell interactions in a tumour microenvironment. Lett. Biomath. 2018, 5, S36–S68. [Google Scholar] [CrossRef]
  22. Belgaid, Y.; Helal, M.; Venturino, E. Mathematical analysis of a B-cell chronic lymphocytic leukemia model with immune response. Appl. Math. Nonlinear Sci. 2019, 4, 551–558. [Google Scholar] [CrossRef]
  23. Benítez, L.; Barberis, L.; Condat, C. Modeling tumorspheres reveals cancer stem cell niche building and plasticity. Physica A Stat. Mech. Its Appl. 2019, 533, 121906. [Google Scholar] [CrossRef]
  24. Taloni, A.; Amar, M.B.; Zapperi, S.; Porta, C.L. The role of pressure in cancer growth. Eur. Phys. J. Plus 2015, 130, 224. [Google Scholar] [CrossRef]
  25. Tabdanov, E.D.; Puram, V.V.; Win, Z.; Alamgir, A.; Alford, P.W.; Provenzano, P.P. Bimodal sensing of guidance cues in mechanically distinct microenvironments. Nat. Commun. 2018, 9, 4891. [Google Scholar] [CrossRef]
  26. Büscher, T.; Ganai, N.; Gompper, G.; Elgeti, J. Tissue evolution: Mechanical interplay of adhesion, pressure, and heterogeneity. New J. Phys. 2019, 22, 033048. [Google Scholar] [CrossRef]
  27. Roy, M.; Finle, S.D. Metabolic reprogramming dynamics in tumor spheroids: Insights from a multicellular, multiscale model. PLoS Comput. Biol. 2019, 15, e1007053. [Google Scholar] [CrossRef] [PubMed]
  28. Alarcon, T.; Byrne, H.M.; Maini, P.K. Towards whole-organ modelling of tumour growth. Prog. Biophys. Mol. Biol. 2004, 85, 451–472. [Google Scholar] [CrossRef]
  29. Cappuccio, A.; Tieri, P.; Castiglione, F. Multiscale modelling in immunology: A review. Briefings Bioinform. 2015, 17, 408–418. [Google Scholar] [CrossRef] [PubMed]
  30. Kuznetsov, M.; Clairambault, J.; Volpert, V. Improving cancer treatments via dynamical biophysical models. Phys. Life Rev. 2021, 39, 1–48. [Google Scholar] [CrossRef]
  31. Bellomo, N.; Bianca, C.; Delitala, M. Complexity analysis and mathematical tools towards the modelling of living systems. Phys. Life Rev. 2009, 6, 144–175. [Google Scholar] [CrossRef]
  32. Bianca, C. Onset of nonlinearity in thermostatted active particles models for complex systems. Nonlinear Anal. Real World Appl. 2012, 13, 2593–2608. [Google Scholar] [CrossRef]
  33. Bianca, C.; Dogbe, C. Kinetic models coupled with Gaussian thermostats: Macroscopic frameworks. Nonlinearity 2014, 27, 2771–2803. [Google Scholar] [CrossRef]
  34. Bianca, C.; Dogbe, C.; Lemarchand, A. The Role of Nonconservative Interactions in the Asymptotic Limit of Thermostatted Kinetic Models. Acta Appl. Math. 2015, 139, 1–24. [Google Scholar] [CrossRef]
  35. Bianca, C.; Lemarchand, A. Density evolution by the low-field limit of kinetic frameworks with thermostat and mutations. Commun. Nonlinear Sci. Numer. Simul. 2015, 20, 14–23. [Google Scholar] [CrossRef]
  36. Bianca, C.; Lemarchand, A. Miming the cancer-immune system competition by kinetic Monte Carlo simulations. J. Chem. Phys. 2016, 145, 154108. [Google Scholar] [CrossRef]
  37. Masurel, L.; Bianca, C.; Lemarchand, A. On the learning control effects in the cancer-immune system competition. Phys. A Stat. Mech. Its Appl. 2018, 506, 462–475. [Google Scholar] [CrossRef]
  38. Masurel, L.; Bianca, C.; Lemarchand, A. Space-velocity thermostatted kinetic theory model of tumor growth. Math. Biosci. Eng. 2021, 18, 5525–5551. [Google Scholar] [CrossRef]
  39. Bird, G.A. Molecular Gas Dynamics and Direct Simulation of Gas Flows; Clarendon: Oxford, UK, 1994. [Google Scholar]
  40. Alexander, F.J.; Garcia, A.L. The Direct Simulation Monte Carlo Method. Comput. Phys. 1997, 11, 588–593. [Google Scholar] [CrossRef]
  41. Lemarchand, A.; Nowakowski, B. Perturbation of particle velocity distribution in a bistable chemical system. Phys. A Stat. Mech. Its Appl. 1999, 271, 87–101. [Google Scholar] [CrossRef]
  42. Nowakowski, B.; Lemarchand, A. Thermal explosion near bifurcation: Stochastic features of ignition. Phys. A Stat. Mech. Its Appl. 2002, 311, 80–96. [Google Scholar] [CrossRef]
  43. Lemarchand, A.; Nowakowski, B. Enhanced sensitivity of a thermochemical system to microscopic perturbations. Phys. A Stat. Mech. Its Appl. 2004, 331, 409–421. [Google Scholar] [CrossRef]
  44. Gillespie, D.T. Exact stochastic simulation of coupled chemical reactions. J. Phys. Chem. 1977, 81, 2340–2361. [Google Scholar] [CrossRef]
  45. van der Bruggen, P.; Traversari, C.; Chomez, P.; Lurquin, C.; Plaen, E.D.; den Eynde, B.V.; Knuth, A.; Boon, T. A gene encoding an antigen recognized by cytolytic T lymphocytes on a human melanoma. Science 1992, 254, 1643–1647. [Google Scholar] [CrossRef] [PubMed]
  46. Guermonprez, P.; Valladeau, J.; Zitvogel, L.; Théry, C.; Amigorena, S. Antigen presentation and T cell stimulation by dendritic cells. Annu. Rev. Immunol. 2002, 20, 621–667. [Google Scholar] [CrossRef] [PubMed]
  47. Cuccu, A.; Francescangeli, F.; Angelis, M.L.D.; Bruselles, A.; Giuliani, A.; Zeuner, A. Analysis of Dormancy-Associated Transcriptional Networks Reveals a Shared Quiescence Signature in Lung and Colorectal Cancer. Int. J. Mol. Sci. 2022, 23, 9869. [Google Scholar] [CrossRef] [PubMed]
  48. Huang, S. Reconciling Non-Genetic Plasticity with Somatic Evolution in Cancer. Trends Cancer 2021, 7, 309–322. [Google Scholar] [CrossRef] [PubMed]
  49. Francescangeli, F.; Contavalli, P.; Angelis, M.D.; Careccia, S.; Signore, M.; Haas, T.L.; Salaris, F.; Baiocchi, M.; Boe, A.; Giuliani, A.; et al. A pre-existing population of ZEB2+ quiescent cells with stemness and mesenchymal features dictate chemoresistance in colorectal cancer. J. Exp. Clin. Cancer Res. 2022, 39, 2. [Google Scholar] [CrossRef]
  50. Weiss, F.; Lauffenburger, D.; Friedl, P. Towards targeting of shared mechanisms of cancer metastasis and therapy resistance. Nat. Rev. Cancer 2022, 22, 157–173. [Google Scholar] [CrossRef]
  51. Nicolis, G.; Prigogine, I. Self-Organization in Nonequilibrium Systems; Wiley: New York, NY, USA, 1977. [Google Scholar]
  52. Lemarchand, A.; Jullien, L. Tuning a reaction using two-site catalysis and far-from-equilibrium conditions. Phys. Chem. Chem. Phys. 2004, 6, 398–405. [Google Scholar] [CrossRef]
  53. Murray, J.D. Mathematical Biology I: An Introduction; Springer: New York, NY, USA, 2011. [Google Scholar]
  54. Morgado, G.; Nowakowski, B.; Lemarchand, A. Fisher-Kolmogorov-Petrovskii-Piskunov wave front as a sensor of perturbed diffusion in concentrated systems. Phys. Rev. E 2019, 99, 022205. [Google Scholar] [CrossRef]
  55. Morgado, G.; Nowakowski, B.; Lemarchand, A. Stochastic approach to Fisher and Kolmogorov, Petrovskii, and Piskunov wave fronts for species with different diffusivities in dilute and concentrated solutions. Phys. A Stat. Mech. Appl. 2020, 558, 124954. [Google Scholar] [CrossRef]
  56. Bellouquid, A.; Delitala, M. Mathematical Modeling of Complex Biological Systems—A Kinetic Theory Approach; Birkhäuser: Boston, MA, USA, 2006. [Google Scholar] [CrossRef]
  57. Lillo, S.D.; Delitala, M.; Salvatori, M.C. Modelling epidemics and virus mutations by methods of the mathematical kinetic theory for active particles. In Mathematical Models and Methods in Applied Sciences; Bellomo, N., Brezzi, F., Eds.; World Scientific: Singapore, 2009; Volume 19, pp. 1405–1425. [Google Scholar] [CrossRef]
  58. Tsukahara, T.; Kawaguchi, S.; Torigoe, T.; Asanuma, H.; Nakazawa, E.; Shimozawa, K.; Nabeta, Y.; Kimura, S.; Kaya, M.; Nagoya, S.; et al. Prognostic significance of HLA class I expression in osteosarcoma defined by anti-pan HLA class I monoclonal antibody, EMR8-5. Cancer Sci. 2006, 97, 1374–1380. [Google Scholar] [CrossRef] [PubMed]
  59. McQuarrie, D.A. Statistical Mechanics; Harper and Row: New York, NY, USA, 1975. [Google Scholar]
  60. Gandhi, S.A.; Kampp, J. Skin Cancer Epidemiology, Detection, and Management. Med. Clin. N. Am. 2015, 99, 1323–1335. [Google Scholar] [CrossRef] [PubMed]
  61. Lucas, Z.; Mukherjee, A.; Chia§, S.; Veytsman, I. Metastasis of Laryngeal Squamous Cell Carcinoma to Bilateral Thigh Muscles. Case Rep. Oncol. Med. 2014, 2014, 424568. [Google Scholar] [CrossRef] [PubMed]
  62. Whiteley, A.E.; Price, T.T.; Cantelli, G.; Sipkins, D.A. Leukaemia: A model metastatic disease. Nat. Rev. Cancer 2021, 21, 461–475. [Google Scholar] [CrossRef]
  63. Turnquist, C.; Ryan, B.M.; Horikawa, I.; Harris, B.T.; Harris, C.C. Cytokine Storms in Cancer and COVID-19. Cancer Cell 2020, 38, 598–601. [Google Scholar] [CrossRef] [PubMed]
  64. Goldbeter, A. Biochemical Oscillations and Cellular Rhythms; Cambridge University Press: New York, NY, USA, 2010. [Google Scholar] [CrossRef]
  65. Westera, L.; Drylewicz, J.; Den Braber, I.; Mugwagwa, T.; Van Der Maas, I.; Kwast, L.; Volman, T.; Van De Weg-Schrijver, E.H.; Bartha, I.; Spierenburg, G.; et al. Closing the Gap between T-Cell Life Span Estimates from Stable Isotope-Labeling Studies in Mice and Humans. Blood 2013, 122, 2205–2212. [Google Scholar] [CrossRef]
  66. Macallan, D.C.; Borghans, J.A.M.; Asquith, B. Human T Cell Memory: A Dynamic View. Vaccines 2017, 5, 5. [Google Scholar] [CrossRef]
  67. Wennberg, B.; Wondmagegne, Y. The Kac Equation with a Thermostatted Force Field. J. Stat. Phys. 2006, 124, 859–880. [Google Scholar] [CrossRef]
  68. Wennberg, B.; Wondmagegne, Y. Stationary States for the Kac Equation with a Gaussian Thermostat. Nonlinearity 2004, 17, 633–648. [Google Scholar] [CrossRef]
  69. Tanimoto, J. Sociophysics Approach to Epidemics; Springer: Singapore, 2021. [Google Scholar]
  70. Radha, G.; Lopus, M. The spontaneous remission of cancer: Current insights and therapeutic significance. Transl. Oncol. 2021, 14, 101166. [Google Scholar] [CrossRef] [PubMed]
  71. Sawamura, M.; Yamaguchi, S.; Murakami, H.; Kitahara, T.; Itoh, K.; Maehara, T.; Kawada, E.; Matsushima, T.; Tamura, J.; Naruse, T.; et al. Cyclic Haemopoiesis at 7- or 8-Day Intervals. Br. J. Haematol. 1994, 88, 215–218. [Google Scholar] [CrossRef]
  72. Coventry, B.J.; Ashdown, M.L.; Quinn, M.A.; Markovic, S.N.; Yatomi-Clarke, S.L.; Robinson, A.P. CRP Identifies Homeostatic Immune Oscillations in Cancer Patients: A Potential Treatment Targeting Tool? J. Transl. Med. 2009, 7, 102. [Google Scholar] [CrossRef] [PubMed]
  73. Mahmoud, F.A.; Rivera, N.I. The Role of C-Reactive Protein as a Prognostic Indicator in Advanced Cancer. Curr. Oncol. Rep. 2002, 4, 250–255. [Google Scholar] [CrossRef]
  74. Fahimi, M.; Nouri, K.; Torkzadeh, L. Chaos in a stochastic cancer model. Phys. A Stat. Mech. Appl. 2020, 545, 123810. [Google Scholar] [CrossRef]
  75. Gillespie, D.T. The chemical Langevin equation. J. Chem. Phys. 2000, 113, 297–306. [Google Scholar] [CrossRef]
  76. Pikovsky, A.S.; Kurths, J. Coherence Resonance in a Noise-Driven Excitable System. Phys. Rev. Lett. 1997, 78, 775–778. [Google Scholar] [CrossRef]
  77. Lemarchand, A.; Nowakowski, B. Internal fluctuations in a thermochemical system: Excitability, oscillations and coherence resonances. J. Phys. Condens. Matter 2007, 19, 065130. [Google Scholar] [CrossRef]
  78. Kolbus, A.; Lemarchand, A.; Kawczynski, A.L.; Nowakowski, B. Coherence resonances in an excitable thermochemical system with multiple stationary states. Phys. Chem. Chem. Phys. 2010, 12, 13224–13231. [Google Scholar] [CrossRef]
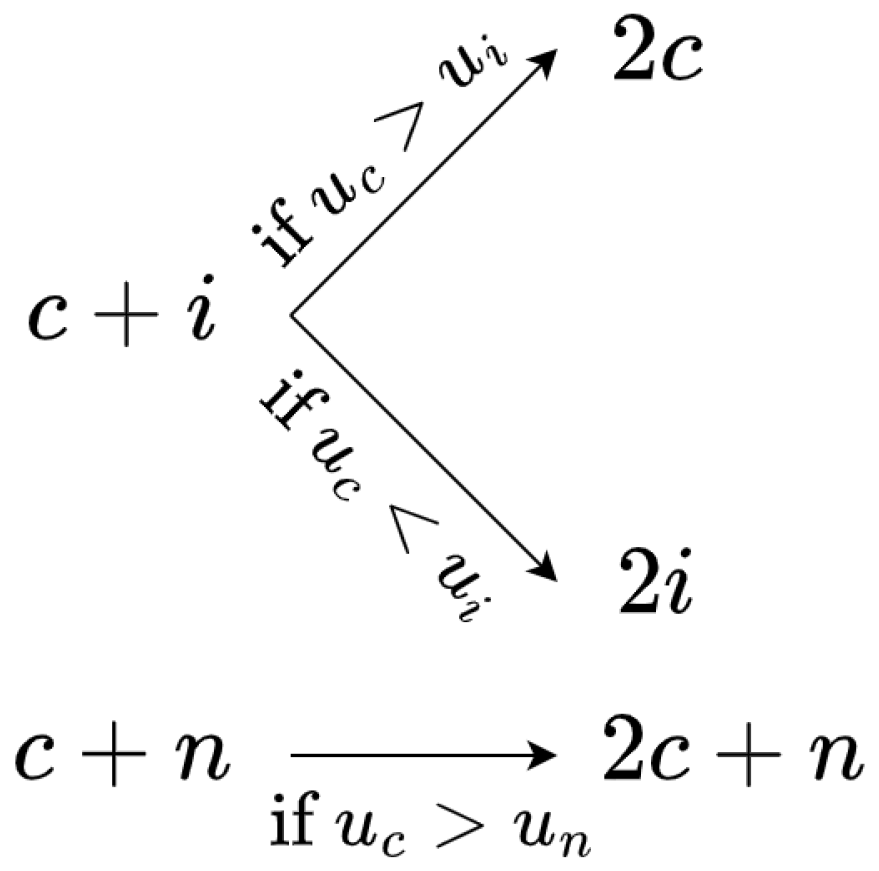
Figure 1. Scheme of the activity-dependent interactions between cells of type j and activity u j where j = i , c , n . Immune cells are denoted by i, cancer cells by c, and normal cells by n.
Mathematics 11 02188 g001
Figure 2. Kinetic Monte Carlo simulations of the master equation based on the Gillespie algorithm for a small field E = 10 5 . (a,c) Evolution of the scaled numbers of cancer cells N c / Ω (solid red line) and immune system cells N i / Ω (dashed blue line). (b,d) Evolution of the quantity E / α (dotted black line) and the mean activities of cancer cells u c (solid red line), immune system cells u i (dashed blue line), and normal cells u n (dot-dashed purple line). Two typical behaviors are observed depending on the seed of the random number generator: (a,b) The 3Es of immunotherapy, N i end = 0 , and divergence of N c . (c,d) Elimination of cancer, N c end = 0 . Parameter values: N n = 800 , N c 0 = 100 , N i 0 = 100 , Ω = 100 , initial activities of the different cell types j = i , c , n sampled from a Gaussian distribution of standard deviation σ = 0.2 and mean value u i 0 = u c 0 = u n 0 = 0.5 , k i c / Ω = 10 2 , k c i / Ω = 10 3 , k c n / Ω = 10 6 , ϵ = 10 3 , u 0 = 0.01 , b = 1.3 , Δ t = 0.0165 .
Mathematics 11 02188 g002
Figure 3. Analogous caption as in Figure 2 for an intermediate field E = 10 3.5 and the same additional parameters. Three typical behaviors are observed depending on the seed of the random number generator: (a,b) Destruction of the immune system, N i end = 0 , but control of cancer, u c end = E / α . (c,d) Elimination of cancer, N c end = 0 . (e,f) Control of cancer, N i end N c end 0 and u c end = u i end = E / α .
Mathematics 11 02188 g003
Figure 4. Analogous caption as in Figure 2 for a large field E = 10 2 and the same additional parameters. A single type of behavior is observed: (a,b) Control of cancer, N i end N c end 0 and u c end = u i end = E / α .
Mathematics 11 02188 g004
Figure 5. Results of the master equation. (a) Probability of occurrence of the three cases shown in Figure 3 versus field E in logarithmic scale for b = 1.3 . (b) Probability of occurrence of the three cases shown in Figure 3 versus the base b used to discretize the logarithm of the activities for E = 10 3.2 . Statistics on 30 seeds of the random number generator. Black solid squares: Control of the cancer, N i end N c end 0 . Red crosses: Elimination of cancer, N c end = 0 . Blue open squares: Escape of cancer from immunosurveillance, N i end = 0 . Same other parameter values as in Figure 2.
Mathematics 11 02188 g005
Figure 6. Results of the direct simulation Monte Carlo of the kinetic equations [37]. Probability of occurrence of the three typical behaviors leading to N i end N c end 0 , N c end , or N i end versus field E in logarithmic scale for the same parameter values as in Figure 5.
Mathematics 11 02188 g006
Figure 7. Mean induction time for reaching N i end = 0 versus field E in logarithmic scale. The blue open squares give DSMC results averaged over 800 realizations and associated with the 3Es [37]. The black solid squares (the black crosses, resp.) give the results of the master equation averaged over 24 realizations and associated with the 3Es (the stabilization in a steady state, resp.).
Mathematics 11 02188 g007
Figure 8. The two families I and II of steady states of the macroscopic equations (Equations (26)–(31)) for the following parameters: E = 10 5 , α = 1.43 × 10 5 , ρ n = 8 , k i c = 1 , k c i = 10 1 , k c n = 10 4 , ϵ = 10 3 . (a) ρ i I = 0 , U c I = U n I = E / α , U i I versus ρ c I in blue (Equation (32)), (b) ρ c II = 0 , U i II = U n II = E / α , U c II versus ρ i II in red (Equation (33)).
Mathematics 11 02188 g008
Figure 9. Variation in the steady activities U i I and U c II of type I and II versus decimal logarithm of the field log 10 ( E ) for E / α 18.7 E + 0.7 , ρ c I = ρ i II 2 and the same additional parameters as in Figure 8.
Mathematics 11 02188 g009
Figure 10. Numerical solutions for the macroscopic equations for a small field E = 10 5 , α = 1.43 × 10 5 , ρ n = 8 , ρ i 0 = 1 , ρ c 0 = 1 , k i c = 1 , k c i = 10 1 , k c n = 10 4 , ϵ = 10 3 , U n 0 = 0.5 . The constant quantity E / α is represented by a black dotted line. (a,c) Evolution of the concentrations of cancer cells ρ c (solid red line) and immune system cells ρ i (dashed blue line). (b,d) Evolution the activities of cancer cells U c (solid red line), immune system cells U i (dashed blue line), normal cells U n (dot-dashed purple line). Two typical behaviors are observed depending on the initial values of the activities: (a,b) U c 0 = 0.53 , U i 0 = 0.47 , destruction of the immune system, ρ i end 0 , and control of a high constant concentration of cancer cells ρ i end . (c,d) U c 0 = 0.47 , U i 0 = 0.53 , elimination of cancer, ρ c end 0 .
Mathematics 11 02188 g010
Figure 11. Analogous caption as in Figure 10 for a larger field E = 10 2 , α = 0.0195 . The other parameters, ρ n , ρ i 0 , ρ c 0 , k i c , k c i , k c n , ϵ , and U n 0 , are given in the caption of Figure 10. (a,b) U c 0 = 0.52 , U i 0 = 0.51 . (c,d) U c 0 = 0.51 , U i 0 = 0.52 . In each case, control of cancer, ρ i end ρ c end 0 and U c end = U i end = U n end = E / α .
Mathematics 11 02188 g011
Figure 12. Analogous caption as in Figure 10 for a larger activity increase ϵ = 0.3 , E = 10 3 , α = 1.43 × 10 3 , ρ n = 80 , U c 0 = 0.59 , and U i 0 = 0.6 . The other parameters, k i c , k c i , k c n , ρ c 0 , ρ i 0 , and U n 0 , are given in the caption of Figure 10. (a,b) The 3Es of immunotherapy, ρ i end 0 and divergence of ρ c .
Mathematics 11 02188 g012
Figure 13. Analogous caption as in Figure 12 for E = 10 2 and α = 1.43 × 10 2 . (a,b) Control of cancer after its quasi-elimination and despite destruction of the immune system; high steady concentration of cancer cells ρ i end , vanishing concentration of immune system cells ρ c end 0 , and steady activities U c end = U i end = U n end = E / α .
Mathematics 11 02188 g013
Disclaimer/Publisher’s Note: The statements, opinions and data contained in all publications are solely those of the individual author(s) and contributor(s) and not of MDPI and/or the editor(s). MDPI and/or the editor(s) disclaim responsibility for any injury to people or property resulting from any ideas, methods, instructions or products referred to in the content.