Abstract
Among the studies of the effect of rock’s heterogeneity on hydraulic fracture propagation, very little information on the effects of the heterogeneity of rock’s fracture toughness is available. The objective of the present paper is to develop a planar-3D model for studying the effect of the heterogeneity of rock’s fracture toughness on hydraulic fracture propagation. Not only the stage of fracture propagation, but also the stage before the fracture propagation is considered in this model. Based on the proposed model, the evolution of hydraulic fracture propagation under a typical heterogeneous distribution of rock’s fracture toughness and the solution at the stage before fracture propagation are analyzed in detail. Furthermore, a series of numerical comparison experiments including five different distributions of rock’s fracture toughness are made in order to study the effect of the heterogeneity of rock’s toughness. The results indicate that the minimum fracture radius and the contrast of rock’s fracture toughness between adjacent layers are important parameters for determining the size and location of the maximum fracture opening. Most importantly, the fracture contour is greatly affected by the heterogeneity of rock’s fracture toughness.
Keywords:
planar-3D model; hydraulic fracture; inhomogeneous fracture toughness; early-time solution MSC:
97M50
1. Introduction
Hydraulic fracturing is now widely used in various engineering practices, such as in-situ stress measurement [1,2], underground heat extraction [3,4], preconditioning and cave inducement in mining [5,6,7], and is mostly applied to increase the production of oil and gas wells [8]. Nevertheless, the evolution of hydraulic fracture is a very complex mechanical problem that is related to the nonlinear coupling of fluid and solid mechanics: on one hand, the fluid flow in the fracture is governed by the lubrication equation [9], which is a nonlinear partial differential equation of the fracture opening and fluid pressure; while on the other hand, the fracture opening is related to the fluid pressure and the in situ stress by the elasticity equation [10,11]. Moreover, the fracture area will increase with the hydraulic fluid injected into the fracture, which is controlled by the fracture propagation criterion based on the linear elasticity fracture mechanics. Moreover, if the heterogeneity of a solid medium is considered, the model of hydraulic fracture propagation becomes more complex.
At present, algorithms for two-dimensional (2D) models with consideration of heterogeneous factors (the anisotropic elastic properties [12,13], non-uniform in situ stress [14], an inhomogeneous permeability [15]) are relatively mature. For planar-3D or 3D models, although many algorithms and simulators [16,17,18,19,20] have been proposed for studying the effects of different parameters on hydraulic fracture propagation, the rock’s heterogeneity is generally ignored in these algorithms and simulators.
In fact, rocks around the reservoir show obvious layered inhomogeneity because of the deposition and compaction processes [21,22]. Each layer of rock has its own in situ stress, stiffness, porosity and permeability, as well as fracture toughness. With regard to these factors, the heterogeneity of in situ stress [23,24], stiffness (elastic modulus and Poisson’s ratio) [25,26], and porosity [27,28] are studied, whereas the heterogeneity of the fracture toughness of rock is rarely studied [29]. In fact, the laboratory and numerical experiments [30,31] prove that rock’s fracture toughness in unconventional reservoirs is highly inhomogeneous because of its anisotropy and the spatial variation of the clay content. Results from studies [29,32] demonstrate that fracture toughness is a critical parameter that is responsible for the fracture initiation and propagation based on the linear elastic fracture mechanics.
In most studies of the heterogeneity of multi-layered rock [33,34,35,36], the effect of the heterogeneous fracture toughness is usually studied together with the effects of the heterogeneous elastic properties (the elastic modulus and Poisson’s ratio), and the non-uniformly distributed in situ stress; they are rarely designed to determine the independent effect of heterogeneous fracture toughness on fracture propagation. For this purpose, researchers started to pay attention to the effect of anisotropy of rock’s fracture toughness on the evolution of hydraulic fracture, and proposed many models and numerical algorithms [37,38,39]. In these models, it is assumed that the hydraulic fracture propagates in a plane perpendicular to the plane of isotropy, and the fracture toughness is a function of the local propagation direction. Three-dimensional displacement discontinuity methods for crack problems in layered rocks were developed and discussed in several papers [40,41,42,43,44]. The propagation of a penny-shaped fluid-driven fracture in impermeable rock, as well as accounting for the fluid leak-off, was also studied [45,46,47,48]. The study of stress intensity factors for branching cracks in three-dimensional space was performed [49,50,51]. In addition, the formation and cleaning of hydraulically driven fractures in 3-D space was discussed in some studies [52,53].
The weakness of the existing models is that the early-time evolution of hydraulic fracture, including the stage before fracture propagation and the stage of early-time propagation, is not considered. Furthermore, the treatment for singularity at the wellbore owing to the neglecting of the wellbore radius and the treatment for fluid pressure at the fracture front are not described, which are very important for analysing the model.
Therefore, in order to overcome the above-mentioned drawbacks, we tried to establish a planar-3D model for studying the effect of heterogeneous fracture toughness on hydraulic fracture propagation in the early-time stage based on the methods developed by us in previous studies [54,55,56]. In this model, the whole evolution process including the stage before propagation and the stage of early-time propagation were considered. In the algorithm, we described in detail the solving process of the two stages, including the treatment for governing equations in the irregular fracture area, the treatment for singularity at the wellbore, and the treatment for fluid pressure at the fracture front. Furthermore, the final discrete system of equations with its Jacobian matrix for iteration is also given for numerical solutions.
2. Mathematical Model
2.1. Assumptions
Figure 1 shows a planar-3D hydraulic fracture induced by fluid injection from the wellbore (radius ) with a volumetric velocity . The fracture is symmetric about the plane with a footprint () inscribed within the curve . The wellbore is along the axis and is located at the origin of the coordinate system. The solid medium is characterized by Young’s modulus , Poisson’s ratio , and fracture toughness . When the hydraulic fluid is injected into the fracture, the fracture will propagate radially on the boundary points, which satisfy the fracture propagation criterion.
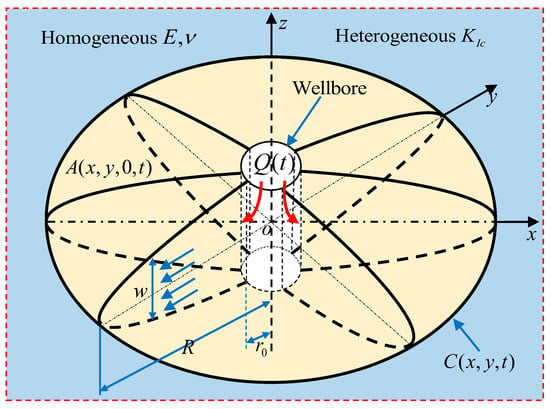
Figure 1.
A planar-3D fracture hydraulically induced by fluid injection from the wellbore in a solid medium with inhomogeneous fracture toughness. The direction of hydraulic fracture tip propagation is in the xOy plane. The blue fluid velocity arrows in the cross section illustrate the direction.
It is well known that hydraulic fracturing is a complex multidisciplinary field that includes solid mechanics (responsible for fracture opening), fluid mechanics (responsible for fluid flow), linear elastic fracture mechanics (responsible for fracture propagation), and seepage mechanics (responsible for fluid leak-off). Furthermore, these branches of mechanics are coupled with each other in complex forms in hydraulic fracturing. In this paper, the primary attention focusses on the effect of heterogeneous fracture toughness on hydraulic fracture propagation. Therefore, in order to simplify the complexity of the model, we made the following assumptions:
- (1)
- In the solid medium (rocks), there is only one planar fracture, and it propagates only on this plane and will not be out of this plane.
- (2)
- The solid medium is a linear elastic material with homogeneous Young’s modulus , Poisson’s ratio , and the heterogeneous fracture toughness .
- (3)
- The fluid flow is governed by lubrication theory, and the hydraulic fluid is incompressible and Newtonian, with a viscosity .
- (4)
- The fracture propagation is controlled by the rock fracture toughness according to the linear elastic fracture mechanics.
- (5)
- The in situ stress perpendicular to the fracture plane is homogeneous, and the fluid leak-off and the effect of gravity are neglected.
- (6)
- The fluid front coincides with the fracture front because of the negligible lag between the two fronts [39].
- (7)
- The initial fracture has a penny-shaped footprint with a radius , the formation process of which is not considered in this model.
The theory of fractures introduces three stress intensity coefficients in the tip of a fracture depending on the character of loading. There can be fractures in tensile loading, and fractures in shear and anti-plane deformations. We use only one criterion for fracture propagation in tensile loading (), because for hydraulically driven fractures, the shear stresses on the fracture walls induced by fracturing fluid flow are several orders of magnitude smaller than the tensile loading due to the elevated pressure in the fracturing fluid. Since the distribution of rock toughness is non-uniform, it is impossible for all fracture boundary points to expand forward at the same time. This leads to different fracture radii along different radial directions, namely the fracture radius in the coordinate system, which is equivalent to the boundary curve with the relationship .
2.2. Governing Equations
According to the linear elastic theory, the planar-3D relationship between the fracture opening and the fluid pressure can be obtained by a hyper-singular integral equation [40]:
where is the net pressure acting on the unit area of the crack surface, . It needs to be pointed out that this equation is not convenient for numerical calculation because of its hyper singularity at some special points, so Crouch and Starfield [41] proposed the displacement discontinuity method (DDM), which is quite suitable for calculating the fracture opening without the singularity.
According to the above assumption, the flow in the fracture is laminar, so the fluid flux can be defined by Poiseuille’s law [55]
where . Since the fracture footprint is irregular, there are two directional fluid flows in the fracture, namely, the gradient operator . Due to the incompressibility of the fluid and no fluid leak-off, the continuity equation has the following form [53]:
2.3. Boundary and Initial Conditions
The initial fracture footprint and the wellbore are circular, while the fracture propagation is non-uniform, so it is more convenient to describe and solve this model in the cylindrical coordinates .
The boundary condition at the wellbore is determined by the injection condition. Generally, there are two different injection modes in experiments or practices: the constant volumetric velocity of injection and the constant fluid pressure at the wellbore. In this model we chose the first mode, namely, as a constant, so the boundary condition at the wellbore was formulated as [52]:
here is the wellbore radius, which is relatively small compared with the fracture radius, so we can assume that pressure around the wellbore is uniformly distributed; there is no circular pressure gradient in the wellbore. In addition, the crack opening around the wellbore is the same, namely, .
The boundary conditions at the fracture front are deduced from the propagation criterion, the zero flux condition, and the zero fracture opening. According to the linear elastic fracture mechanics, when stress intensity factor at a point of the fracture front is equal to or greater than the corresponding rock fracture toughness , the fracture will propagate radially at this point, so the propagation condition is as follows [49,50,51].
The stress intensity factor is related to the fracture opening near the fracture front by the following limit expression [42]:
here is the radial coordinate on the fracture plane, and is the fracture radius along some radial direction. The remaining boundary conditions at the fracture front can be easily written as
Through the analysis, we find that boundary conditions (4) and (7) are only related to the pressure gradient, which are called Neumann boundary conditions and require special consideration for solutions [43].
In order to simplify the model, we assume that the initial fracture has a penny shape with a radius , and the hydraulic fluid remains still because of the uniform distribution of the fluid pressure at the initial moment (see Figure 2), namely:
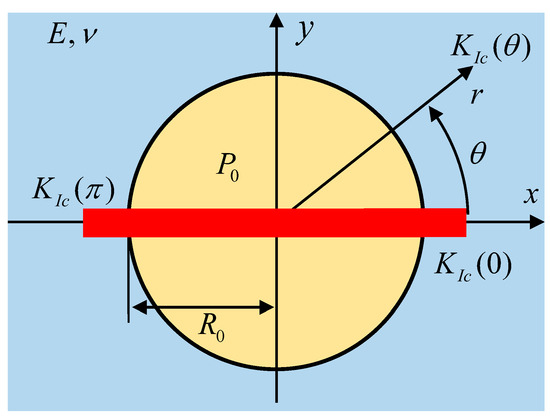
Figure 2.
The non-homogeneous and layered distribution of rock fracture toughness in the reservoir. Hoop angle is an angular coordinate in the plane of fracture propagations. The rock toughness is assumed to be dependent on this angle.
The value of is sufficiently small, which cannot lead to immediate fracture propagation, so the stage before initial propagation is also considered in this model. It needs to be pointed out that at this stage the fracture is symmetric about the wellbore, so in Equation (2) the gradient operator has only one term, namely, (at the stage before initial propagation there is only a radial fluid flow).
2.4. Distribution of Rock Toughness
The complete expression for the heterogeneous fracture toughness is a function of position, namely, in the polar coordinate system [44]. However, in order to take into account the layered characteristics of rock in the reservoir [37], we assume that the non-homogeneous fracture toughness is only related to the hoop angle :
This expression can describe not only the horizontal stratification of rock, but also the oblique stratification of rock with an angle to the horizontal. Figure 2 shows a layered distribution of heterogeneous fracture toughness: the horizontal layer drawn by the wide red line is the pay zone of the reservoir, which has a fracture toughness that is distinct from the fracture toughness of the remaining zones (barrier zones). The wider the red line is, the thicker the pay zone will be in the reservoir. The other important reason of formulating the non-homogeneous fracture toughness with the hoop angle is that this mathematical model will be easier and more convenient to be solved in the coordinate system .
3. Model Discretization
3.1. Fracture Discretization and Propagation
In the polar coordinate system, the hydraulic fracture is divided into cells along the radial and hoop angle directions (see Figure 3), and and are the grid steps in the two directions. The red curve is the fracture front , the black dots are the boundary points at the fracture front, the black dots with red edge are the vertices of cells, and the blue dots are the cells’ centers on which all physical parameters (the two-dimensional numbering of cells (), cell coordinates (), fracture opening and net pressure ) are set. and are distances and angles between two adjacent cells along the radial and hoop directions, respectively. The zone composed of fracture cells with the same radial coordinate is known as the “circumferential region ”, and the zone composed of fracture cells with the same hoop coordinate is known as the “radial region ”. This discretization for the fracture also coincides with the expression of heterogeneous rock toughness (Equation (10)), because each radial region , namely, the area which the red dotted line passes in Figure 3, has an identical fracture toughness . , is the total number of cells of the longest radial region, and this will increase with the fracture propagation. , is a constant.
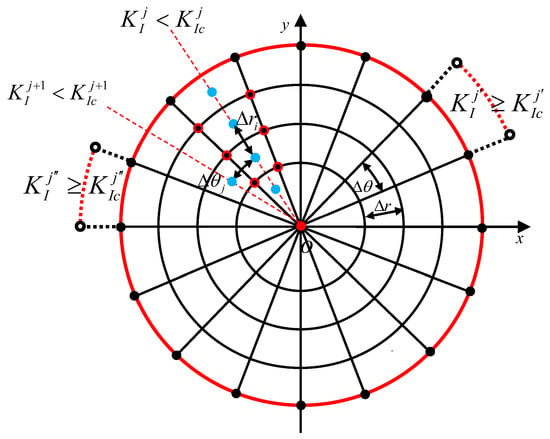
Figure 3.
The discretization for the fracture along the radial and hoop directions.
With the injection of hydraulic fluid, the stress intensity factor of boundary cells increases. When of some boundary cells satisfy the propagation condition (5), the corresponding fracture front grows forward. In Figure 3, two examples are given: the radial regions and propagate, because their stress intensity factors satisfy and . The fracture contour is composed of a smooth curve by connecting the midpoints of the outer edges of the boundary cells. For the non-uniform fracture propagation, the exact propagation length of each propagating boundary point is difficult to determine based on the existing theory. In order to simplify the calculation, we assume that the propagation length of each propagating point is one fracture cell () at every time (when is enough small, the calculation accuracy can be guaranteed).
It is noted that the size of the wellbore is not considered in this fracture gird, namely, the wellbore is seen as a point source [45,46]. That is because, on the one hand, the radius of wellbore is much less compared with the fracture size, while on the other hand, the parameter does not enter into the final system of equations, which will be proved by Equation (14). The logarithmical singularity of the fluid pressure at the wellbore is solved by introducing an additional assumption: the net pressure at the wellbore and the net pressures , of its two nearest cells on the radial region satisfy the following relationship [45,46]
where and are constants, obtained by the numerical solutions of , .
3.2. Discretization of Governing Equations
It is well known that the elasticity Equation (1) is not suitable for numerical calculation because of the singularity. For this purpose, we introduce the 3D displacement discontinuity method (3D-DDM) [41] for the relationship between the fracture opening and the net pressure . There is only one discontinuous displacement, , in this model, that being the fracture opening ().
In our discrete fracture grids, there are two kinds of cell shape: triangle (the first circumferential region ) and trapezoid (circumferential regions , ). For this discrete fracture grid, the numerical solution for the net pressure related to the discontinuous displacement was obtained [47]:
In Equation (12), p is fluid pressure and D is the crack opening corresponding to this pressure. Their relationship is not determined by fluid properties, but it is determined by the solution of the elastic problem in the medium surrounding the crack. Here is the net pressure of the -th fracture cell, is the fracture opening of the -th fracture cell, is the total number of fracture cells, and and are values of the one-dimensional numbering of fracture cells (). is the second derivative of the influence function with respect to . The influence function is given in detail in Appendix A. and are the vectors of fluid pressures and the fracture opening , respectively. is the coefficient matrix, each element of which is .
With the substitution of Equation (2), the expanded form of continuity in Equation (3) is rewritten in the polar coordinate system as
The discrete form in the finite volume scheme is
where () is the two-dimensional numbering of fracture cells, and is the number of calculation steps. is the time step, and and represent the fracture openings of cell () at the previous and present moment, respectively.
The boundary condition at the wellbore (Equation (4)) can be transformed into the central difference approximation as
because the subscript () in Equation (15) represents the boundary points at the wellbore based on the finite volume method. Moreover, this equation does not contain the parameter , and can be directly substituted into Equation (14) as a whole.
The boundary conditions (7) and (8) at the fracture front are discretized as
where is the total number of fracture cells in the radial region , so () is the two-dimensional numbering of boundary points on the fracture front. When the evolution enters into the propagation stage, the fracture will have an irregular front, which leads to different values of in different radial regions (). At the stage before fracture propagation, all values of are equal to ().
It was found that discrete boundary conditions (15)–(17) can be directly substituted into the governing Equation (14) to simplify the calculation. This is one of the important reasons why we chose the finite volume method for discretizing the continuity equation and boundary conditions. However, if the Neumann boundary conditions (14) and (15) are substituted directly into the governing Equation (14), it will lead to the singularity of the final coefficient matrix of this model. For this reason, a special treatment is adopted: for the boundary cell () of each radial region , we use the midpoint () (see Figure 4) instead of the boundary point () to discretize the governing Equation (13).

Figure 4.
The one-dimensional fluid flow model at the stage before fracture propagation. , , , , , , , …, , , and are the two-dimensional numbering of points entering into the calculation (the number is omitted). The one-dimensional flow is perpendicular to the well bore and takes place along the radial coordinate in the crack plane.
Equations (5) and (6) together form the fracture propagation condition, which is a limit expression, and can thus be transformed: the fracture opening instead of the limit value with , and instead of the limit value with . At last, the discretized propagation condition is
where and are the fracture opening and radial coordinate of the boundary cell in the radial region . is the radius of the radial region .
4. Numerical Method for Model Solutions
It is known that if the initial fluid pressure is relatively small, the fracture cannot immediately propagate, so the complete evolution process of fracture consists of two stages: the first stage describes the process before fracture propagation, while the second stage is the propagation process.
4.1. The Stage before Propagation
At the stage before fracture propagation, only radial fluid flow exists in the fracture, namely, there is the same fluid flow in all radial regions (), so the hydraulic fluid flow is transformed into one-dimensional, shown in Figure 4. This one-dimensional model is extracted from one arbitrary radial region in Figure 3: each line segment with one blue point represents one fracture cell in the radial region , and the blue points are centers of fracture cells (where parameters , are located). The red point is the point source (the wellbore), the black points with a red edge are common points of adjacent cells, the complete black point is the boundary point of fracture, the blue point with the red edge is the point with the number, () ( is the initial number of fracture cells along the radial direction), which instead of the boundary point () enters into the discrete equation of the boundary fracture cell. In this one-dimensional model, the cell number in () is omitted, because for all radial regions the governing equations for fluid flow are the same.
The governing Equation (13) at the stage before propagation is simplified to Equation (A10). The discretization of Equation (A10) for all fracture cells is divided into four types, owing to the introduction of the inner and outer boundary conditions and the different values of for each cell. These four different types of Equation (A10) are provided in detail in Appendix B. Finally, Equations (A12)–(A15) combine with Equation (12) to form a closed nonlinear system.
It is known that the two-dimensional numbering () for fracture cells is used in discrete Equations (A12)–(A15), whereas the one-dimensional numbering ( or ) for fracture cells is used in Equation (12). Therefore, in order to substitute Equation (12) directly into Equations (A12)–(A15), the one-to-one correspondence between the two kinds of numbering for fracture cells needs to be determined, for which we introduce a transformation matrix : elements of matrix represent the one-dimensional numbering ( or ) of fracture cells, and the locations of matrix elements represent the two-dimensional numbering () of the fracture cells.
4.2. The Stage of Propagation
The stage of fracture propagation is more complex compared with the stage before propagation, because at this stage the model of fluid flow cannot be transformed into a one-dimensional one because of the non-uniform propagation, namely, the third term for the circular flow in Equation (13) is necessary (), so the subscript “” cannot be omitted in equations of fluid flow.
Since the fracture propagates non-uniformly, perhaps there are some convex or concave segments at the fracture front. This means that there may be four possible location relationships between the interior fracture cells () () and their adjacent cells: Figure 5a shows 4 adjacent cells with the two-dimensional numbering: (), (), () and (), around the interior cell (), which is called the “complete interior cell”; the other three cases are exhibited in Figure 5b–d, which are called “left-interior cell”, “right-interior cell” and “radial-interior cell”, respectively. The specific discrete forms of Equation (13) for interior cells shown in Figure 5a–d are given by Equations (A19)–(A22) in Appendix C.
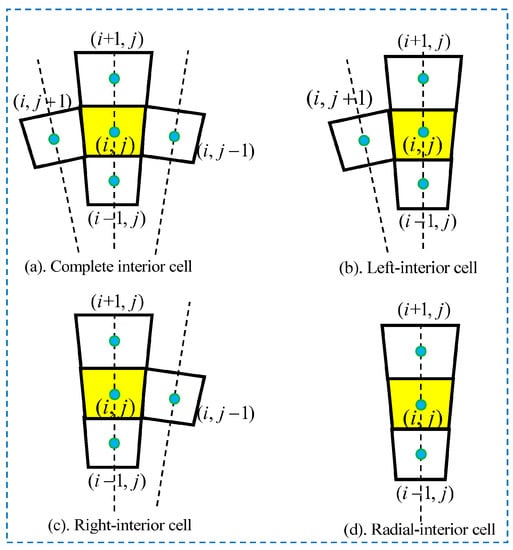
Figure 5.
Four possible location relationships between interior fracture cells and their adjacent fracture cells: the yellow cells with numbers () are interior cells, while the white cells are adjacent cells.
For the outer boundary fracture cells, there may also be four possible location relationships with their adjacent cells, as shown in Figure 6, which are called “complete outer boundary cell”, “left-outer boundary cell”, “right-outer boundary cell”, and “radial-outer boundary cell”, respectively. The corresponding discrete forms of Equation (13) for the outer boundary cells are given by Equations (A22)–(A25) in Appendix C.
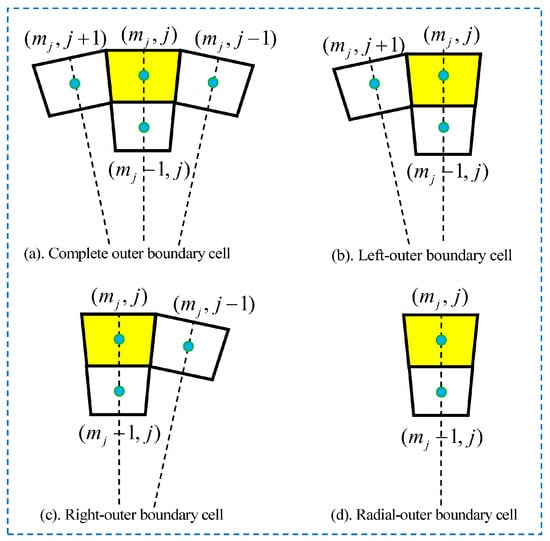
Figure 6.
Four possible location relationships between outer boundary fracture cells and their adjacent fracture cells: the yellow cells with numbers () are outer boundary cells, while the white cells are adjacent cells.
As in the calculation of the stage before propagation, in the calculation of the propagation stage we also need to make the two kinds of fracture cell numbering correspond to each other for the direct substitution of Equation (12) into Equations (A16)–(A25). Similarly, a transformation matrix is introduced for the one-to-one correspondence between the two kinds of fracture cell numbering. The difference of matrix from matrix is that, in addition to non-zero elements ( or ) representing the fracture cells, matrix contains some zero elements, which represent the non-fractured zones. This is because the row number of matrix is determined by the longest radius of the fracture, namely, ( is the total number of fracture cells in the radial region . is the longest radius of the fracture (the red arrow shown in Figure 7)). It is known from Figure 7 that the transformation matrix with the size represents the area enclosed by the red dotted circle, and the fracture is an irregular area enclosed by the thick black curve. Thus, in the area represented by matrix , in addition to the fracture zone (the yellow area), there is also a non-fractured zone (the green area) inside it. For example, the cell denoted by “” in Figure 7 is located in the fracture area, its corresponding one-dimensional number , and the cell denoted by “” is located out of the fracture area (inside the green area), so its one-dimensional number is zero.
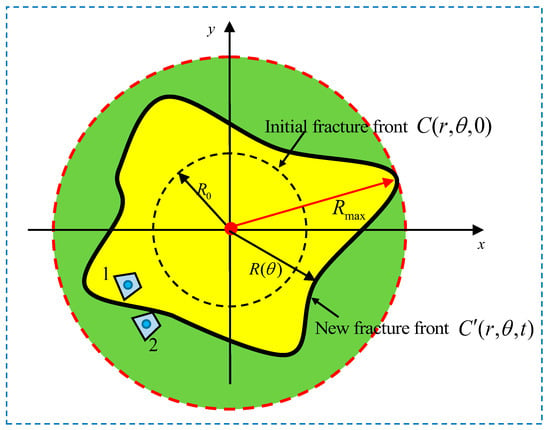
Figure 7.
The new irregular fracture front due to the heterogeneous fracture toughness and the zone represented by matrix includes the fracture zone (the yellow region) and the non-fractured zone (the green region).
5. The Implicit Algorithm and Verification
5.1. Algorithm
The algorithm at the stage before propagation is the same as the algorithm at the stage of propagation. The only difference is that the fracture front at the stage before propagation is constant, not related to time , whereas, at the propagation stage, is a function of the parameter , so here we give a unified algorithm for both two stages.
Since the initial conditions are known, this means that numerical solutions (, and ), transformation matrix , coefficient matrix , and stress intensity factor () at the previous moment are known. Moreover, satisfies the condition ().
The complete algorithm flow chart is shown in Figure 8. First, we estimate the solution of at the current moment , denoted as , and then substitute into the final nonlinear system to get the numerical solution with the help of the Newton iteration method and matrices and . Secondly, we substitute into Equation (17) for obtaining the propagating radial regions, denoted as . If the set is empty, it means that the fracture at this moment does not propagate, is the real numerical solution, denoted as , and then the calculation enters into the third step: the substituting of into Equation (12) for the real numerical solution . If the set is not empty, this means that the fracture will propagate at the radial regions . Accordingly, we need to update matrices and , and obtain the new fracture front and the updated Equation (12) for the new final nonlinear system. Finally, the calculation returns to the first step for iteration: we estimate the new solution of (), and continue the calculation. The iterating calculation cannot stop until the set is empty, namely, the final values of must satisfy the condition . The final obtained values , and are the numerical solutions at the current moment .
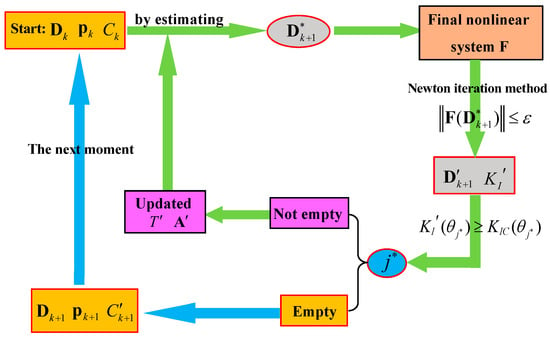
Figure 8.
The algorithm for the two stages of model simulation: is the final nonlinear system of equations, is the allowable error of calculation.
5.2. Verification of the Algorithm
The field tests with detailed measurements allowing for the validation of the developed mathematical model are not available at present. Thus, the verification of the developed model by comparing the numerical results with exact analytical solutions was performed. The results are present in Figure 9. The main model parameters for simulation are shown in Table 1, and the calculation program is written in MATLAB R2018a. Before the simulation, we use the initial conditions to calculate the fracture opening and stress intensity factor for testing the correctness and precision of numerical methods in this model.
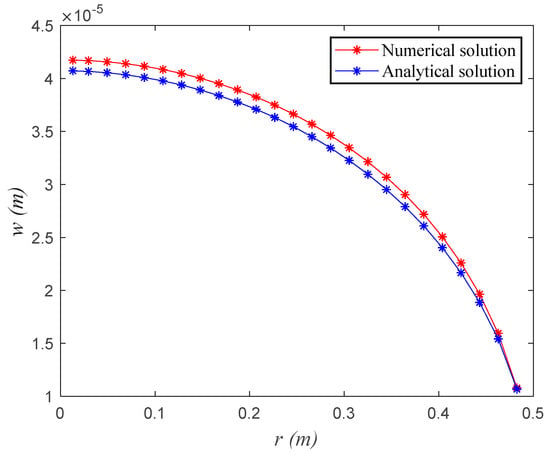
Figure 9.
Comparison results between the analytical solution and the numerical solution for the penny-shaped fracture opening under a uniform pressure.

Table 1.
The main parameters for model simulation.
The analytical solutions for fracture opening and stress intensity factor are obtained from [48]. The comparison results of fracture opening are shown in Figure 9. The stress intensity factor calculated by the analytical solution is , and by the numerical method (Equation (17)) it is . This indicates that the numerical method in this model has a high accuracy compared with the analytical solution.
6. Numerical Results and Analysis
In order to reflect the layered characteristic of rock’s fracture toughness in reservoirs, we assume that the heterogeneous rock’s fracture toughness has a distribution as that shown in Figure 10: the two symmetric yellow zones represent the pay zone, and the white zones are the adjacent layers. A hypothetical case is considered without any coincidence with real field story. The fracture toughness of the pay zone is different from that of the adjacent layers (it may be larger or less), and the fracture toughness of adjacent layers (, ) may be the same or different. In order to more clearly observe the non-uniform fracture propagation, the time step given is very small: , and the whole simulation is carried out in 3000 steps, namely, the total simulation time .
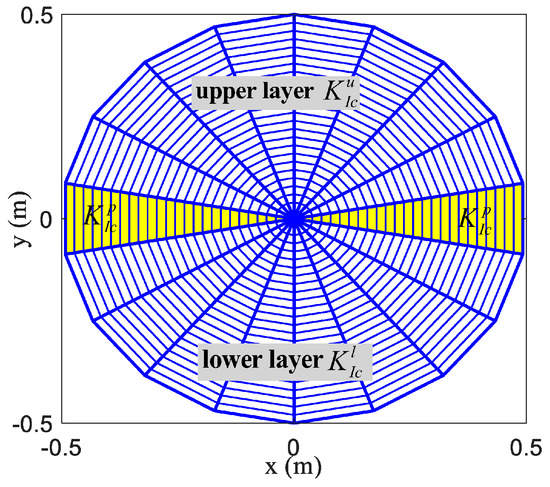
Figure 10.
The non-uniform and layered distribution of rock’s fracture toughness in a reservoir.
6.1. Numerical Results under the Weak Pay Zone and Symmetric Adjacent Layers
Firstly, we consider a typical symmetric distribution of rock’s fracture toughness: the pay zone with a lesser fracture toughness () is weak compared with adjacent layers with a larger fracture toughness (). Figure 11 and Figure 12 show the initial evolution of fracture opening and fluid pressure from to . It was found that the fracture opening and fluid pressure from to abruptly change; the fracture near the wellbore suddenly opens a lot (see the black arrow in Figure 11), and the fluid pressure in the middle of the fracture is less than the initial fluid pressure. These abnormal mutations of fracture opening and fluid pressure at the beginning of the simulation are caused by the sudden introduction of the inner boundary condition (Equation (4)), because the pressure gradient at the wellbore is zero at , whereas, after entering into the simulation the pressure gradient at the wellbore becomes large in order to satisfy the inner boundary condition at (see the second curve in Figure 12). The large fluid pressure near the wellbore causes the fracture to open quickly (see the curve of in Figure 11). The reason that the fluid pressure in the middle of the fracture is less than the initial fluid pressure is that the velocity of the deformation wave is much greater than the flow velocity of the hydraulic fluid in the fracture (the deformation of fracture surfaces can be regarded as an instantaneous process compared with the hydraulic fluid flow).
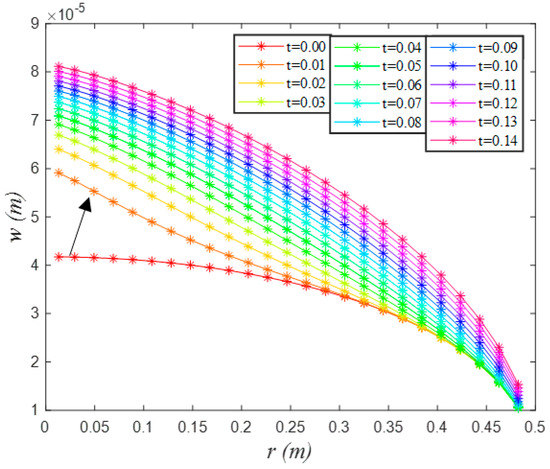
Figure 11.
Distributions of fracture opening from to at the stage before fracture propagation.
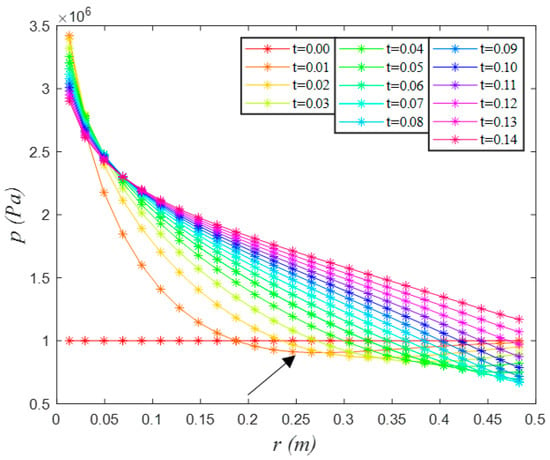
Figure 12.
Distributions of fluid pressure from to at the stage before fracture propagation.
After the beginning, the hydraulic fluid goes into the fracture quickly, and the results of fracture opening and fluid pressure gradually approach stability (see the curves of to ). When the injected hydraulic fluid completely fills the fracture, the evolution enters into the stable state: from the fluid pressure is significantly larger than the initial fluid pressure. This means that the abnormal mutation of fracture opening and fluid pressure caused by the introduction of the inner boundary condition will disappear quickly over time.
The abnormal mutation is also observed in the result of the stress intensity factor at the fracture front (see Figure 13): in the interval of to , keeps decreasing, because the fluid near the end of fracture flows back to the middle of the fracture, and causes less stress around the fracture tip. After the injected hydraulic fluid completely fills the fracture, begins to grow because of the increase of fluid pressure near the fracture tip. Actually, in practical applications of hydraulic fracturing, there is a transition stage before the inner boundary condition (Equation (4)) is reached. In this model, this transition stage is neglected, because the above analysis of results of , and indicates that the mutation between the initial condition and the inner boundary condition does not affect the final results of simulation, and the effect of that only occurs in a small initial period, after which the model can “self-renovate”. When , the stress intensity factor of the pay zone exceeds its limit of ; this means that the pay zone begins to propagate, and the simulation enters into the stage of fracture propagation.

Figure 13.
The evolution of stress intensity factor at the fracture front from to .
Figure 14 shows the change of fluid pressure in the fracture before and after the initial propagation of the pay zone: at the stage before propagation there is only a radial flow in the fracture, so in each radial region the distribution of fluid pressure is the same (see Figure 14a and Figure 15a); when , obvious weak pressure areas occur at the end of the two pay zones (), because only radial regions propagate, and the remaining regions remain still. Furthermore, the obvious circular pressure gradient occurs near the end of the radial regions as a result of their propagation, shown in Figure 14b. Because of the symmetry about axes and , we only exhibit the results of fluid pressure in the first quadrant area: Figure 15b clearly shows that the fluid pressure at the end of radial region is much less than that of its adjacent regions; the circular pressure gradients occur, which causes the fluid near the end of pay zone to flow towards the pay zone, and the pressure at the end of radial regions increases quickly. The pressure difference near the fracture tip between the radial region and its adjacent regions gradually decreases, as shown in Figure 15b–d. It is noted that the distribution of fluid pressure of the propagated region in Figure 15b coincides with the result of the uniform propagation of the penny-shaped fracture in [45].
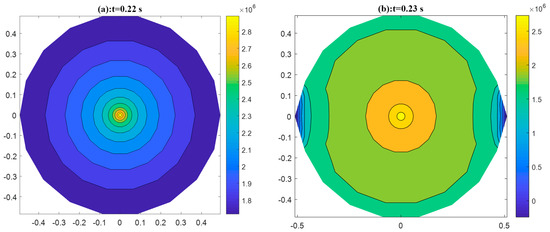
Figure 14.
The distribution of fluid pressure in the fracture, (a): —before the initial propagation of pay zone; (b): —the initial propagation of the pay zone.
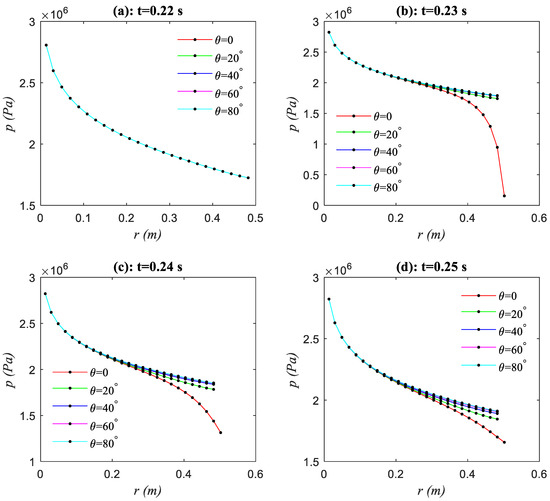
Figure 15.
The evolution of fluid pressure in the first quadrant area of fracture from the stage before propagation to the stage of propagation, (a): —before the initial propagation of the pay zone; (b): —the initial propagation of pay zone; (c): —the next time step after the initial propagation of pay zone; (d): —the second time step after the initial propagation of the pay zone.
The fracture openings of the radial region and its adjacent regions , , , from to are shown in Figure 16: the fracture opening of each radial region is the same before the initial propagation (see Figure 16a); after the initial propagation of radial regions , the fracture opening near the tip of the radial region increases faster than that of its adjacent regions , , , and (see Figure 16b–d). The above analysis indicates that the effect of the propagation of radial regions on both the fluid pressure and the fracture opening is local, and is only limited in small zones near the propagated fracture tips.
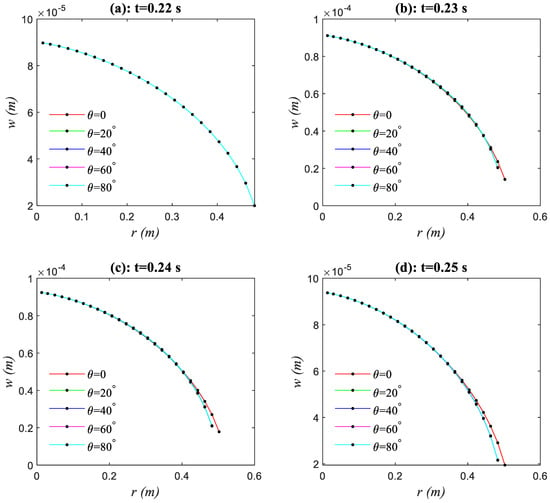
Figure 16.
The evolution of fracture opening in the first quadrant area of fracture from the stage before propagation to the stage of propagation, (a): —before the initial propagation of pay zone; (b): —the initial propagation of pay zone; (c): —the next time step after the initial propagation of pay zone; (d): —the second time step after the initial propagation of the pay zone.
The 3D ellipsoidal outline of the fracture and the evolution of the fracture front are shown in Figure 17. It was found that the fracture front has the similarity at different moments, and is like an ellipse because of the existence of a weak pay zone in the reservoir (the major axis is along the pay zone and the minor axis is perpendicular to the pay zone). Moreover, the fracture’s 3D outline is similar to an ellipsoid. The results indicate that if the pay zone has a smaller fracture toughness than that of its adjacent layers, the fracture mainly propagates along the pay zone, which is more conducive to achieving desired results with the application of hydraulic fracturing.
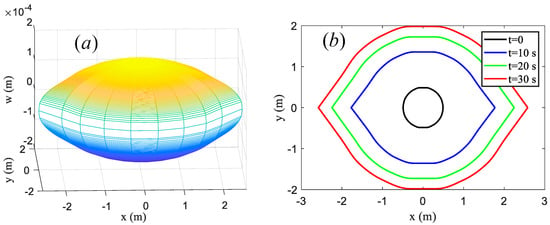
Figure 17.
The evolution of fracture propagation in the reservoir with a weak pay zone, (a): the 3D outline of the fracture containing the upper and lower surfaces at the moment ; (b): the fracture front at moments of , , , and .
6.2. Results of Numerical Comparison Experiments
The numerical comparison experiments were conducted within five different distributions of heterogeneous fracture toughness, which are shown in Table 2: “Case a” represents the uniform distribution of rock’s fracture toughness in the reservoir, “Case b” and “Case c” correspond to the weak and strengthening pay zone, respectively, and “Case d” and “Case e” correspond to the pay zone with a median fracture toughness. The toughness in the pay zone was considered constant, while the toughness of the upper and lower zones were varied and compared with the case of uniform toughness.

Table 2.
Five different distributions of heterogeneous fracture toughness in the numerical comparison experiments.
Figure 18 shows the comparison results of fracture front at the moments and . The dotted circle is the initial fracture front at , while the blue circle represents the result of uniform fracture toughness, namely, “Case a”. The results of “Case b” and “Case c” indicate that the existence of a weak pay zone is conducive to the propagation of fracture towards the pay zone. On the contrary, if the pay zone is a strengthening layer, the fracture tends to propagate perpendicular to the pay zone. The comparison results of “Case a”, “Case b” and “Case c” show that the contrast of rock’s fracture toughness between the pay zone and adjacent zones greatly affects the fracture shape (see the green, blue and red curves in Figure 18), and even determines the direction of fracture propagation: under the condition of , if corresponding to “Case b”, the fracture tends to propagate along the pay zone; on the contrary, if corresponding to “Case c”, the fracture tends to propagate along the lower and upper adjacent layers.
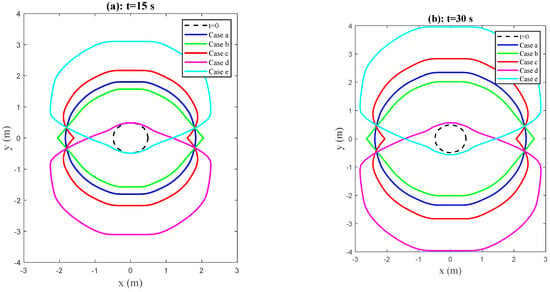
Figure 18.
Comparison results of the fracture front under five different distributions of rock’s fracture toughness in cases (a–e).
For cases of the different fracture toughness in the upper and lower adjacent layers (“Case d” and “Case e”), the fracture almost always propagates along the adjacent layer with the less fracture toughness, and propagates a little along the pay zone with the median fracture toughness, whereas it almost does not propagate along the adjacent layer with the larger fracture toughness. The distributions of rock’s fracture toughness as in “Case d” and “Case e” in Table 2 are not conducive to the application of hydraulic fracturing.
Figure 19 and Figure 20 provide the results of the fracture openings and of the horizontal and vertical sections from the numerical comparison experiments. In cases of symmetric distribution of fracture toughness (“Case a”, “Case b” and “Case c”), the maximum fracture opening, not only for the horizontal section (), but also for the vertical section (), is obtained in “Case b”, because in this case the fracture has a minimum radius on the as is compared with the radii in other cases (see the green curves in Figure 18). In cases of asymmetric distribution of fracture toughness (“Case d” and “Case e”), the location of the maximum fracture opening goes away from the wellbore, and is located in the adjacent zone with the minimum fracture toughness. It means that the contrast of rock’s fracture toughness between adjacent layers affects the location of the maximum fracture opening. Another interesting thing is that the greater the fracture radius that is obtained, the smaller the maximum fracture opening will be for all cases in Table 2.
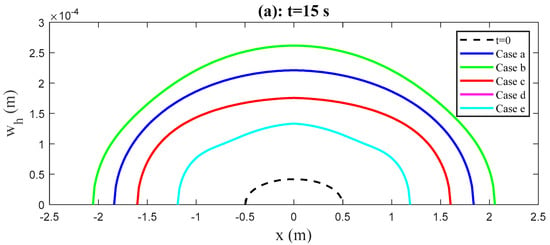
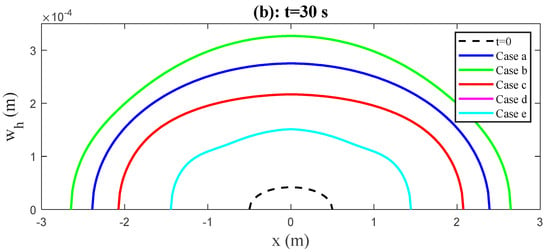
Figure 19.
Comparison results of the fracture opening on the horizontal section under five different distributions of fracture toughness cases (a–e). The curves of “Case d” and “Case e” coincide because of the same distribution of fracture opening.
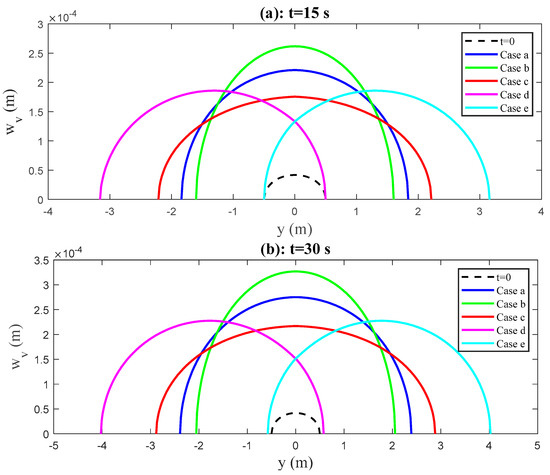
Figure 20.
Comparison results of the fracture opening on the vertical section under five different distributions of fracture toughness cases (a–e). The fracture opening is wider in the zones of smaller toughness.
7. Conclusions
In this paper, we have proposed a planar-3D model for studying the hydraulic fracture propagation in a reservoir with the heterogeneous rock’s fracture toughness in the early-time stage. A typical heterogeneous distribution of rock’s fracture toughness has been taken as an example to give the model solutions including the stage before propagation and the propagation stage.
The field tests with detailed measurements allowing for the validation of the model are not available at present. Thus, the verification of the developed model by comparing numerical results with exact analytical solutions was performed, and demonstrated a high precision of the developed model.
The results show that the proposed model can simulate the non-uniform propagation of fractures very well. The propagation features indicate that the heterogeneous fracture toughness of rock in the reservoir greatly affects the fracture evolution. The results of the numerical comparison experiments show that the pay zone with a less fracture toughness is more conducive to fracture propagation along the pay zone. On the contrary, the greater fracture toughness of the pay zone makes the fracture propagate along the adjacent layers. Besides, the size of the minimum fracture radius can be used as an index to judge the size of the maximum fracture opening. The contrast of fracture toughness between adjacent layers has an important influence on the location of the maximum fracture opening.
The main achievement of this paper is to put forward the planar-3D model, and several qualitative studies have been performed. Further improvement of the model by incorporating more factors and detailed studies will be carried out in the future.
Author Contributions
Data curation, M.W. and A.A.S.; Formal analysis, N.N.S., C.Q., D.A.P. and A.A.S.; Investigation, K.L., N.N.S., C.Q., M.W. and D.A.P.; Methodology, K.L., N.N.S., C.Q., D.A.P. and A.A.S.; Resources, C.Q.; Software, K.L. and D.A.P.; Validation, M.W. and A.A.S.; Writing—original draft, K.L.; Writing—review & editing, N.N.S. All authors have read and agreed to the published version of the manuscript.
Funding
This work was carried out with the support of the basic scientific research business fee project of Beijing municipal colleges and universities, the QN youth scientific research innovation project, the Young Teachers’ scientific research ability improvement plan № X22012, and the National Natural Science Foundation of China (Grants No. 12172036 and 51774018). The Russian research team was supported by the subsidy given to the Federal Science Center NIISI RAN (No. FNEF-2022-0021).
Data Availability Statement
The data of this study are available from the corresponding author upon reasonable request.
Conflicts of Interest
The authors declare that they have no known competing financial interest or personal relationship that could have appeared to influence the work reported in this paper.
Appendix A. Influence Function of 3D-DDM
For the planar fracture, the -axis coordinates of all points on the fracture surfaces equal 0. are the vertices of fracture grid cells, ( is the vertex number of grid cells, for triangular cells, for trapezoidal cells). is an arbitrary point of the fracture surface. The influence function at the point has the following expression [47]:
where coefficients , , , and are written as
if , then . The second derivative of with respect to is
where terms and are formulated as
where , . For the planar fracture , there is only the second term in Equations (A8) and (A9).
Appendix B. Specific Discrete Forms of Governing Equations in the Stage before Fracture Propagation
In the stage before propagation there is no circular fluid flow, so the governing Equation (14) is simplified as
According to the finite volume method (FVM), terms with subscripts and in Equation (A10) have the following forms:
As shown in Figure 4, for the first calculated point with the number “” (the first blue point): , , and , so Equation (A10) is rewritten as
where the last term is obtained by the boundary condition at the wellbore, namely, Equation (15).
For the second calculated point with the number “” (the second blue point in Figure 4): , , and , so the specific form of Equation (A10) is
For calculated points with the number “” () in Figure 4: , , and , Equation (A10) is transformed as
For the last calculated point with the number “” in Figure 4, we use the point instead of the boundary point for calculation, so , , , and , Equation (A10) is discretized as
Appendix C. Specific Discrete Forms of Governing Equations in the Stage of Fracture Propagation
According to the finite volume method (FVM), terms with subscripts and in Equation (14) have the following forms:
For the inner boundary cells with the 2-dimensional number () (triangular cells): , , . Equation (14) is discretized as
For the first trapezoidal cells with the 2-dimensional number (): , , . Equation (14) is transformed as
For the complete interior cells () () with four adjacent cells corresponding to Figure 5a: , , . Equation (14) is transformed as
For the left interior cells, right interior cells and radial interior cells () () corresponding to Figure 5b–d, the discrete forms of Equation (14) are, respectively
For the outer boundary cells with the 2-dimensional number (), we use the point instead of the boundary point :, , , and . The discrete form of Equation (14) for complete outer boundary cells corresponding to Figure 6a is
The discrete form of Equation (14) for left outer boundary cells, right outer boundary cells, and radial outer boundary cells corresponding to Figure 6b–d are, respectively
References
- Klee, G.; Rummel, F.; Williams, A. Hydraulic fracturing stress measurements in Hong Kong. Int. J. Rock Mech. Min. Sci. 1999, 36, 731–741. [Google Scholar] [CrossRef]
- Serdyukov, S.V.; Kurlenya, M.V.; Patutin, A.V. Hydraulic fracturing for in situ stress measurement. J. Min. Sci. 2016, 52, 1031–1038. [Google Scholar] [CrossRef]
- Cheng, Y.; Zhang, Y. Hydraulic fracturing experiment investigation for the application of geothermal energy extraction. ACS Omega 2020, 5, 8667–8686. [Google Scholar] [CrossRef]
- Ren, X.; Zhou, L.; Zhou, J.; Lu, Z.; Su, X. Numerical analysis of heat extraction efficiency in a multilateral-well enhanced geothermal system considering hydraulic fracture propagation and configuration. Geothermics 2020, 87, 101834. [Google Scholar] [CrossRef]
- He, Q.; Suorineni, F.T.; Oh, J. Strategies for creating prescribed hydraulic fractures in cave mining. Rock Mech. Rock Eng. 2017, 50, 967–993. [Google Scholar] [CrossRef]
- Birch, D.J.; Meyer, S.G. Seismic Response to hydraulic fracturing in caving mines. In Proceedings of the Ninth International Conference on Deep and High Stress Mining, Johannesburg, South Africa, 24–25 June 2019; pp. 445–460. [Google Scholar]
- He, Q.; Suorineni, F.T.; Ma, T.; Oh, J. Parametric study and dimensional analysis on prescribed hydraulic fractures in cave mining. Tunn. Undergr. Space Technol. 2018, 78, 47–63. [Google Scholar] [CrossRef]
- Economides, M.J.; Nolte, K.G. Reservoir Stimulation, 3rd ed.; John Wiley & Sons: Hoboken, NJ, USA, 2000. [Google Scholar]
- Batchelor, G.K. An Introduction to Fluid Dynamics; Cambridge University Press: Cambridge, UK, 1967. [Google Scholar]
- Sneddon, N.I. The distribution of stress in the neighbourhood of a crack in an elastic solid. Proc. R. Soc. Lond. Ser. A Math. Phys. Sci. 1946, 187, 229–260. [Google Scholar]
- Sneddon, N.I.; Lowengrub, M. Crack Problems in the Classical Theory of Elasticity; John Wiley & Sons: Hoboken, NJ, USA, 1969. [Google Scholar]
- Zeng, Q.; Yao, J.; Shao, J. Numerical study of hydraulic fracture propagation accounting for rock anisotropy. J. Pet. Sci. Eng. 2018, 160, 422–432. [Google Scholar] [CrossRef]
- Wang, X.; Shi, F.; Liu, H.; Wu, H. Numerical simulation of hydraulic fracturing in orthotropic formation based on the extended finite element method. J. Nat. Gas Sci. Eng. 2016, 33, 56–69. [Google Scholar] [CrossRef]
- Chen, B.; Cen, S.; Barron, A.R.; Owen, D.R.J.; Li, C. Numerical investigation of the fluid lag during hydraulic fracturing. Eng. Comput. 2018, 35, 2050–2077. [Google Scholar] [CrossRef]
- Baykin, A.N.; Golovin, S.V. Modelling of hydraulic fracture propagation in inhomogeneous poroelastic medium. J. Phys. Conf. Ser. 2016, 722, 012003. [Google Scholar] [CrossRef]
- Peirce, A.; Detournay, E. An implicit level set method for modelling hydraulically driven fractures. Comput. Methods Appl. Mech. Eng. 2008, 197, 2858–2885. [Google Scholar] [CrossRef]
- Dontsov, E.V.; Peirce, A.P. A multiscale implicit level set algorithm (ILSA) to model hydraulic fracture propagation incorporating combined viscous, toughness, and leak-off asymptotics. Comput. Methods Appl. Mech. Eng. 2017, 313, 53–84. [Google Scholar] [CrossRef]
- Li, K.; Jiang, X.; Ding, H.; Hu, X. Three-dimensional propagation simulation and parameter analysis of rock joint with displacement discontinuity method. Math. Probl. Eng. 2019, 2019, 3164817. [Google Scholar] [CrossRef]
- Yamamoto, K.; Shimamoto, T.; Sukemura, S. Multiple fracture propagation model for a three-dimensional hydraulic fracturing simulator. Int. J. Geomech. 2004, 4, 46–57. [Google Scholar] [CrossRef]
- Salimzadeh, S.; Usui, T.; Paluszny, A.; Zimmerman, R.W. Finite element simulations of interactions between multiple hydraulic fractures in a poroelastic rock. Int. J. Rock Mech. Min. Sci. 2017, 99, 9–20. [Google Scholar] [CrossRef]
- Li, Q.; Xing, H.; Liu, J.; Liu, X. A review on hydraulic fracturing of unconventional reservoir. Petroleum 2015, 1, 8–15. [Google Scholar] [CrossRef]
- Slatt, R.M. Important geological properties of unconventional resource shales. Cent. Eur. J. Geosci. 2011, 3, 435–448. [Google Scholar] [CrossRef]
- Warpinski, N.R.; Clark, J.A.; Schmidt, R.A.; Huddle, C.W. Laboratory investigation on the effect on in-situ stresses on hydraulic fracture containment. Soc. Pet. Eng. J. 1982, 22, 333–340. [Google Scholar] [CrossRef]
- Fung, R.L.; Vijayakumar, S.; Cormack, D.E. Calculation of vertical fracture containment in layered formations. SPE Form. Eval. 1987, 2, 518–522. [Google Scholar] [CrossRef]
- Smith, M.B.; Bale, A.B.; Britt, L.K.; Klein, H.H.; Siebrits, E.; Dang, X. Layered modulus effects on fracture propagation, proppant placement, and fracture modelling. In Proceedings of the SPE Annual Technical Conference and Exihibition, New Orleans, LA, USA, 30 September–3 October 2001; Society of Petroleum Engineers: Dallas, TX, USA, 2001. SPE 71654. [Google Scholar]
- Van Eekelen, H.A.M. Hydraulic fracture geometry: Fracture containment in layered formations. Soc. Pet. Eng. J. 1982, 22, 341–349. [Google Scholar] [CrossRef]
- Golovin, S.V.; Baykin, A.N. Influence of pore pressure on the development of a hydraulic fracture in poroelastic medium. Int. J. Rock Mech. Min. Sci. 2018, 108, 198–208. [Google Scholar] [CrossRef]
- Gao, Q.; Han, S.; Cheng, Y.; Yan, C.; Sun, Y.; Han, Z. Effects of non-uniform pore pressure field on hydraulic fracture propagation behaviors. Eng. Fract. Mech. 2019, 221, 106682. [Google Scholar] [CrossRef]
- Thiercelin, M.; Jeffrey, R.G.; Naceur, K.B. Influence of fracture toughness on the geometry of hydraulic fractures. SPE Prod. Eng. 1989, 4, 435–442. [Google Scholar] [CrossRef]
- Suo, Y.; Chen, Z.; Rahman, S.S.; Song, H. Experimental and numerical investigation of the effect of bedding layer orientation on fracture toughness of shale rocks. Rock Mech. Rock Eng. 2020, 53, 3625–3635. [Google Scholar] [CrossRef]
- Chandler, M.R.; Meredith, P.G.; Brantut, N.; Crawford, B.R. Fracture toughness anisotropy in shale. J. Geophys. Res. Solid Earth 2016, 121, 1706–1729. [Google Scholar] [CrossRef]
- Trimonova, M.A.; Zenchenko, E.V.; Turuntaev, S.B.; Golovin, Y.I.; Samodurov, A.A.; Tyurin, A.I.; Dubinya, N.V. Rock toughness importance for hydraulic fracture modelling. AIP Conf. Proc. 2018, 2050, 020308. [Google Scholar]
- Siebrits, E.; Peirce, A.P. An efficient multi-layer planar 3D fracture growth algorithm using a fixed mesh approach. Int. J. Numer. Methods Eng. 2002, 53, 691–717. [Google Scholar] [CrossRef]
- Budennyy, S. An enhanced pseudo-3D model of hydraulic fracture in multi-layered formation. In Proceedings of the SPE Annual Technical Conference and Exhibition, San Antonio, TX, USA, 9–11 October 2017. [Google Scholar]
- Zhang, X.; Wu, B.; Jeffrey, R.G.; Connel, L.D.; Zhang, G. A pseudo-3D model for hydraulic fracture growth in a layered rock. Int. J. Solids Struct. 2017, 115–116, 208–223. [Google Scholar] [CrossRef]
- Zhang, X.; Wu, B.; Connel, L.D.; Han, Y.; Jeffrey, R.G. A model for hydraulic fracture growth across multiple elastic layers. J. Pet. Sci. Eng. 2018, 167, 918–928. [Google Scholar] [CrossRef]
- Zia, H.; Lecampion, B.; Zhang, W. Impact of the anisotropy of fracture toughness on the propagation of planar 3D hydraulic fracture. Int. J. Fract. 2018, 211, 103–123. [Google Scholar] [CrossRef]
- Moukhtari, F.E.; Lecampion, B.; Zia, H. Propagation of a planar hydraulic fracture perpendicular to the isotropy plane of a transversely isotropic material. In Proceedings of the 53rd U.S. Rock Mechanics/Geomechanics Symposium, New York, NY, USA, 23–26 June 2019. [Google Scholar]
- Detournay, E.; Peirce, A. On the moving boundary conditions for a hydraulic fracture. Int. J. Eng. Sci. 2014, 84, 147–155. [Google Scholar] [CrossRef]
- Hills, D.A.; Kelly, P.A.; Dai, D.N.; Korsunsky, A.M. Solution of crack problems. In The Distributed Dislocation Technique, Solid Mechanics and Its Application; Kluwer Academic Publisher: Dordrecht, The Netherlands, 1996; Volume 44. [Google Scholar]
- Crouch, S.L.; Starfield, A.M. Boundary Element Method in Solid Mechanics; George Allen and Unwin: London, UK, 1983. [Google Scholar]
- Xiao, H.T.; Yue, Z.Q. A three-dimensional displacement discontinuity method for crack problems in layered rocks. Int. J. Rock Mech. Min. Sci. 2011, 48, 412–420. [Google Scholar] [CrossRef]
- Sesetty, V.; Ghassemi, A. A numerical study of sequential and simultaneous hydraulic fracturing in single and multi-lateral horizontal wells. J. Pet. Sci. Eng. 2015, 132, 65–76. [Google Scholar] [CrossRef]
- Zia, H.; Lecampion, B. PyFrac: A planar 3D hydraulic fracture simulator. Comput. Phys. Commun. 2020, 255, 107368. [Google Scholar] [CrossRef]
- Savitski, A.A.; Detournay, E. Propagation of a penny-shaped fluid-driven fracture in an impermeable rock: Asymptotic solutions. Int. J. Solid Struct. 2002, 39, 6311–6337. [Google Scholar] [CrossRef]
- Dontsov, E.V. An approximate solution for a penny-shaped hydraulic fracture that accounts for fracture toughness, fluid viscosity and leak-off. R. Soc. Open Sci. 2016, 3, 160737. [Google Scholar] [CrossRef]
- Kuriyama, K.; Mizuta, Y. Three-dimensional elastic analysis by the displacement discontinuity method with boundary division into triangular. Int. J. Rock Mech. Min. Sci. Geomech. Abstr. 1993, 30, 111–123. [Google Scholar] [CrossRef]
- Tada, H.; Paris, P.C.; Irwin, G.R. The Stress Analysis of Cracks Handbook, 3rd ed.; ASME Press: New York, NY, USA, 2000. [Google Scholar]
- Zvyagin, A.V.; Luzhin, A.A.; Smirnov, N.N.; Shamina, A.A.; Shamin, A.Y. Stress intensity factors for branching cracks in space structures. Acta Astronaut. 2021, 180, 66–72. [Google Scholar] [CrossRef]
- Shamina, A.A.; Smirnov, N.N.; Zvyagin, A.V.; Luzhin, A.A.; Panfilov, D.I.; Udalov, A.S. Computational modeling of cracks different forms in three-dimensional space. Acta Astronaut. 2021, 186, 289–302. [Google Scholar] [CrossRef]
- Shamina, A.A.; Akulich, A.V.; Tyurenkova, V.V.; Smirnov, N.N.; Zvyaguin, A.V. The study of the strength of structures weakened by a system of cracks. Acta Astronaut. 2020, 168, 620–627. [Google Scholar] [CrossRef]
- Smirnov, N.N.; Li, K.; Skryleva, E.; Pestov, D.; Shamina, A.A.; Qi, C.; Kiselev, A.B. Mathematical modeling of hydraulic fracture formation and cleaning processes. Energies 2022, 15, 1967. [Google Scholar] [CrossRef]
- Kiselev, A.B.; Kairui Li Smirnov, N.N.; Pestov, D.A. Simulation of fluid flow thorough a hydraulic fracture of heterogeneous fracture-tough reservoir in the planar 3D formulation. In Fluid Dynamics; Maik Nauka/Interperiodica Publishing (Russian Federation): Moscow, Russia, 2021; Volume 56, pp. 164–177. [Google Scholar]
- Li, K.; Smirnov, N.N.; Kiselev, A.B.; Pestov, D.A.; Qi, C. The numerical asymptotic solution to initial condition problem of preexisting plane-strain hydraulic fracture with fluid lag. Eng. Fract. Mech. 2020, 239, 107296. [Google Scholar] [CrossRef]
- Li, K.; Smirnov, N.N.; Pestov, D.A.; Qi, C.; Kiselev, A.B. An approximate analytical solution for hydraulic fracture opening under non-uniform internal pressure. Mater. Phys. Mech. 2020, 44, 288–305. [Google Scholar]
- Li, K.; Smirnov, N.N.; Kiselev, A.B.; Wang, M.; Qi, C. An implicit algorithm with fast convergence for evolution of a preexisting-closed plane-strain hydraulic fracture. WSEAS Trans. Math. 2019, 18, 359–372. [Google Scholar]
Disclaimer/Publisher’s Note: The statements, opinions and data contained in all publications are solely those of the individual author(s) and contributor(s) and not of MDPI and/or the editor(s). MDPI and/or the editor(s) disclaim responsibility for any injury to people or property resulting from any ideas, methods, instructions or products referred to in the content. |
© 2023 by the authors. Licensee MDPI, Basel, Switzerland. This article is an open access article distributed under the terms and conditions of the Creative Commons Attribution (CC BY) license (https://creativecommons.org/licenses/by/4.0/).