Article

Optimization of LFP Pouch Cell Tab Design for Uniform Temperature Distribution

1
Graduate School of Mechanical Design & Production Engineering, Konkuk University, Seoul 05029, Republic of Korea
2
School of Mechanical Engineering, Konkuk University, Seoul 05029, Republic of Korea
*
Author to whom correspondence should be addressed.
Mathematics 2023, 11(8), 1970; https://doi.org/10.3390/math11081970
Submission received: 14 February 2023 / Revised: 10 April 2023 / Accepted: 20 April 2023 / Published: 21 April 2023

Abstract

:
An increase in the size of large-format Li-ion batteries (LIBs) may lead to nonuniform temperature distribution, which degrades the performance and lifespan of the LIBs. To address this issue, we performed design optimization using a 3D electrochemical-thermal coupled model for 55 Ah LFP/graphite large-format pouch cells. To minimize temperature differences in Normal Tab (NT), Lateral Tab (LT), and Counter Tab (CT) types of LIBs, design optimization was performed on the width, height, and attachment position of each positive and negative Table The upper and lower limits of each design variable were set as constraints without exceeding the sum of the total area of the tabs of the initial NT type. Owing to the optimization of the NT, LT, and CT types, the temperature difference in the optimized CT type was 79.2% less than in the initial NT type. Additionally, the potential difference decreased by 37.1%, minimizing ohmic heat. Aging analysis of 2500 cycles was performed to analyze the improvement in the lifespan due to the uniform temperature distribution. Consequently, the capacity retention rate of the optimized CT type was 6.5% higher than that of the initial NT type. Thus, the temperature distribution and lifespan of LIBs were improved by design optimization.

1. Introduction

Recently, eco-friendly energy has been required in various industrial fields such as production and transportation because of international environmental regulations. This trend has had a great impact on the field of mobility and has served as an opportunity to spur the development of EVs (Electric Vehicles). The reason is that EVs produce little pollution and offer high energy efficiency compared to conventional internal combustion engine vehicles that emit a large amount of exhaust gas. As power sources, EVs use lithium-ion batteries (LIBs) and hydrogen fuel cells, which generate electrical energy through chemical reactions by the transport of lithium ions and hydrogen-oxygen reactions, respectively [1]. LIBs have the advantages of high energy density, high voltage, and long lifespan, so the demand for them is increasing [2,3,4,5,6]. In addition, with the increase in demand for EVs, the size of LIBs has increased to improve the driving range of EVs. However, nonuniform temperature distribution of LIBs due to the increased dimensions can reduce battery performance and lifespan and, in the worst case, cause thermal runaway [7,8].
Several studies have been conducted on cell performance reduction and degradation due to nonuniform temperature distribution caused by battery cell design and large dimensions [9,10,11,12,13]. Kim et al. [9] analyzed the heat generation rate, current density, and temperature of Nominal Design (ND), Counter Tab Design (CT), Small Tab Design (ST), and Wide Stack-Area Design (WS) formats, varying the tab size, tab position, and cell stack aspect ratio of a 20-Ah stacked prismatic cell in a multi-scale multi-domain (MSMD) model of a LIB. This study confirmed that the length scale affects the electrical, thermal, and electrochemical behavior of the LIB system. Grandjean et al. [10] studied thermal behavior with various ambient temperatures and discharge rates under the charging and discharging conditions of a 20 Ah large-format LFP pouch cell and showed that it is essential to maintain the uniform temperature of a large-format pouch battery to prevent local aging. Kim et al. [11] compared temperature, current density, electrical potential, SOC, and degradation of different LIB sizes using a numerical approach for a 1 Ah LFP pouch cell and a 55 Ah LFP pouch cell. Under the 3C-rate discharge condition, the temperature of the large cell increased by about 8 °C more than that of the small cell, and degradation occurred 33% faster, at 2500 cycles. Song et al. [12] studied the nonuniformity of the temperature distribution and current density distribution that causes battery performance to deteriorate. It was shown that the nonuniform temperature distribution caused more capacity loss than uniform temperature distribution. In addition, it was confirmed that thermally improved performance was attained when tabs were located at the top and bottom centers. Zhu et al. [13] revealed that nonuniform and locally generated high temperature is one of the main causes of internal short circuits of a battery, and that it increases the deposition rate of Li-ion by increasing the surface exchange current density of the battery. As the deposition rate of Li-ion increases, short circuiting of the cell is accelerated, resulting in more extreme temperature nonuniformity and local high temperatures. Therefore, it is suggested that the tab design be improved to reduce the localization of Joule heating.
Shape design variables such as tab type, tab width, tab height, tab attachment position, and cell aspect ratio of large LIBs affect not only the temperature distribution of LIB cells, but also lifespan and safety. Therefore, it is necessary to understand the effect of LIB cell shape design variables on temperature distribution. Many studies have been conducted to determine the relationship between the shape design variables of LIB cells and temperature distribution [14,15,16,17,18,19,20,21,22,23]. Kim et al. [14] compared heat generation and temperature distribution in regard to cell aspect ratio and tab position of lithium-polymer batteries under 1C-, 3C-, and 5C-rate discharge conditions through 2D numerical analysis and experiments. It has been shown that the same numerical analysis methodology can be applied to electrodes with different aspect ratios and tab positions if the manufacturing process, material, and composition of the electrodes are the same.
Samba et al. [15] revealed that when a large-format LFP battery pouch cell was discharged at a 4C-rate, the temperature distribution, current density, and potential distribution of the cell were changed by the internal current pathway and resistance due to tab type and cell aspect ratio. In addition, it was confirmed that the more symmetrically configured the cell design was or the wider the tab width, the more uniformly potential distribution, current density gradient, and temperature distribution were formed. Du et al. [16] analyzed temperature distribution in relation to the tab type, tab width, and discharge rate of a 10 Ah LFP battery. In this study, a double-side tab showed a more uniform temperature distribution than a single-side tab: the wider the tab, the lower the maximum temperature of the cell at a high discharge rate and the more even the temperature distribution. Kosch et al. [17] analyzed temperature distribution in relation to the thickness of the current collector, tab width, and tab type when discharging a 40 Ah pouch cell at 4C-rate. The study found that the thickness of the current collector had less effect on the temperature distribution than the tab size. It was shown that cells with opposite-side alignment showed more uniform depth of discharge (DOD) distribution and temperature distribution than those with same-side alignment. Zhang et al. [18] calculated maximum temperature, heat generation rate, and temperature distribution using six-tab arrangements of pouch-type LIB cells. It was shown that symmetrical tab arrangement improves the uniformity of cell temperature distribution, and that symmetrically placing the tabs on the long side or opposite side of the battery cell effectively lowers maximum temperature and yields more uniform temperature distribution. Mei et al. [19] performed thermal analysis on the tab width, thickness, and height of an 18.5 Ah/NCM/graphite pouch cell under the 4C-rate discharge condition. They showed that as the discharge rate increases, the maximum temperature could be observed near the positive tab, where heat accumulates. Also, the wider and thicker the tab, the lower the average temperature and the more uniform the temperature distribution. Zhao et al. [20] studied temperature distribution due to cell surface cooling and tab cooling in relation to tab type, tab thickness, tab width, and current collector thickness of pouch cells. They found that cooling the tab instead of cooling the battery cell surface improves the uniformity of temperature inside the cell, but that heat dissipation is limited due to a heat transfer bottleneck between the tab and the electrode stack. Also, by calculating the temperature for the tab width, tab thickness, tab position, and current collector thickness, it was found that tab cooling can remove heat as effectively as cell surface cooling.
Lee et al. [21] analyzed the temperature distribution of a 55 Ah large pouch cell with different aspect ratios, tab attachment positions, and C-rates. Analysis of eight cell aspect ratios, three tab attachment positions, and three C-rates showed that temperature deviation increased as the cell aspect ratio moved away from 2.15. In addition, it was confirmed that the closer the negative tab and the positive tab, the greater the temperature deviation, the cell aspect ratio having a more significant effect on the temperature deviation than the tab position. The results showed that temperature deviation was lowest when the cell aspect ratio was 2.15 and the tabs were located on opposite sides. Lee et al. [22] analyzed the effect of the cell aspect ratio and positive and negative tab attachment positions on the temperature distribution of an NT type 45 Ah LFP/graphite LIB unit cell and analyzed the significance and importance of the design factors using Analysis of Variance (ANOVA). The ANOVA showed that the cell aspect ratio and the location of the positive and negative tab attachments significantly affected the temperature distribution, especially the cell aspect ratio. In addition, it was confirmed that the attachment position of the positive tab affected the maximum temperature, the minimum temperature, and the temperature difference, but the attachment position of the negative tab only affected the minimum temperature. These studies showed that shape design variables of LIB cells affect cell performance, current density, potential, and temperature distribution, and it is possible to improve performance and lifespan by deriving an optimized design for previous LIB cell shape design variables.
Shape design variables such as tab type, tab height, tab width, and cell aspect ratio of large-format LIBs affect the temperature distribution in cells. Since the nonuniform temperature distribution or large temperature difference occurring in the LIB cell affects the reduction of the performance and lifespan, shape design optimization must be carried out. However, few studies on optimizing shape design variables for uniform temperature distribution of a large-format pouch-type LIB model have been conducted. Lee et al. [23] minimized temperature difference (∆T) using the tab attachment position and cell aspect ratio as design variables for Normal Tab (NT), Lateral Tab (LT), and Counter Tab (CT) types of 45 Ah LFP/graphite large-format pouch cells. In the CT-type cell, an aspect ratio of 2 and the placement of the positive and negative tabs in the center of the cell were shown to be the optimal design, reducing temperature difference by 77.2% compared to the initial design due to the reduction of internal resistance. The decrease in temperature difference reduced the increase in average SEI film resistance, and it was confirmed that the capacity fade of the optimized design at 1000 cycles was 7.3% lower than that of the initial design. However, as only the cell aspect ratio and the tab attachment position were considered, neither the effect on the cell of tab width, a design variable dependent on the tab attachment position, or tab height, was considered. In addition, previous studies did not independently consider the widths of the positive and negative tabs. Therefore, optimizing the LIB cells’ shape by applying the optimization technique to the attachment position, width, and tab height of each positive and negative tab is necessary.
In this paper, to achieve a uniform temperature distribution in a 55 Ah LFP/graphite large-format pouch cell and improve lifespan, the difference between the maximum and minimum temperatures depending on the width, height, and attachment positions of the positive and negative tabs of NT, LT, and CT type cells was minimized. A 3D electrochemical-thermal model was used to calculate temperature based on the electrochemical reaction of the LIB cell. Optimization was used to minimize the temperature difference (∆T). The width and attachment position of each of the positive and negative tabs and the common height of the two tabs were set as design variables in the NT, LT, and CT type cells. As for the constraints of the five design variables, upper and lower boundaries were set for the shape conditions of each design variable. In addition, constraints were applied so that the sum of the positive and negative tab areas of the optimized design did not exceed the sum of the tab areas of the initial NT type. Through optimization, the temperature distribution and potential distribution of the LIB cell due to the shape design variables were analyzed. Also, to perform an aging analysis, the capacity retention rate with cycling was calculated to evaluate lifespan improvement in the optimized design compared to the initial NT type.

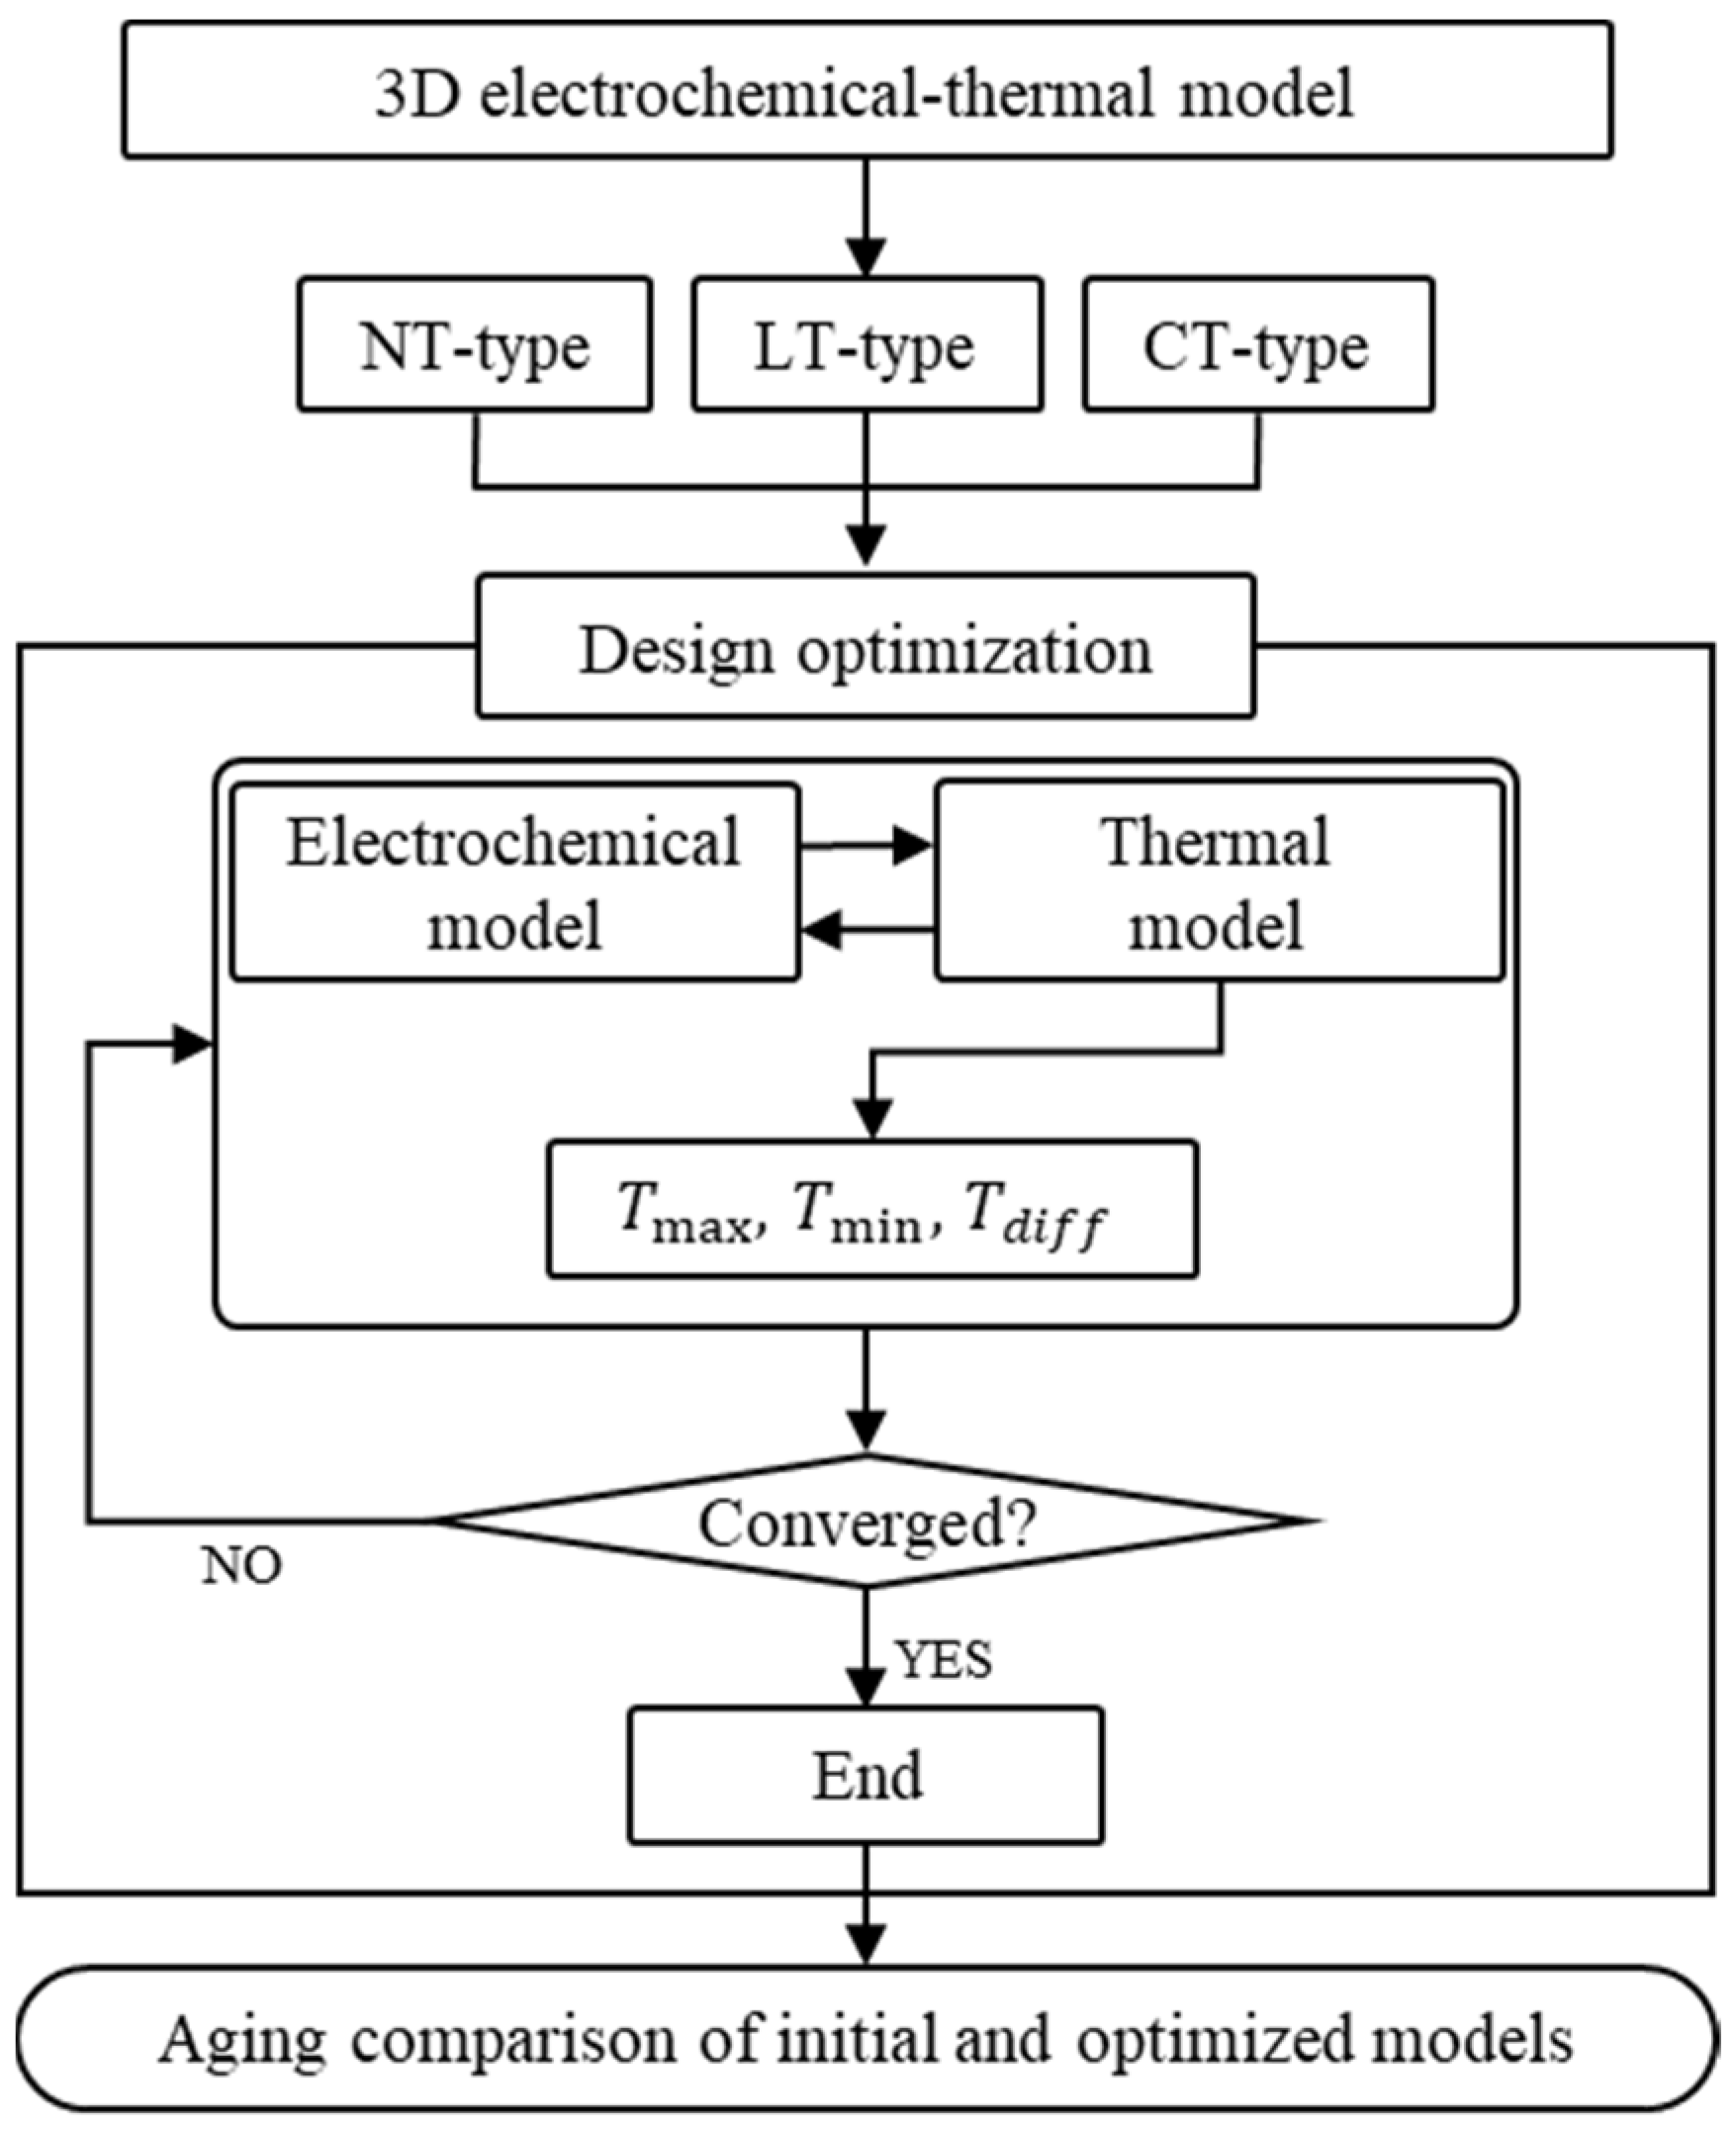
2. Three-Dimensional Electrochemical-Thermal Coupled Model for Large-Format LIB Cell

2.1. Finite Element Model of LIB Cell

The 55 Ah LFP/graphite large-format pouch cell was constructed with dimensions of 297 mm × 210 mm × 7.5 mm. As shown in Figure 1a, it is composed of five layers: an aluminum positive current collector, an LiFePO4 positive electrode, a separator, a graphite negative electrode, and a copper negative current collector. As shown in Figure 1b, the finite element model (FEM) of the unit cell consists of 14,540 elements arranged 45 layers wide, 35 layers high, and 9 layers thick.

2.2. Governing Equations of Electrochemical-Thermal Model

The 3D electrochemical-thermal coupled model developed by M. Doyle et al. [24] and L. Rao et al. [25] was used to calculate heat generation due to the electrochemical reaction of large-format LIB cells. Equations (1)–(12) present the governing equations constituting the 3D electrochemical-thermal coupled model. The electrochemical model is calculated as Equations (1)–(8), and the thermal model is calculated as Equations (9)–(13). In the electrochemical model, Equations (1) and (2) are used to calculate the law of charge conservation in the solid phase and electrolyte phase, respectively, as follows:
σ e f f 2 ϕ s x 2 = a s j     f o r   x ( 0 , L )
κ e f f 2 ϕ e x 2 + κ d e f f 2 c e x 2 = a s j     f o r   x ( 0 , L )
where the solid-phase particles are assumed to be uniformly distributed within the electrode, and the electrolyte-phase volume fraction, number of transferred lithium ions, and effective diffusion coefficient are considered to be constants.
Equations (3) and (4) are expressions of the conservation of active materials defined by Fick’s law in the solid phase and the conservation of Li ions in the electrolyte phase, respectively, as follows:
c s t = D s r 2 r r 2 c s r     f o r   r ( 0 , R s )
ε e c e t = D e e f f 2 c e x 2 + a s 1 t + F j     f o r   x ( 0 , L )
The equation for reaction kinetics, which expresses the relationship between current and voltage when the current and voltage are sufficiently small, was defined with the Butler-Volmer equation, which couples concentration and potential in the solid and electrolyte phases of Equations (1)–(4):
j = i 0 e x p α a F R T η e x p α c F R T η
For the calculation of capacity loss, the aging model developed by M. Safari et al. [26] was used as a submodel of the electrochemical model. Equations (6)–(8) indicate capacity loss due to SEI layer growth at the negative electrode surface. Equation (6) calculates the current by side reaction and Equation (7) represents the rate of increase in the thickness of the SEI layer as follows:
i s i d e = i s i d e , i n i t e x p α c F R T η s i d e
δ S E I t = i s i d e M S E I ρ S E I F
Resistance of the SEI layer ( R S E I ) is calculated using the equation below:
R S E I = δ S E I κ S E I
In the thermal model, the temperature distribution of LIB is calculated. Equation (9) is used to calculate the electrochemical reaction and Joule heat as follows:
q i + q j = A 0 L j ϕ s ϕ e U d x
The reversible heat of Equation (10) and ohmic heat due to contact resistance between the current collector and electrode of Equation (11) can be expressed as follows:
q r = T U T I
q c = I 2 R f A
Equation (12), representing the energy conservation law, is used to calculate the temperature distribution of LIB as follows:
C p T t = k 2 T + q i + q j + q c + q r
Equation (12) can be expressed in the finite element matrix form as follows [27]:
C T ˙ + K T = [ Q ]
where [C] is the heat capacity matrix, [K] is the thermal conductivity matrix, {T} denotes the nodal temperature array, and [Q] is the global temperature load array.

2.3. Validation of Three-Dimensional Electrochemical-Thermal Model

Validation of the 3D electrochemical-thermal model was performed using the specifications reported by Kim et al. [11] and Yu et al. [28]. Table 1 shows the electrochemical-thermal model parameters and specifications for the 55 Ah LFP/graphite LIB cell. As for the boundary conditions, 3D electrochemical-thermal coupled analysis of LIB was performed at a discharge rate of 3C. The top surface of the LIB cell is cooled with a convective heat transfer coefficient of h = 5 W/m2·K, and the side surfaces and bottom surface are insulated as shown in Figure 2. A 55 Ah pouch cell consists of 40 unit cells, the capacity of each unit cell being 1.375 Ah. The nominal voltage of the cell is 3.2 V and the cut-off voltage is 2.5 V. Figure 3 shows the result of validation. Figure 3a shows the comparison of the discharge curve with a reference under 3C-rate discharge conditions, and Figure 3b shows the comparison of the maximum temperature and minimum temperature with references. This shows that the 3D electrochemical-thermal model predicts the results well.

3. Optimization of Uniform Temperature Distribution by Minimizing Difference between Maximum and Minimum Temperatures of LIB Cell

3.1. Design Variables and Response

To uniformize the temperature distribution of the LIB cells uniform, optimization was performed on the positive and negative tab widths W p and W n , tab height H t , and positive and negative tab attachment positions P p and P n , for the NT, LT, and CT type LIB cells. Figure 4 depicts the definition of the design variables for the NT, LT, and CT type LIB cells. The NT type represents a form in which the positive and negative tabs are attached on the same side. The LT type represents a form in which the positive and negative tabs are attached in an L-shape. The CT type refers to a form in which the positive and negative tabs are attached on opposite sides.
Equations (14) and (15) express the attachment positions of the positive and negative tabs in the NT type. Equations (16) and (17) define the attachment positions of the positive and negative tabs of the LT and CT types. As shown in Equations (14)–(17), P p and P n are calculated using W p and W n , the cell width W c , and the cell height L c for each tab type.
P p = d p 100 W c W p W n     f o r   N T
P n = d p 100 W c P p W p W n     f o r   N T
P p = d p 100 W c W p     f o r   L T , C T
P n = d p 100 X W n ,           X = L c     f o r   L T W c     f o r   C T
Table 2 presents the upper and lower boundaries of each design variable. The values W p and W n for the positive and negative tabs range from 1 to 9 cm, and the two tabs represent independent design variables. In H t , the positive and negative tabs are designated together as a single design variable, ranging from 2 to 3.5 cm. In P p and P n , for the NT type, the range of movement from one end of the cell to the other tab is defined as 0–100%. In the case of the LT and CT types, P p and P n are designated as 0 and 100%, respectively, from one edge of the cell to the other edge.
The response to the design optimization is defined as a temperature difference ( T d i f f ) that can reduce the numerical analysis calculation load, demonstrating the same tendency as that of the temperature distribution. Equation (18) represents T d i f f , which is calculated as the difference between the maximum ( T m a x ) and minimum temperatures ( T m i n )
T d i f f = T m a x T m i n

3.2. Design Optimization Formulation

Equation (19) shows the formulation of the design optimization. Five design variables were used, namely, P p , P n , W p , W n , and H t . The objective function was to minimize T d i f f , which represents the difference between T m a x and T m i n . An upper and a lower limit for each design variable were established as constraints. The total tab area of the initial NT type cell was set to an upper limit of 18 cm2 to maintain a maximum tab area of the initial and optimized LIB cell designs. The micro-genetic algorithm (MGA), a global optimization method, was used as the optimization technique. The population size was calculated repeatedly up to 1000 generations. When T d i f f , which represents the objective function, was maintained for more than 40 generations, it was determined to have converged to the global optimal value [29,30]. Figure 5 illustrates the design optimization process to minimize T d i f f depending on the tab type, width, height limit, and attachment position of the LIB cell using the 3D electrochemical-thermal model.
F i n d   x i i = 1 , , 5 M i n i m i z e   T d i f f x i , S u b j e c t   t o 0 % x 1 , x 2 100 % 1   c m x 3 , x 4 9   c m 2   c m x 5 3.5   c m 0   c m 2 x 3 + x 4 x 5 18   c m 2

4. Results and Discussions

As a result of the optimization, as depicted in Figure 6, the convergence criteria were satisfied after 108, 154, and 157 generations of the optimized NT, LT, and CT types, respectively. Table 3 lists the changes in the design variables and responses before and after optimization. Figure 7 depicts T m a x , T m i n , T d i f f , and the temperature distribution for W p , n , H t , and P p , n in the initial NT type and optimized NT, LT, and CT types.
In the optimized NT type, P p was located at 43.61% from the nearest edge of the cell. Additionally, P n moved to the edge of the cell and was located at 7.568% from the nearest edge of the cell, W p was 5 cm, W n was 3.79 cm, and H t converged to 2.05 cm close to the lower limit. Furthermore, T m a x decreased by 7.9 °C, T m i n decreased by 0.13 °C, and T d i f f converged to 7.05 °C, which was lower by 52.2% than for the initial NT type. The change in the temperature distribution can be attributed to the maximum current pathway [15]. As the maximum current pathway increases, resistance ( R = ρ   L / A ) increases, increasing the Joule heat ( Q = I 2   R ) inside the cell. In this case, the positive tab, the primary heat source, was moved closer to the center of the cell and shortened the maximum current pathway inside the cell, thereby reducing T m a x . The negative tab, which was another heat source, was separated from the positive tab and located close to the edge of the cell so that heat was not concentrated. W p and W n were increased compared to the initial NT type, thereby reducing resistance due to an increase in the cross-sectional area of the tab and current collector. The decrease in resistance reduced the Joule heat; by shortening H t , the resistance was reduced owing to the decrease in the length of the tab itself, and the Joule heat was reduced.
In the optimized LT type, P p was located at a 50% distance from the center of the cell, whereas P n was located at 3.42%, close to the bottom edge of the cell. W p and W n converged to 5 cm and 3.5 cm, respectively, and H t converged to the lower limit of 2 cm. Compared to the initial NT type, in the optimized LT type, T m a x decreased by 9.07 °C, and T m i n increased by 0.92 °C; furthermore, T d i f f was calculated to be 4.83 °C, which was 67.4% lower than that of the initial NT type. The positive tab of the optimized LT type was moved to the center of the cell and the maximum current pathway was reduced, thus reducing T m a x . The negative tab was moved to the bottom of the cell farthest from the positive Table T m i n was observed around the bottom edge of the cell farthest from the positive tab, which was the primary heat source. T m i n increased as the negative tab was moved to the lower edge of the cell where T m i n was observed. Therefore, T m a x decreased and T m i n increased, resulting in a decrease in T d i f f . Compared to the initial NT type, in the optimized LT type, W p increased by 2 cm and W n increased by 0.5 cm. Accordingly, the Joule heat decreased due to the increase in the cross-sectional area. As H t converged to the lower limit, the Joule heat decreased due to a decrease in resistance.
In the optimized CT type, both P p and P n were located at 50% and 49.27% as the cell center. W p converged to 6.5 cm wider than the initial NT type, and W n was 2.5 cm narrower than the initial NT type. H t converged to the lower limit of 2 cm, similar to other optimized designs. The T m a x and T m i n values for the optimized CT type converged to 51.22 °C and 48.14 °C, which were the lowest temperatures for the initial NT type and optimized NT and LT types, and T d i f f decreased by 79.2% (3.08 °C) compared to that of the initial NT type. The positive and negative tabs were moved to the center of the cell to achieve a symmetrical shape, and the maximum current pathway related to the internal resistance was minimized, reducing T m a x and T m i n . The W p value of the optimized CT type increased compared to that of the initial NT type, and the Joule heat was reduced. W n decreased compared to the initial NT type. Since the resistivity of the positive current collector, with a tab made of aluminum, was greater than that of the negative current collector, with a tab made of copper, even when W n decreased, the overall heat generation decreased due to the increase in W p . The potential distributions in Figure 8 and Figure 9 confirm that the potential gradient was concentrated at the positive and negative tabs, regardless of the design of the Table In addition, in all the tab types, the potential gradient in the positive current collector was larger than the negative current collector, due to its higher resistivity. In the case of the optimized CT type, a potential distribution at the negative current collector similar to that of other tab types was formed, but the positive current collector had the lowest potential gradient and formed a more uniform potential distribution than those of other tab types. The lowest potential gradient was formed in the optimized CT type, which was 37.1% less than that of the initial NT type.
Thereafter, the capacity retention rate was compared using an aging analysis of the 3C rate for 2500 cycles to confirm the lifespan enhancement of the optimized CT type, the most optimized design, compared to the lifespan of the initial NT type. Figure 10 shows a comparison of the capacity retention rates of the initial NT type and optimized CT type. Due to the increase in the number of parasitic Li ions and the SEI layer generated by the reduction reaction, the internal resistance of the cell increased and a loss of Li ions occurred, thereby reducing the cell capacity. The capacity retention rates of the initial NT type and optimized CT type continued to decrease, but the capacity reduction rate in the initial NT type was relatively more significant. After 2500 cycles of charge/discharge, the capacity of the optimized CT type was 6.5% larger than that of the initial NT type; therefore, it was confirmed that the lifespan was improved by uniformizing the temperature distribution of the LIB cell.

5. Conclusions

In this study, to ensure uniform temperature distribution in 55 Ah LFP/graphite large-format pouch cells and improve their lifespan, the difference was minimized between T m a x and T m i n of the positive and negative tabs of NT type cells, LT type cells, and CT type cells. Due to this optimization, temperature distribution was most uniform when the positive tab and the negative tab were positioned at the center of the cell in the optimized CT type; W p was 6.5 cm, W n was 2.5 cm, and H t converged to 2 cm. The optimized CT type showed a 19.9% decrease in T m a x , 1.98% decrease in T m i n , and 79.2% decrease in T d i f f compared to the initial NT type. The potential difference inside the cell increased in the order of optimized CT type, LT type, NT type, and initial NT type, and formed a potential gradient in the optimized CT type that was 37.1% less than that of the initial NT type. A 3C-rate charge/discharge analysis was performed to analyze the lifespan enhancement due to the improvement in the uniformity of temperature distribution. After 2500 cycles of charge/discharge, the capacity retention rate of the optimized CT type was 6.5% greater than that of the initial NT type; therefore, it was confirmed that lifespan was improved by uniformizing the temperature distribution of the LIB cell.

Author Contributions

Conceptualization, J.L., H.C. and C.-W.K.; methodology, J.L., H.C. and C.-W.K.; software, J.L. and H.C.; validation, J.L. and H.C.; Formal analysis, J.L. and H.C.; investigation, J.L.; resources, J.L. and H.C.; data curation, J.L.; writing—original draft preparation, J.L.; writing—review and editing, J.L., H.C. and C.-W.K.; visualization, J.L. and H.C.; supervision, C.-W.K.; project administration, C.-W.K.; funding acquisition, C.-W.K. All authors have read and agreed to the published version of the manuscript.

Funding

This paper was supported by National Research Foundation of Korea (NRF) grant funded by the Korea government the Ministry of Science, ICT & Future Planning (No. 2019R1A2C1090228) and Korea Institute for Advancement of Technology (KIAT) grant funded by the Korea Government (MOTIE) (P0020536, HRD Program for Industrial Innovation).

Data Availability Statement

Not applicable.

Conflicts of Interest

The authors declare no conflict of interest.

Nomenclature

σ Solid-phase conductivity (S/cm)
ϕ Electrical potential (V)
a s Specific interfacial area (1/cm)
κ Electrolyte-phase conductivity
j Current density (mA/cm2)
c Li ion concentration (mol/cm3)
D Diffusion coefficient (cm2/s)
r Radial coordinate
t + Transference number
F Faraday’s constant (C/mol)
ε Porosity
α Exchange coefficient
δ S E I SEI layer thickness growth (μm)
i s i d e Side reaction current density (A/cm2)
M S E I SEI layer resistance (Ω cm2)
ρ S E I SEI layer density (kg/cm3)
A s Cell surface area exposed to convective cooling medium (cm2)
C p Heat capacity (J/K)
T Absolute temperature (K)
R f Contact resistance (Ω cm2)
η Overpotential (V)
U Thermodynamic equilibrium potential (V)
R Universal gas constant
i 0 Exchange current density (mA/cm2)
I Current (A)
W c LIB cell width (mm)
H c LIB cell height (mm)
d p Distance from LIB cell edge to nearest corner of positive tab
d n Distance from LIB cell edge to nearest corner of negative tab
Subscripts and superscripts
s Solid phase
e Electrolyte phase
a Anode
c Cathode
SEISolid Electrolyte Interphase layer
sideSide reaction
initInitial value
e f f Effective value
NTNominal tab
LTLateral tab
CTCounter tab

References

  1. Barnoon, P. Modeling of a high temperature heat exchanger to supply hydrogen required by fuel cells through reforming process. Energy Rep. 2021, 7, 5685–5699. [Google Scholar] [CrossRef]
  2. EV OUTLOOK 2021. Progress in EV Sales, Infrastructure Development, and Fleet Expansion. Available online: https://blastpoint.com/wp-content/uploads/2020/02/BlastPoint-2021-EV-Outlook_Report.pdf (accessed on 8 December 2022).
  3. Pillot, C. Lithium-Ion Battery Raw Material Supply & Demand 2016–2025. In Proceedings of the Advanced Automotive Battery Conference, Mainz, Germany, 30 January–2 February 2017. [Google Scholar]
  4. Walton, B.; Hamilton, J.; Alberts, G.; Fullerton-Smith, S.; Day, E.; Ringrow, J. Electric vehicles Setting a course for 2030. Deloitte Insights 2020, 15, 1–30. [Google Scholar]
  5. Lowell, D.; Huntington, A. Electric Vehicle Market Status-Update. Available online: https://mjbradley.com/sites/default/files/EDF_EV_Market_Report_September_2020_Update.pdf (accessed on 8 December 2022).
  6. Curry, C. Lithium-ion battery costs and market. Bloom. New Energy Financ. 2017, 5, 4–6. [Google Scholar]
  7. Pang, X.; Huo, Y.; Fang, H.; Rao, Z. Analysis of temperature uniformity of electric vehicle battery system with swirling flow strengthened heat transfer. Appl. Therm. Eng. 2021, 193, 116995. [Google Scholar] [CrossRef]
  8. Jiang, W.; Zhao, J.; Rao, Z. Heat transfer performance enhancement of liquid cold plate based on mini V-shaped rib for battery thermal management. Appl. Therm. Eng. 2021, 189, 116729. [Google Scholar] [CrossRef]
  9. Kim, G.-H.; Smith, K.; Lee, K.-J.; Santhanagopalan, S.; Pesaran, A. Multi-Domain Modeling of Lithium-Ion Batteries Encompassing Multi-Physics in Varied Length Scales. J. Electrochem. Soc. 2011, 158, A955–A969. [Google Scholar] [CrossRef]
  10. Grandjean, T.; Barai, A.; Hosseinzadeh, E.; Guo, Y.; McGordon, A.; Marco, J. Large format lithium ion pouch cell full thermal characterisation for improved electric vehicle thermal management. J. Power Sources 2017, 359, 215–225. [Google Scholar] [CrossRef]
  11. Kim, H.K.; Kim, C.J.; Kim, C.W.; Lee, K.J. Numerical analysis of accelerated degradation in large lithium-ion batteries. Comput. Chem. Eng. 2018, 112, 82–91. [Google Scholar] [CrossRef]
  12. Song, W.; Chen, M.; Bai, F.; Lin, S.; Chen, Y.; Feng, Z. Non-uniform effect on the thermal/aging performance of Lithium-ion pouch battery. Appl. Therm. Eng. 2018, 128, 1165–1174. [Google Scholar] [CrossRef]
  13. Zhu, Y.; Xie, J.; Pei, A.; Liu, B.; Wu, Y.; Lin, D.; Li, J.; Wang, H.; Chen, H.; Xu, J.; et al. Fast lithium growth and short circuit induced by localized-temperature hotspots in lithium batteries. Nat. Commun. 2019, 10, 2067. [Google Scholar] [CrossRef]
  14. Kim, U.S.; Shin, C.B.; Kim, C.-S. Effect of electrode configuration on the thermal behavior of a lithium-polymer battery. J. Power Sources 2008, 180, 909–916. [Google Scholar] [CrossRef]
  15. Samba, A.; Omar, N.; Gualous, H.; Capron, O.; Bossche, P.V.D.; Van Mierlo, J. Impact of Tab Location on Large Format Lithium-Ion Pouch Cell Based on Fully Coupled Tree-Dimensional Electrochemical-Thermal Modeling. Electrochimica Acta 2014, 147, 319–329. [Google Scholar] [CrossRef]
  16. Du, S.; Jia, M.; Cheng, Y.; Tang, Y.; Zhang, H.; Ai, L.; Zhang, K.; Lai, Y. Study on the thermal behaviors of power lithium iron phosphate (LFP) aluminum-laminated battery with different tab configurations. Int. J. Therm. Sci. 2015, 89, 327–336. [Google Scholar] [CrossRef]
  17. Kosch, S.; Rheinfeld, A.; Erhard, S.V.; Jossen, A. An extended polarization model to study the influence of current collector geometry of large-format lithium-ion pouch cells. J. Power Sources 2017, 342, 666–676. [Google Scholar] [CrossRef]
  18. Zhang, X.; Chang, X.; Shen, Y.; Xiang, Y. Electrochemical-electrical-thermal modeling of a pouch-type lithium ion battery: An application to optimize temperature distribution. J. Energy Storage 2017, 11, 249–257. [Google Scholar] [CrossRef]
  19. Mei, W.; Chen, H.; Sun, J.; Wang, Q. Numerical study on tab dimension optimization of lithium-ion battery from the thermal safety perspective. Appl. Therm. Eng. 2018, 142, 148–165. [Google Scholar] [CrossRef]
  20. Zhao, Y.; Diaz, L.B.; Patel, Y.; Zhang, T.; Offer, G.J. How to Cool Lithium Ion Batteries: Optimising Cell Design using a Thermally Coupled Model. J. Electrochem. Soc. 2019, 166, A2849–A2859. [Google Scholar] [CrossRef]
  21. Lee, D.-C.; Lee, J.-J.; Kim, J.-S.; Cho, S.; Kim, C.-W. Thermal behaviors analysis of 55 Ah large-format lithium-ion pouch cells with different cell aspect ratios, tab locations, and C-rates. Appl. Therm. Eng. 2020, 175, 115422. [Google Scholar] [CrossRef]
  22. Lee, J.-J.; Kim, J.-S.; Chang, H.-K.; Lee, D.-C.; Kim, C.-W. The Effect of Tab Attachment Positions and Cell Aspect Ratio on Temperature Difference in Large-Format LIBs Using Design of Experiments. Energies 2020, 14, 116. [Google Scholar] [CrossRef]
  23. Lee, J.-J.; Kim, J.-S.; Lee, D.-C.; Chang, H.; Kim, C.-W. Design optimization of tab attachment positions and cell aspect ratio to minimize temperature difference in 45-Ah LFP large-format lithium-ion pouch cells. Appl. Therm. Eng. 2021, 182, 116143. [Google Scholar] [CrossRef]
  24. Doyle, M.; Fuller, T.F.; Newman, J. Modeling of Galvanostatic Charge and Discharge of the Lithium/Polymer/Insertion Cell. J. Electrochem. Soc. 1993, 140, 1526–1533. [Google Scholar] [CrossRef]
  25. Rao, L.; Newman, J. Heat-Generation Rate and General Energy Balance for Insertion Battery Systems. J. Electrochem. Soc. 1997, 144, 2697–2704. [Google Scholar] [CrossRef]
  26. Safari, M.; Morcrette, M.; Teyssot, A.; Delacourt, C. Multimodal Physics-Based Aging Model for Life Prediction of Li-Ion Batteries. J. Electrochem. Soc. 2009, 156, A145–A153. [Google Scholar] [CrossRef]
  27. Guo, G.; Long, B.; Cheng, B.; Zhou, S.; Xu, P.; Cao, B. Three-dimensional thermal finite element modeling of lithium-ion battery in thermal abuse application. J. Power Sources 2010, 195, 2393–2398. [Google Scholar] [CrossRef]
  28. Yu, S.; Kim, S.; Kim, T.Y.; Nam, J.H.; Cho, W.I. Model Prediction and Experiments for the Electrode Design Optimization of LiFePO4/Graphite Electrodes in High Capacity Ltihium-ion Batteries. Bull. Korean Chem. Soc. 2013, 34, 79–88. [Google Scholar] [CrossRef]
  29. Venter, G. Review of Optimization Techniques. In Encyclopedia of Aerospace Engineering; John Wiley & Sons, Ltd.: Hoboken, NJ, USA, 2010. [Google Scholar]
  30. PIDOTECH Inc. PIAnO User’s Manuals and Tutorials; PIDOTECH Inc.: Seoul, Republic of Korea, 2021. [Google Scholar]
Figure 1. Schematic of (a) electrochemical-thermal model and (b) FE model of LIB unit cell.
Mathematics 11 01970 g001
Figure 2. Dimensions and boundary conditions for 55 Ah LIB cell.
Mathematics 11 01970 g002
Figure 3. Comparison of reference [11,28] and analysis results: (a) discharge curve; (b) maximum and minimum temperature.
Mathematics 11 01970 g003
Figure 4. Definition of design variables: (a) NT type, (b) LT type, (c) CT type.
Mathematics 11 01970 g004
Figure 5. Flowchart of optimization process.
Mathematics 11 01970 g005
Figure 6. Convergence history of T d i f f : (a) NT type; (b) LT type; (c) CT type.
Mathematics 11 01970 g006
Figure 7. Temperature distribution: (a) initial NT type, (b) optimized NT type, (c) optimized LT type, and (d) optimized CT type.
Mathematics 11 01970 g007
Figure 8. Potential distribution at negative current collector: (a) initial NT type, (b) optimized NT type, (c) optimized LT type, and (d) optimized CT type.
Mathematics 11 01970 g008
Figure 9. Potential distribution at positive current collector: (a) initial NT type, (b) optimized NT type, (c) optimized LT type, and (d) optimized CT type.
Mathematics 11 01970 g009
Figure 10. Comparison of capacity retention rate between initial NT type and optimized CT type.
Mathematics 11 01970 g010
Table 1. Summary of dimension parameters and specifications.
ParameterNegative ElectrodeSeparatorPositive Electrode
Diffusion coefficient (m2/s)4.0 × 10−10-6.5 × 10⁻¹⁸
Thickness ( μ m ) 67.72576
Solid-phase conductivity (S/m)100-11.8
Reaction rate constant (m/s)3.5 × 10−11-5.5 × 10⁻¹²
Charge transfer coefficient0.5-0.5
Electrolyte-phase volume0.3410.310.31
Maximum solid-phase concentration (mol/m3)30,555-23,000
Electrolyte diffusion coefficient (m2/s)3.0 × 10−10
Initial electrolyte salt concentration (mol/m3)1000
Heat transfer coefficient on the top surface (W/m2 K)5
Atmosphere temperature (K)298
ParameterValue
Cell width (mm)210
Cell height (mm)297
Cell thickness (mm)7.5
Tab width (mm)3.0
Tab height (mm)3.0
Nominal capacity (Ah)55
Nominal voltage (V)3.2
Cutoff voltage (V)2.5
Table 2. Boundaries of design variables.
Design VariablesLower BoundaryUpper Boundary
x 1 ( P p ) 0 (%)100 (%)
x 2 ( P n ) 0 (%)100 (%)
x 3 ( W p ) 1 (cm)9 (cm)
x 4 ( W n ) 1 (cm)9 (cm)
x 5 ( H t )2 (cm)3.5 (cm)
Table 3. Design variables and responses based on optimization results.
Design VariableInitial NT TypeOptimized NT TypeOptimized LT TypeOptimized CT Type
x 1   ( P p ) 26.1943.6150.0050.00
x 2   ( P n ) 26.197.5683.4249.27
x 3   ( W p ) 3.005.005.006.50
x 4   ( W n ) 3.003.793.502.50
x 5   ( H t ) 3.002.052.002.00
Response (°C)Initial NT TypeOptimized NT TypeOptimized LT TypeOptimized CT Type
T m a x 63.9356.0354.8651.22
T m i n 49.1148.9850.0348.14
T d i f f 14.827.054.833.08
Disclaimer/Publisher’s Note: The statements, opinions and data contained in all publications are solely those of the individual author(s) and contributor(s) and not of MDPI and/or the editor(s). MDPI and/or the editor(s) disclaim responsibility for any injury to people or property resulting from any ideas, methods, instructions or products referred to in the content.

