Article

Study on the Mechanical Behavior and Constitutive Model of Layered Sandstone under Triaxial Dynamic Loading

1
School of Energy and Mining Engineering, China University of Mining and Technology (Beijing), Beijing 100083, China
2
China Center for Safety Research, Ministry of Emergency Management of the People’s Republic of China, Beijing 100013, China
3
Hebei Haowei Xuguang New Material Technology Co., Ltd., Handan 057350, China
*
Author to whom correspondence should be addressed.
Mathematics 2023, 11(8), 1959; https://doi.org/10.3390/math11081959
Submission received: 18 March 2023 / Revised: 7 April 2023 / Accepted: 18 April 2023 / Published: 21 April 2023

Abstract

:
In construction engineering, rock is an important building material. During the construction process, layered rock masses are typically subjected to varying dynamic load disturbances under triaxial loads. It is thus essential to investigate the mechanical response of layered rocks under various disturbances of the triaxial loads. By using a three-dimensional SHPB, triaxial dynamic compression tests with various impact dynamic load disturbances and identical triaxial static loads were carried out on sandstones with differing bedding angles. The impact pressures were 0.8, 1.2, and 1.6 MPa, and the bedding angles were 0°, 30°, 45°, 60°, and 90°. The results showed that the ductility of the sandstone considerably increased under triaxial static loading. With the increasing bedding angle, the sandstone’s dynamic strength and coupling strength first declined and subsequently rose. As the impact pressure increased, the reflective energy ratio, peak strain, and dynamic growth factor of the sandstone essentially rose progressively. The bedding angles and dynamic loads had a major impact on the damage pattern of the layered sandstones. Additionally, a constitutive model considering bedding angle, dynamic load, and static load was established and verified. The constitutive model was able to accurately characterize the dynamic behavior of the rock under load disturbances.

1. Introduction

As a common building material, rock is often used in various construction projects [1,2]. In addition, because of the process of geological movement, rocks often contain layered structures due to sedimentation. Different dynamic loads significantly affect the internal parameters of rocks. Due to blasting, earthquakes, and drilling construction, many rock engineering projects, such as those involving the foundations of buildings, slopes, and mine construction, are affected by dynamic loads. Because of different dynamic loads, these constructions are often subject to different geological disasters. Examples include foundation instability, slope landslides, and mine building instability damage. There is thus an urgent requirement to investigate the constitutive modelling and mechanical behavior of layered sandstone under triaxial dynamic loads.
The dynamic response of rocks is a popular topic in research on the mechanics of rocks. Many teams have performed studies on rock dynamic behavior under 1D static and dynamic loading and found that prestressing has a critical value for rock strength enhancement as well as an important effect on rock failure characteristics [3,4,5,6,7,8]. Little research has been conducted on the dynamic behavior of rocks under triaxial conditions. Gong carried out numerous triaxial dynamic compression tests on sandstone and discovered that the strain rate had a positive relationship with the triaxial dynamic strength of the rock and that the confining pressure could influence the sandstone dynamic parameters considerably [9]. Luo conducted three-dimensional dynamic compression tests on bedding shale, and the research results showed that under a given confining pressure, the fracture pattern of the rock was markedly influenced by the dynamic loading, and the failure mode was compressor-shear failure [10]. Li implemented a triaxial dynamic load test on granite coupled with temperature and pressure and found that the effect of temperature on the dynamical strength of granite was subject to a specific threshold, while confining pressure could enhance the rock strength significantly [11]. Xu examined the impact of hydrostatic pressure and freeze–thaw cycles on the mechanical behavior of rock and discovered that the more freeze–thaw cycles there were, the more cracks there were. Additionally, confining pressure inhibits crack propagation and improves rock strength [12]. Zhou conducted three-dimensional dynamic compression tests on 3D-printed rock materials and determined that there was a positive relation between the volume strain of the rock and the strain rate [13]. Zhou studied mechanisms of rock mechanics under coupled conditions of triaxial dynamic compression and water content and concluded that water weakened the rock [14]. Wang performed a series of 3D repeated impact tests on sandstone and observed that the variation in the number of impacts changed the shape of the sandstone stress–strain curve. Furthermore, a corresponding damage constitutive model was developed [15]. In accordance with the test results, some improved dynamic strength criteria were proposed [16,17,18]. Compressive shear failure is a frequent mechanism of the failure of rocks. On the basis of this feature, Du carried out a combination of static and dynamic shear tests on sandstone and found that confining pressure would limit rock deformation; they also performed a theoretical analysis using the Drucker–Prager criterion. The dynamic peak strength of the rock was not gradually affected by the dynamic stress with increasing confining pressure. The elastic modulus of the rock was proportional to the confining pressure but independent of the dynamic stress. The confining pressure and strain rate significantly increased the energy absorption threshold of the rock. The numerical simulation software DEM was used to verify the results [19,20,21]. Yao investigated the dynamic tensile strength of Laurentian granite under hydrostatic pressure and proposed an empirical strength formula [22,23].
With the development of science and technology, some scholars have developed true triaxial dynamic test systems [24,25,26]. With the aid of a true triaxial test system, You examined the impact of the medium principal stress on sandstone and found that the medium principal stress was positively correlated with the dynamic elastic modulus [27]. Gong conducted a true triaxial dynamic impact test on granite and found that the prestress was positively correlated with failure strain. Three-dimensional static stress also significantly increased the rock strength [28]. Luo studied the law of damage accumulation and energy evolution in granite under true triaxial conditions and found that under triaxial dynamic loading, granite was primarily shear-fractured [29]. Wu showed that the volume strain and number of cracks in the rock rose as the incident energy increased [30]. Liu carried out true triaxial dynamic impact tests on sandstone, marble, and granite and the findings indicated that varying loading patterns had a marked effect on the damage pattern of sandstone. The failure mode, damage state, and crack propagation process are different for different lithologies [31,32]. Because of the complexity of the SHPB tests, SHPB numerical simulation techniques have developed rapidly. Some scholars have established numerical simulation triaxial SHPB models by using different means and conducting impact tests and found that numerical simulations can verify the experimental results [33,34,35].
In summary, the above studies on rock dynamic behavior under triaxial dynamic loading tended to focus on intact rock. However, a rock mass contains a large number of bedding planes, and little research has been conducted on the damage constitutive modelling and dynamic response of laminated sandstones under triaxial static loading. Therefore, in this paper, the improved three-dimensional SHPB was employed for triaxial dynamic compression tests on laminated sandstones, and the strength, deformation, failure characteristics, anisotropy coefficient, DIF, and energy conversion mechanism of sandstone under these conditions were examined. Furthermore, a damage constitutive model was built for this system and a theoretical comparison of this damage constitutive model with the test data was carried out. The damage constitutive model appeared consistent with the dynamic response of sandstone under the conditions examined.

2. Sample Preparation and Test System

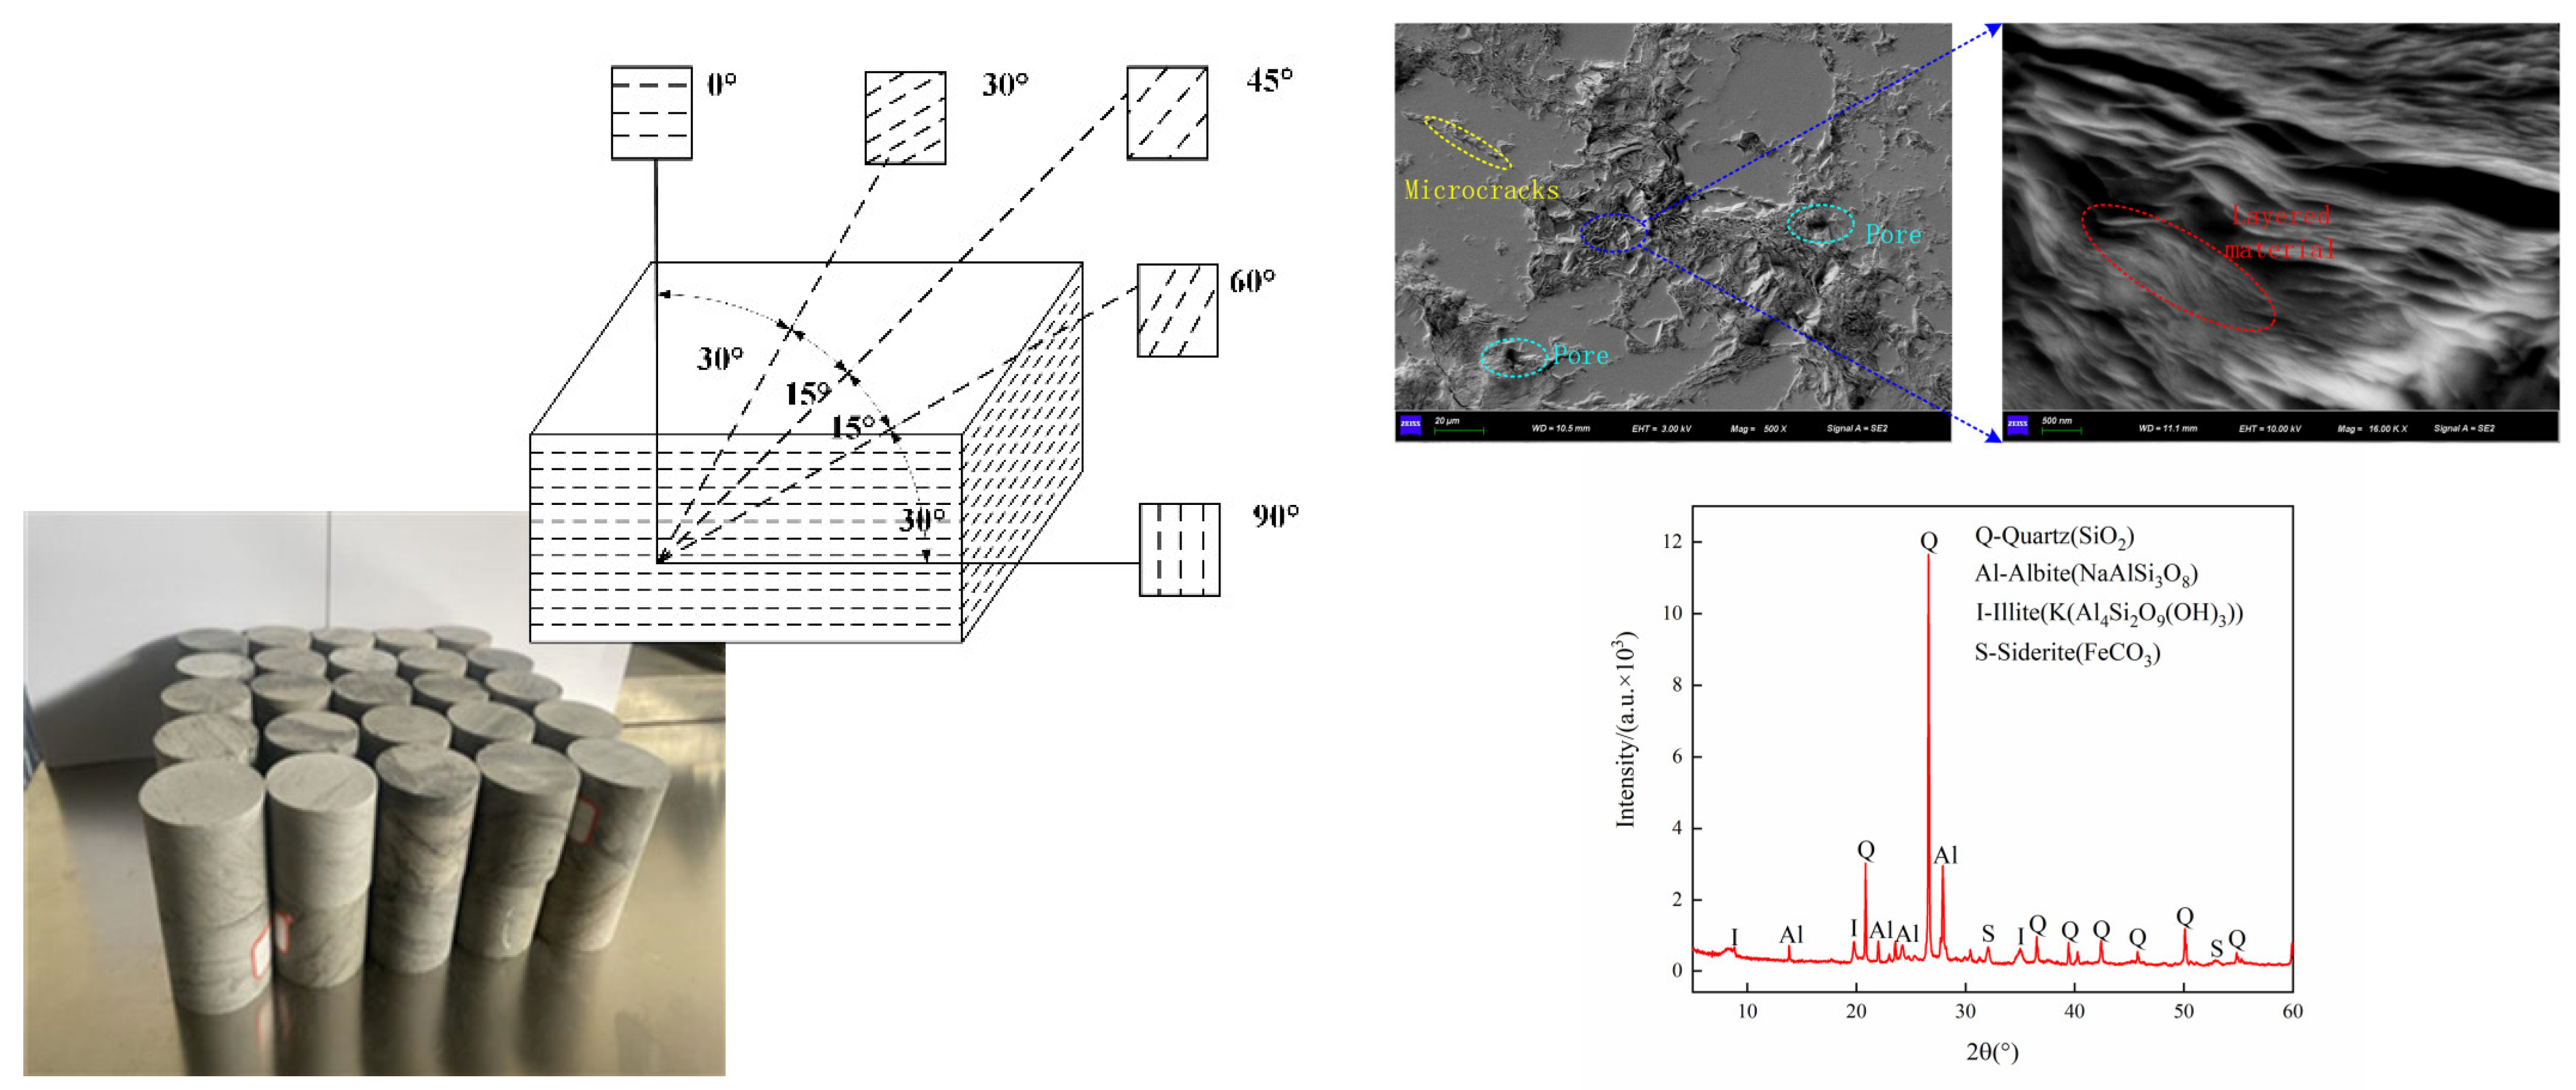
2.1. Sample Preparation
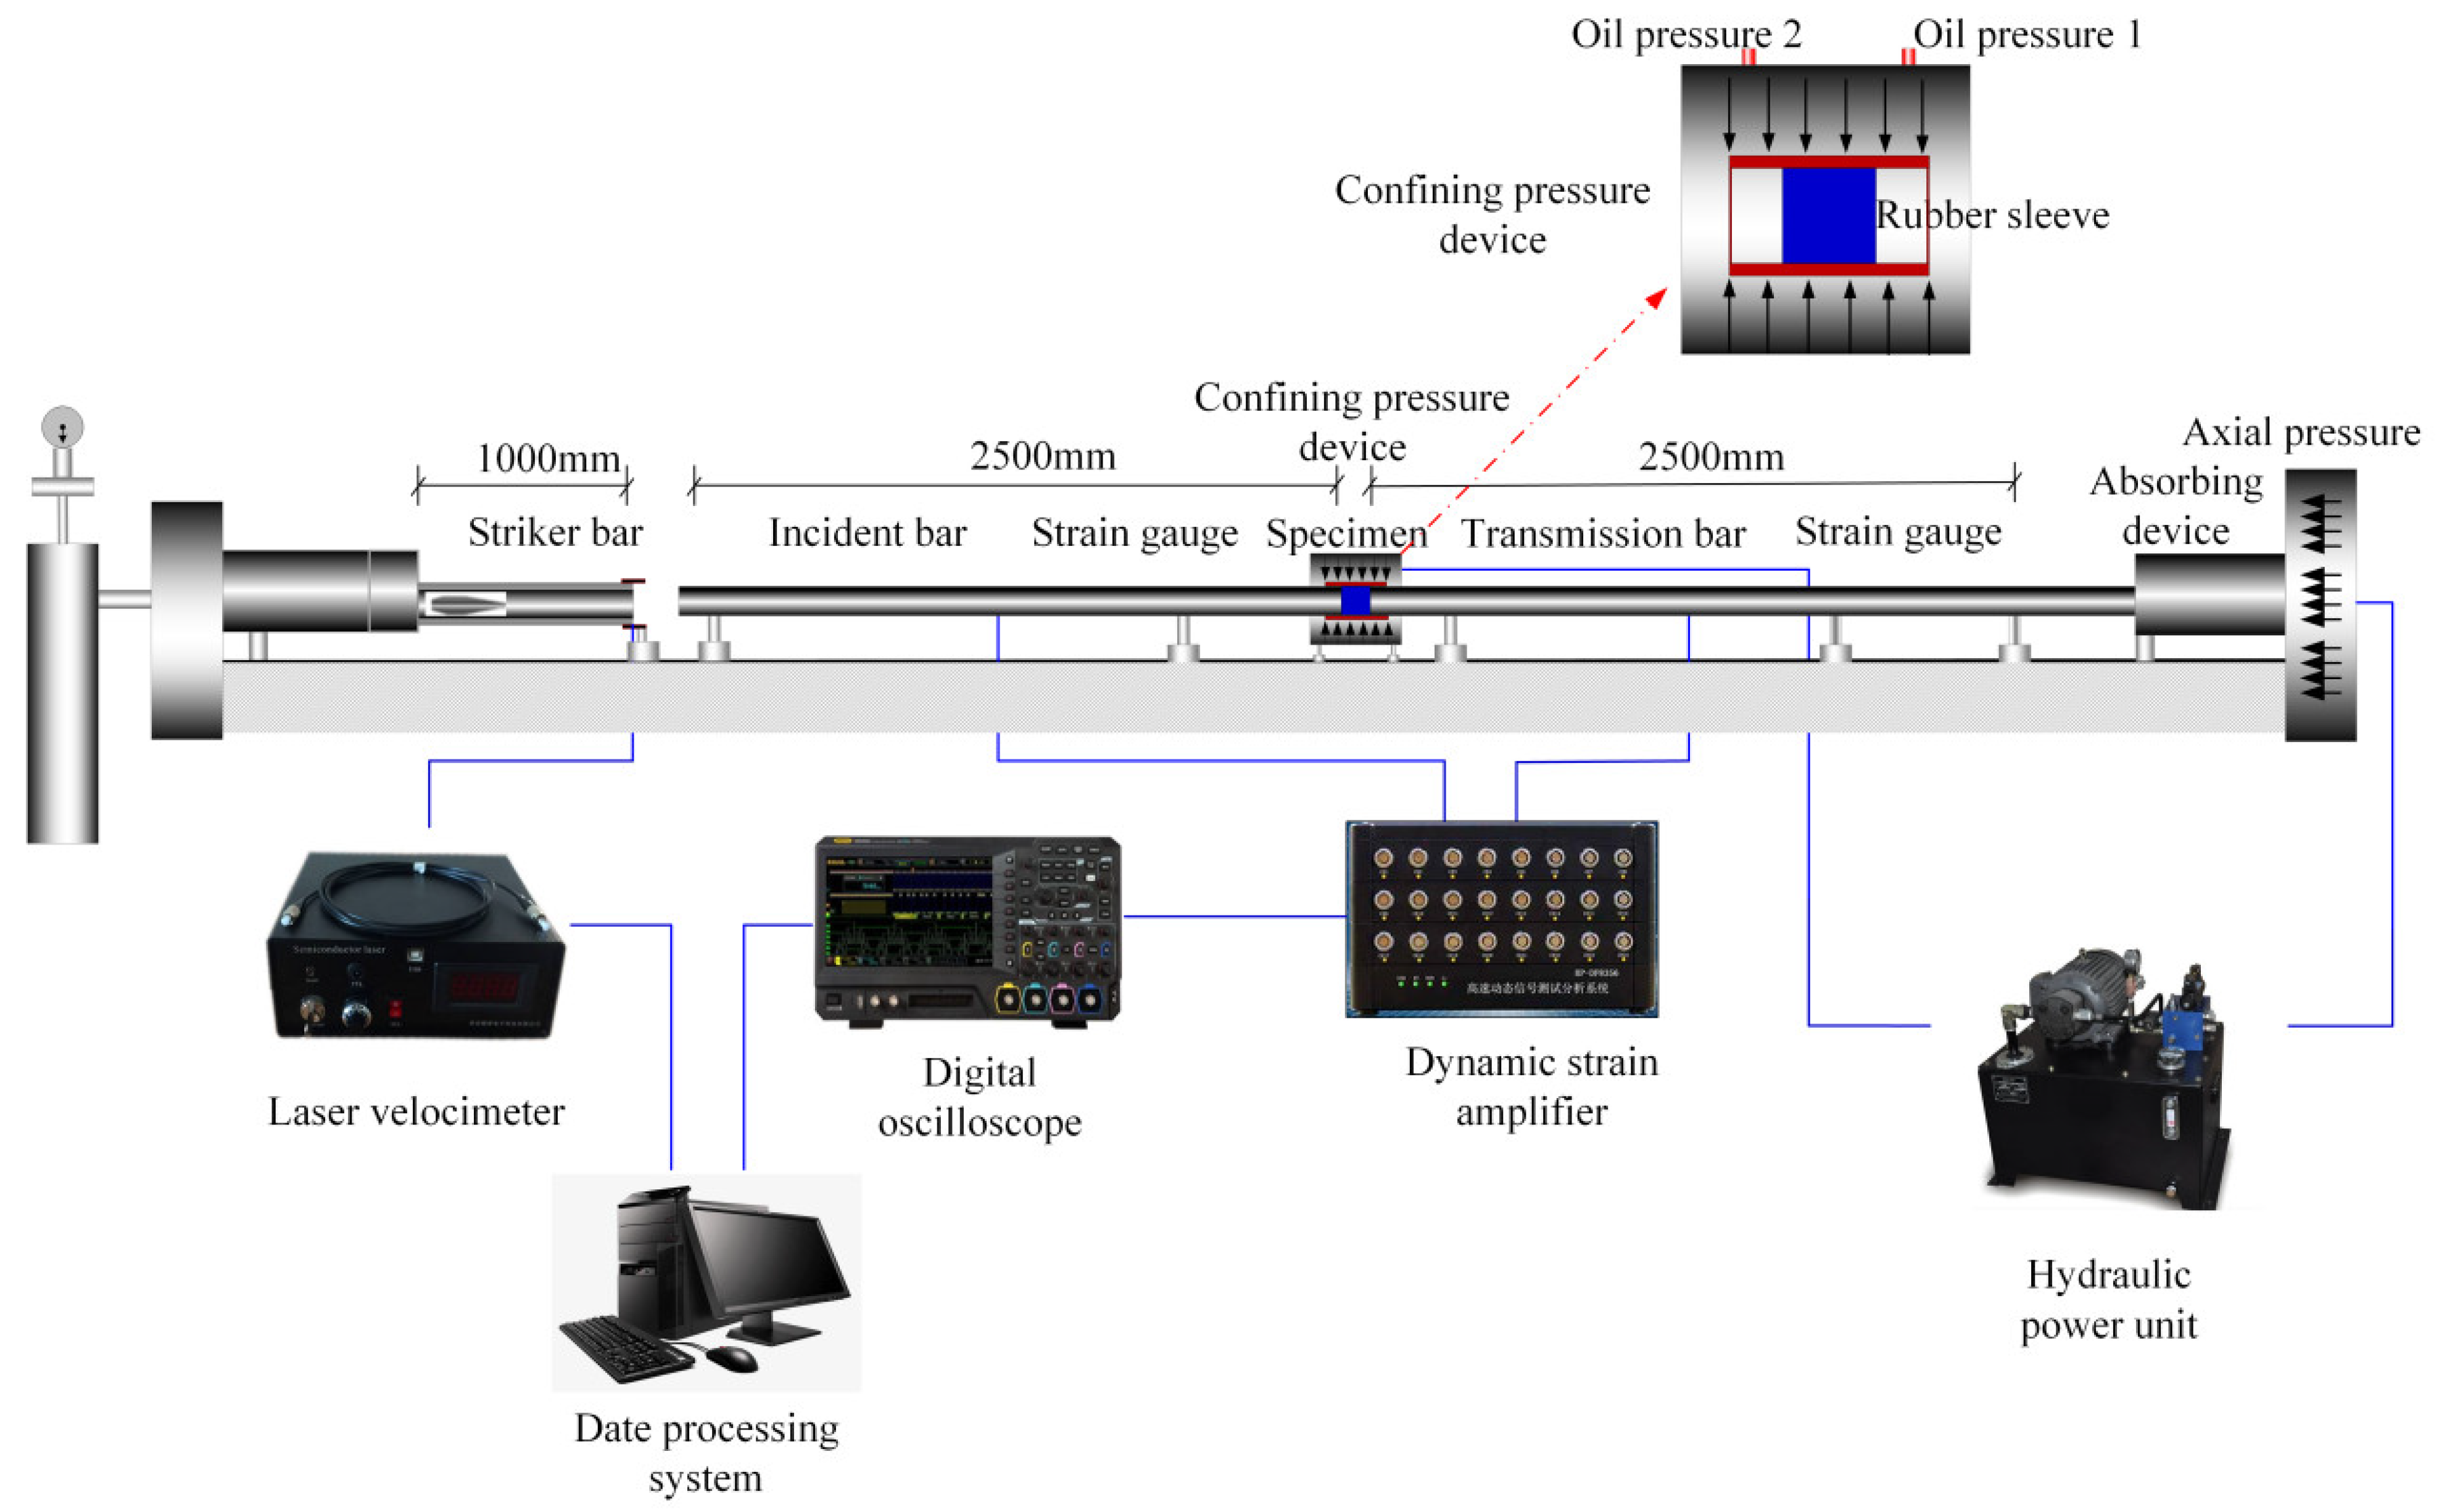
The samples used in the test are shown in Figure 1. In this test, the samples were assayed by SEM and XRD, and the results of the XRD tests indicated that the samples had an internal composition of sandstone. The SEM test results showed that the sample contained obvious holes, cracks, and layered material components, and the bedding effect was obvious. In addition, to meet the requirements of the test, the samples were machined into cylindrical specimens with bedding angles of 0°, 30°, 45°, 60°, and 90° and diameters/heights of 50 × 50 mm. The end face accuracy requirements met the requirements of the triaxial dynamic compression test.

2.2. Test Equipment

Figure 2 displays the instrument used in this study, which was an improved three-dimensional SHPB. The device parameters are shown in the Figure.

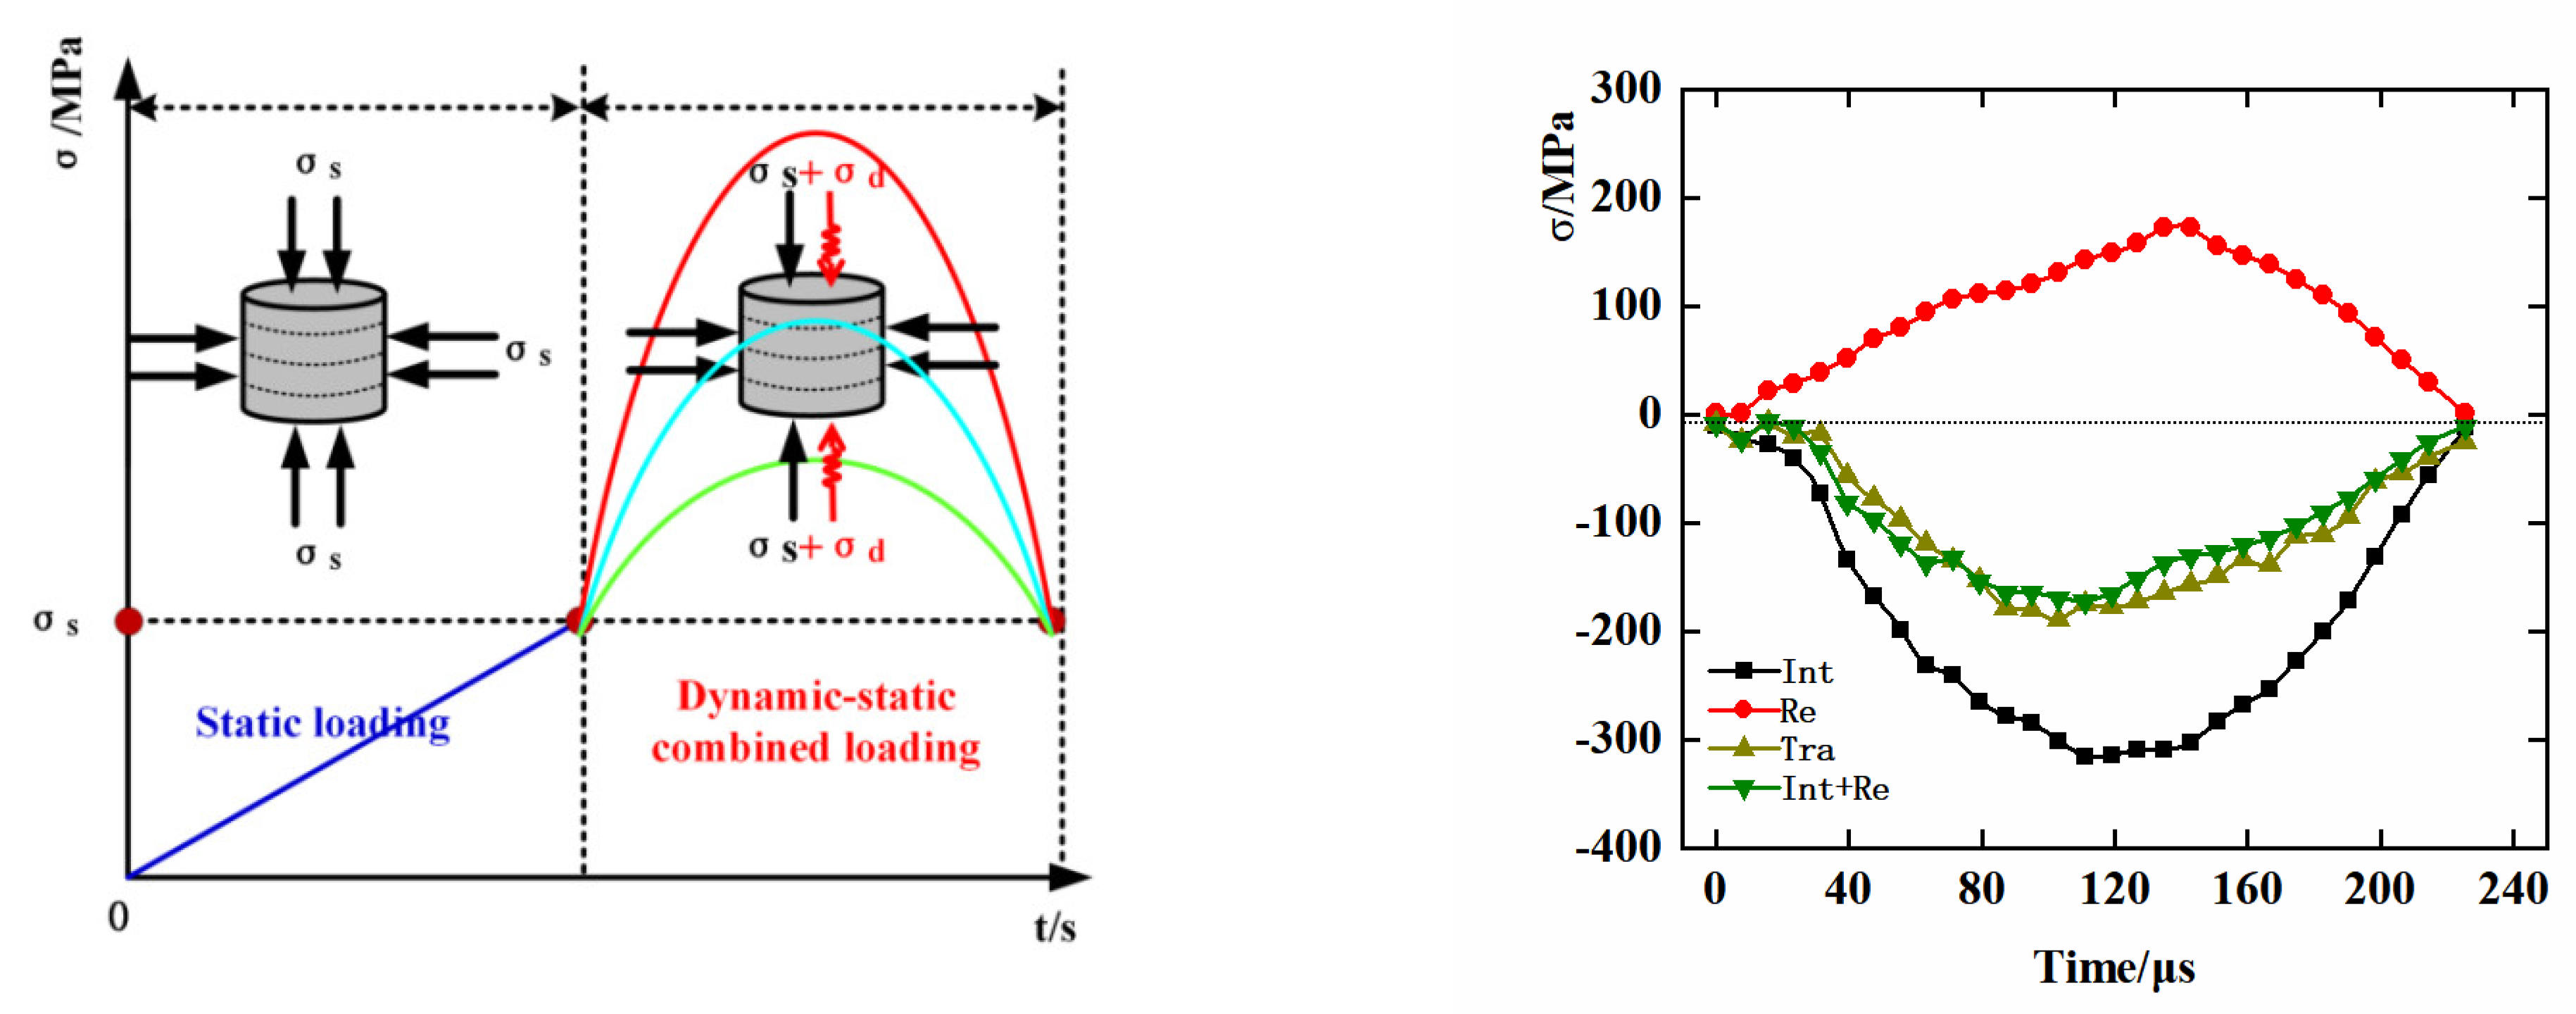
2.3. Test Scheme and Data Processing

Sandstone with 0°, 30°, 45°, 60°, and 90° bedding angles was first subjected to 10 MPa hydrostatic pressure and then to 1.6, 1.2, and 0.8 MPa in dynamic load impact. The test scheme is shown in Figure 3. Repeatability tests were performed three times for each condition. The sample satisfied the stress equilibrium, as illustrated in Figure 3. The dynamic strains and stresses in the rock samples can be derived from the below equations [15]:
σ ( t ) = A b E b A s ( ε t 1 - ε t 0 )
ε ( t ) = - 2 c b L s 0 t ε t 1 d t
ε ˙ = - 2 c b L s ε r 1
Ab, Eb, and Cb denote the cross-sectional area, elastic modulus, and elastic wave velocity of the bar, respectively; σ, ε, and ε ˙ represent the dynamic stress, dynamic strain, and strain rate, respectively; εr1 and εt1 represent the total strain of the reflecting rod and the transmission rod, respectively; εt0 represents the strain induced by the hydrostatic pressure of the transmission rod.

3. Results Analysis

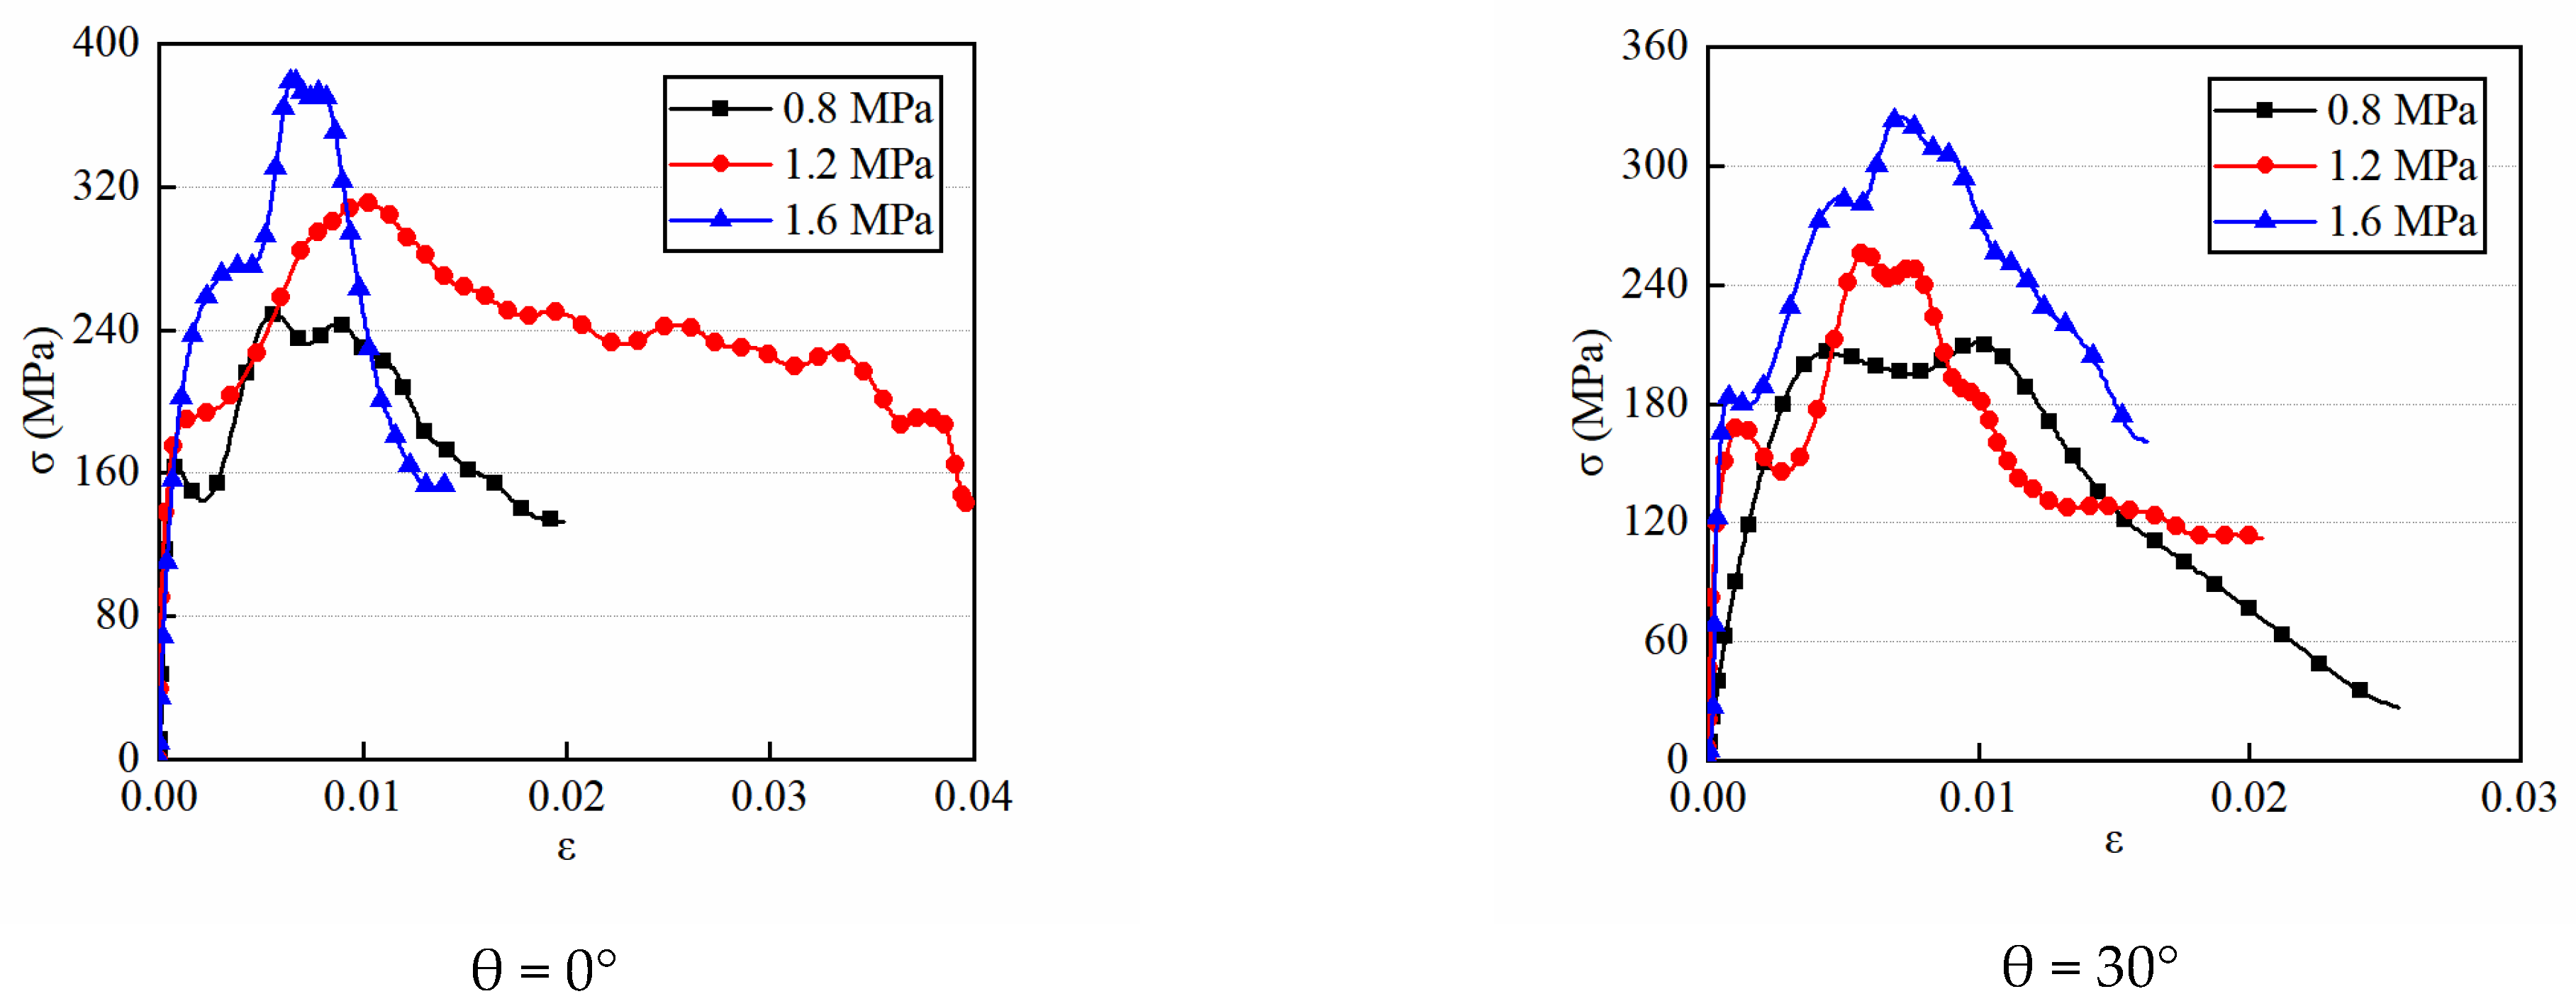
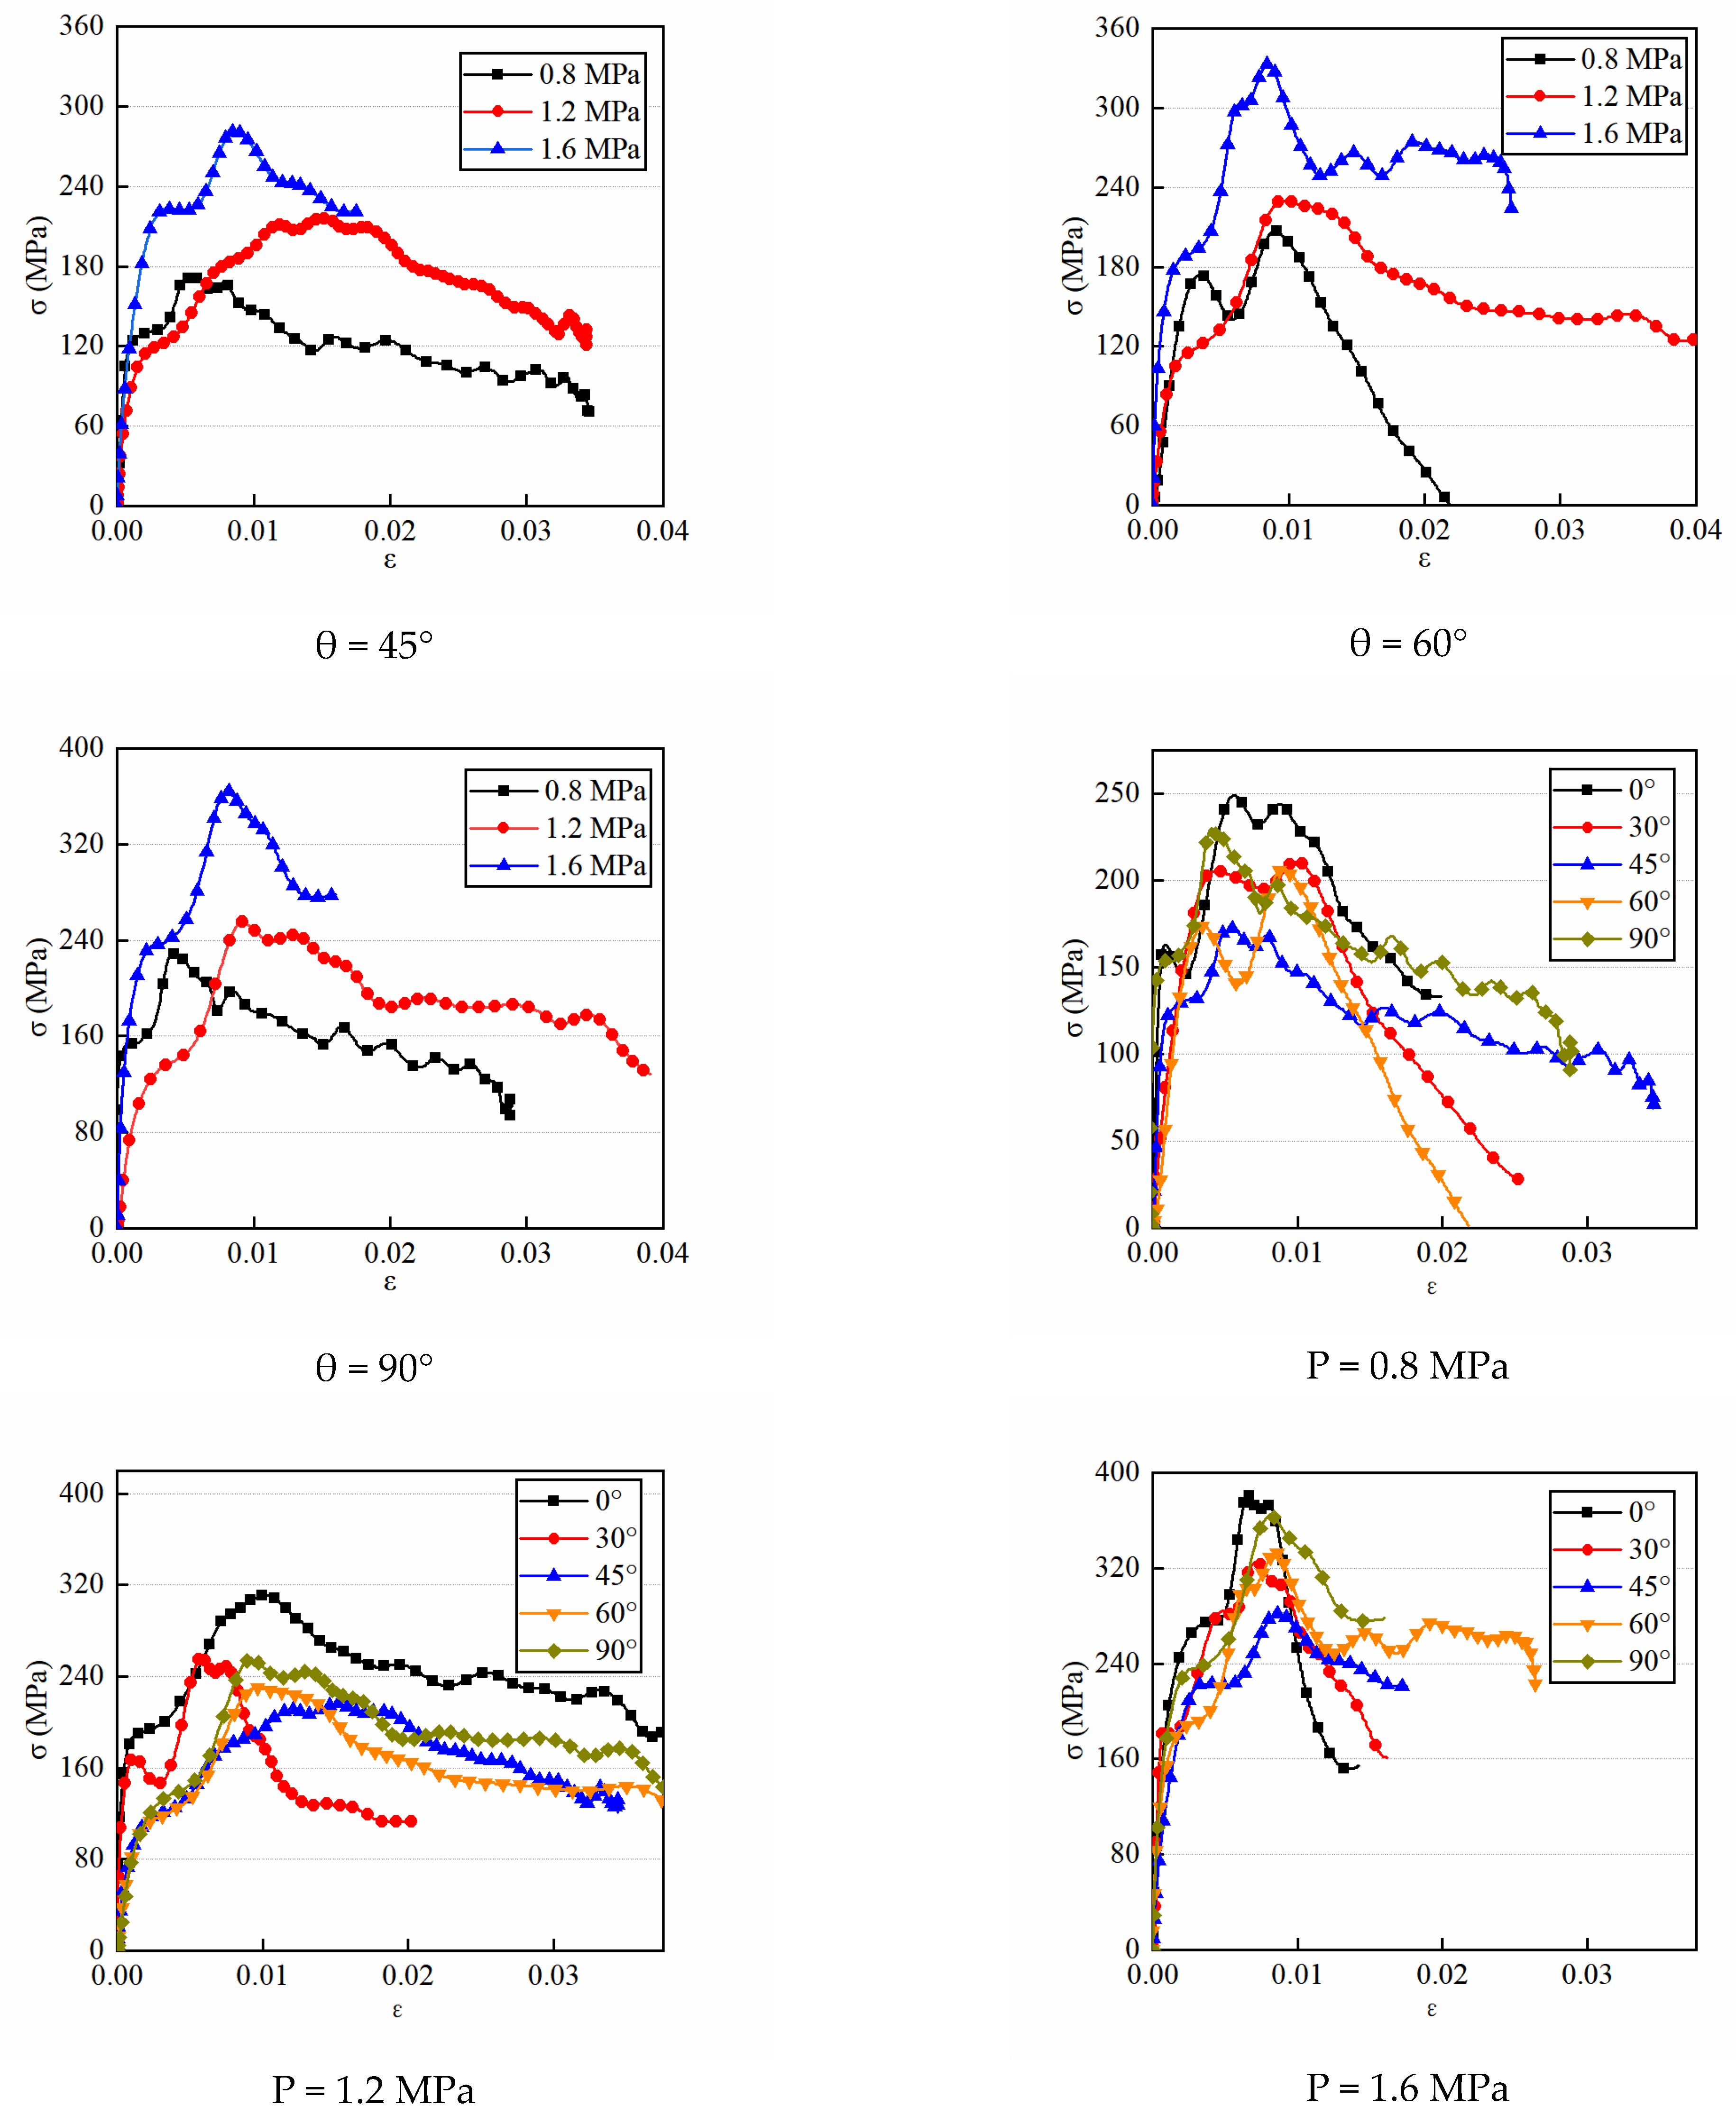
3.1. Stress–Strain Curve

Dynamic stress–strain curves present the strain and stress patterns throughout the process of rock impact deformation. Therefore, in Figure 4, the sandstone stress–strain curves were plotted for various bedding angles and impact pressures. As shown in the Figure, the curve showed no compaction stage. A stress–strain curve presents an elastic phase, a plastic phase, as well as a post-peak phase. The stress–strain curve of sandstone showed obvious ductile failure under three-dimensional dynamic loading. This failure might be due to the high initial hydrostatic pressure, which greatly enhanced the ductility of the sandstone. In addition, we can also note that bedding angle and impact pressure had a marked effect on the peak value of the sandstone stress–strain curve. With an enhancement in impact pressure, the peak value of the sandstone’s stress–strain curve also rose. It is not surprising to observe that bedding angle and impact pressure did not have a remarkable effect on the slope of the sandstone’s stress–strain curve. Additionally, the correlation between strain rate and impact pressure is illustrated in Figure 5, with a positive correlation between strain rate and impact pressure. Under the given loading conditions, the author selected experimental data with similar strain rates for analysis [36].

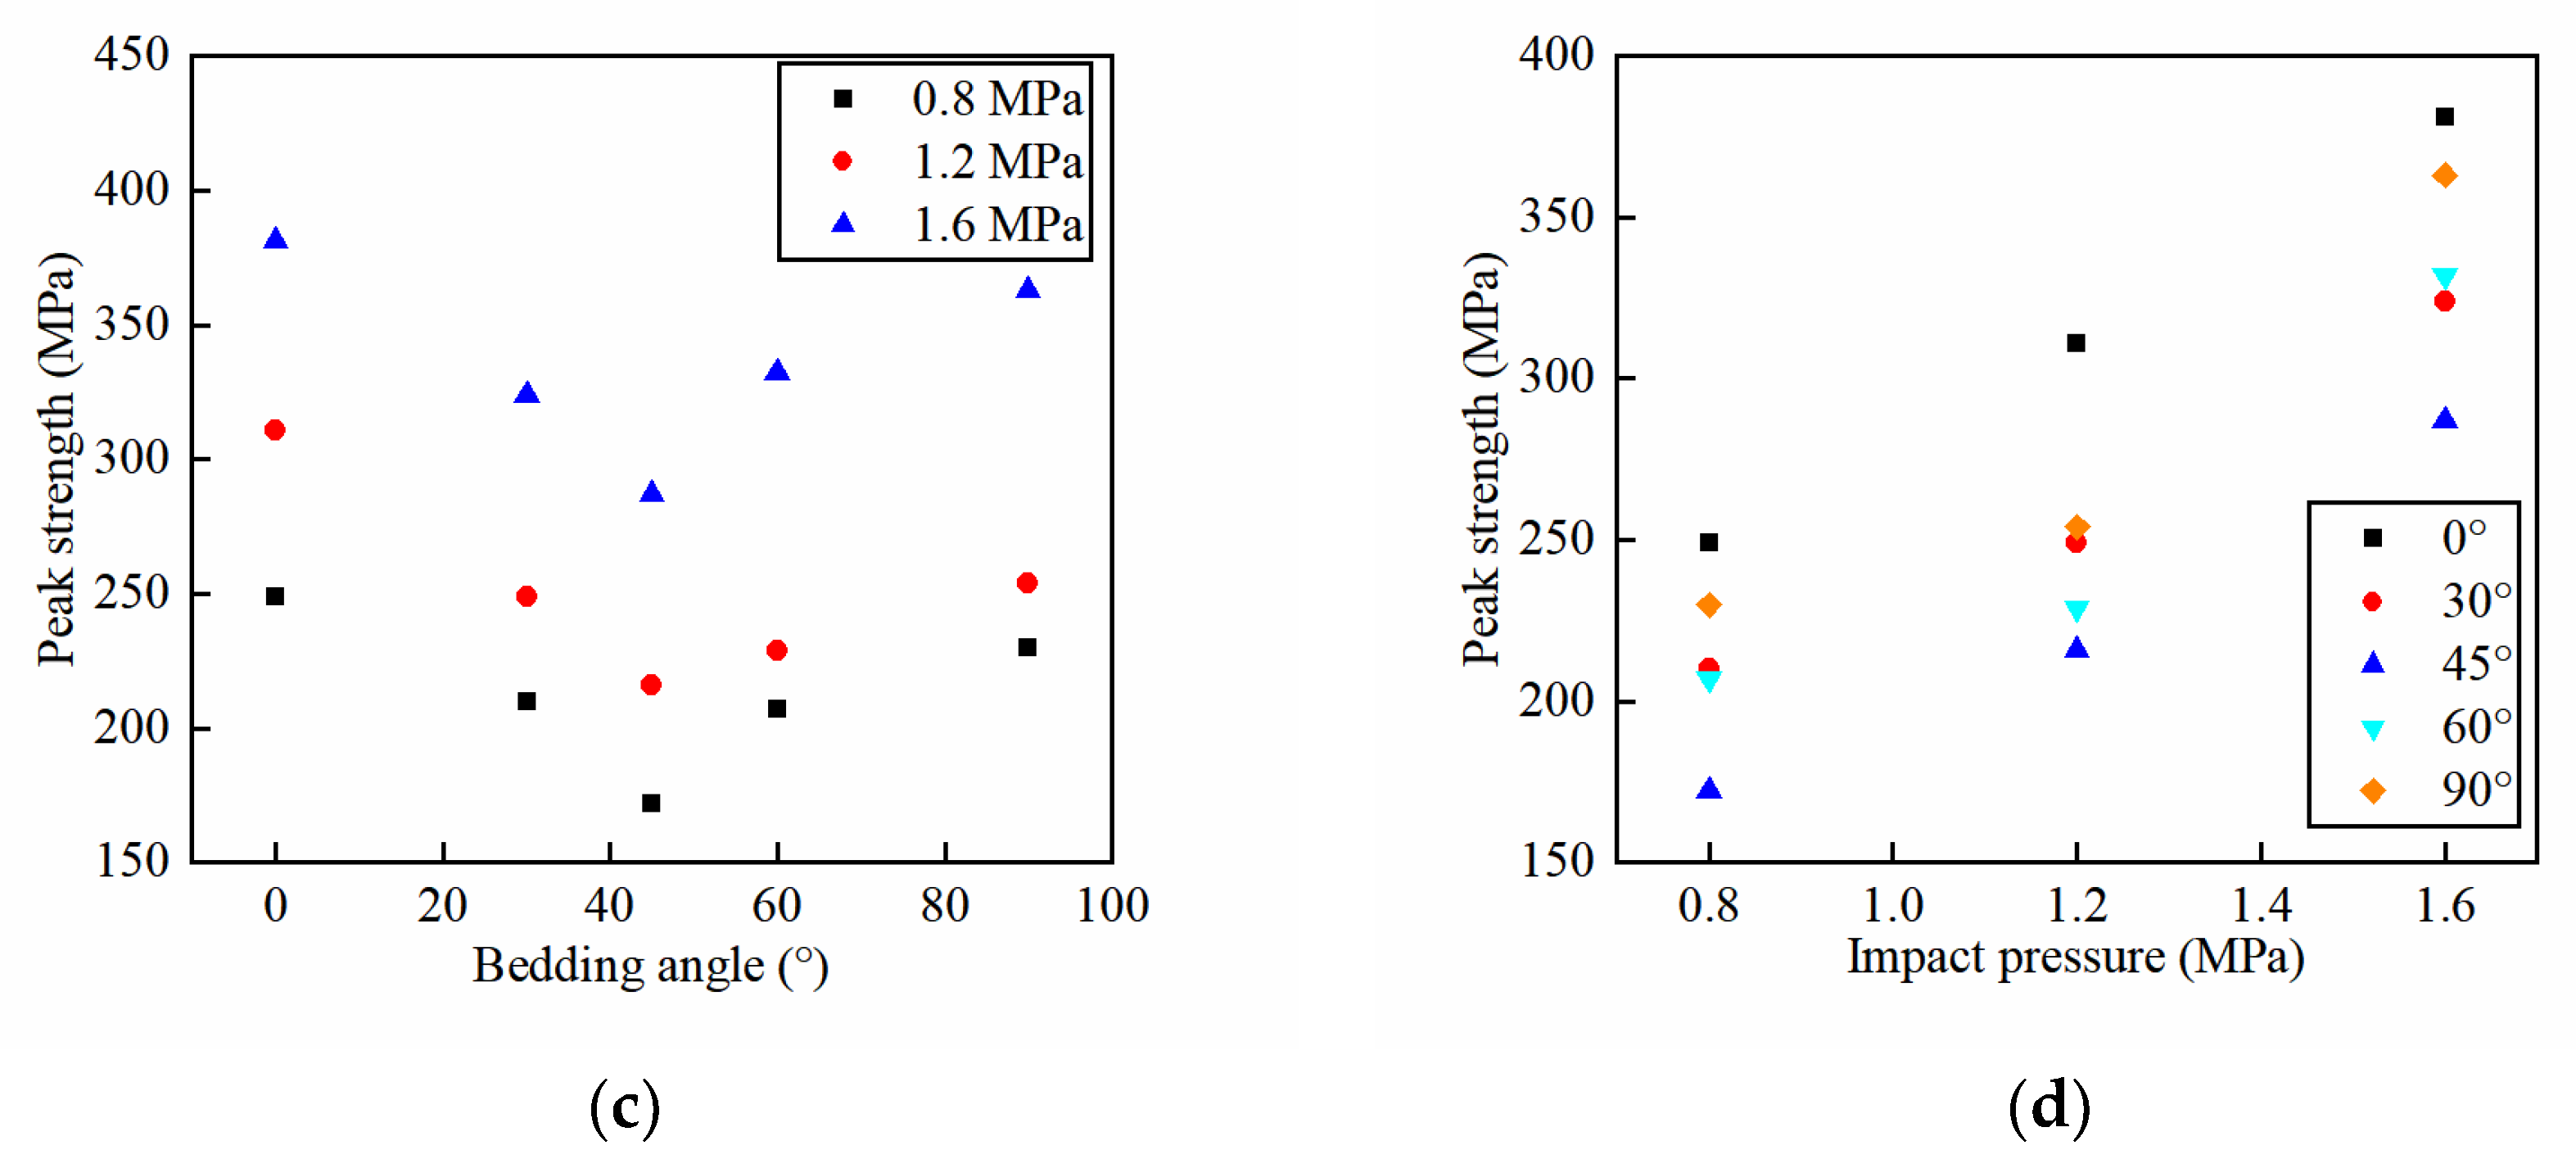
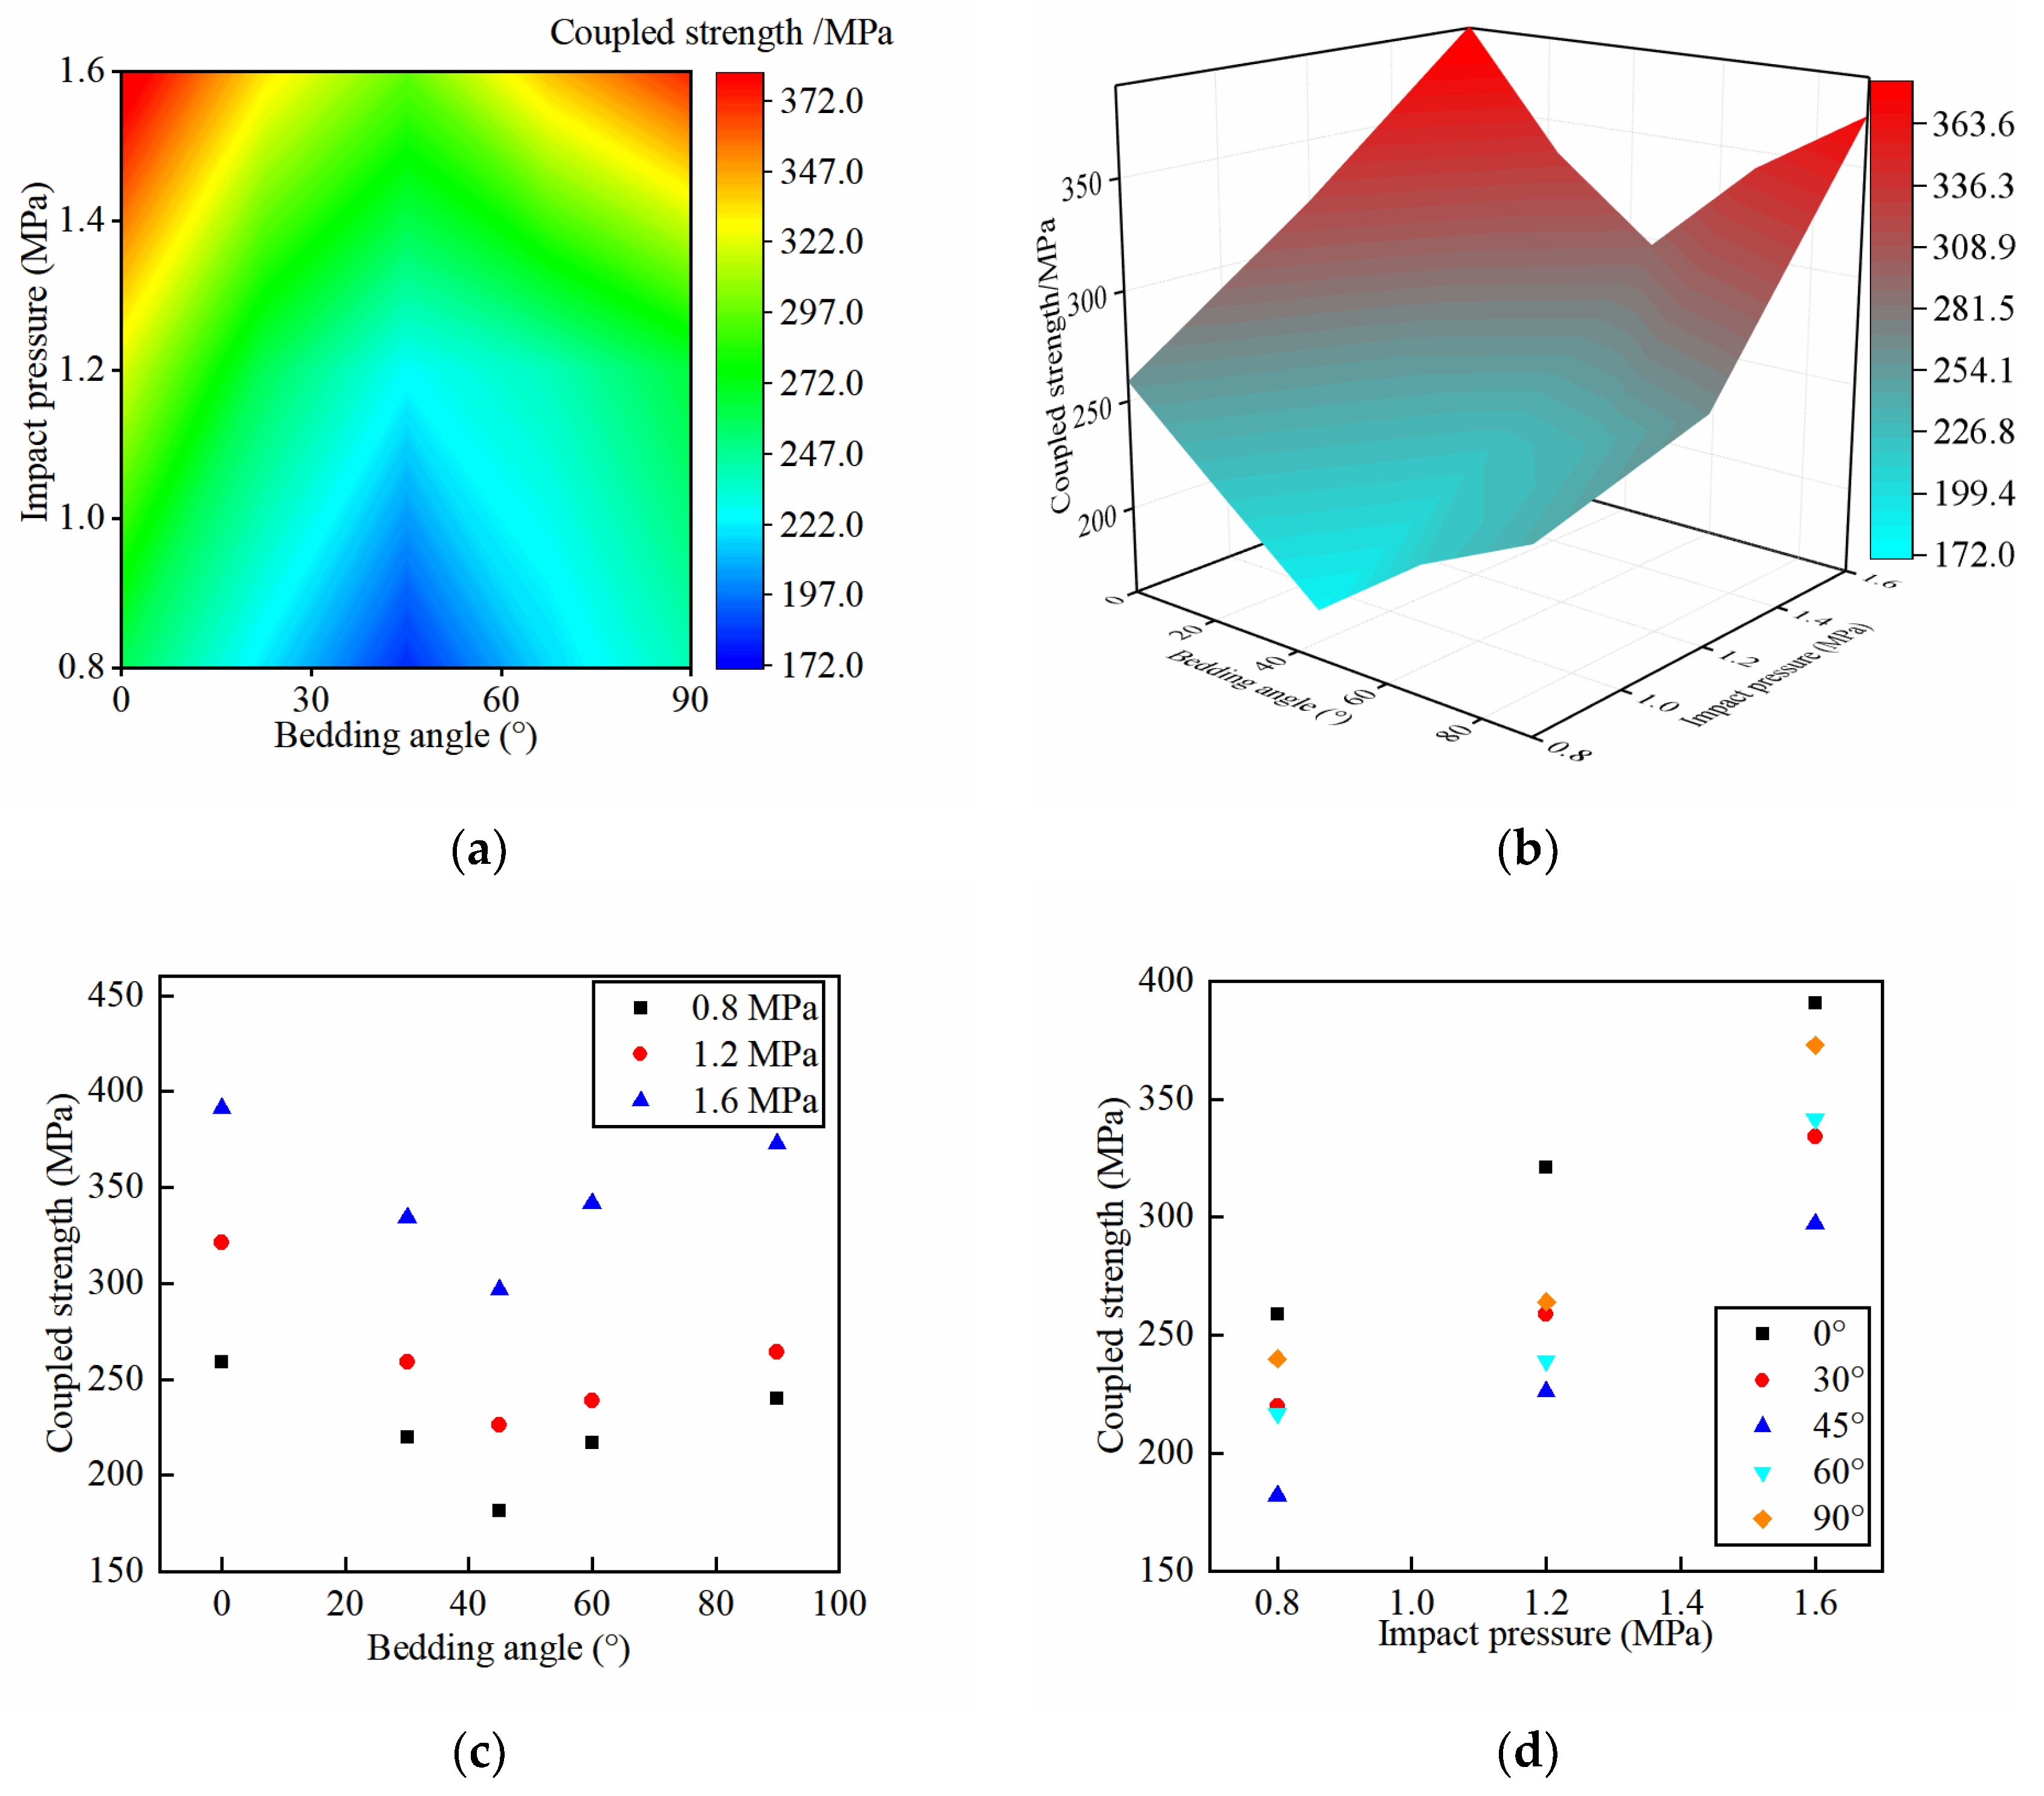
3.2. Strength Characteristics

During engineering construction, the intensity of the rock mass is very significant. It is thus essential to examine the peak strength and the coupling strength of sandstone under three-dimensional dynamic compression for engineering support. Figure 6 and Figure 7 show the peak strength, coupling strength scatter diagram, two-dimensional cloud diagram, and three-dimensional surface diagram of sandstone under various bedding angles and impact pressures. In this paper, the coupling strength is the sum of the peak strength of sandstone and the axial static load of rock. Figure 6 and Figure 7 show that there was a positive association between the coupling and peak strengths of sandstone and the impact pressure. For instance, see Table 1, when the impact pressure was 0.8 MPa, the coupling and peak strengths of 0° bedding sandstone were 249 MPa and 259 MPa, respectively. However, under an impact pressure of 1.6 MPa, the coupling and peak strengths of the 0° bedding sandstone were 381 and 391 MPa, respectively. As the bedding angle rose, the coupling and peak strengths of sandstone initially declined and later rose. In addition, with increasing impact pressure, the increase in the amplitude of the peak strength of the 0° stratified sandstone was larger than that of sandstone at other angles.
A rock strength under static loading is not the same as its strength under 3D dynamic compression. To compare the strength of rock under three-dimensional dynamic compression with that under static loading, a dynamic strength growth factor was considered to characterize the sandstone’s strength properties under 3D dynamic compression. Figure 8 shows the two-dimensional nephogram and three-dimensional surface diagram of the dynamic strength growth factor of sandstone. The figure shows that as the bedding angle increased, the dynamic strength growth factor of sandstone decreased first and then increased, which was basically consistent with its strength law. The sandstone’s dynamic growth factor progressively rose as the impact pressure augmented. This finding suggests that bedding angle and impact pressure had a marked effect on the sandstone’s dynamic strength growth factor under 3D dynamic compression conditions. In addition, to study the anisotropy of sandstone, the anisotropy coefficient was introduced in the current work. Figure 9 presents the anisotropy coefficient of sandstone under three-dimensional dynamic compression. The figure shows that the anisotropy coefficient of sandstone under 3D dynamic compression was quite different from that under uniaxial loading. This observation indicates that the loading mode significantly affects the anisotropy of sandstone. Therefore, in underground engineering, we should also consider that for the same bedding angle, the anisotropy is different when the loading mode is different. In addition, the Figure suggests that the impact pressure affects the anisotropy of sandstone less than the loading pattern. When the impact pressure increased, the anisotropy coefficient of sandstone was reduced progressively. This decrease shows that the anisotropy of rock decreased with an increasing dynamic load. This trend occurred because when the dynamic load was small, the fracture of sandstone generally expanded along the bedding, weak plane, microstructure, etc., but when the dynamic load was large, the fracture of sandstone generally did not expand along the bedding, weak plane, microstructure, etc. Therefore, when the impact pressure increased, the anisotropy coefficient of sandstone decreased gradually.

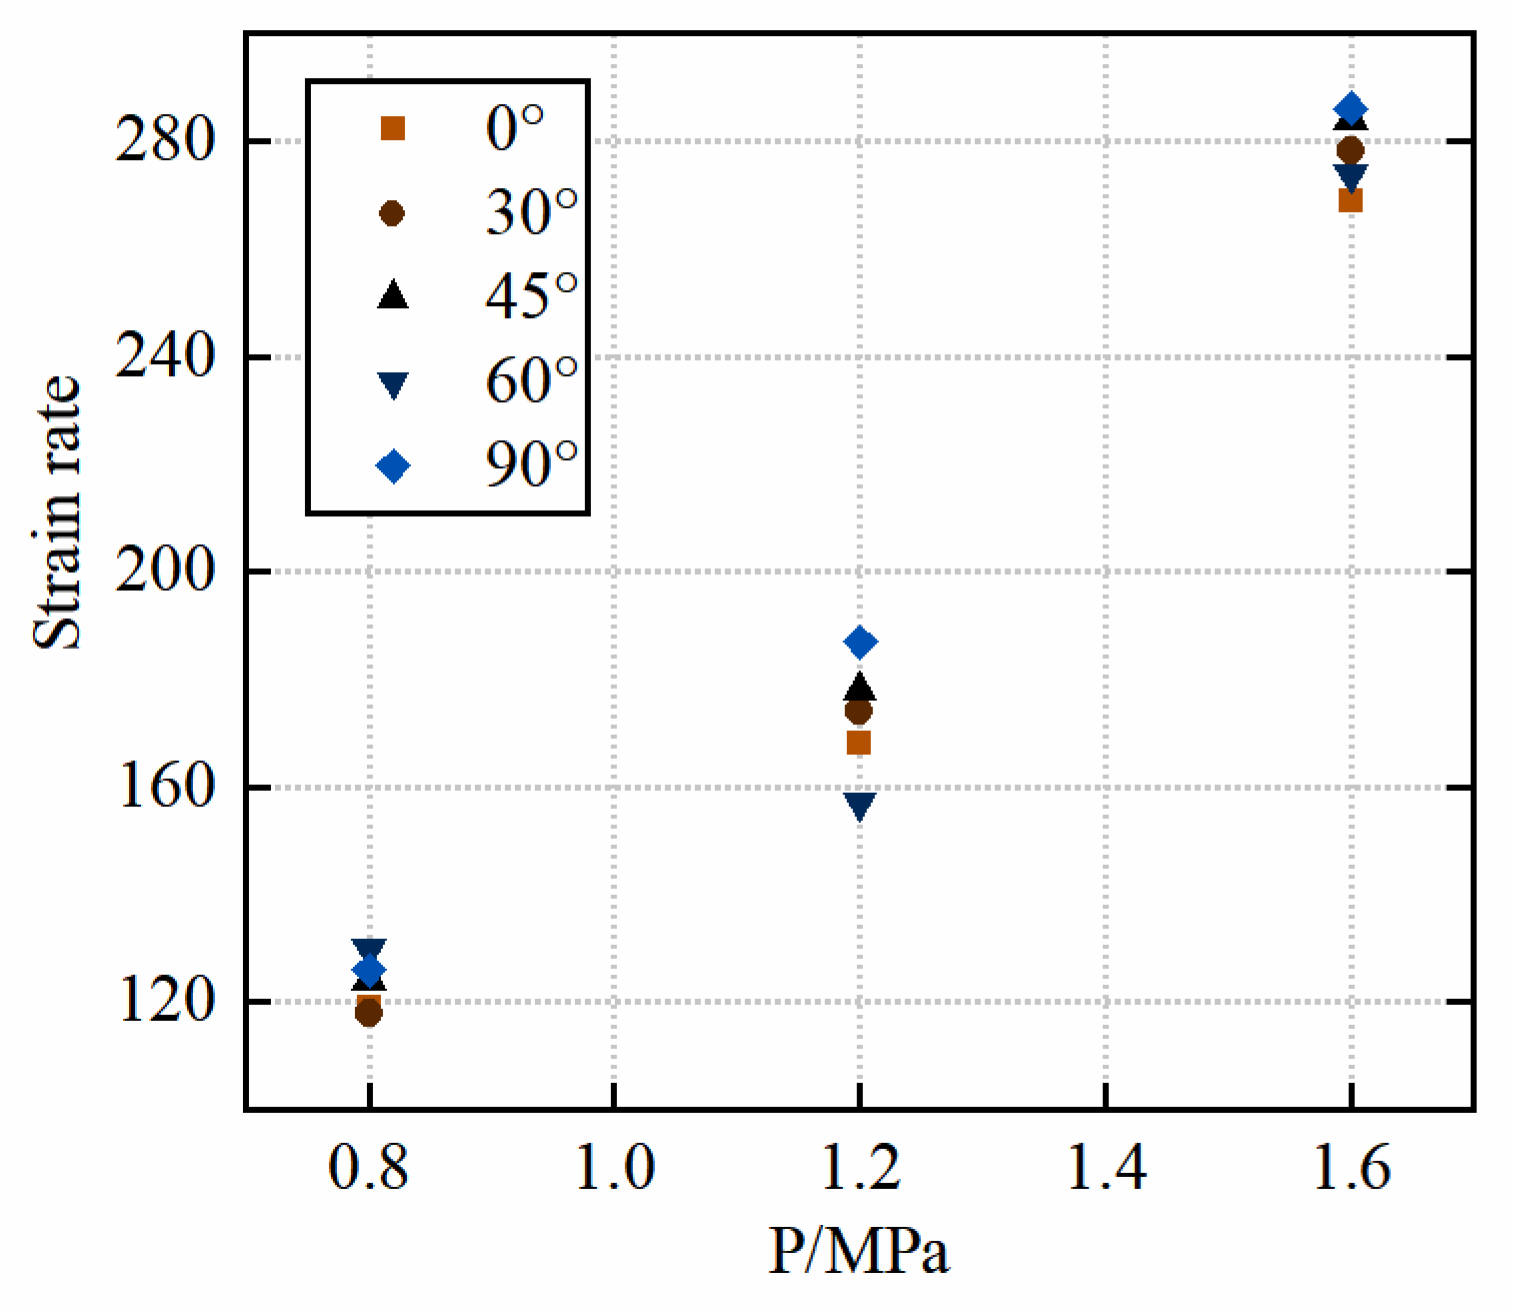
3.3. Deformation Characteristics

Figure 10 shows the peak strain scatter diagram, two-dimensional cloud map, and three-dimensional curve diagram of sandstone. As shown in the Figure, there is no obvious rule of peak strain with an increasing bedding angle. In addition, see Table 2, with the increasing impact pressure, the peak strain basically showed a gradual increase. This may be due to the fact that the strength of sandstone grew as the impact pressure increased, and a larger strain was required to cause rock failure. Therefore, the impact pressure is positively correlated with the peak strain. This correlation shows that in deep underground engineering, when the rock is subjected to a large dynamic load, rock failure will inevitably produce large deformations. Therefore, the dynamic load should be considered when performing deep underground engineering.

3.4. Failure Characteristics

The study of failure modes and damage mechanisms in sandstones under three-dimensional dynamic compression has an important theoretical significance. To compare and analyze the sandstone’s failure modes under diverse dynamic loads and different bedding angles, the authors collected and took photos of the tested sandstone, as shown in Table 3. As shown in Table 3, the bedding angle and dynamic load had an evident effect on the failure mode of the laminated sandstone. Sandstones with bedding angles of 0°, 30°, 45°, 60°, and 90° were almost not destroyed under an impact pressure of 0.8 MPa. Sandstone with 0° and 45° bedding angles exhibiter bedding failure, and the 30°, 60°, 90° bedding angle sandstone exhibited pulverized failure under an impact pressure of 1.2 MPa. Sandstone with bedding angles of 0°, 30°, 45°, 60°, and 90° exhibited pulverized failure under an impact pressure of 1.6 MPa.
In addition, it is obvious that the sandstone at 0° and 45° bedding angles showed failure along the bedding planes under an impact pressure of 1.2 MPa, while the failure fragments of 30°, 60°, and 90° bedding angle sandstone were of a typical circular table type. Under an impact pressure of 1.6 MPa, sandstone with bedding angles of 0°, 30°, 45°, and 60° presented typical circular table fragments. Among sandstone samples with different angles, the sandstone with a 90° bedding angle was characterized by obvious round-table fragments due to its greater degree of fragmentation. To reveal the failure mechanism, as shown in Figure 11, a force analysis of sandstone under a three-dimensional dynamic load was performed. As shown in the Figure, the sandstone was subjected to a combined static and dynamic load in axial direction and a confining pressure in radial direction. Because the axial static load and dynamic load were far greater than the confining pressure, an oblique shear force formed inside the sandstone; because of the oblique shear force inside the sandstone, the interior of the rock formed an oblique fracture plane. In addition, when the bedding sandstone was subjected to both dynamic and static loads, the rigidity of the confining pressure chamber was much higher as compared to the strength of the rock, and the sandstone near confining pressure chamber was much more fragmented than that away from the confining pressure chamber. Consequently, the fragmentation of sandstone under 3D dynamic compression led to the formation of circular-table fragments.
As shown in Figure 12, fragments of the sample under triaxial dynamic compression were gathered and then screened, and the distribution of the particle size was mapped. In addition, since the rock was not damaged under an impact pressure of 0.8 MPa, this paper only addressed the fractals of rock fragments under the impact pressures of 1.2 and 1.6 MPa. The Figure indicates that the impact pressure showed an inverse relationship with the average particle size of sandstone. Moreover, the higher the impact pressure, the more the particle size distribution curve tended to bend upward.

3.5. Energy Evolution

The conversion of energy is necessary to bring about any change in the state of an object, including the transformation of intact rock into broken pieces. Hence, an in-depth investigation of the energy conversion mechanism of sandstone in triaxial dynamic compression test is essential. In this work, the sandstone energy evolution curves were plotted for various bedding angles and dynamic loads. Notably, the energy that was absorbed by the sandstone at the static load stage was not easy to calculate; therefore, this paper only considered the energy value of sandstone during the combined static and dynamic load phase. The energy was determined through the use of the following formula:
W i = A b ρ c b σ i σ p r e 2 d t W t = A b ρ c b σ t σ p r e d t W r = A b ρ c b σ r 2 d t
Δ W = W i W r W t
W v = Δ W V
ξ = Δ W W i
where W t , W i , W r , σ i , σ t , σ r , and σ p r e represent the transmitted, incident, and reflected energy, the incident, transmitted, and reflected stress, and the prestress of sandstone, respectively.
Figure 13 is a schematic diagram of each energy proportion of sandstone. It shows that the reflected energy of sandstone increased gradually with an increasing impact pressure. It is worth noting that under an impact pressure of 0.8 MPa, the transmission energy of sandstone was significantly larger than that of sandstone under other impact pressures. This occurred because, under an impact pressure of 0.8 MPa, the sandstone was not disrupted owing to the low impact pressure and the low energy carried by dynamic load shock waves, and the undamaged sandstone was more likely to propagate the dynamic load shock wave. Therefore, under an impact pressure of 0.8 MPa, the transmission energy of sandstone was significantly larger than that of sandstone under other impact pressures. In addition, under an impact pressure of 0.8 MPa, the absorption energy of sandstone was significantly smaller than that of sandstone with other impact pressures. Figure 14a–c presents the energy evolution trend for sandstone. As can be seen in the Figure, the energy evolution of sandstones at various impact pressures followed a similar trend, with marked differences in the final sandstone energy values.
Figure 14d,e shows the energy utilization ratio diagram of sandstone. It shows that the energy utilization rate of undamaged rock was significantly lower than that of damaged rock. This rate difference was observed because most of the energy in undamaged rocks was transmitted, while most of the energy in damaged rocks was used for the expansion and penetration of new cracks. Figure 14f shows a schematic representation of the density of absorbed energy in sandstone. In the Figure, we can observe that the density of absorbed energy in sandstone increased linearly with an increasing impact pressure. This occurred because, as the impact pressure augmented, the sandstone breakage progressively increased, and rock breakage absorbs a large amount of energy.

3.6. Constitutive Model

A constitutive model represents the real property of materials. In the field of dynamics, a constitutive model primarily addresses the strength of rocks under an impact dynamic load and the propagation pattern of dynamic waves in rocks. In the traditional constitutive model, the value of the damage variable D is calculated for the most part by the means of stress. However, the damage fracture of rock is not only affected by stress but also determined by strain. Furthermore, a damage constitutive model determined based on stress cannot adequately describe the three-dimensional rock damage constitutive relationship, and most of the established dynamic constitutive models employ the strain rate as the independent variable. The impact pressure is also the commonly used characterization parameter for measuring the impact dynamic load. However, no dynamic constitutive model based on the impact pressure as the independent variable has been established. Therefore, based on the above test data, this paper proposes a dynamic constitutive model on the basis of impact pressure as the independent variable and strain as the damage factor. The concrete application of this model in engineering is based on the fact that as long as the impact pressure or strain rate, strain state, and constitutive model parameters are determined, the strength of rock can be calculated.
Triaxial dynamic stress–strain curves for sandstone show obvious elastic–plastic–ductility characteristics. The ZWT model improved the viscoelastic constitutive equation and established the dynamic damage constitutive equation. In addition, to describe the dynamic characteristics of materials more accurately, as shown in Figure 15, the ZWT model introduced a nonlinear spring and established the dynamic damage constitutive equation. This equation is as follows:
σ = E 0 ε + α ε 2 + β ε 3 + E 1 0 t ε ˙ exp t - τ φ 1 d τ + E 2 0 t ε ˙ exp t - τ φ 2 d τ
where E 0 , α , and β are elastic parameters, E 1 and φ 1 are elastic parameters at low strain rates, and E 2 and φ 2 are elastic parameters at high strain rates. During impact, rock failure has both a damage effect and an impact pressure effect. First, during the combined static and dynamic loading test, the load duration is much less than the low-frequency Maxwell time. Therefore, the modified ZWT dynamic damage constitutive model deletes the low-frequency Maxwell elements [37,38], as shown below:
σ = E 0 ε + α ε 2 + β ε 3 + E 2 0 t ε ˙ exp t - τ φ 2 d τ
Second, rock failure is a damage process; so the damage factor D is introduced into the ZWT dynamic damage constitutive model. When the damage factor D considers strain as the variable, the equation is as follows:
σ = 1 D E 0 ε + α ε 2 + β ε 3 + E 2 0 t ε ˙ exp t - τ φ 2 d τ
D = 1 exp ε ε f n
σ = exp ε ε f n E 0 ε + α ε 2 + β ε 3 + E 2 0 t ε ˙ exp t - τ φ 2 d τ
The association between the impact pressure and the strain rate is as follows:
ε ˙ = a P + b
A model of sandstone damage under 3D dynamic compression is as follows:
σ = exp ε ε f n E 0 ε + α ε 2 + β ε 3 + E 2 0 t a P + b exp t - τ φ 2 d τ

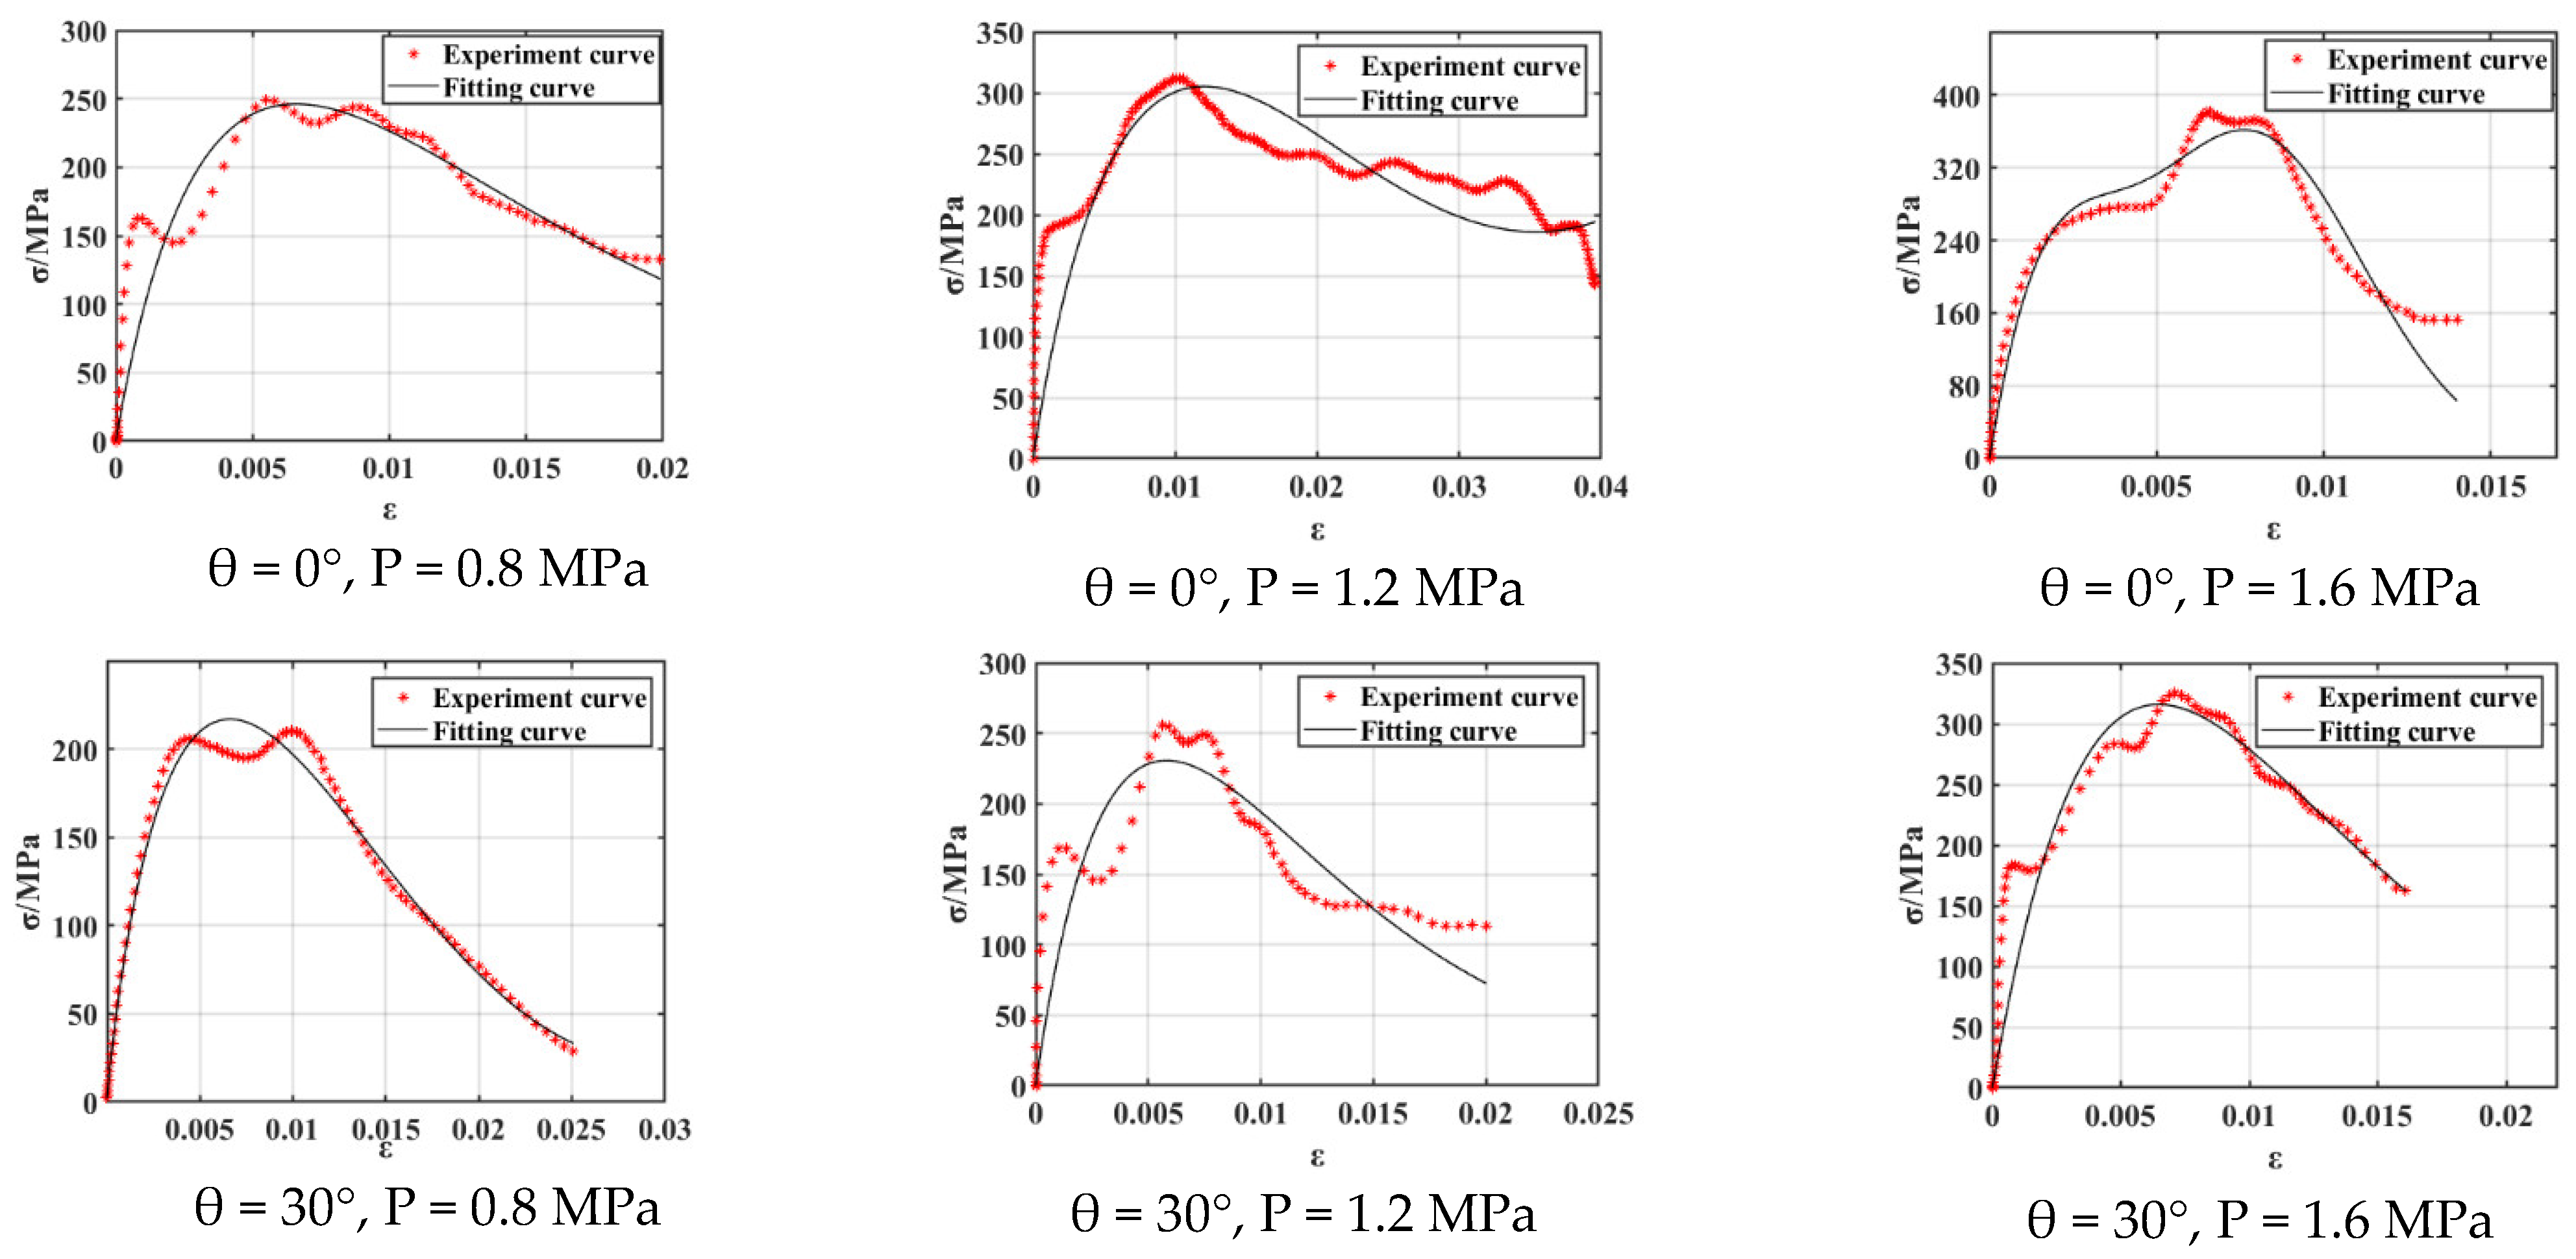
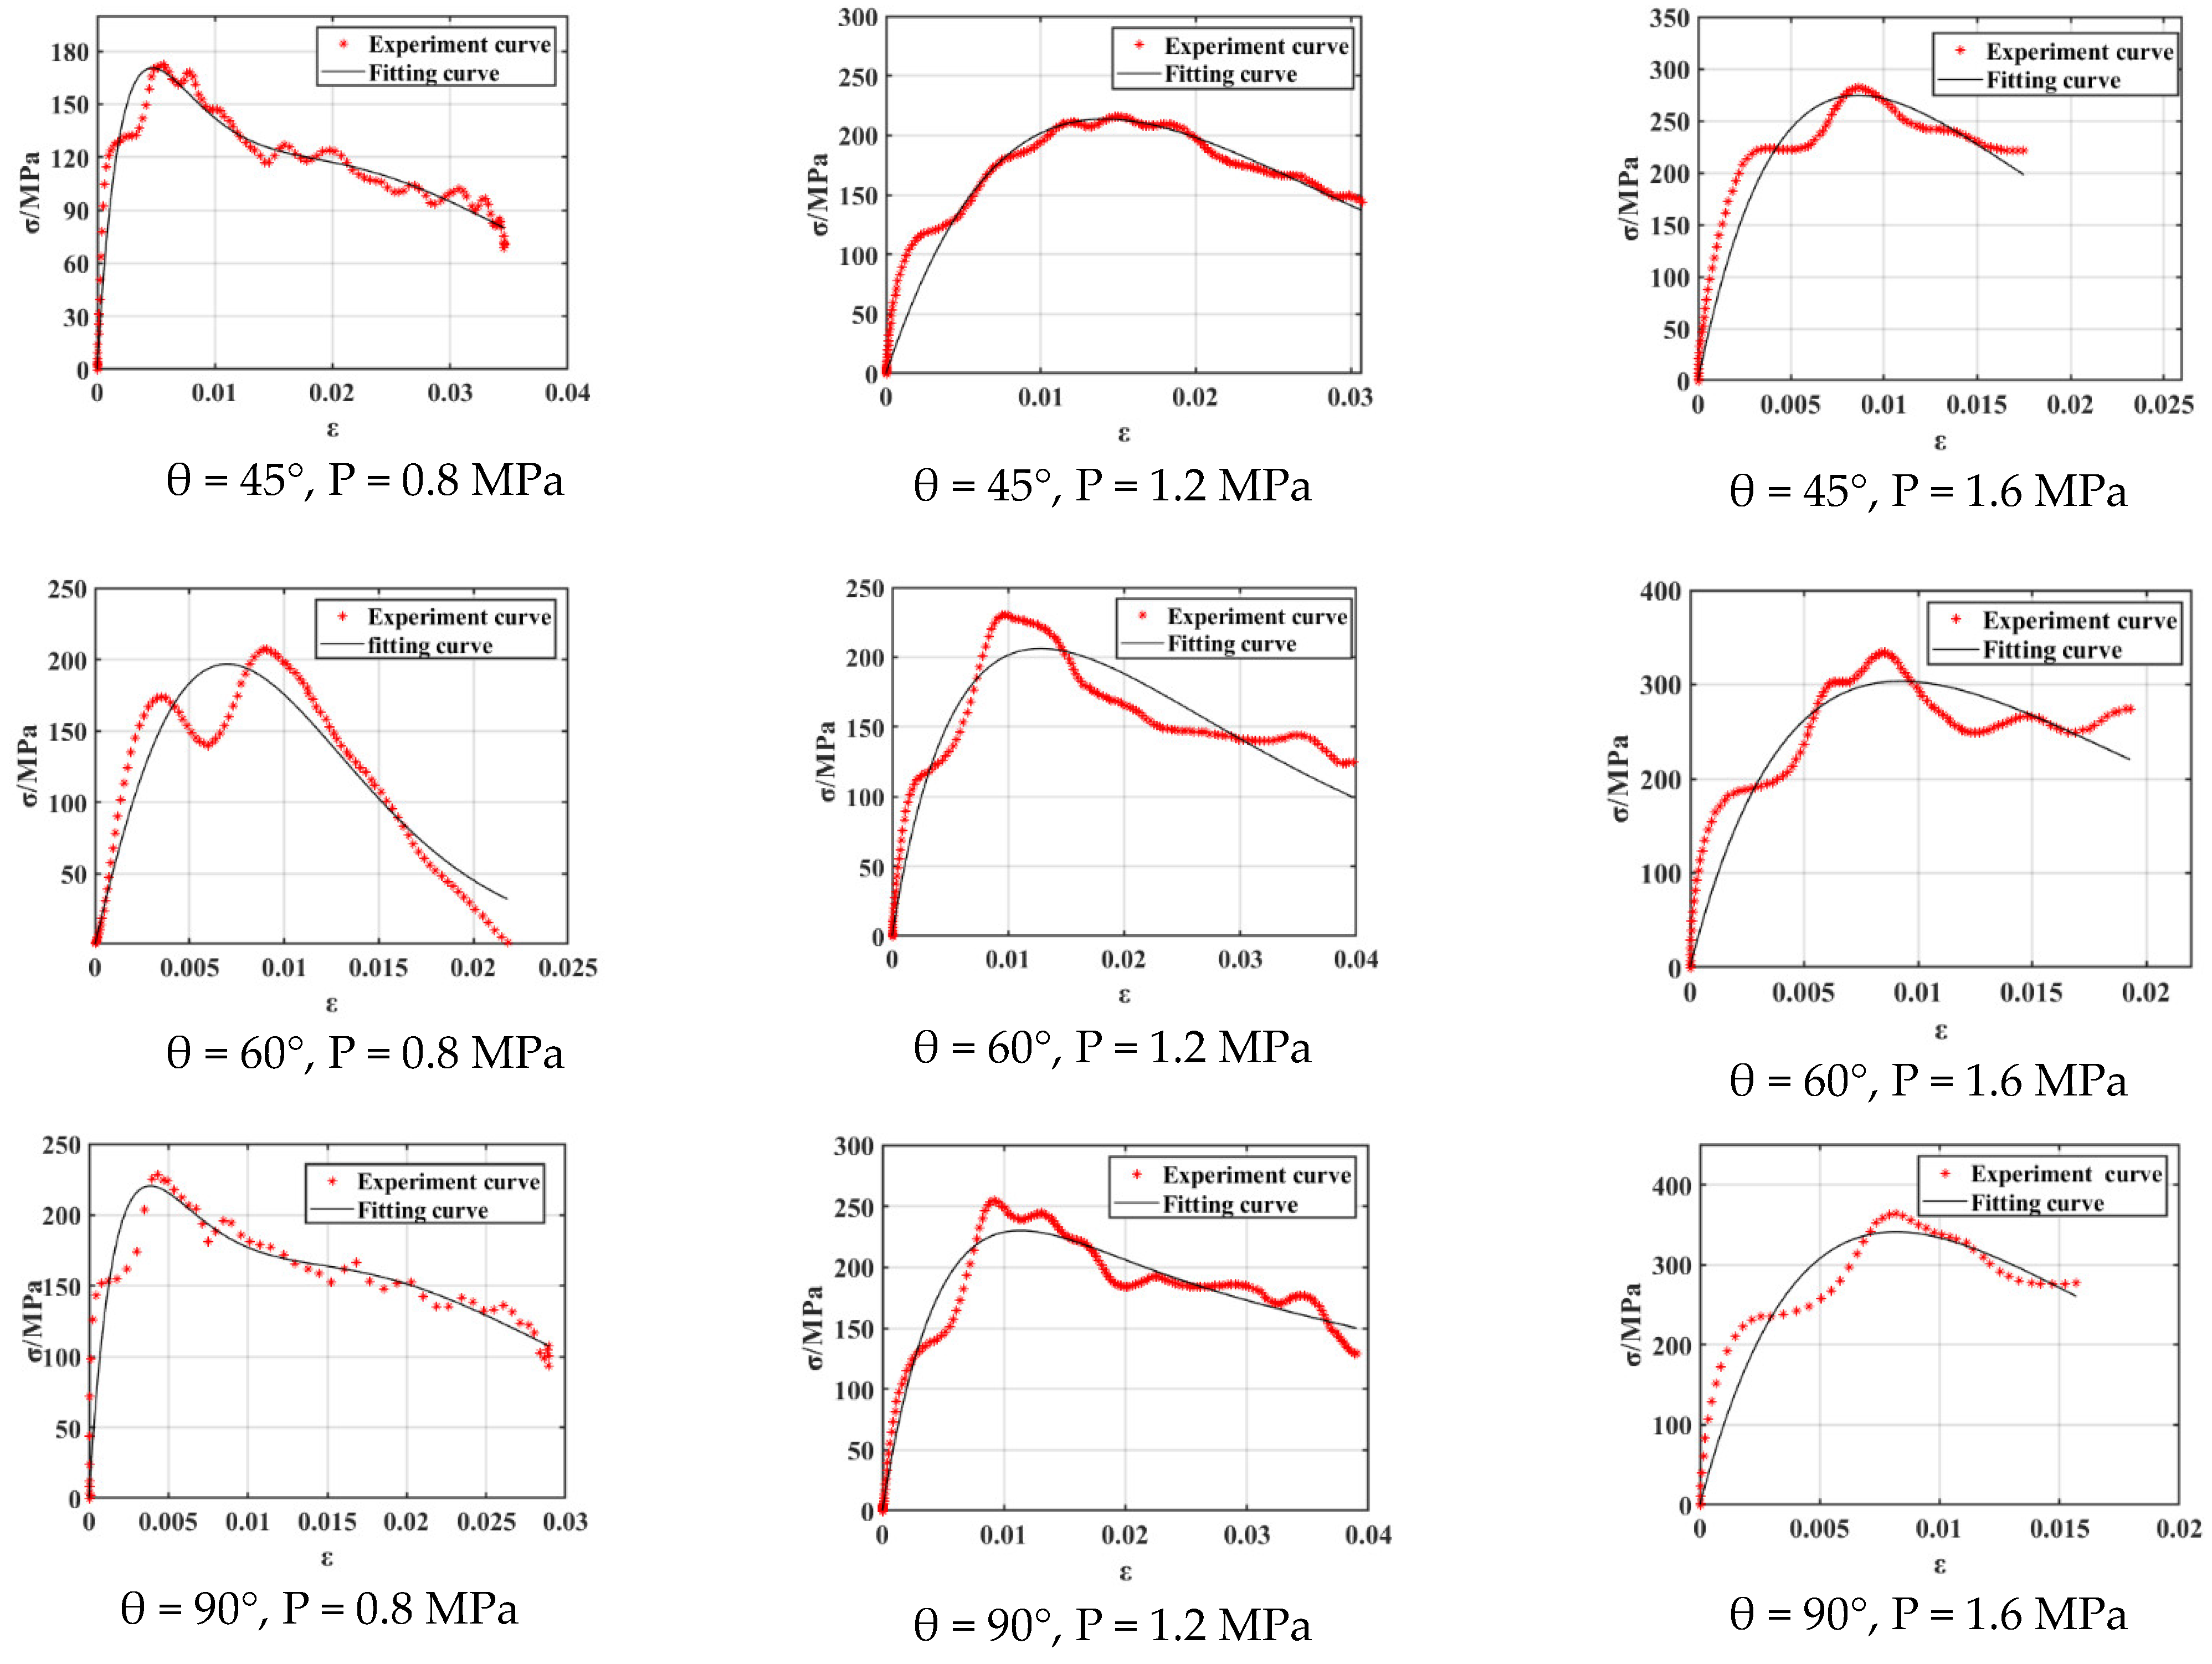
3.7. Model Verification

The verification of the constitutive model was essential for assessing its soundness. Therefore, the constitutive model was validated against the test curves obtained from the above tests and the established constitutive model. Table 4 shows the model parameters of different samples as obtained by calculation. Table 4 displays that, as the impact pressure rose, the value of E2 gradually increased. This finding demonstrated that the strain rate rose with an enhancement of the impact pressure, and the rate-related elastic parameter E2 increased accordingly. Figure 16 presents the theoretical curve of the constitutive model and the sample’s stress–strain curve. The Figure shows that the two curves almost coincide, which indicates that the constitutive model established by the authors is reasonable. It is worth mentioning that some scholars conducted 3D modeling of materials based on the XCT test, which well characterizes the mechanical behavior of materials [39,40]. At the same time, pores and fissures in a rock significantly affect its mechanical behavior. In a future study, the constitutive model should consider these factors and carry out an in-depth study. In addition, relatively few rock samples were used in this paper; so, the authors believe that 3D XCT tests can be carried out in future research [41], rock modeling can be carried out, and a large number of numerical analyses can be performed. It will be more reasonable to verify the rationality of the constitutive model by using more numerical rock samples.

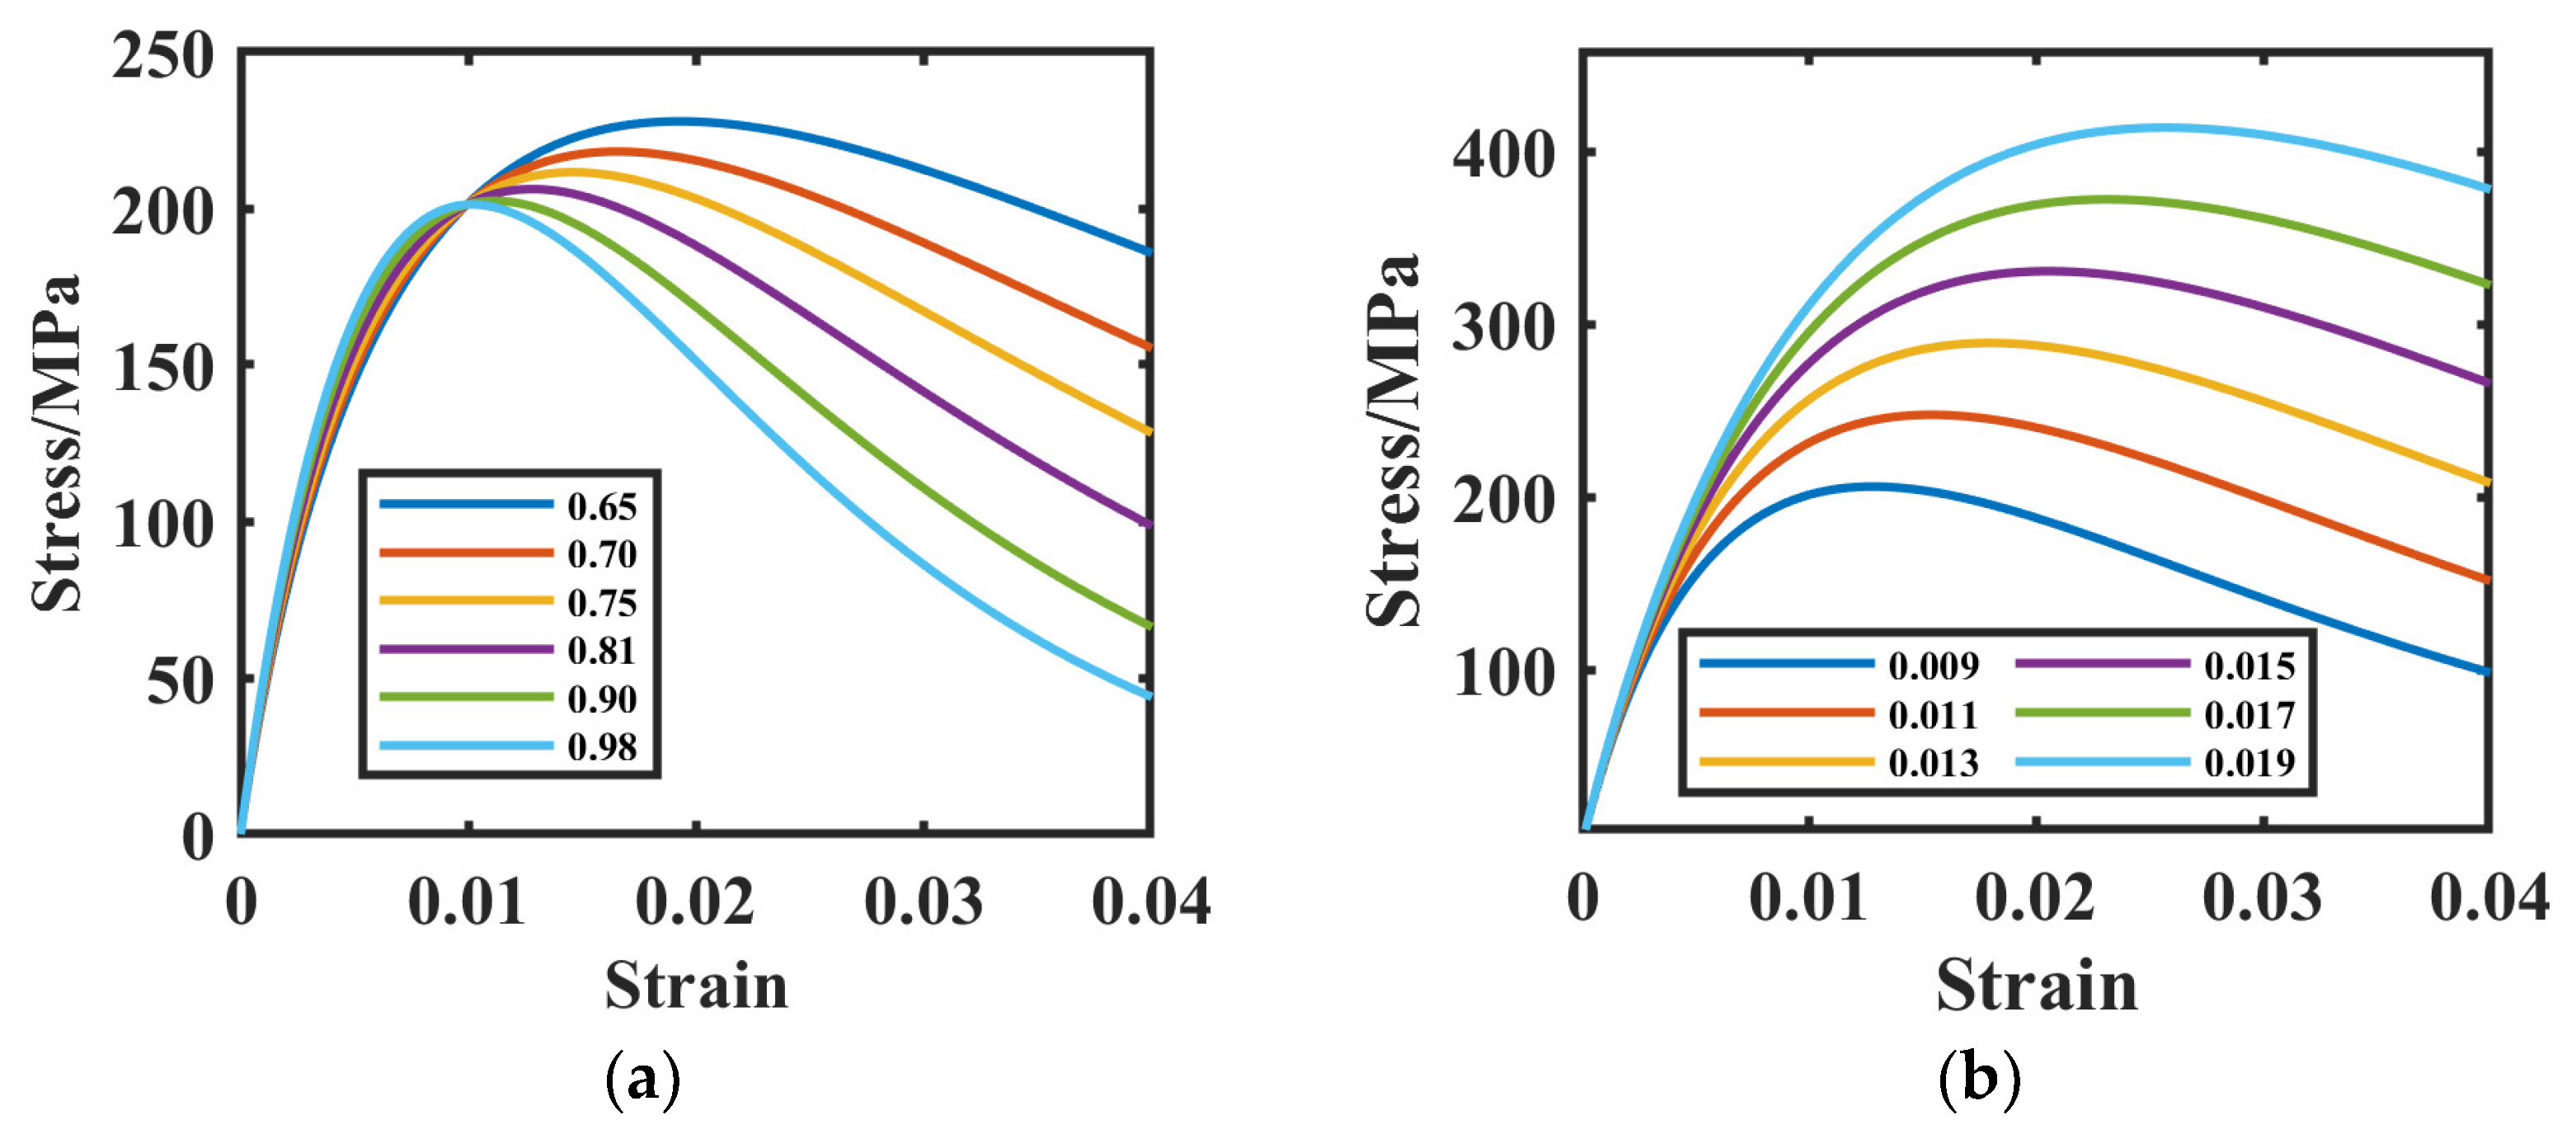
3.8. Influence of the Constitutive Parameters on Rock Mechanical Behavior

In this section, the influence of the damage parameters n and εf on rock mechanical behavior is addressed. A sandstone constitutive model with an impact pressure of 1.2 MPa and a bedding angle of 60° was selected for the analysis, for which the constitutive parameters were determined, as shown above. As shown in Figure 17, the damage parameters n and εf significantly affected the mechanical behavior of the rock. The parameter n primarily affected the post-peak plastic behavior of sandstone. If the parameter n changed from 0.65 to 0.98, the deformation rate of sandstone after the peak increased gradually. The parameter εf primarily affected the peak and post-peak mechanical behavior of sandstone. When the parameter εf changed from 0.009 to 0.019, the peak value of the sandstone increased from 200 MPa to 400 MPa. This increase indicates that the damage and deterioration of the rock primarily affected the peak and post-peak plastic behavior of the rock. From an engineering point of view, in engineering support, we should consider the damage and the deterioration of the rock’s internal structure. When there is a high degree of internal damage in the rock, the peak strength and post-peak bearing capacity of the rock rapidly decrease. Therefore, we should strengthen the support for engineering rock with a large degree of damage.

4. Conclusions

(1)
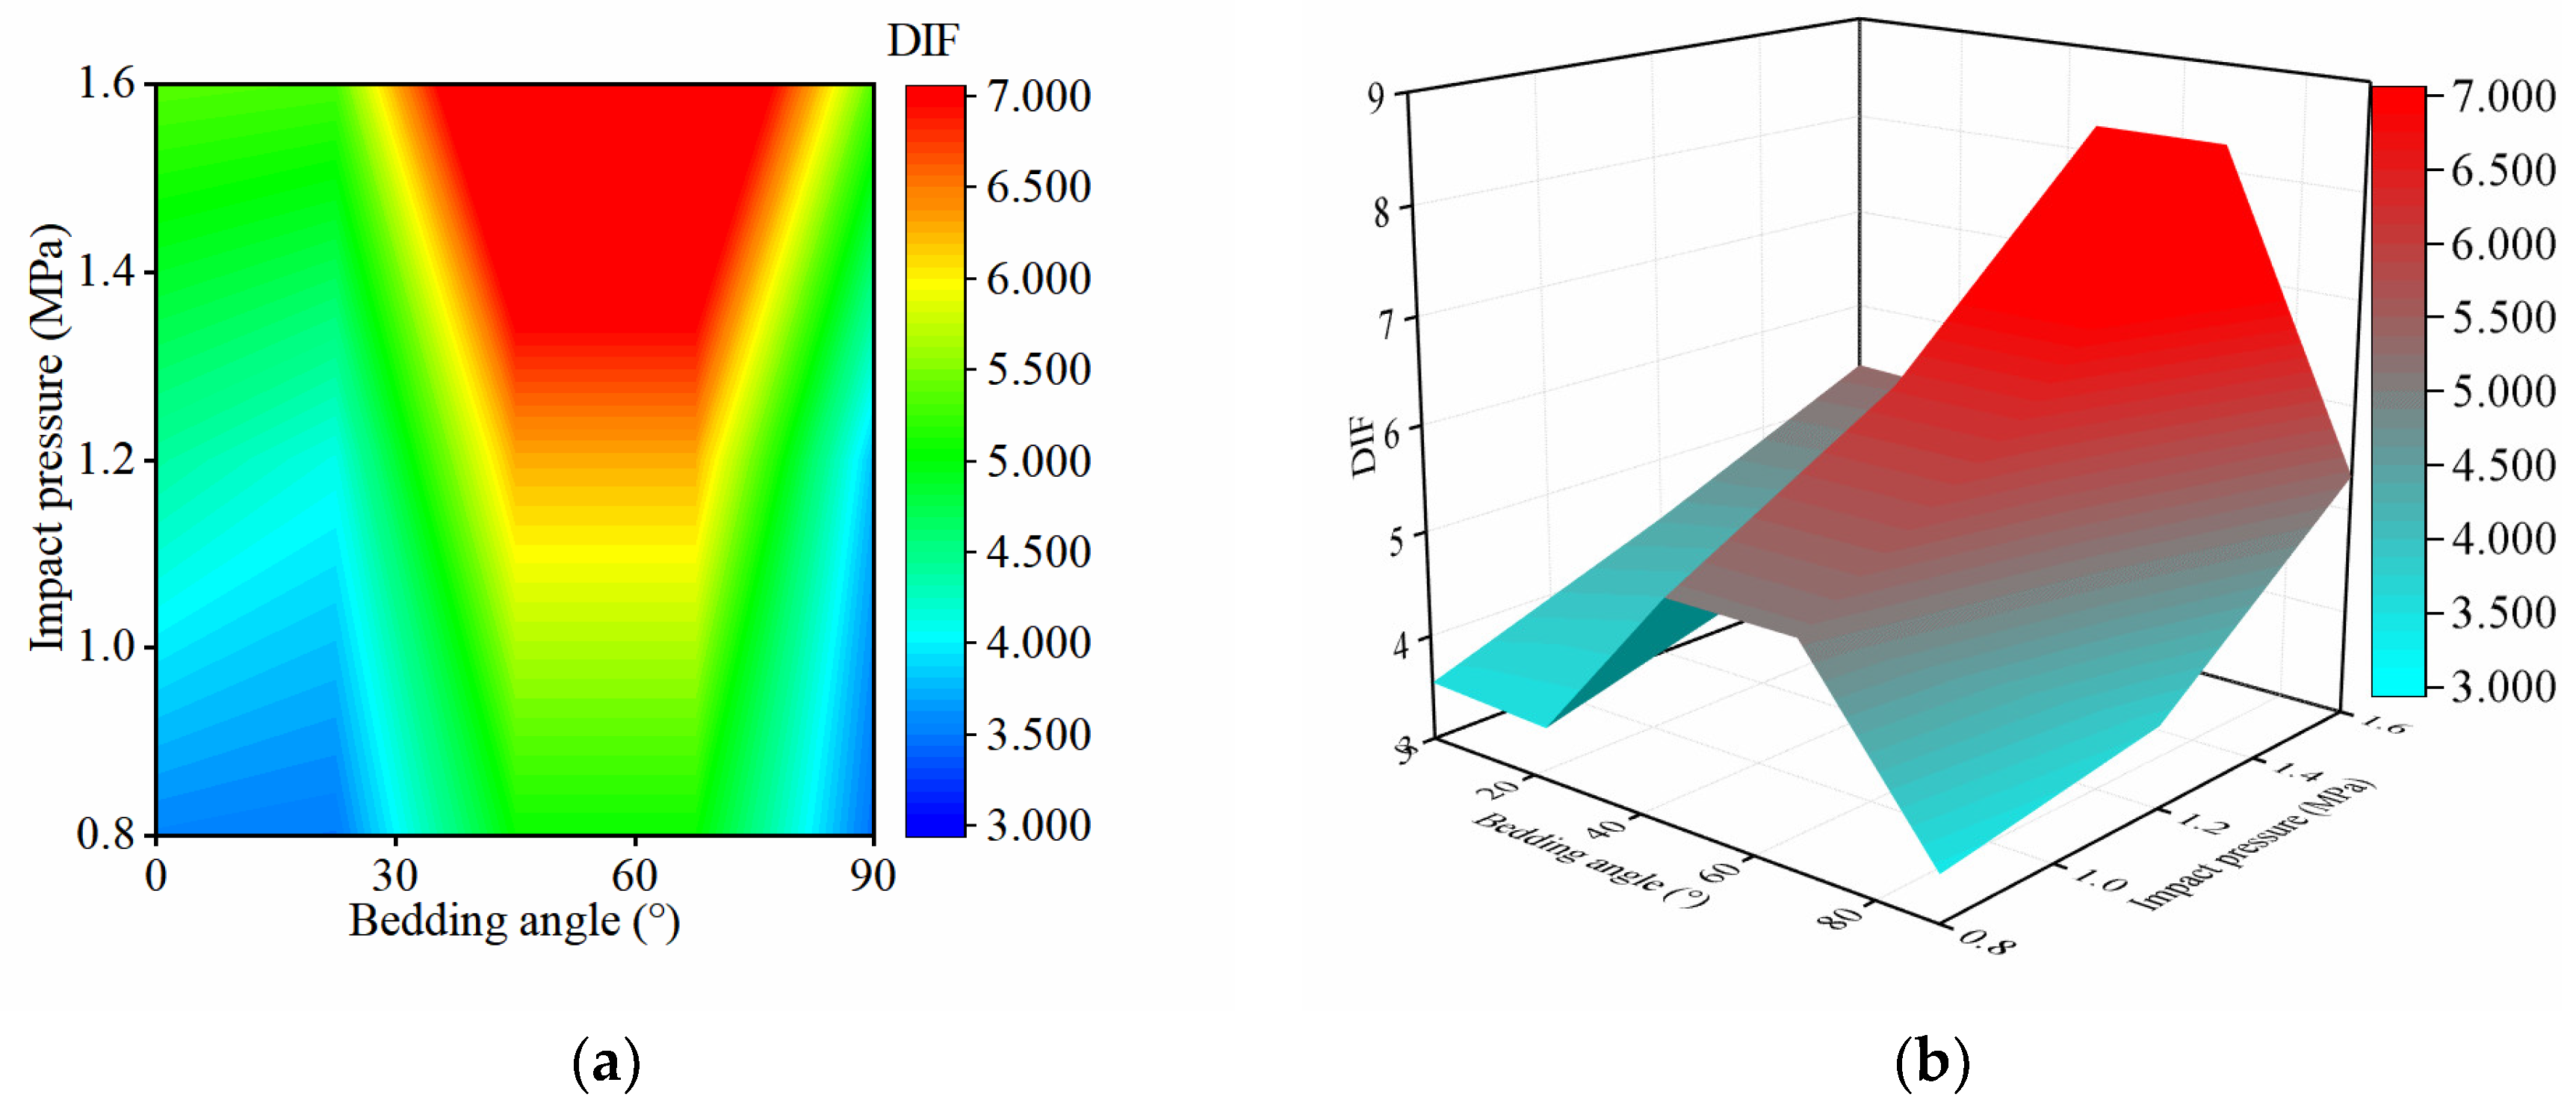
A high initial static load greatly enhanced the ductility of sandstone. With the increasing bedding angle, the coupling and dynamic strengths of sandstone first decreased and later rose. As the bedding angle rose, the sandstone’s dynamic strength growth factor first was reduced and later rose.
(2)
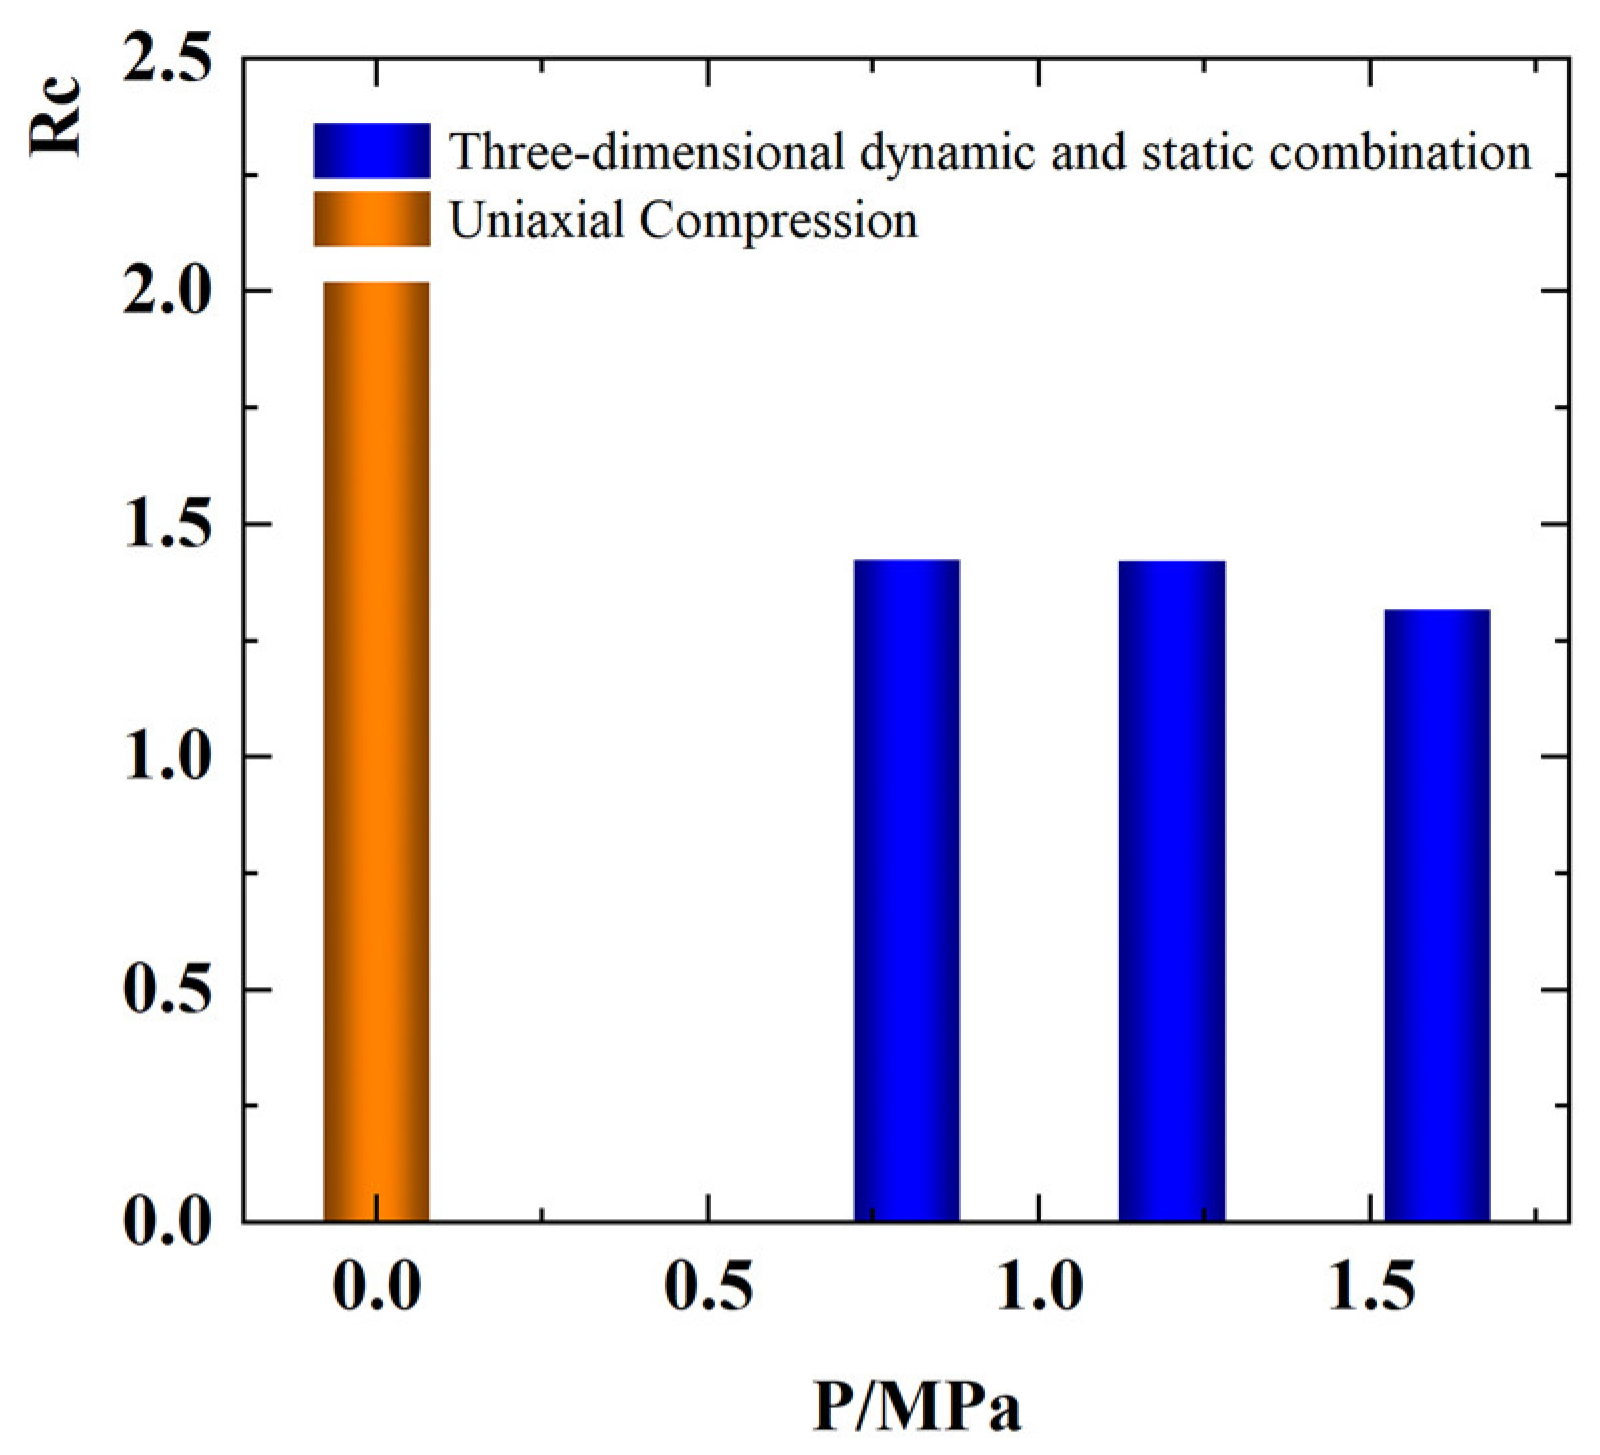
With an enhancement of the impact pressure, the load time of the rock became shorter, and the dynamic growth factor of sandstone increased gradually. The anisotropy coefficients of sandstone under three-dimensional dynamic compression were quite different from those under uniaxial loading. With an increasing bedding angle, there was no obvious rule for the peak strain. The peak strain basically followed a progressive pattern of increase as the impact pressure was enhanced.
(3)
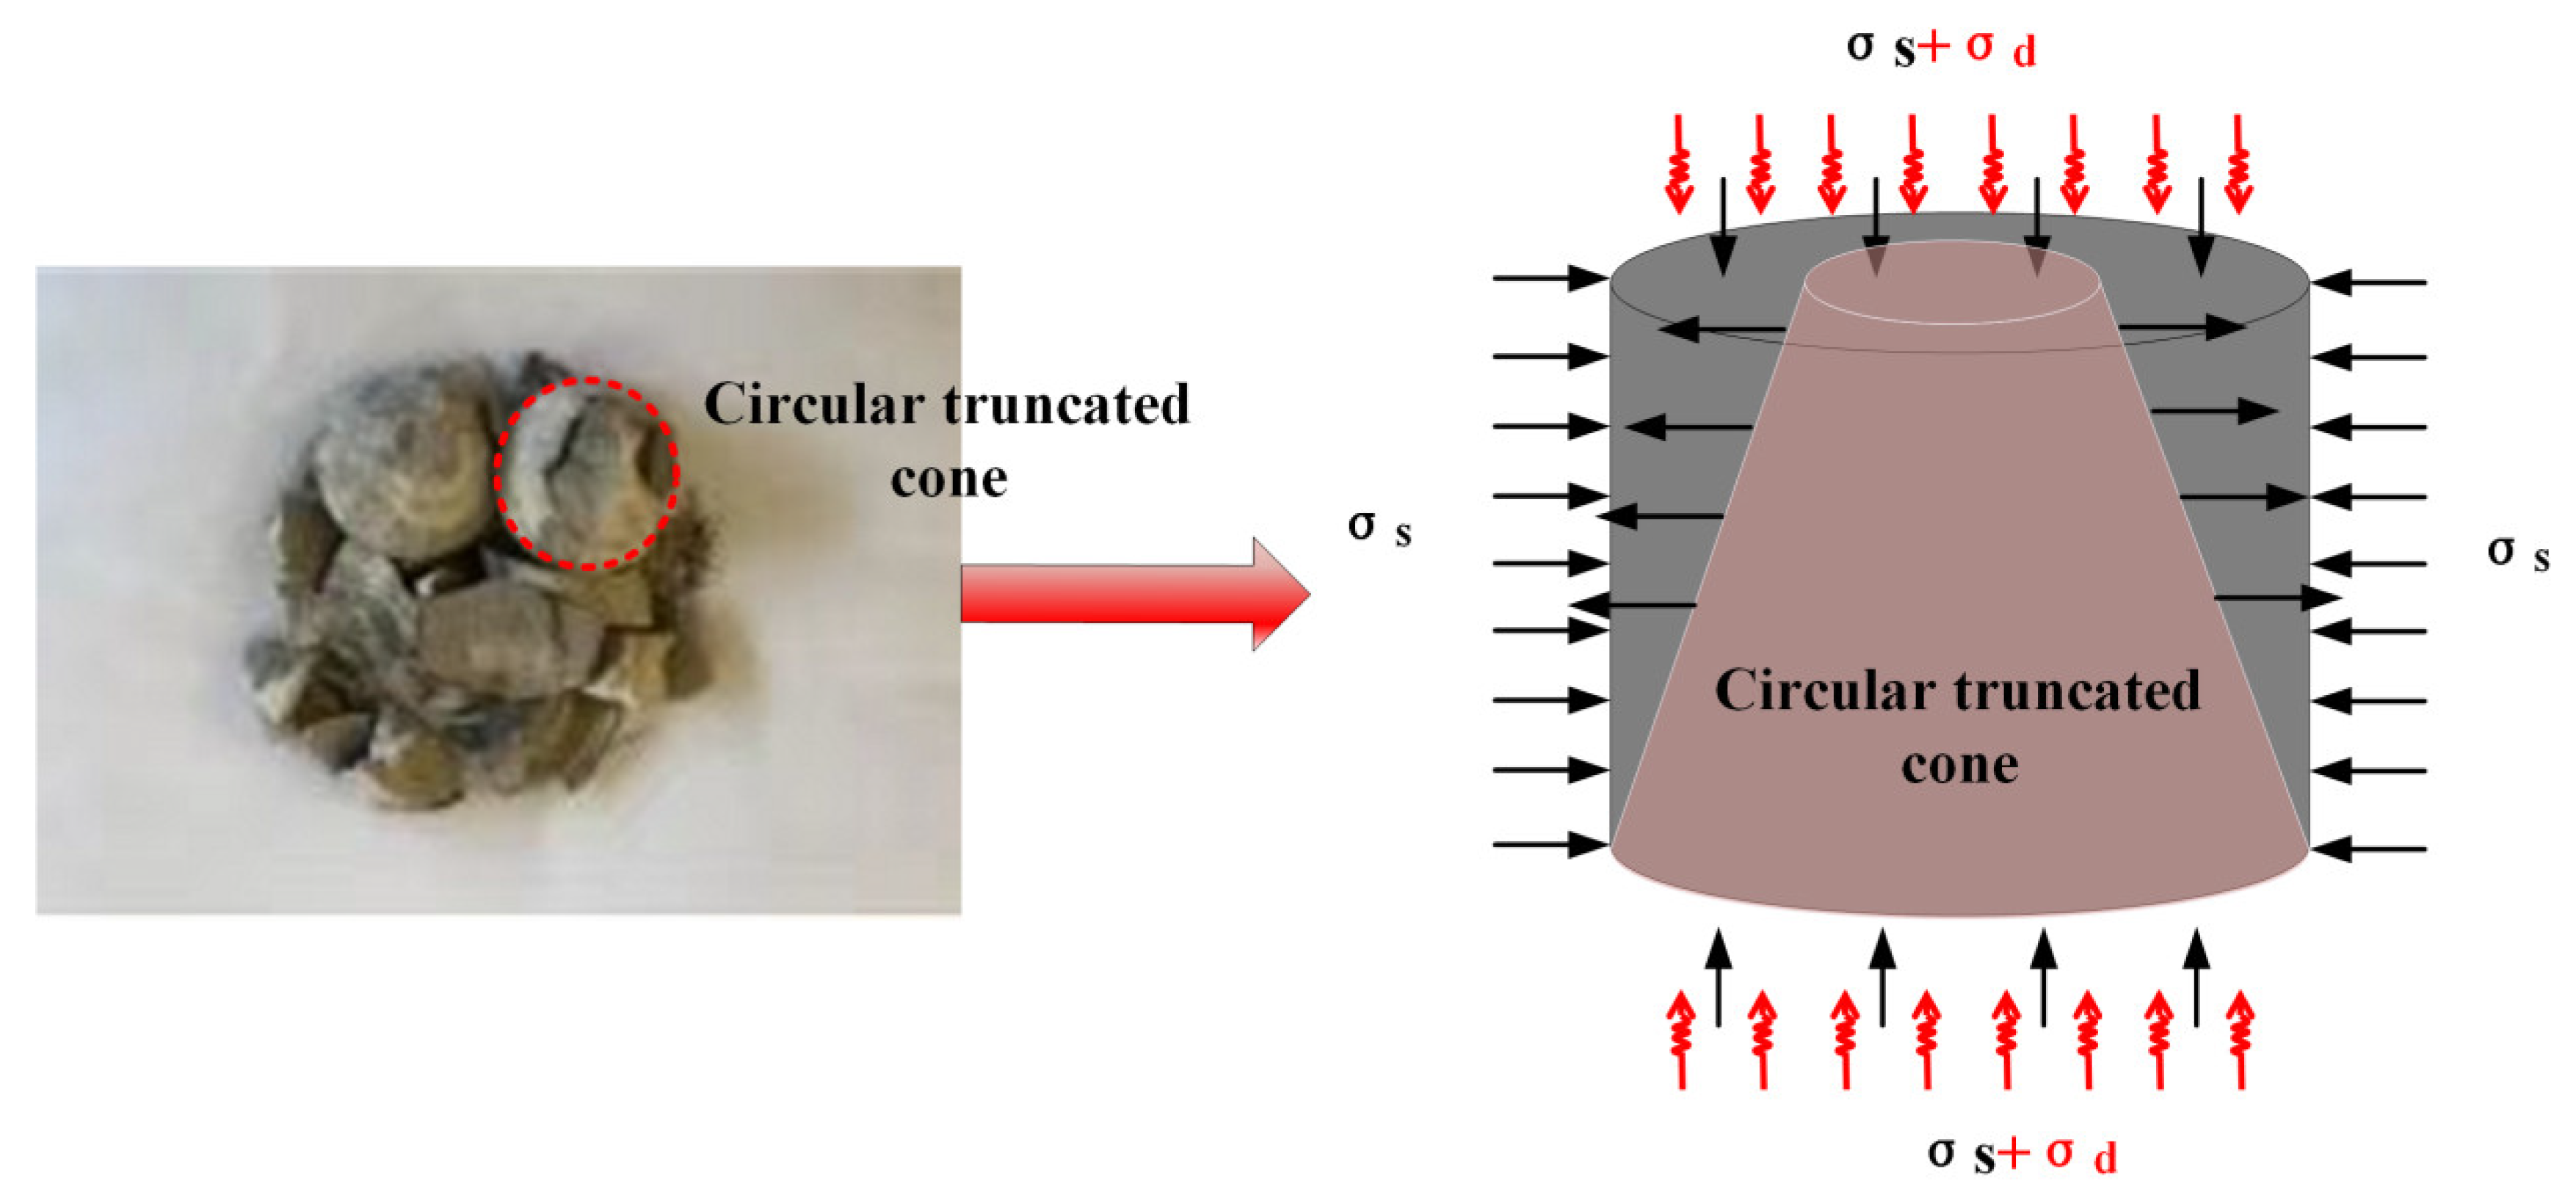
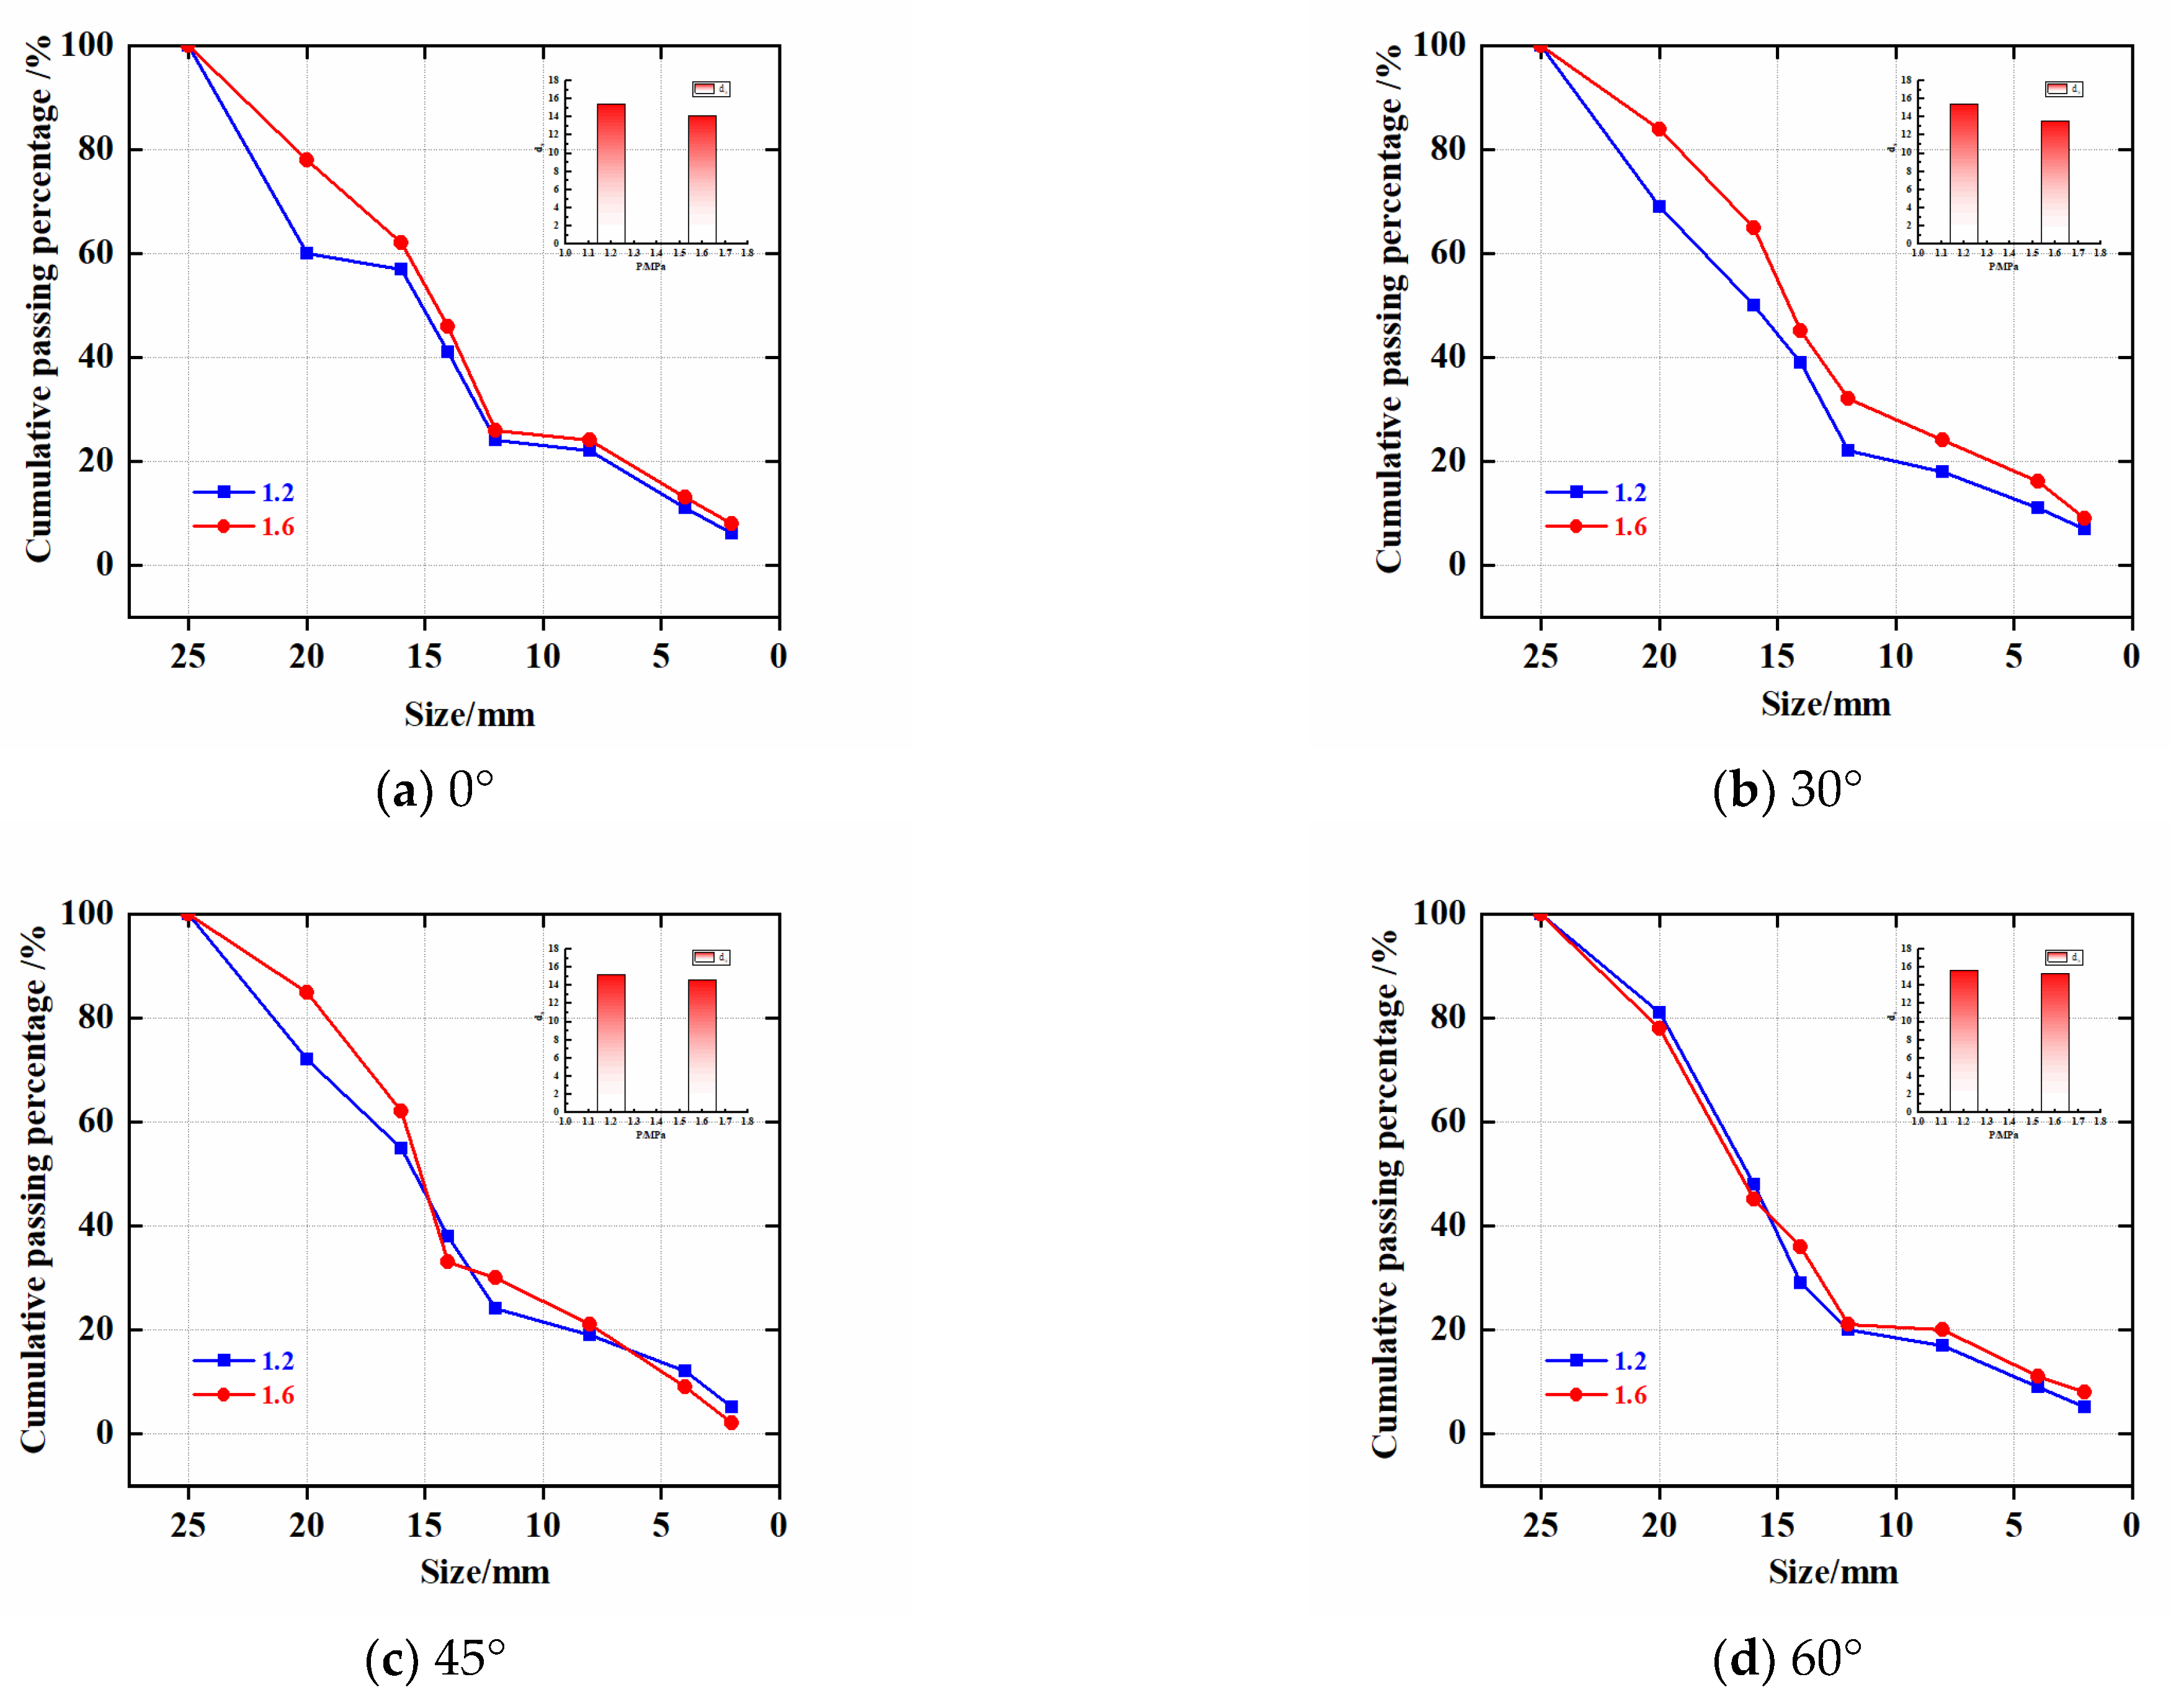
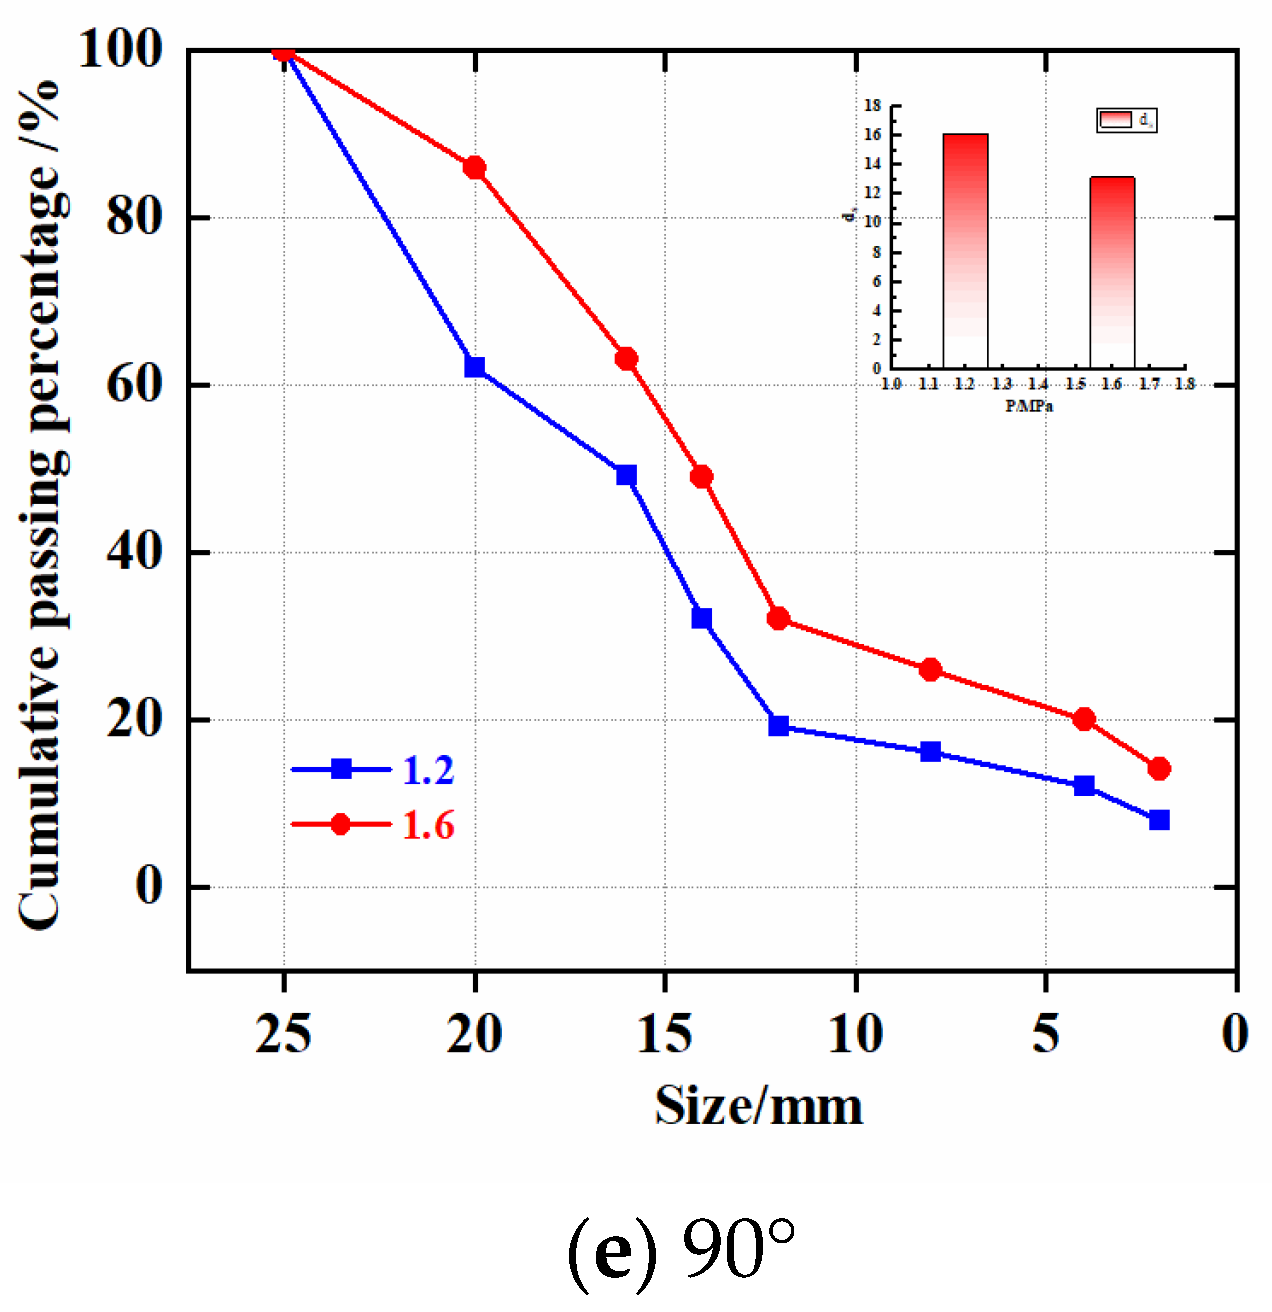
The bedding angles and dynamic loads markedly influenced the failure pattern of the laminated sandstone. Under an impact pressure of 1.2 MPa, the 0° and 45° bedding angle sandstone showed failure along the bedding planes, while the 30°, 60°, and 90° sandstone failure fragments had a typical circular-table shape. Under an impact pressure of 1.6 MPa, sandstone with bedding angles of 0°, 30°, 45°, and 60° showed typical round-table fragments.
(4)
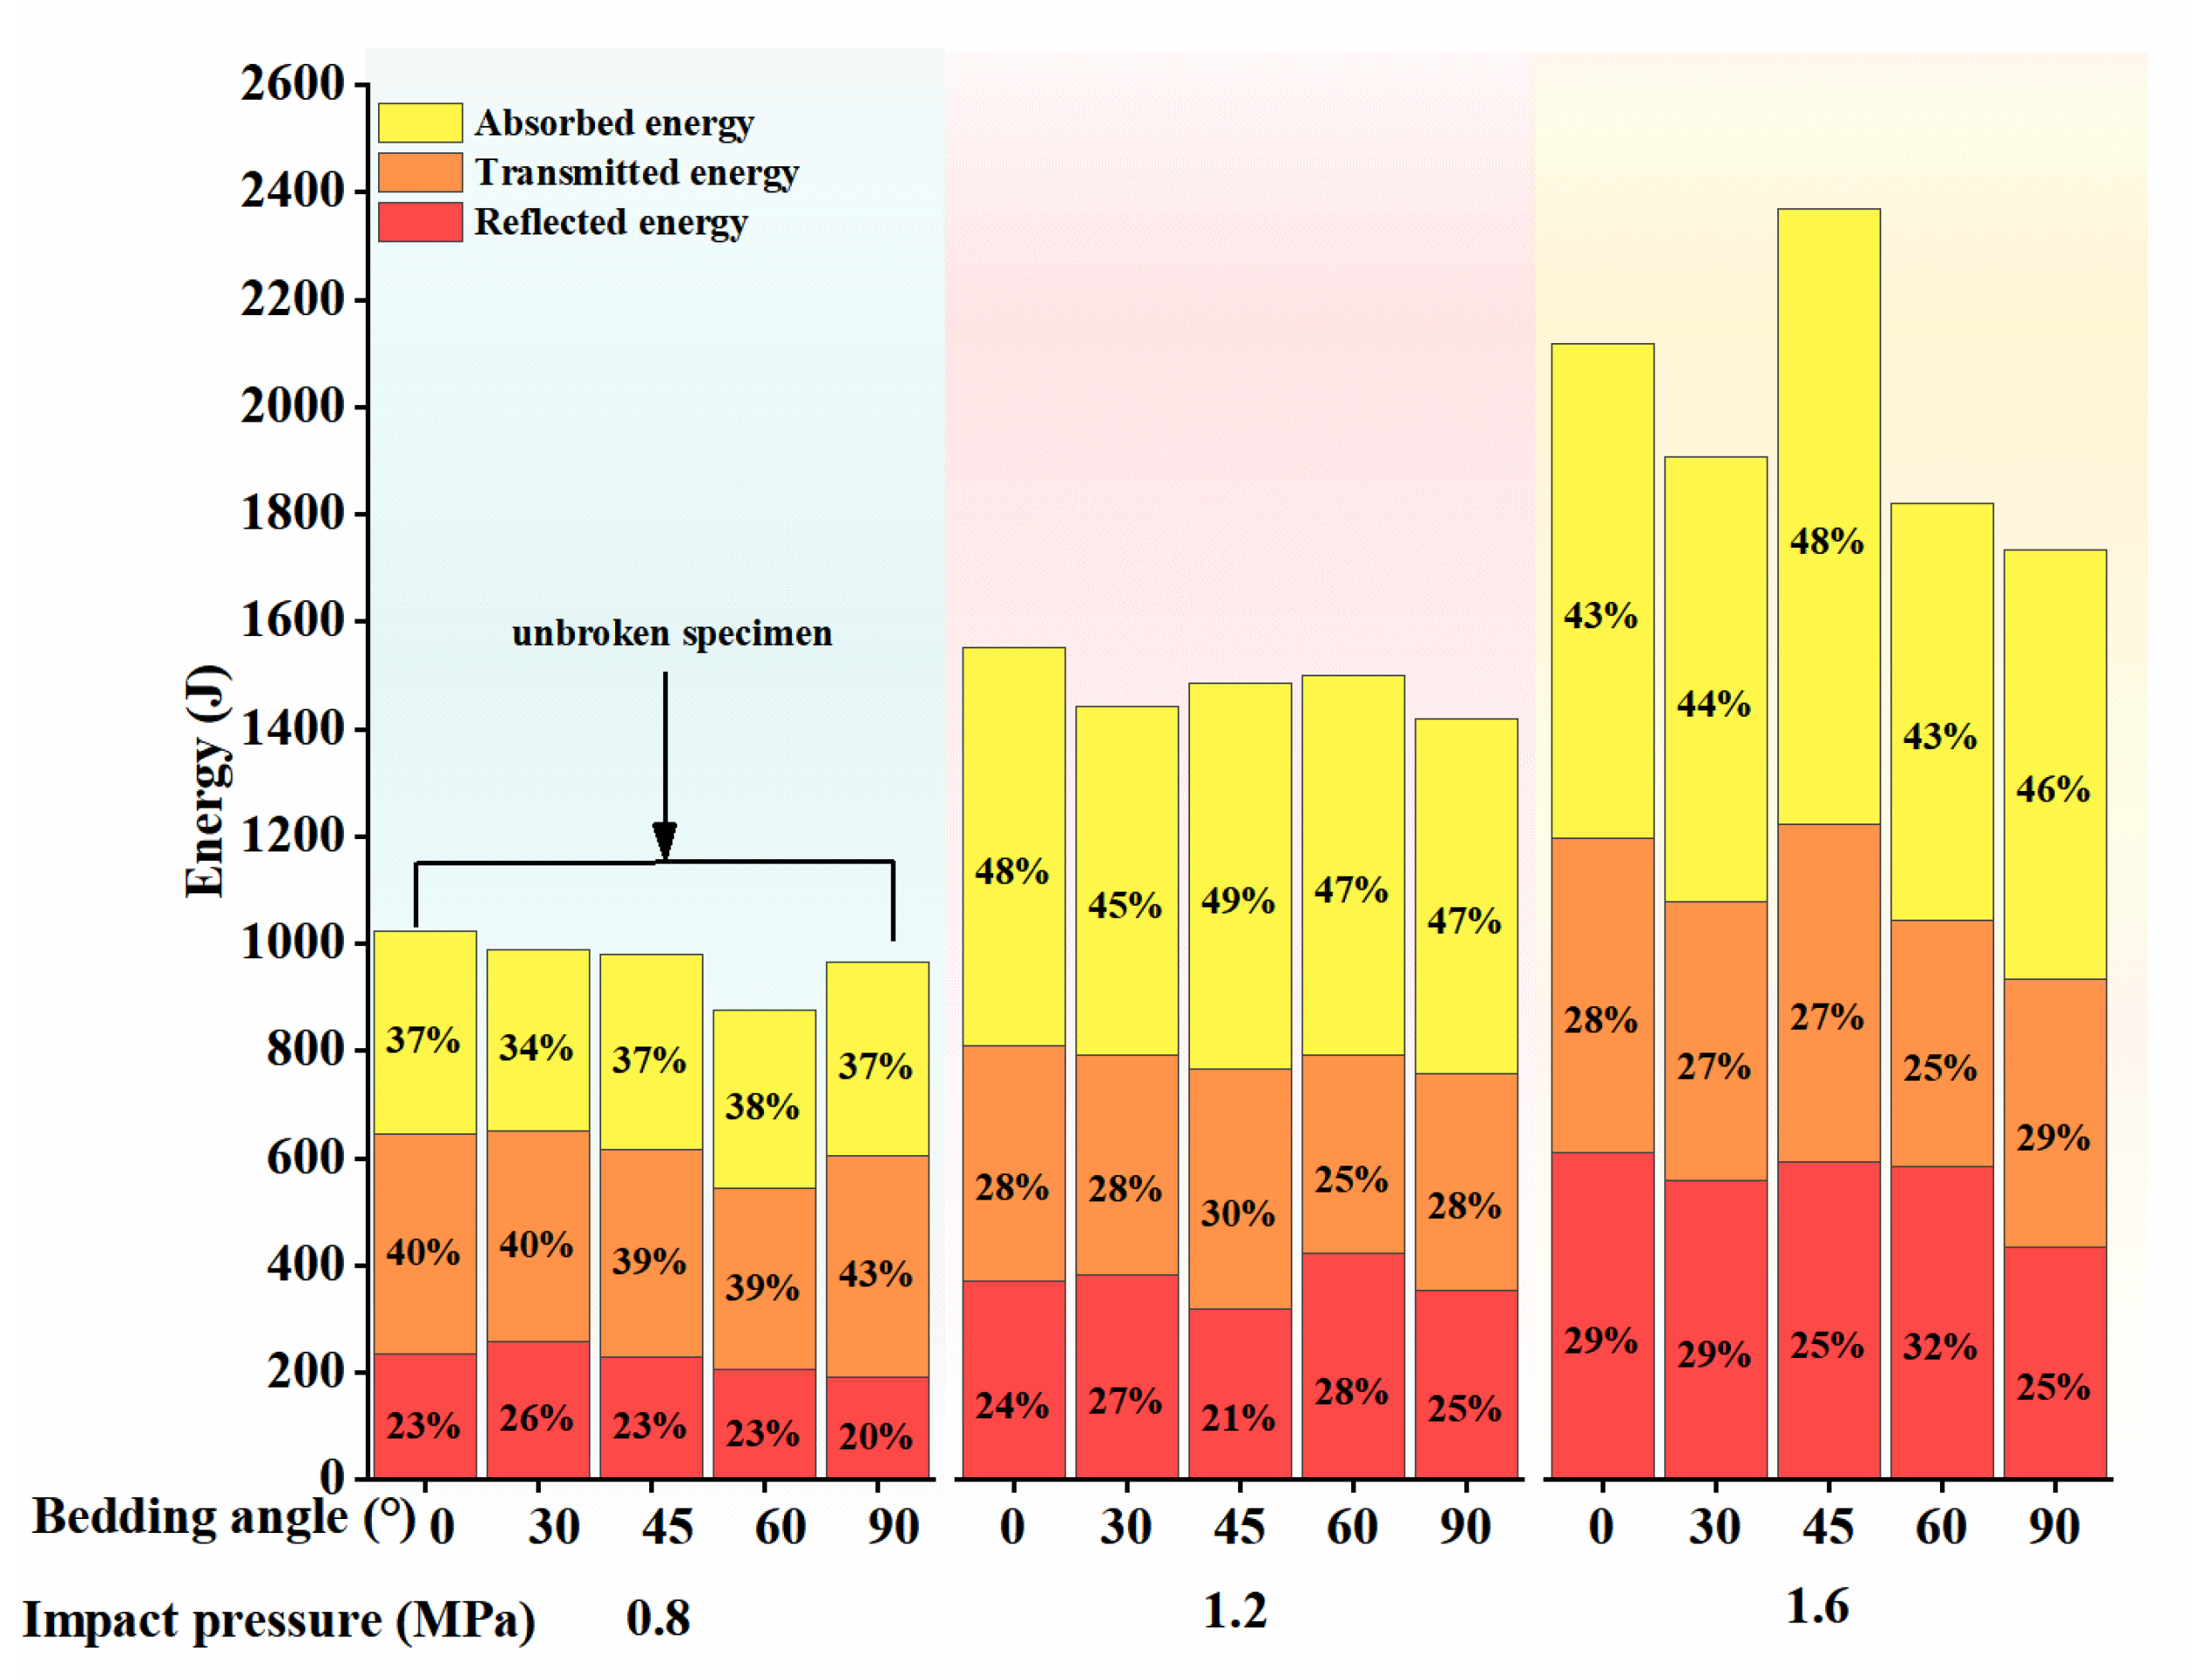
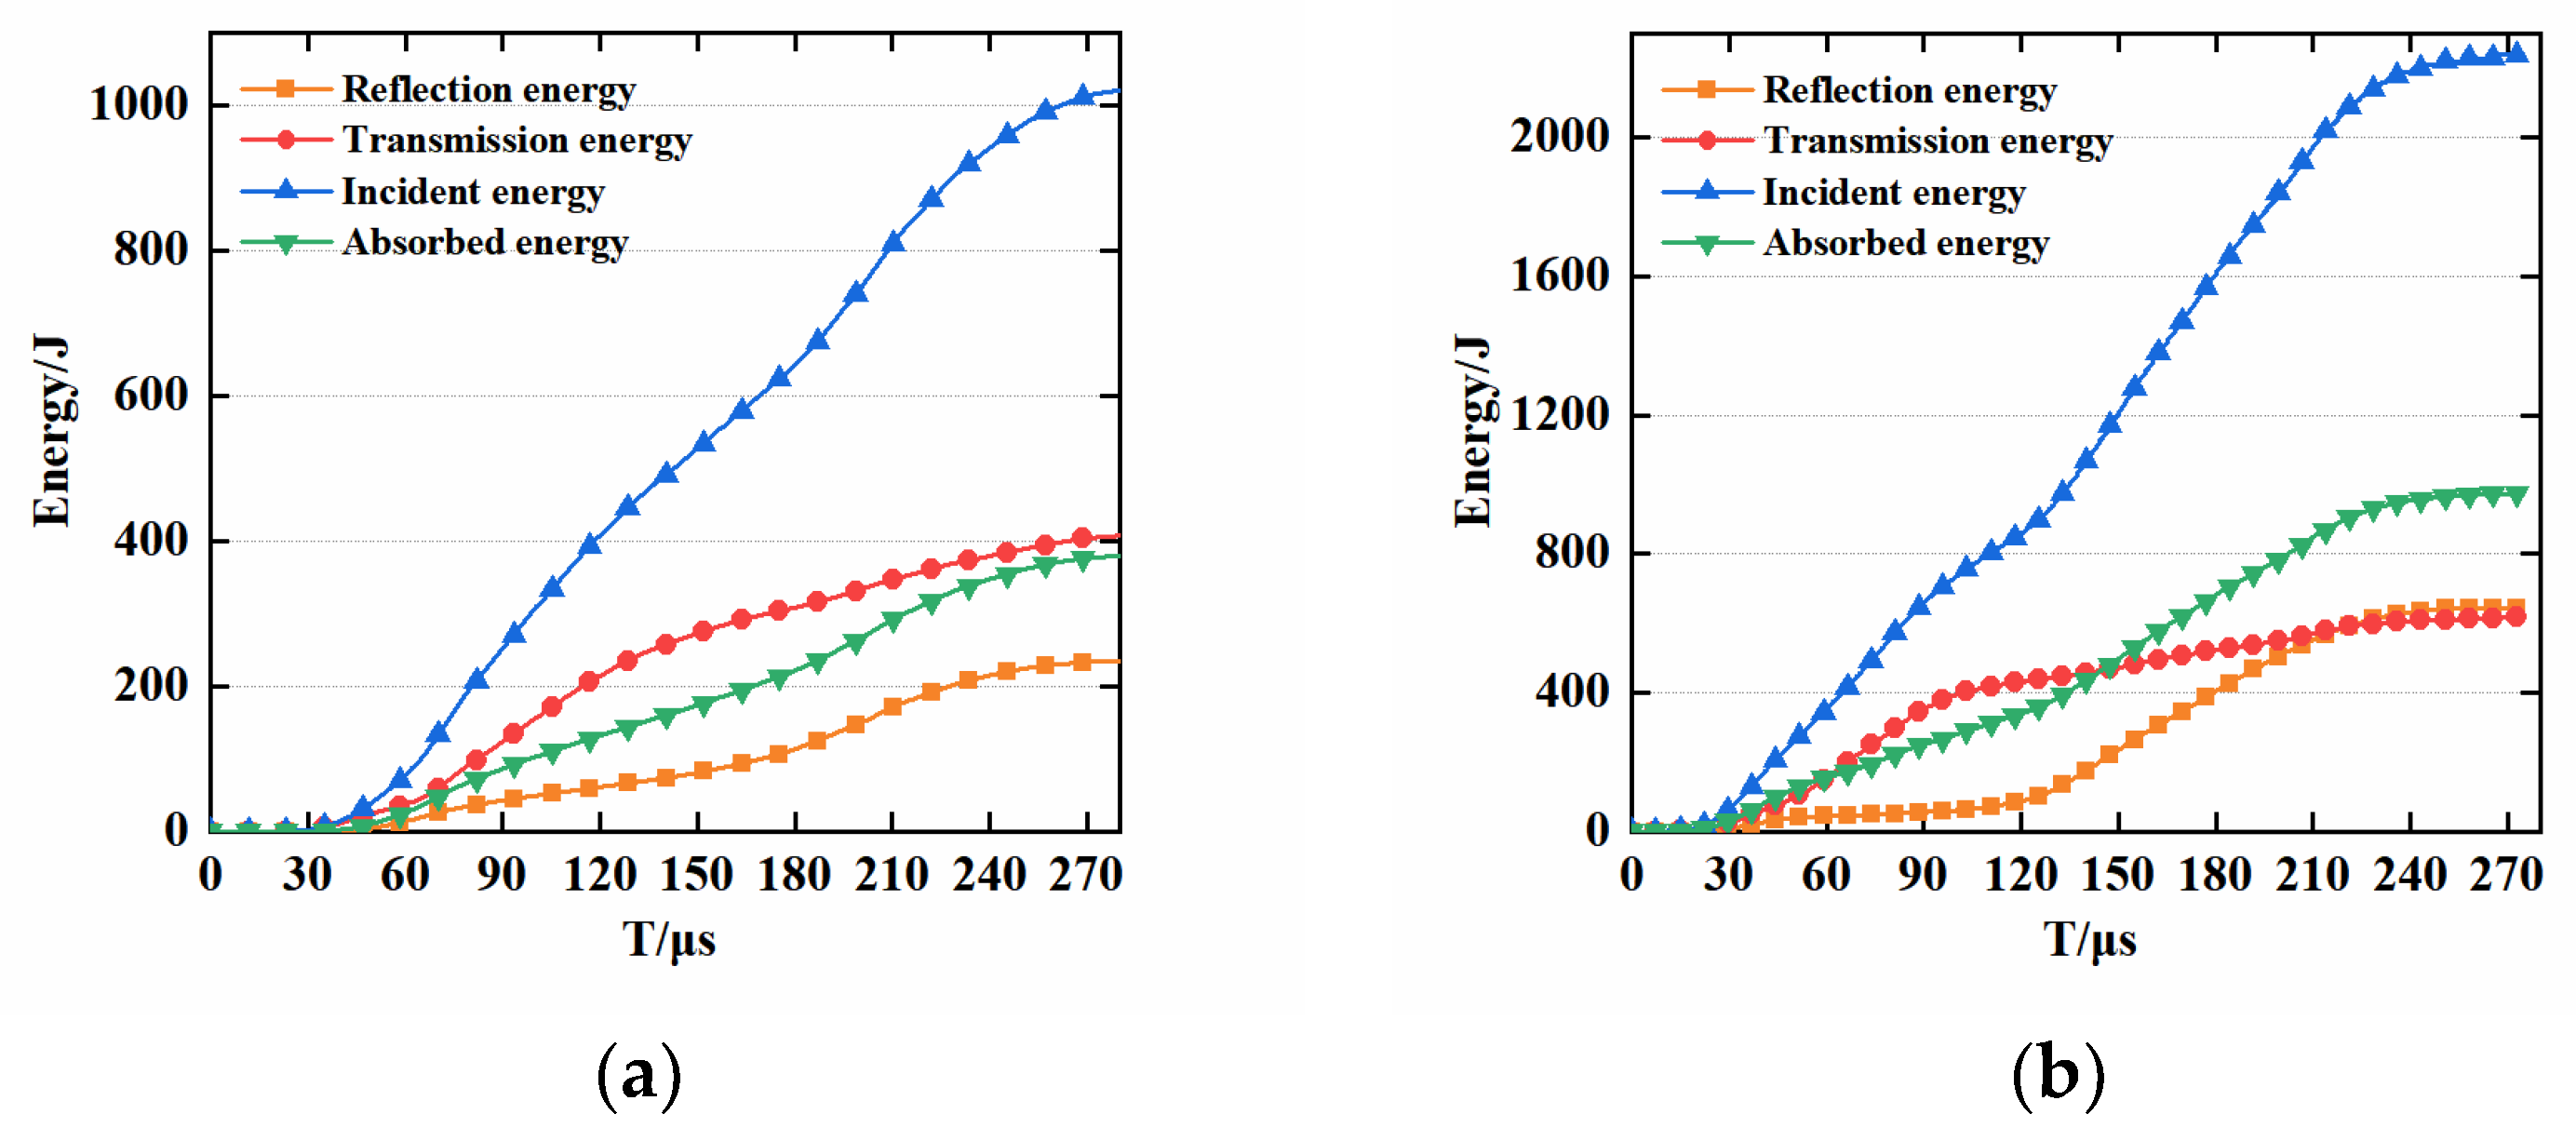
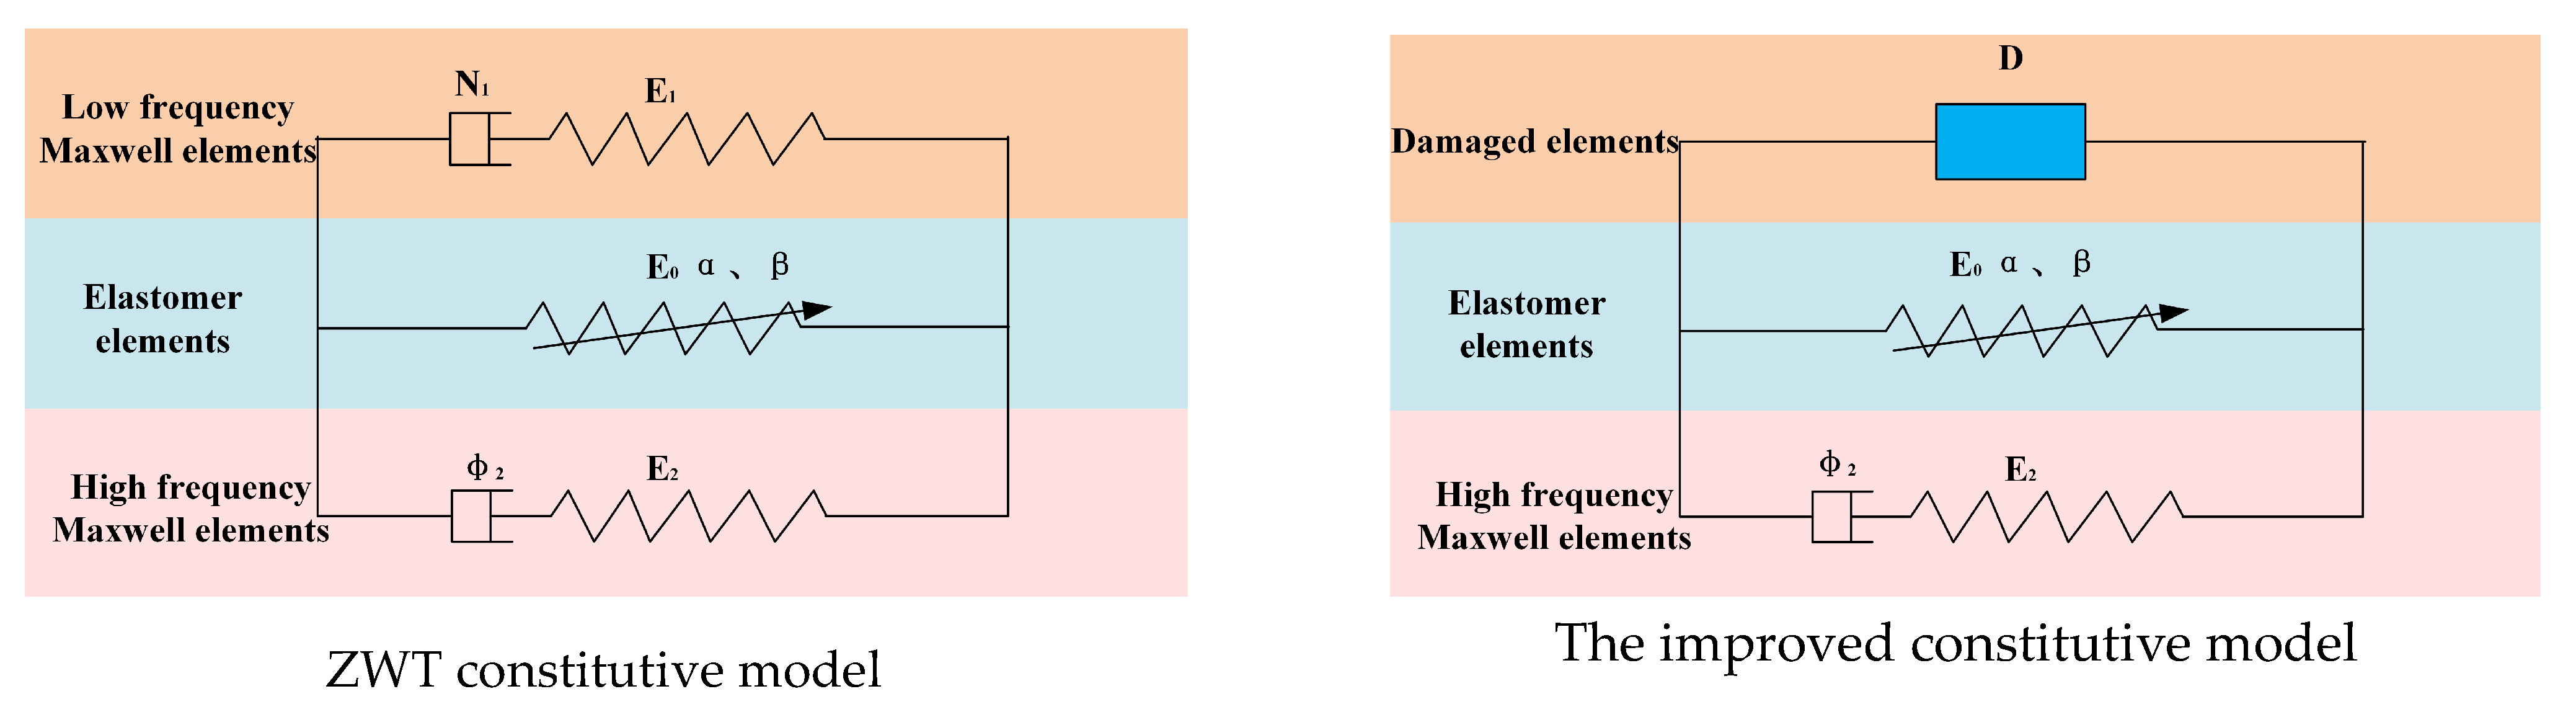
The proportion of reflected energy in the sandstone rose progressively as the impact pressure increased. A constitutive model of the rock under the combined effect of triaxial dynamic and static loads and the bedding plane was developed and verified. The constitutive model can accurately describe the dynamic behavior of rock under this condition.

Author Contributions

W.F.: Conceptualization; Data curation; Writing—Original draft preparation. J.Z.: Acquisition of financial support for project leadership. Y.Z.: Format modification. X.D.: Format modification. Y.X. and Y.Y.: Format modification. All authors have read and agreed to the published version of the manuscript.

Funding

This study was supported by the National Natural Science Foundation of China (Grant Nos. 52034009 and 51974319) and the Yue Qi Distinguished Scholar Project (Grant No. 2020JCB01).

Data Availability Statement

Data sharing not applicable.

Conflicts of Interest

The corresponding author declares no conflict of interest on behalf of all authors.

References

  1. Hou, S.; Liang, S.; Liu, D. Study on dynamic mechanical properties and constitutive model of granite under constant strain rate loading. Constr. Build. Mater. 2023, 363, 129975. [Google Scholar] [CrossRef]
  2. Zhou, Z.; Cai, X.; Ma, D.; Chen, L.; Wang, S.; Tan, L. Dynamic tensile properties of sandstone subjected to wetting and drying cycles. Constr. Build. Mater. 2018, 182, 215–232. [Google Scholar] [CrossRef]
  3. Cai, X.; Zhou, Z.; Du, X. Water-induced variations in dynamic behavior and failure characteristics of sandstone subjected to simulated geo-stress. Int. J. Rock Mech. Min. Sci. 2020, 130, 104339. [Google Scholar] [CrossRef]
  4. Hao, X.; Du, W.; Zhao, Y.; Sun, Z.; Zhang, Q.; Wang, S.; Qiao, H. Dynamic tensile behaviour and crack propagation of coal under coupled static-dynamic loading. Int. J. Min. Sci. Technol. 2020, 30, 659–668. [Google Scholar] [CrossRef]
  5. Ke, B.; Zhang, J.; Deng, H.; Yang, X. Dynamic Characteristics of Sandstone under Coupled Static-Dynamic Loads after Freeze-Thaw Cycles. Appl. Sci. 2020, 10, 3351. [Google Scholar] [CrossRef]
  6. Tan, L.; Ren, T.; Yang, X.; He, X. A numerical simulation study on mechanical behaviour of coal with bedding planes under coupled static and dynamic load. Int. J. Min. Sci. Technol. 2018, 28, 791–797. [Google Scholar] [CrossRef]
  7. Wang, Z.L.; Hao, S.Y.; Zheng, J.; Tian, N.C.; Zha, F.S.; Shi, H. Study on energy properties and failure behaviors of heat-treated granite under static and dynamic compression. Mech. Adv. Mater. Struct. 2019, 27, 462–472. [Google Scholar] [CrossRef]
  8. Zhou, Z.; Cai, X.; Li, X.; Cao, W.; Du, X. Dynamic Response and Energy Evolution of Sandstone Under Coupled Static–Dynamic Compression: Insights from Experimental Study into Deep Rock Engineering Applications. Rock Mech. Rock Eng. 2019, 53, 1305–1331. [Google Scholar] [CrossRef]
  9. Gong, F.-Q.; Si, X.-F.; Li, X.-B.; Wang, S.-Y. Dynamic triaxial compression tests on sandstone at high strain rates and low confining pressures with split Hopkinson pressure bar. Int. J. Rock Mech. Min. Sci. 2019, 113, 211–219. [Google Scholar] [CrossRef]
  10. Luo, N.; Fan, X.; Cao, X.; Zhai, C.; Han, T. Dynamic mechanical properties and constitutive model of shale with different bedding under triaxial impact test. J. Pet. Sci. Eng. 2022, 216, 110758. [Google Scholar] [CrossRef]
  11. Li, Y.; Zhai, Y.; Wang, C.; Meng, F.; Lu, M. Mechanical properties of Beishan granite under complex dynamic loads after thermal treatment. Eng. Geol. 2020, 267, 105481. [Google Scholar] [CrossRef]
  12. Xu, Y.; Chen, B.; Wu, B.; Chen, Z.; Yang, L.; Li, P. Influence of freeze–thaw cycling on the dynamic compressive failure of rocks subjected to hydrostatic pressure. Bull. Eng. Geol. Environ. 2022, 81, 276. [Google Scholar] [CrossRef]
  13. Zhou, T.; Zhu, J.; Xie, H. Mechanical and Volumetric Fracturing Behaviour of Three-Dimensional Printing Rock-like Samples Under Dynamic Loading. Rock Mech. Rock Eng. 2020, 53, 2855–2864. [Google Scholar] [CrossRef]
  14. Zhou, Y.; Su, S.; Li, P.; Xu, G. Mechanical Behavior, Energy Release, and Crack Distribution Characteristics of Water-Saturated Phyllite under Triaxial Cyclic Loading. Adv. Civ. Eng. 2021, 2021, 3681439. [Google Scholar] [CrossRef]
  15. Wang, S.; Xiong, X.; Liu, Y.; Zhou, J.; Du, K.; Cui, Y.; Khandelwal, M. Stress–strain relationship of sandstone under confining pressure with repetitive impact. Geomech. Geophys. Geo-Energy Geo-Resour. 2021, 7, 39. [Google Scholar] [CrossRef]
  16. Barton, N. Shear strength criteria for rock, rock joints, rockfill and rock masses: Problems and some solutions. J. Rock Mech. Geotech. Eng. 2013, 5, 249–261. [Google Scholar] [CrossRef]
  17. Si, X.; Gong, F.; Li, X.; Wang, S.; Luo, S. Dynamic Mohr–Coulomb and Hoek–Brown strength criteria of sandstone at high strain rates. Int. J. Rock Mech. Min. Sci. 2019, 115, 48–59. [Google Scholar] [CrossRef]
  18. Singh, M.; Raj, A.; Singh, B. Modified Mohr–Coulomb criterion for non-linear triaxial and polyaxial strength of intact rocks. Int. J. Rock Mech. Min. Sci. 2011, 48, 546–555. [Google Scholar] [CrossRef]
  19. Du, H.-B.; Dai, F.; Liu, Y.; Xu, Y.; Wei, M.-D. Dynamic response and failure mechanism of hydrostatically pressurized rocks subjected to high loading rate impacting. Soil Dyn. Earthq. Eng. 2020, 129, 105927. [Google Scholar] [CrossRef]
  20. Du, H.-B.; Dai, F.; Xu, Y.; Yan, Z.; Wei, M.-D. Mechanical responses and failure mechanism of hydrostatically pressurized rocks under combined compression-shear impacting. Int. J. Mech. Sci. 2020, 165, 105219. [Google Scholar] [CrossRef]
  21. Du, H.; Dai, F.; Wei, M.; Li, A.; Yan, Z. Dynamic Compression–Shear Response and Failure Criterion of Rocks with Hydrostatic Confining Pressure: An Experimental Investigation. Rock Mech. Rock Eng. 2020, 54, 955–971. [Google Scholar] [CrossRef]
  22. Yao, W.; Li, X.; Xia, K.; Hokka, M. Dynamic flexural failure of rocks under hydrostatic pressure: Laboratory test and theoretical modeling. Int. J. Impact Eng. 2021, 156, 103946. [Google Scholar] [CrossRef]
  23. Yao, W.; Xu, Y.; Wang, C.; Xia, K.; Hokka, M. Dynamic Mode Ⅱ fracture behavior of rocks under hydrostatic pressure using the short core in compression (SCC) method. Int. J. Min. Sci. Technol. 2021, 31, 927–937. [Google Scholar] [CrossRef]
  24. Feng, X.-T.; Tian, M.; Yang, C.; He, B. A testing system to understand rock fracturing processes induced by different dynamic disturbances under true triaxial compression. J. Rock Mech. Geotech. Eng. 2023, 15, 102–118. [Google Scholar] [CrossRef]
  25. Xie, H.; Zhu, J.; Zhou, T.; Zhao, J. Novel Three-dimensional Rock Dynamic Tests Using the True Triaxial Electromagnetic Hopkinson Bar System. Rock Mech. Rock Eng. 2021, 54, 2079–2086. [Google Scholar] [CrossRef]
  26. Zhao, G.; Li, X.; Xu, Y.; Xia, K. A modified triaxial split Hopkinson pressure bar (SHPB) system for quantifying the dynamic compressive response of porous rocks subjected to coupled hydraulic-mechanical loading. Geomech. Geophys. Geo-Energy Geo-Resour. 2022, 8, 29. [Google Scholar] [CrossRef]
  27. You, W.; Dai, F.; Liu, Y.; Du, H.; Jiang, R. Investigation of the influence of intermediate principal stress on the dynamic responses of rocks subjected to true triaxial stress state. Int. J. Min. Sci. Technol. 2021, 31, 913–926. [Google Scholar] [CrossRef]
  28. Gong, H.; Luo, Y.; Zhou, J.; Zhao, C.; Li, X. Fracture Behaviors and Damage Evolution Anisotropy of Granite Under Coupling of Multiaxial Confinement and Dynamic Loading. Rock Mech. Rock Eng. 2023, 56, 2515–2534. [Google Scholar] [CrossRef]
  29. Luo, Y.; Gong, H.; Huang, J.; Wang, G.; Li, X.; Wan, S. Dynamic cumulative damage characteristics of deep-buried granite from Shuangjiangkou hydropower station under true triaxial constraint. Int. J. Impact Eng. 2022, 165, 104215. [Google Scholar] [CrossRef]
  30. Wu, G.; Liu, K.; Hu, W.R.; Li, J.C.; Dehkhoda, S.; Zhang, Q.B. Quantification of dynamic damage and breakage in granite under confined indentation. Int. J. Rock Mech. Min. Sci. 2021, 144, 104763. [Google Scholar] [CrossRef]
  31. Liu, K.; Zhang, Q.B.; Wu, G.; Li, J.C.; Zhao, J. Dynamic Mechanical and Fracture Behaviour of Sandstone under Multiaxial Loads Using a Triaxial Hopkinson Bar. Rock Mech. Rock Eng. 2019, 52, 2175–2195. [Google Scholar] [CrossRef]
  32. Liu, K.; Zhao, J. Progressive Damage Behaviours of Triaxially Confined Rocks under Multiple Dynamic Loads. Rock Mech. Rock Eng. 2021, 54, 3327–3358. [Google Scholar] [CrossRef]
  33. Hu, W.R.; Liu, K.; Potyondy, D.O.; Salmi, E.F.; Sellers, E.J.; Zhang, Q.B. Grain-based modelling of dynamic shear rupture of heterogeneous rock using a coupled continuum-discrete model. Int. J. Impact Eng. 2023, 172, 104420. [Google Scholar] [CrossRef]
  34. Hu, W.R.; Liu, K.; Potyondy, D.O.; Zhang, Q.B. 3D continuum-discrete coupled modelling of triaxial Hopkinson bar tests on rock under multiaxial static-dynamic loads. Int. J. Rock Mech. Min. Sci. 2020, 134, 104448. [Google Scholar] [CrossRef]
  35. Niu, C.; Zhu, Z.; Wang, F.; Ying, P.; Deng, S. Effect of Water Content on Dynamic Fracture Characteristic of Rock under Impacts. KSCE J. Civ. Eng. 2020, 25, 37–50. [Google Scholar] [CrossRef]
  36. Chang, X.; Zhang, X.; Qian, L.Z.; Chen, S.H.; Yu, J. Influence of bedding anisotropy on the dynamic fracture behavior of layered phyllite. Eng. Fract. Mech. 2022, 260, 108183. [Google Scholar] [CrossRef]
  37. Dong, S.; Han, B.; Yu, X.; Ou, J. Dynamic impact behaviors and constitutive model of super-fine stainless wire reinforced reactive powder concrete. Constr. Build. Mater. 2018, 184, 602–616. [Google Scholar] [CrossRef]
  38. Zhang, H.; Wang, L.; Zheng, K.; Bakura, T.J.; Totakhil, P.G. Research on compressive impact dynamic behavior and constitutive model of polypropylene fiber reinforced concrete. Constr. Build. Mater. 2018, 187, 584–595. [Google Scholar] [CrossRef]
  39. Huang, Y.-J.; Guo, F.-Q.; Zhang, H.; Yang, Z.-J. An efficient computational framework for generating realistic 3D mesoscale concrete models using micro X-ray computed tomography images and dynamic physics engine. Cem. Concr. Compos. 2022, 126, 104347. [Google Scholar] [CrossRef]
  40. Huang, Y.; Yang, Z.; Ren, W.; Liu, G.; Zhang, C. 3D meso-scale fracture modelling and validation of concrete based on in-situ X-ray Computed Tomography images using damage plasticity model. Int. J. Solids Struct. 2015, 67–68, 340–352. [Google Scholar] [CrossRef]
  41. Huang, Y.J.; Yang, Z.J.; Chen, X.W.; Liu, G.H. Monte Carlo simulations of meso-scale dynamic compressive behavior of concrete based on X-ray computed tomography images. Int. J. Impact Eng. 2016, 97, 102–115. [Google Scholar] [CrossRef]
Figure 1. Typical samples and XRD and SEM scanning images.
Mathematics 11 01959 g001
Figure 2. Three-dimensional SHPB test system.
Mathematics 11 01959 g002
Figure 3. Stress paths and stress−time curves for the samples.
Mathematics 11 01959 g003
Figure 4. Stress–strain curve of the samples under different loading conditions.
Mathematics 11 01959 g004aMathematics 11 01959 g004b
Figure 5. Correlation between strain rate and impact pressure of the samples under different loading conditions.
Mathematics 11 01959 g005
Figure 6. Peak strength of the sandstone samples under different loading conditions (a) Two-dimensional cloud map of peak strength. (b) Three-dimensional map of peak strength. (c) Different bedding angles. (d) Different impact pressure.
Mathematics 11 01959 g006aMathematics 11 01959 g006b
Figure 7. Coupled strength of sandstone under different loading conditions. (a) Two-dimensional cloud map of coupled strength. (b) Three-dimensional map of coupled strength. (c) Different bedding angles. (d) Different impact pressure.
Mathematics 11 01959 g007
Figure 8. Dynamic strength growth factor of sandstone under different loading conditions. (a) Two-dimensional cloud map of the dynamic strength growth factor for sandstone; (b) 3D cloud image of the dynamic strength growth factor for sandstone.
Mathematics 11 01959 g008
Figure 9. Strength anisotropy coefficient of sandstone under different loading conditions.
Mathematics 11 01959 g009
Figure 10. Peak strain of sandstone under different loading conditions. (a) Two-dimensional cloud map of peak strain. (b) Three-dimensional map of peak strain. (c) Different bedding angles. (d) Different impact pressure.
Mathematics 11 01959 g010
Figure 11. Schematic diagram of circular-platform fragmentation.
Mathematics 11 01959 g011
Figure 12. Particle size distribution curve.
Mathematics 11 01959 g012aMathematics 11 01959 g012b
Figure 13. Energy proportions in the samples under different loading conditions.
Mathematics 11 01959 g013
Figure 14. Energy evolution law for samples under different loading conditions. (a) P = 0.8 MPa. (b) P = 1.2 MPa. (c) P = 1.6 MPa. (d) Energy utilization. (e) Two-dimensional cloud map of energy utilization. (f) Absorbed energy density of sandstone. (g) Two-dimensional cloud map of absorbed energy density.
Mathematics 11 01959 g014aMathematics 11 01959 g014b
Figure 15. Constitutive model.
Mathematics 11 01959 g015
Figure 16. Modified constitutive model and its verification.
Mathematics 11 01959 g016aMathematics 11 01959 g016b
Figure 17. Different constitutive parameters. (a) Different n value. (b) Different εf value.
Mathematics 11 01959 g017
Table 1. Peak strength and coupling strength of sandstone.
Impact Pressure/MPaBedding Angle/°Peak Strength/MPaCoupled Strength/MPa
0.80249259
1.20311321
1.60381391
0.830210220
1.230249259
1.630324334
0.845172182
1.245216226
1.645287297
0.860207217
1.260229239
1.660332342
0.890230240
1.290254264
1.690363373
Table 2. Peak strain characteristics of sandstone.
Impact Pressure/MPaBedding Plane/°Peak Strain
0.800.0055
1.200.0099
1.600.0063
0.8300.0047
1.2300.0058
1.6300.0073
0.8450.0049
1.2450.012
1.6450.0085
0.8600.0034
1.2600.0096
1.6600.0086
0.8900.0040
1.2900.0091
1.6900.0084
Table 3. Failure characteristics of sandstone.
P/MPaFailure Characteristics
30°45°60°90°
0.8Mathematics 11 01959 i001Mathematics 11 01959 i002Mathematics 11 01959 i003Mathematics 11 01959 i004Mathematics 11 01959 i005
1.2Mathematics 11 01959 i006Mathematics 11 01959 i007Mathematics 11 01959 i008Mathematics 11 01959 i009Mathematics 11 01959 i010
1.6Mathematics 11 01959 i011Mathematics 11 01959 i012Mathematics 11 01959 i013Mathematics 11 01959 i014Mathematics 11 01959 i015
Table 4. Parameters of the rock constitutive model.
P (MPa)Bedding AnglenE0 (GPa)E2 (GPa)αβΦ2
0.80.852989553105159.310.66−414.7
1.20.879454673506168.49.86848.2
1.61.27910154301263.211.6−326.4
0.830°1.48256351463−33.8−163.8−128.8
1.230°0.972184802630137.110.81949.2
1.630°1.11289223072196.211.52−796.5
0.845°0.71066662128231.4611.380.0458
1.245°1.08550911408−220−1190358.8
1.645°1.0037258811798.2810.9−998.9
0.860°1.47451651885−26.82741.3−2449
1.260°0.813758593520−86.78227.1−135.9
1.660°0.929977353953141.611.42−76.66
0.890°0.672989522745129.91061.52
1.290°0.901955983102−128.1284.81085
1.690°1.00185957932204.511.73−110.3
Disclaimer/Publisher’s Note: The statements, opinions and data contained in all publications are solely those of the individual author(s) and contributor(s) and not of MDPI and/or the editor(s). MDPI and/or the editor(s) disclaim responsibility for any injury to people or property resulting from any ideas, methods, instructions or products referred to in the content.

