Abstract
Hydraulic rock drills are widely used in drilling, mining, construction, and engineering applications. They typically operate in harsh environments with high humidity, large temperature differences, and vibration. Under the influence of environmental noise and operational patterns, the distributions of data collected by sensors for different operators and equipment differ significantly, which leads to difficulty in fault classification for hydraulic rock drills. Therefore, an intelligent and robust fault classification method is highly desired. In this paper, we propose a fault classification technique for hydraulic rock drills based on deep learning. First, considering the strong robustness of x−vectors to the features extracted from the time series, we employ an end−to−end fault classification model based on x−vectors to realize the joint optimization of feature extraction and classification. Second, the overlapping data clipping method is applied during the training process, which further improves the robustness of our model. Finally, the focal loss is used to focus on difficult samples, which improves their classification accuracy. The proposed method obtains an accuracy of 99.92%, demonstrating its potential for hydraulic rock drill fault classification.
MSC:
68T10; 97R40
1. Introduction
Hydraulic rock drills are widely used in drilling, mining, construction, engineering, and other applications for their fast drilling speed, high efficiency, and ease of automation [1]. Hydraulic rock drills are one of the most versatile tools at various work sites. Therefore, the fault diagnosis of hydraulic rock drills is of great significance for the maintenance of machinery and the safety of construction. The timely discovery of hydraulic rock drill faults can help avoid unnecessary losses [2]. Considering the harsh operating environments of hydraulic rock drilling machines, the data collected by hydraulic rock drilling machine sensors are typically low resolution and affected by noise [3,4]. Data distributions also differ between different operators of hydraulic rock drills, which leads to difficulties in the fault diagnosis of hydraulic rock drills [5,6].
Many effective algorithms have been developed in the field of fault diagnosis for hydraulic rock drills. Yelin et al. derived a change law for hydraulic oil in test holes for cylinder blocks and other important components of hydraulic rock drills. They established a mathematical model of a hydraulic rock drill and provided a theoretical basis for the fault diagnosis and improvement of hydraulic rock drills [7]. Jakobsson et al. used a data−driven approach combined with handcrafted engineering features and dynamic time warping to detect changes in rock drill behavior by reliably using a small number of sensors [8]. Additionally, Jakobsson et al. considered the fault classification of hydraulic rock drills and constructed relative features by capturing the amplitude differences induced by different damping elements in a hydraulic circuit, as well as the time differences between signals. By combining a support vector machine (SVM) and InceptionTime, they successfully identified most faults for different operators [9]. Lei et al. used principal component analysis (PCA) to reduce the dimensionality of the pressure signal of a hydraulic directional valve and used a machine learning service to establish an extreme gradient boosting (XGBoost) model, which effectively identified faults in the hydraulic directional valve [10]. Huang et al. proposed a fault diagnosis model for hydraulic systems based on convolutional neural networks (CNNs), which is suitable for multi−rate data samples [11].
Despite these developments in hydraulic rock drill fault diagnosis technology, there is still significant room for improvement. First, existing fault diagnosis methods for hydraulic rock drills mainly rely on mathematical models or manual features designed by experts and combine various machine learning methods to achieve classification. These methods require two or more steps to be implemented, which may lead to the accumulation of errors [7,12,13]. Secondly, differences in equipment and the habits of operators can lead to varying distributions of collected samples, which can deteriorate the performance and robustness of data−driven fault diagnosis methods [14]. Considering these problems associated with the fault diagnosis field of hydraulic rock drills, we introduce a fault classification method based on x−vectors. The main contributions of the proposed method are three−fold.
- Inspired by the significant development of voiceprint recognition based on deep learning, we developed an x−vectors−based method for the fault classification of hydraulic rock drills. Unlike a recurrent neural network or CNN, x−vectors map variable−length utterances to fixed−dimensional embeddings, resulting in enhanced robustness and accuracy.
- We utilize an end−to−end loss function to realize the joint optimization of feature learning and feature classification, thereby avoiding the accumulation of errors through a multi−step algorithm. By incorporating focal loss, the focus on difficult samples is increased to improve the accuracy of the model further.
- To handle differences in data distributions, data clipping technology for overlapping data are employed to align signals and increase the number of useful samples Additionally, noise is added during the training process to mitigate the negative impact of data distribution differences and improve robustness.
2. Data and Preprocessing
2.1. Experimental Data
The data utilized in this study came from the 2022 Prognostics and Health Management (PHM) Conference Data Challenge and were provided by Jakobsson et al. [15]. The data were collected by three sensors installed on a hydraulic rock drill. Table 1 lists the names and sampling frequencies of the three sensors. A schematic of the installation locations of the sensors on the hydraulic rock drill is presented in Figure 1.

Table 1.
Names and descriptions of pressure sensors.
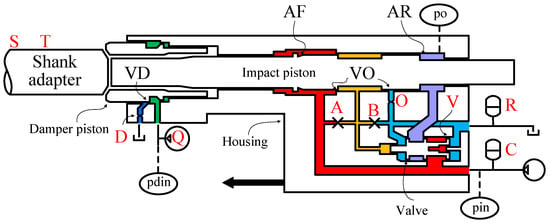
Figure 1.
Schematic diagram of the hydraulic rock drill, where red capital letters indicate different induced fault modes and approximate locations, and ovals indicate the positions of sensors [2].
Researchers have induced various faults by removing or modifying parts. The locations corresponding to fault triggers are indicated by red capital letters in Figure 1. The dataset contains 11 classes, including a no−fault (NF) class and 10 different fault classes. Descriptions of the faults and corresponding fault points in Figure 1 are provided in Table 2.

Table 2.
Descriptions of fault classes and the NF class for a hydraulic rock drill.
Figure 2 presents a pressure trace collected by the three sensors when fault D occurs in the hydraulic rock drill. It is difficult to distinguish the classes of faults without referring to the NF class. Figure 3 presents an example comparison of the pressure traces between the NF class and fault D. The differences between the two fault classes are relatively small compared to the differences between operators. The oscillation observed at the time of 6.88ms is delayed by the introduction of the fault, but this difference can be masked by operator differences.
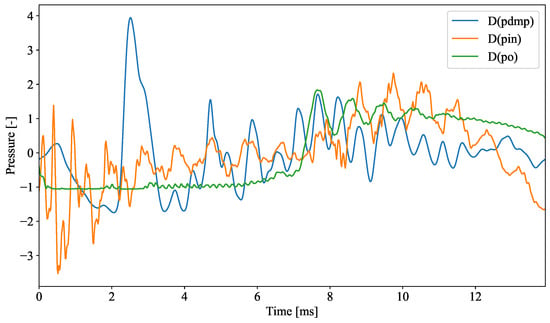
Figure 2.
Pressure signals from an individual sample. The pressure signal of the hydraulic rock drill was collected when fault D occurred with the pdmp, pin, and po sensors. The pressure data were normalized and, hence, we did not add the unit.
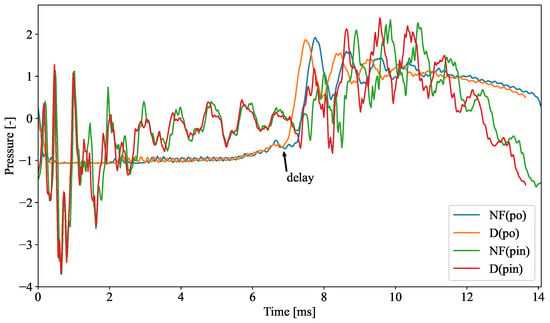
Figure 3.
Comparison of pressure traces for the NF class and fault D. Based on the introduction of the fault, there is a delay at the time of approximately 6.88 ms, whereas the differences can be covered by operator differences. Without referencing the NF pressure trace, it is difficult to determine the class of fault. The pressure data were normalized and, hence, we did not add the unit.
The dataset used in this study contains data from eight operators. The faults are divided into 11 classes with 300 to 700 cycles per class; each sample contains data from 3 sensors. The number of sample points in the training set is between 571 and 748. In the 2022 PHM Conference Data Challenge, time series no. 7 and no. 8 were used for final ranking. Therefore, the ground−truth labels for time series no. 7 and no. 8 are unknown. To generate a large number of samples, a time series of several seconds was collected and divided into individual impact cycles. The structure of the data from time series no. 1 to no. 6 is presented in Figure 4 [2].
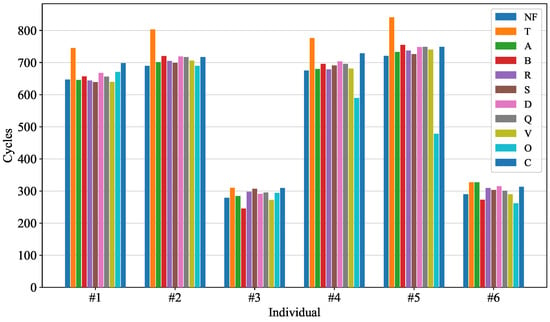
Figure 4.
The number of samples of each individual and the number of samples of each class.
2.2. Data Preprocessing
2.2.1. Normalization
To improve the performance of the model and stability of training, the data were standardized as follows:
where x is the time series of a single impact cycle, and and are the mean and standard deviations of the corresponding impact cycle, respectively [2].
2.2.2. Noise
We added 50 dB of Gaussian noise to the training data for some models to enhance their robustness. The Gaussian noise is defined as follows:
where M is a randomly generated sequence obeying a normal distribution, is the signal−to−noise ratio, which is set to 50 in this study, and is the effective power of the signal, which can be calculated as follows [16]:
2.2.3. Uniform Sample Length
To avoid the effect of the sample length on the model performance and the use of mini−batches during the model training, a fixed input size is required. Common methods for unifying the length of time series data include splitting and padding [17]. Two uniform sample lengths are presented in Figure 5. When the padding method is used, the fixed length is defined as follows:
where is the length of sample 1 and N is the number of samples. For samples shorter than , we add zeros on both sides until the required length is achieved. When the splitting method is used, the fixed length is defined as follows:
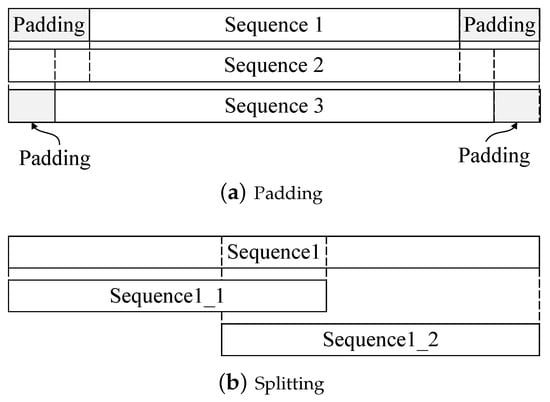
Figure 5.
Diagram of the unified length of the time series data.
The splitting method divides a sample into two subsamples. Excluding samples with and , both types of subsamples contain overlaps, which guarantees the integrity and continuity of the samples.
In this study, the length of the samples ranged from 571 to 748. We selected a short length of 374 as the fixed output length to increase the number of samples, reduce the dependence of the network on a small number of samples, and disperse the feature information across more samples [18].
3. Methods
3.1. Baseline Model
Since x−vectors capture the characteristics of time series that may not have been seen during DNN training and are robust to data with varying distributions, we utilized x−vectors for the fault classification of hydraulic rock drills. The DNN used for extracting x−vectors supports the mapping of indeterminate−length sequence data into fixed−length x−vectors to adapt to diverse data. Unlike a long short−term memory (LSTM) network, the DNN based on a time−delay neural network (TDNN) supports parallel operation, which effectively improves the training efficiency of the model. Additionally, such a structure is helpful for x−vectors in terms of learning broader contextual information through multiple layers of TDNNs [19]. The DNN parameters are presented in Table 3, and the network structure of the DNN is presented in Figure 6, where lines of the same color represent the same weight [20,21,22]. The DNN is composed of TDNNs, statistical pooling layers, and embedding layers. The characteristics of each layer are described below.

Table 3.
The architecture of the DNN. The x−vectors are extracted at layer segment6, before the nonlinearity.
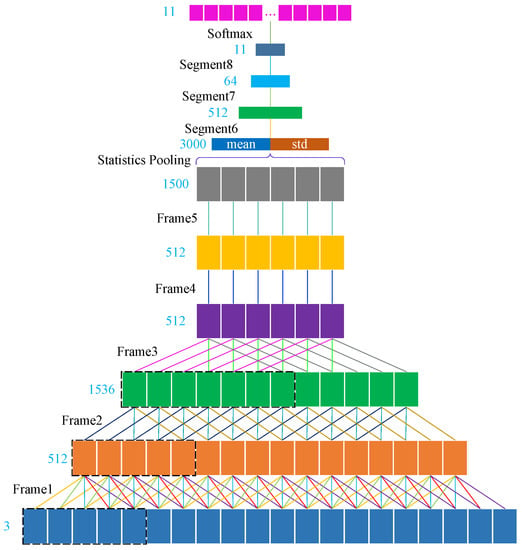
Figure 6.
The DNN used for x−vector extraction. Lines with the same color between each layer represent the same weight. “mean” and “std” denote the mean and standard deviations of features.
- The input for a TDNN is a patchwork of historical, current, and future features. For time series, TDNNs have the same ability as LSTM in terms of extracting contextual information, but retain the parallel computing capabilities of a CNN. In our DNN, five layers of TDNNs are used for feature extraction [22].
- Statistical pooling layers calculate the means and standard deviations of the features extracted by the TDNNs and aggregate all of the time−dimension information of the time series. The means and standard deviations are then combined to form new features.
- The embedding layers perform embedding and classification. The embeddings extracted from the affine components of layer segment6 are x−vectors. Following segment7 mapping, the predicted probabilities are outputted through a softmax layer [23].
3.2. Loss Function
The cross−entropy loss was used to measure the performance of the classification model on classification tasks. For multi−classification tasks, the cross−entropy loss function is defined as
where is the prediction result and y is the ground−truth class. Although the cross−entropy loss function can achieve good performance on most tasks, it cannot address the problems of class imbalance and differences in classification difficulty. In this study, the numbers of sample classes were approximately evenly distributed, but there were differences in terms of classification difficulty. Therefore, the focal loss was adopted to solve the problem of classification difficulty differences and is defined as follows:
where is a weighting factor used to adjust the imbalance of sample classes that is set to one in this study. is a modulating factor that smoothly increases the weight of samples that are difficult to classify and was set to two in this study [24].
3.3. Hyperparameters
There are 6 time series in total (i.e., no. 1 to no. 6). In each cross−validation round, we utilized one of them as the test set, and the others for training and validation (with a ratio of 95%:5%). The time series data were split into equal lengths of 374. The network and training processes used in this study were implemented in PyTorch [25]. We trained the model for 200 epochs using a mini−batch size of 128 [26]. We used the Adam optimizer with , , and [27]. The learning rate was changed over time as follows:
3.4. Evaluation Metrics
According to the rules of the 2022 PHM Conference Data Challenge, the performance of our model was evaluated based on accuracy, which is defined as follows:
In our experiments, to evaluate the robustness of our model, we considered one of the six datasets as a testing set and the remaining data as the training set for cross−validation. The average accuracy (AA) of the six test sets was considered as the overall evaluation metric. The formula for AA is defined as follows:
where D is the number of datasets, which was six in this study. Considering the large differences between the numbers of samples in each dataset, to eliminate the influence of this factor, we also introduced the average weighted accuracy (AWA) as an evaluation metric, which is defined as follows:
4. Experimental Results
According to the rules of the 2022 PHM Conference Data Challenge, time series no. 7 and no. 8 were used for the final testing and ranking of our model. These time series contain 7935 and 8461 samples, respectively. The test results demonstrate that our method achieved 99.97% accuracy on these testing sets. Considering the lack of ground−truth labels for time series no. 7 and no. 8, we utilized time series no. 1 to no. 6 to evaluate the performances of various fault classification models.
4.1. Cross−Validation Performance
In traditional cross−validation, samples from the same individual may appear in both the training and testing sets. However, the similarity between such samples can lead to information leakage, resulting in an overly optimistic performance evaluation. Considering the practical implications of fault classification models for the fault diagnosis of hydraulic rock drills, we reserved all samples from an individual as a testing set and defined the training and development sets using the remaining datasets [28].
Specifically, we reserved the datasets corresponding time series no. 1, no. 2, no. 3, no. 4, no. 5, and no. 6 as testing sets and used the remaining datasets to train our model for six−fold cross−validation. The training details in terms of accuracy and loss versus the number of epochs are presented in Figure 7. To ensure the model performance on the testing set, we trained for a total of 200 epochs. However, during training, the models for all folds reached convergence within a short period (approximately 80 epochs). To observe the changing trends of loss and accuracy conveniently, we monitored these changes closely over the first 100 epochs. Table 4 presents the log accuracy of the models on the validation sets and the results indicate that the trained models have good generalization capabilities.
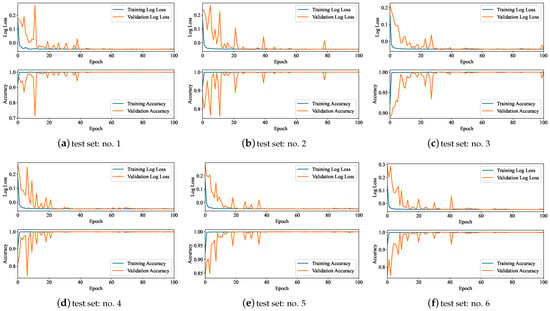
Figure 7.
Training details for six folds. To facilitate the observation, only the trends of the first 100 epochs are presented, and the log scale is used on the loss.

Table 4.
Cross−validation accuracy for different folds, and overall AA and AWA.
4.2. Performance Comparisons with Added Noise of Different SNRs
In order to enhance the robustness of the proposed method to unknown datasets, we added Gaussian noise to the training dataset. We evaluated the performance with different signal−to−noise ratios, including 10 dB, 20 dB, 30 dB, 40 dB, 50 dB, and without noise. As shown in Table 5, the best performance on the test set corresponds to 50 dB with AA of 99.90%. Therefore, we added the Gaussian noise with a SNR of 50 dB.

Table 5.
The performances corresponding to different noise levels.
4.3. Comparisons between Different Sample Lengths
Regarding the length of the time series, five different lengths (374, 400, 500, 571, and 748) were used for testing. Time series with lengths of 374, 400, 500, and 571 were obtained by splitting, whereas time series with a length of 748 were obtained by padding. The longest sample used for training was 748, which was twice as long as 374. The shortest length used for training was 374 to ensure the integrity of sample information. The shortest testing sample length was 571 and the longest was 748. Samples with a length of 748 were obtained by adding zeroes on both sides of shorter samples.
The performances on the test set based on training with five different lengths are listed in Table 6. The test results reveal that the accuracy (corresponding to all lengths) is greater than 90%. The models trained on time series with a length of 374 yield the best performances in terms of both AA and AWA.

Table 6.
Test results of models trained using time series of different lengths.
4.4. Comparisons between Different Network Architectures
The proposed DNN based on x−vectors was compared with dense−connected convolutional networks (DenseNet) [29], bidirectional LSTM (BiLSTM), traditional SVM, and gradient−boosting decision tree (GBDT). When the SVM and GBDT are used, the original data of the three sensors are concatenated into a one−dimensional vector, which is directly input into the algorithm. During testing, the SVM and GBDT require inputs of fixed lengths. Therefore, the data must be split using the method described in Section 2.2.3. A split sample consists of two subsamples. When the predicted results for both subsamples are the same, then the results are considered the final results. When the results of the two subsamples are inconsistent, further judgment is required. To demonstrate the effects of the SVM and GBDT fully, the results of SVM(L), SVM(R), SVM(N), GBDT(L), GBDT(R) and GBDT(N) are presented. When the subsample prediction results are inconsistent, these three methods for determining the final results are defined as follows [30,31].
- SVM(L), GBDT(L): The result of the subsample on the left is the final result.
- SVM(R), GBDT(R): The result of the subsample on the left is the final result.
- SVM(N), GBDT(N): When the prediction results of two subsamples are inconsistent, it is considered to be a prediction error.
The performances of the five networks on the test set are presented in Table 7. The experimental results reveal that x−vectors have obvious advantages over other network structures with AA and AWA values reaching 99.91% and 99.90%, respectively. In particular, on time series no. 1, the x−vectors achieve the best results.

Table 7.
Test results of models trained using different networks.
The x−vectors and embeddings extracted from DenseNet and BiLSTM were reduced to two dimensions using PCA; t−distributed stochastic neighbor embedding (t−SNE) images were generated [32]. Considering time series no. 1, which contains a large number of difficult samples, for example, the t−SNE images of the three embeddings are presented in Figure 8 [33]. In the t−SNE diagram, the x−vectors clearly distinguish each sample type. There are a small number of errors in the embeddings extracted by DenseNet between the classes of NF and fault R, whereas the embeddings extracted by BiLSTM fail to distinguish several classes. The x−vectors extracted by our DNN provide a clearer mapping relationship with the classes of samples.

Figure 8.
t−SNE images of embeddings for different networks.
4.5. Comparisons between Different Loss Functions
The focal loss was adopted in this study to focus on difficult samples during model training. We considered the common cross−entropy loss and focal loss for testing. Table 8 presents the accuracy for each dataset on the test set. The results reveal that the model using focal loss provides higher accuracy on difficult series (e.g., time series no. 1), compared to the cross−entropy loss.

Table 8.
Test results of models trained using different loss functions.
Considering time series no. 1, which yields different accuracy values for the two loss functions, as an example, the distribution of error samples is presented in Figure 9. For time series no. 1, the main error produced by the model is the prediction of NF samples as other classes of faults. Compared to cross−entropy loss, focal loss yields fewer sample prediction errors for the NF class and no sample prediction errors for the other classes. Therefore, it can be concluded that focal loss is more effective for classifying difficult samples.
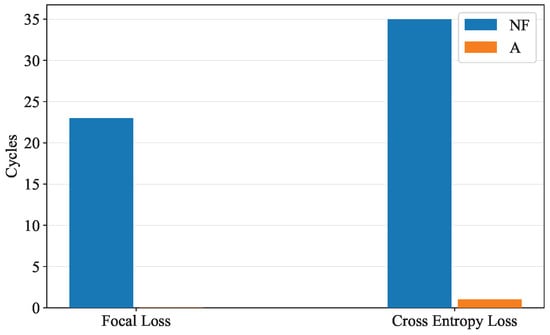
Figure 9.
Sample prediction errors for time series no. 1. The models trained with cross−entropy loss and focal loss both have difficulty in accurately predicting the NF class. The model trained with cross−entropy loss fails to predict thirty−five NF samples and one fault A sample. The model trained with focal loss only incorrectly predicts a single NF sample.
5. Conclusions
Inspired by the excellent performance of x−vectors for feature extraction from time series, we introduced x−vectors from the field of voiceprint recognition to the fault classification of a hydraulic rock drill for the first time. We adopted an end−to−end neural network to realize the joint optimization of feature learning and classification, avoiding the tedious process of manual feature extraction and the issue of error accumulation. By adopting a time−series splitting technique, inconsistent time series lengths were resolved, and the issue of distribution differences between datasets was alleviated. Compared to DenseNet, BiLSTM, SVM, and GBDT, DNN with x−vectors can extract more enhanced contextual information. Statistics pooling enables the network to accept time series of different lengths, increasing the practicability of the model. The focal loss was used to improve the performance of the developed model on difficult samples. Experimental results demonstrated that the proposed method provides superior robustness and classification performance with an average accuracy of 99.92%. It should be noted that the samples utilized in this paper were collected from a limited number of hydraulic rock drills. Additional samples are required to enhance the generalization ability of the developed model.
Author Contributions
Conceptualization, H.L.; funding acquisition, L.Z.; investigation, T.G. (Tian Gao), T.G. (Tao Gong) and J.W.; methodology, H.L. and T.G. (Tian Gao); project administration, J.W.; resources, L.Z.; software, T.G. (Tao Gong); validation, T.G. (Tian Gao); visualization, H.L.; writing—original draft, H.L.; writing—review and editing, L.Z. All authors have read and agreed to the published version of the manuscript.
Funding
This research was funded by the Fundamental Research Funds for the Central Universities (grant number 2019ZDPY17).
Data Availability Statement
The data utilized in this work is available at https://data.phmsociety.org/2022-phm-conference-data-challenge/.
Conflicts of Interest
The authors declare no conflict of interest.
References
- Gao, H.; Wang, Q.; Jiang, B.; Zhang, P.; Jiang, Z.; Wang, Y. Relationship between rock uniaxial compressive strength and digital core drilling parameters and its forecast method. Int. J. Coal Sci. Technol. 2021, 8, 605–613. [Google Scholar] [CrossRef]
- Jakobsson, E.; Frisk, E.; Krysander, M.; Pettersson, R. A Dataset for Fault Classification in Rock Drills, a Fast Oscillating Hydraulic System. In Proceedings of the Annual Conference of the PHM Society, Nashville, TN, USA, 1–4 November 2022; Volume 14. [Google Scholar] [CrossRef]
- Shen, Q.; Wang, Y.; Cao, R.; Liu, Y. Efficiency evaluation of a percussive drill rig using rate-energy ratio based on rock drilling tests. J. Pet. Sci. Eng. 2022, 217, 110873. [Google Scholar] [CrossRef]
- Liu, X.; Yang, X.; Shao, F.; Liu, W.; Zhou, F.; Hu, C. Composite multi-scale basic scale Entropy based on CEEMDAN and its application in hydraulic pump fault diagnosis. IEEE Access 2021, 9, 60564–60576. [Google Scholar] [CrossRef]
- Berend, D.; Xie, X.; Ma, L.; Zhou, L.; Liu, Y.; Xu, C.; Zhao, J. Cats are not fish: Deep learning testing calls for out-of-distribution awareness. In Proceedings of the 35th IEEE/ACM International Conference on Automated Software Engineering, Melbourne, Australia, 21–25 September 2020; pp. 1041–1052. [Google Scholar]
- Zhang, B.; Zhou, C.; Li, W.; Ji, S.; Li, H.; Tong, Z.; Ng, S.K. Intelligent Bearing Fault Diagnosis Based on Open Set Convolutional Neural Network. Mathematics 2022, 10, 3953. [Google Scholar] [CrossRef]
- Li, Y.; Luo, Y.; Wu, X. Fault diagnosis research on impact system of hydraulic rock drill based on internal mechanism testing method. Shock Vib. 2018, 2018, 4928438. [Google Scholar] [CrossRef]
- Jakobsson, E.; Frisk, E.; Krysander, M.; Pettersson, R. Fault Identification in Hydraulic Rock Drills from Indirect Measurement During Operation. IFAC-PapersOnLine 2021, 54, 73–78. [Google Scholar] [CrossRef]
- Jakobsson, E.; Frisk, E.; Krysander, M.; Pettersson, R. Time Series Fault Classification for Wave Propagation Systems with Sparse Fault Data. arXiv 2022, arXiv:2203.16121. [Google Scholar]
- Lei, Y.; Jiang, W.; Jiang, A.; Zhu, Y.; Niu, H.; Zhang, S. Fault diagnosis method for hydraulic directional valves integrating PCA and XGBoost. Processes 2019, 7, 589. [Google Scholar] [CrossRef]
- Huang, K.; Wu, S.; Li, F.; Yang, C.; Gui, W. Fault diagnosis of hydraulic systems based on deep learning model with multirate data samples. IEEE Trans. Neural Netw. Learn. Syst. 2021, 33, 6789–6801. [Google Scholar] [CrossRef]
- Yang, S.y.; Ou, Y.b.; Guo, Y.; Wu, X.m. Analysis and optimization of the working parameters of the impact mechanism of hydraulic rock drill based on a numerical simulation. Int. J. Precis. Eng. Manuf. 2017, 18, 971–977. [Google Scholar] [CrossRef]
- Ruiz, A.P.; Flynn, M.; Large, J.; Middlehurst, M.; Bagnall, A. The great multivariate time series classification bake off: A review and experimental evaluation of recent algorithmic advances. Data Min. Knowl. Discov. 2021, 35, 401–449. [Google Scholar] [CrossRef]
- Ioffe, S.; Szegedy, C. Batch normalization: Accelerating deep network training by reducing internal covariate shift. In Proceedings of the International Conference on Machine Learning, PMLR, Lille, France, 7–9 July 2015; pp. 448–456. [Google Scholar]
- PHMSociety. 2022 PHM Conference Data Challenge. Available online: https://data.phmsociety.org/2022-phm-conference-data-challenge/ (accessed on 10 February 2023).
- Fields, T.; Hsieh, G.; Chenou, J. Mitigating drift in time series data with noise augmentation. In Proceedings of the 2019 International Conference on Computational Science and Computational Intelligence (CSCI), Las Vegas, NV, USA, 5–7 December 2019; pp. 227–230. [Google Scholar]
- Liu, G.; Dundar, A.; Shih, K.J.; Wang, T.C.; Reda, F.A.; Sapra, K.; Yu, Z.; Yang, X.; Tao, A.; Catanzaro, B. Partial Convolution for Padding, Inpainting, and Image Synthesis. IEEE Trans. Pattern Anal. Mach. Intell. 2022, 1–15. [Google Scholar] [CrossRef]
- Cui, Z.; Chen, W.; Chen, Y. Multi-scale convolutional neural networks for time series classification. arXiv 2016, arXiv:1603.06995. [Google Scholar]
- Zaheer, S.; Anjum, N.; Hussain, S.; Algarni, A.D.; Iqbal, J.; Bourouis, S.; Ullah, S.S. A Multi Parameter Forecasting for Stock Time Series Data Using LSTM and Deep Learning Model. Mathematics 2023, 11, 590. [Google Scholar] [CrossRef]
- Greff, K.; Srivastava, R.K.; Koutník, J.; Steunebrink, B.R.; Schmidhuber, J. LSTM: A search space odyssey. IEEE Trans. Neural Netw. Learn. Syst. 2016, 28, 2222–2232. [Google Scholar] [CrossRef]
- Graves, A.; Schmidhuber, J. Framewise phoneme classification with bidirectional LSTM and other neural network architectures. Neural Netw. 2005, 18, 602–610. [Google Scholar] [CrossRef]
- Waibel, A.; Hanazawa, T.; Hinton, G.; Shikano, K.; Lang, K.J. Phoneme recognition using time-delay neural networks. IEEE Trans. Acoust. Speech Signal Process. 1989, 37, 328–339. [Google Scholar] [CrossRef]
- Snyder, D.; Garcia-Romero, D.; Sell, G.; Povey, D.; Khudanpur, S. X-vectors: Robust dnn embeddings for speaker recognition. In Proceedings of the 2018 IEEE International Conference on Acoustics, Speech and Signal Processing (ICASSP), Calgary, AB, Canada, 15–20 April 2018; pp. 5329–5333. [Google Scholar]
- Lin, T.Y.; Goyal, P.; Girshick, R.; He, K.; Dollár, P. Focal loss for dense object detection. In Proceedings of the IEEE International Conference on Computer Vision, Venice, Italy, 22–29 October 2017; pp. 2980–2988. [Google Scholar]
- Paszke, A.; Gross, S.; Massa, F.; Lerer, A.; Bradbury, J.; Chanan, G.; Killeen, T.; Lin, Z.; Gimelshein, N.; Antiga, L.; et al. Pytorch: An imperative style, high-performance deep learning library. Adv. Neural Inf. Process. Syst. 2019, 32, 8024–8035. [Google Scholar]
- Kandel, I.; Castelli, M. The effect of batch size on the generalizability of the convolutional neural networks on a histopathology dataset. ICT Express 2020, 6, 312–315. [Google Scholar] [CrossRef]
- Kingma, D.P.; Ba, J. Adam: A method for stochastic optimization. arXiv 2014, arXiv:1412.6980. [Google Scholar]
- Zou, L.; Huang, Z.; Yu, X.; Zheng, J.; Liu, A.; Lei, M. Automatic Detection of Congestive Heart Failure Based on Multiscale Residual UNet++: From Centralized Learning to Federated Learning. IEEE Trans. Instrum. Meas. 2023, 72, 1–13. [Google Scholar] [CrossRef]
- Huang, G.; Liu, Z.; Van Der Maaten, L.; Weinberger, K.Q. Densely connected convolutional networks. In Proceedings of the IEEE Conference on Computer Vision and Pattern Recognition, Honolulu, HI, USA, 21–26 July 2017; pp. 4700–4708. [Google Scholar]
- Cortes, C.; Vapnik, V. Support-vector networks. Mach. Learn. 1995, 20, 273–297. [Google Scholar] [CrossRef]
- Pedregosa, F.; Varoquaux, G.; Gramfort, A.; Michel, V.; Thirion, B.; Grisel, O.; Blondel, M.; Prettenhofer, P.; Weiss, R.; Dubourg, V.; et al. Scikit-learn: Machine Learning in Python. J. Mach. Learn. Res. 2011, 12, 2825–2830. [Google Scholar]
- Van der Maaten, L.; Hinton, G. Visualizing data using t-SNE. J. Mach. Learn. Res. 2008, 9, 2579–2605. [Google Scholar]
- Jolliffe, I.T.; Cadima, J. Principal component analysis: A review and recent developments. Philos. Trans. R. Soc. A Math. Phys. Eng. Sci. 2016, 374, 20150202. [Google Scholar] [CrossRef]
Disclaimer/Publisher’s Note: The statements, opinions and data contained in all publications are solely those of the individual author(s) and contributor(s) and not of MDPI and/or the editor(s). MDPI and/or the editor(s) disclaim responsibility for any injury to people or property resulting from any ideas, methods, instructions or products referred to in the content. |
© 2023 by the authors. Licensee MDPI, Basel, Switzerland. This article is an open access article distributed under the terms and conditions of the Creative Commons Attribution (CC BY) license (https://creativecommons.org/licenses/by/4.0/).