Article

Yet Another Effective Dendritic Neuron Model Based on the Activity of Excitation and Inhibition

1
Faculty of Engineering, University of Toyama, Toyama 930-8555, Japan
2
Department of Engineering, Wesoft Company Ltd., Kawasaki 210-0024, Japan
3
Advanced Institute of Industrial Technology, Tokyo 140-0011, Japan
4
Faculty of Electrical and Computer Engineering, Kanazawa University, Kanazawa 920-1192, Japan
*
Authors to whom correspondence should be addressed.
Mathematics 2023, 11(7), 1701; https://doi.org/10.3390/math11071701
Submission received: 27 February 2023 / Revised: 27 March 2023 / Accepted: 1 April 2023 / Published: 2 April 2023
(This article belongs to the Special Issue Dynamics in Neural Networks)

Abstract

:
Neuronal models have remained an important area of research in computer science. The dendritic neuron model (DNM) is a novel neuronal model in recent years. Previous studies have focused on training DNM using more appropriate algorithms. This paper proposes an improvement to DNM based on the activity of excitation and proposes three new models. Each of the three improved models are designed to mimic the excitation and inhibition activity of neurons. The improved model proposed in this paper is shown to be effective in the experimental part. All three models and original DNM have their own strengths, so it can be considered that the new model proposed in this paper well enriches the diversity of neuronal models and contributes to future research on networks models.

1. Introduction

Over the past two centuries, researchers have significantly advanced our knowledge of neurons, particularly regarding their morphological structures and underlying principles of action. Neurons can generally be divided into two components: cell bodies and neurites. While some neurons, such as Purkinje neurons, have dendrites and axons separated within the neurites [1], others, such as LP neurons in the crab stomach, only have axons and neurites [2]. Neurites that only receive signals are called dendrites, while those that both receive and send signals are simply referred to as neurites. Neurons are further categorized into different zones, including receptive, trigger, conducting, and output areas [3,4]. When a signal is transmitted to a neuron, it passes through the receptive zone, where it is received in a stepped graded electrogenesis. In the trigger zone, the axon initial segment integrates electrical signals to determine whether to generate a nerve impulse. The conducting zone consists of axons that transmit nerve impulses as a stepped electrical signal to the output zone, which transmits substances or releases electricity to affect the next neuron [5,6,7,8]. As cells in the central nervous system (CNS), neurons receive and transmit electrochemical signals through neurotransmitters. They are anatomically designed to facilitate the reception and diffusion of information [9], with axons sending signals and dendrites receiving signals from other neurons. Neurons can also be classified as either excitatory or inhibitory, depending on the type of signal they release, which can depolarize or hyperpolarize their target neurons. Neurotransmitters mediate the propagation of electrical signals and produce excitatory or inhibitory responses in the postsynaptic membrane [10]. Prior to the current century, the reticular nervous system was the prevailing understanding of the nervous system, with the impulse signal representing the perception of information transmitted by individual neurons. As our knowledge of basic biology continues to evolve, so too does our understanding of artificial neural systems.
Recently, artificial neural networks (ANNs) have become increasingly popular across various fields, opening the door to deep learning. ANNs are known for their ease of use and ability to produce excellent results, making them suitable for almost any practical application [11]. Most mainstream deep learning models are based on multilayer parameterized McCulloch–Pitts neurons, known as neural networks [12]. Representative models include convolutional neural networks, recurrent networks, and deep residual networks [13,14,15]. However, the success of these models heavily relies on their complex structure, leading to issues such as difficulties in hyperparameter tuning, the need for large amounts of labeled training data, excessive model complexity, and low interpretability due to their black-box nature. To address these issues, sophisticated learning techniques have been proposed to improve performance. Alternative algebraic and non-neural network models, such as Bayesian deep learning, fuzzy deep learning, and generalized learning, have also been considered [16,17,18]. However, these models do not consider the basic principle of deep neural networks, i.e., the powerful information processing of individual neurons. Instead, they usually rely on theoretical statistics or other tricky learning mechanisms to improve model performance [19]. This approach does not imitate the biological nervous system but rather involves a data-driven matrix operation to solve the problem. The problem with the data-driven approach is that it requires a large amount of training data and a longer training period. This is different from how humans learn, as they do not require the same amount of training as machines to gain similar experience [20]. Therefore, further research has focused on refining bionic models to address these issues, taking inspiration from the biological nervous system.
Recently, there have been significant developments in the design of artificial neurons, resulting in numerous successful examples. Several spiking neuron models have been proposed that are inspired by the temporal information processing capacity of neurons [21]. These spiking neuron models have been incorporated into deep learning as spiking neural networks (SNNs), which have shown great potential in dealing with complex recognition and prediction tasks due to their rich temporal dynamics [22]. In addition, novel neuron models, such as the FitzHugh–Nagumo neuron model, which considers the spiking and bursting behaviors of a neuron, and the inter-layer collision neuron model, inspired by physical elastic collision scenes, have also been developed [23,24]. These third-generation neuronal models are still in the research field and are less well known outside academia, as they have not yet been commercially converted [25]. They are based on biological studies of neuronal signals limited to impulse signals, and today, they are the hottest areas of research. Engineers are continuously optimizing these third-generation neural network models in search of their application value [26]. Although convolutional neural networks are currently in a period of high application, the third generation of neural networks, such as SNN, may be used in the future to solve practical problems and replace the second generation of neural networks. From a research standpoint, neuron models that more closely mimic biology are expected to replace spiking neuron models as the mainstream of research in the future.
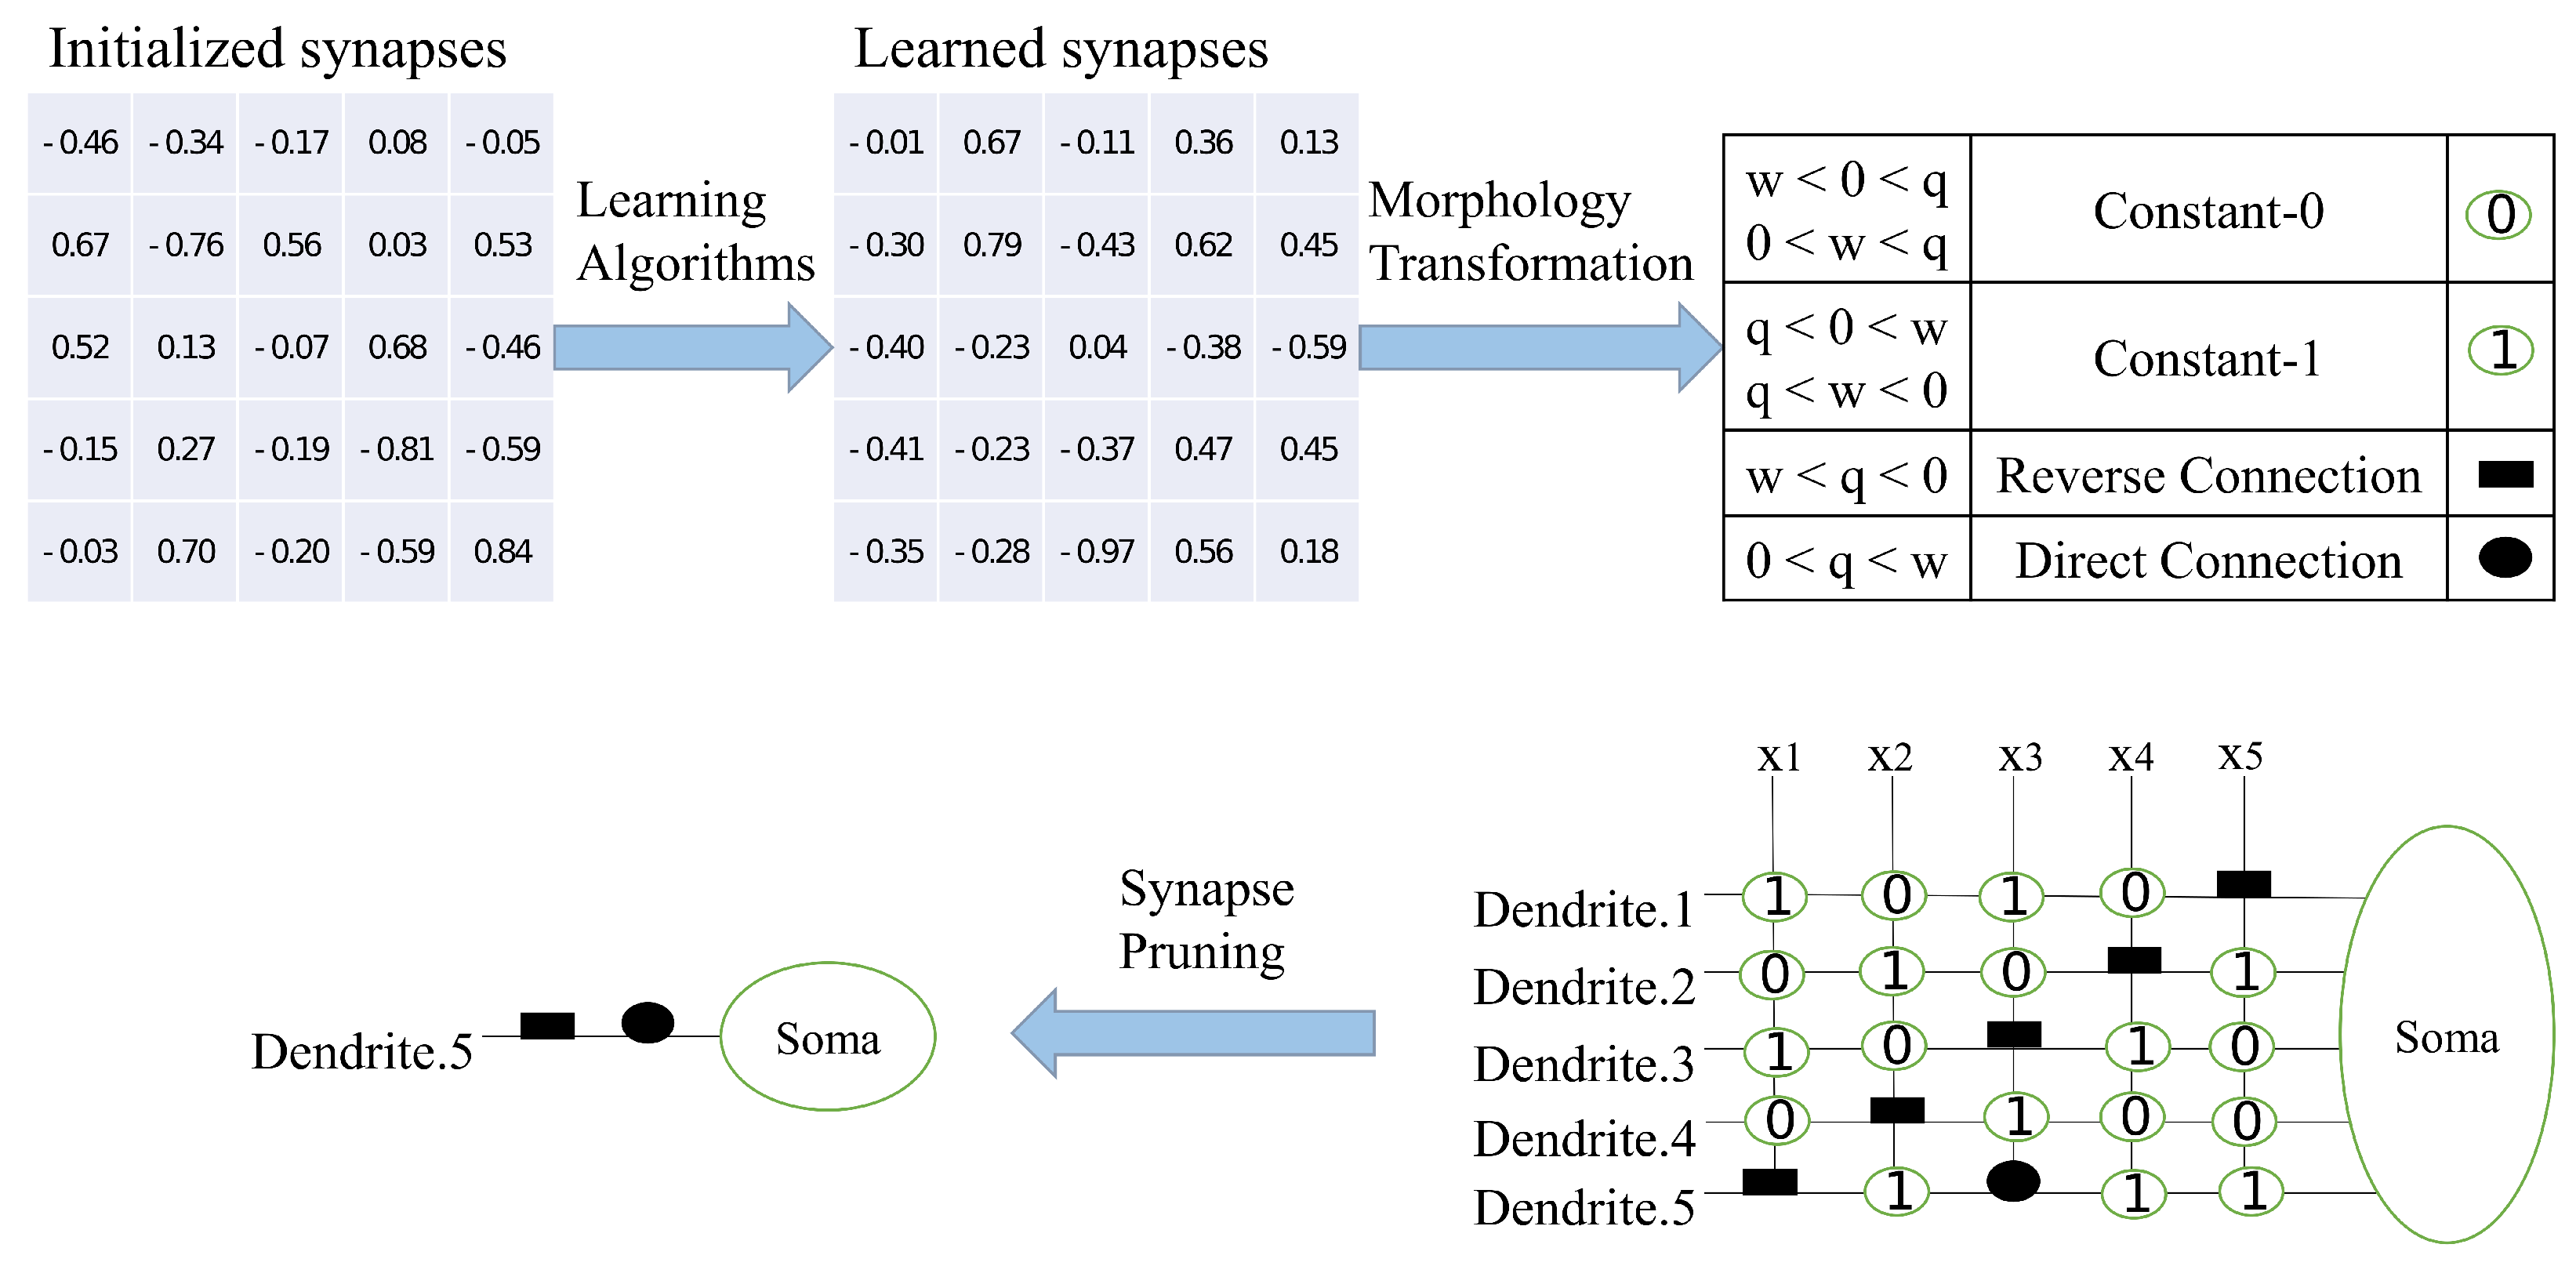
The dendritic neural model (DNM) is a mathematical model that mimics dendritic neurons found in the biological nervous system. These dendritic neurons have demonstrated independent information processing capabilities and are well suited for training in combination with evolutionary learning [27]. The DNM contains synaptic, dendritic, membrane, and cell body layers in one model [28,29]. Input data are analyzed by multiple dendrites and subsequently decided by accumulation within the cell whether to output or not. Compared to other models, DNM is closer to real neurons in terms of structure and has detailed cellular components. From the perspective of individual neurons, the DNM is simple and nonlinear, consuming fewer computational resources and being less prone to overfitting. Many studies have demonstrated the success of DNM in wind farm layout optimization, financial forecasting, and protein model prediction [30,31,32]. These examples show that the bionic neuron model is not inferior to traditional deep learning and reinforcement learning models in terms of the optimal solution. DNM is still in the early stages of research, and it is unrealistic to group them into networks at this stage. Although there are many research attempts to network DNM, its accuracy and reliability are actually lower than the mainstream machine learning methods at present [33,34]. Therefore, tools, such as evolutionary algorithms, are necessary to iteratively train and evolve a set of information in a single neuron [35,36]. Since evolutionary algorithms are inherently equipped to handle several optimization problems, there is a wealth of research in this area. Among the known evolutionary algorithms, there are metaheuristic algorithms (MHAs) inspired by real phenomena and heuristic algorithms that adapt to the problem through improvements of the MHAs. Researchers typically use different heuristic algorithms to train DNMs, as these algorithms are more powerful in terms of performance and better suited for training. In summary, DNM is a promising approach for mimicking the biological nervous system in neural network research. Future research may focus on developing more accurate and reliable DNM network models and exploring new heuristic algorithms to further optimize DNM performance.
The DNM morphological mimicry is incomplete because the principle of action of neurons is not limited to electrical signal impulses but also involves the action of neurotransmitters. Generally, in artificial neuron models, neurotransmitters are included in synaptic weights. In the case of DNMs, the use of cumulative multiplication to retain features can lead to stagnation when faced with problems involving many features. Therefore, new neurotransmitters are needed to stimulate neurons and keep them functioning effectively. However, few researchers have improved the model itself in past studies [37]. In this paper, we propose to use neurotransmitters that can bind to receptors and produce stimulant-like effects to improve DNM. Neurotransmitters can be classified into small molecules and neuropeptides. Small molecule neurotransmitters are synthesized locally within axon terminals, while neuropeptides are much larger and synthesized in the cell body [38,39]. Presynaptic neurons are responsible for synthesizing and packaging neurotransmitters into synaptic vesicles, which are released into the synaptic cleft by cytosolic action at the presynaptic neuron terminal. Neurotransmitter molecules diffuse and bind to specific receptors on the postsynaptic neuron or effector cells, altering the conformation of channel proteins and activating the second messenger system. This leads to the potentiation or metabolism of the postsynaptic neuron and induces certain effects. Neurotransmitters consist of various chemicals, such as amino acids, neuropeptides, and purines. The most common neurotransmitter in the brain and spinal cord is glutamate, which is found in over 90% of excitatory synapses. Gamma-aminobutyric acid, the second most common neurotransmitter in the brain, is found in over 90% of inhibitory synapses and does not use glutamate. All of these neurotransmitters play an important role in the balance of excitation and inhibition. Therefore, the use of a new neurotransmitter in DNM that follows the complexity of the problem itself and increases the dosage is able to improve the optimization ability of the model to some extent.
This paper proposes three improvements to DNM based on the activity of excitation and inhibition. The new neurotransmitter effects were added to the original DNM. Since the receptors at the synapse do not have a function other than receiving neurotransmitters, they do not need to be represented on the new model. Therefore, adding its action directly to the end of the dendrites, the front of the cell body, allows for a complete mimicry of neurotransmitter action in neurons under the most concise model. We named the DNM that incorporates the receptor function as DNM-R, since the processing of input signals by DNM results in weaker feedback when faced with stronger input stimuli. Specifically, the signal that passes through the dendrite contains only 70% of the intensity to the output, so it can be considered to mimic the inhibitory effect of neurons. On the other hand, a model that exhibits excitatory behavior and the opposite properties of DNM is named DNM-P. Finally, the same design as the new neurotransmitter used on DNM-R is added to DNM-P. The new neuronal model formed is named DNM-RP. It is important to note that the new model proposed in this paper is not always superior in terms of performance, nor is it intended to completely replace DNM. The idea is that different neurons have their unique problems to solve. To achieve a one-size-fits-all optimization model, a diverse range of neurons is needed to form a network consisting of multiple neurons. The three models proposed in this paper can provide some new neuronal improvement ideas for future neural networks to enrich their diversity.
This work aims to make the following contributions:
  • We add a new neurotransmitter acting on the cell body to DNM;
  • The new model proposed in this paper, validated by a large number of tests, proves to be more effective than the original model;
  • In the experiments, a new model trained with an original, unoptimized algorithm achieves performance comparable to that of the most powerful algorithm optimized for DNM training. Then it can be assumed that if the new model is used for training, better performance can be achieved in the optimization process.
Section 2 of this paper introduces the techniques being used and contains points of improvement to the model. Section 3 focuses on the comparative analysis of the data and contains some visualization of the image analysis. Section 4 contains some discussion of the new model proposed in this paper, including its advantages and disadvantages, time complexity analysis, and stability analysis. Finally, we give a summary of how the new model is applied and the plans for future improvements.

2. Methodology

2.1. Evolutionary Algorithms

The field of evolutionary algorithms has a long history of development, and even the earliest mathematical methods that include iteration and fitting have connotations that fit the definition of evolutionary algorithms. However, today, evolutionary algorithms usually refer to MHAs and heuristic algorithms. MHAs, as a method well known to algorithm researchers, are used in many optimization areas. The most famous of them are particle swarm optimization (PSO) [40], genetic algorithm (GA) [41] and artificial bee colony algorithm (ABC) [42]. The use of these algorithms is often seen in areas such as recommendation systems for video sites, distribution optimization for engineering construction, etc. A feature of MHAs is that different inspired algorithms have different characteristics and are good at optimizing different problems. Therefore, different inspired algorithms used for DNM training can have large gaps in the same problem. Heuristic algorithms, especially those that have been used in competitions for the strongest algorithms, show more consistent results overall when used to train DNM. These powerful performance algorithms balance the advantages and disadvantages of MHAs well, so researchers have often used such algorithms for improvement in some past training studies of DNM. Among the most representative algorithms are success-history based parameter adaptation for differential evolution (SHADE) [43] and self-adaptive spherical search (SASS) [44,45].

2.2. Dendritic Neural Model

In this paper, we study the DNM, and the DNM as an object consists of four cellular organs, thus serving as the input, determination and output. The first to be enabled is the synaptic layer, which consists of a sigmoid function with the formula
Y i , j = 1 1 + e k · ( w i , j · x i q i , j )
where i and j are the input index and synaptic layer index. w i , j and q i , j are the parameters evolved by the training of the DNM. x i obtained by normalizing the problem test data. k is a positive constant. There are four kinds of connection states when w i , j and q i , j have different values, including the direct, reverse, Constant-1 and Constant-0 connections, as follows:
  • 0 < q i , j < w i , j , which results in a direct connection. If x i > θ i , j , the output Y i , j tends toward 1; otherwise, it tends to be 0. In other words, regardless of the inputs, the synaptic outputs will approximate the inputs.
  • w i , j < q i , j < 0, which leads to a reverse connection. If x i > θ i , j , the output Y i , j tends toward 0. In contrast, when x i θ i , j occurs, the output Y i , j is approximately 1. In other words, regardless of the inputs, the synaptic output will receive reverse signals of the inputs.
  • w i , j < 0 < q i , j and 0 < w i , j < q i , j , which represent Constant-0 connections. In these cases, regardless of any values of the inputs, the outputs are always approximately 0.
  • q i , j < 0 < w i , j and q i , j < w i , j < 0, which indicate Constant-1 connections. In two cases, the corresponding output always tends to be 1.
where θ i , j is a threshold of a synaptic layer, which can be calculated by
θ i , j = q i , j w i , j
After a synaptic computation with branch number M, the results are first multiplied by each of them to become the result of M values. The formula for cumulative multiplication can be expressed as
Z j = i = 1 i Y i , j
Then these results are summed into one output. In the process of cumulative multiplication, any branch that contains an output of 0 will get 0 when it goes through cumulative multiplication. This phenomenon is known as the branch reduction process. The formula for accumulation can be expressed as
V = j = 1 j Z j
Finally, this result is judged in the cell body by solving another sigmoid function, which outputs a pulsed electrical signal from 0 to 1, and activation conditions are obtained by stimulating soma O s o m a . The formula for the cell body is
H = 1 1 + e k · ( V O s o m a )
The training process of DNM can be represented by Figure 1. The “pruning” function available in DNM is shown in the figure, where the number is the result of w i , j · x i q i , j in Equation (1), generally a value between −1 and 1 (few algorithms can obtain a value higher than 1). When outputting information from dendrites, dendrites that contain signal “0” in the synapse will be pruned. In the case of dendrites with successful output, all results with “1” output can be ignored because the synaptic solution is calculated by cumulative multiplication. The essence is that this group of synapses do not obtain results for this training and could not be used to stimulate Soma to make judgments about the problem. In the most extreme case, the number of dendrites is reduced to 1 so that only one set of signals is input to Soma, while in most cases, multiple sets of signals are input to Soma.
Figure 2 shows the topological architecture of DNM. DNM itself is a one-way communication method that mixes all information together. This makes it lack the ability to judge features when faced with high-dimensional problems. Combining with evolutionary algorithms, which are good at solving black-box problems, can precisely alleviate this drawback. The output of DNM is compared with the results in the training set to obtain the error. The optimal solution is obtained by reducing the error in an iterative manner. This is how a single DNM can be trained using an evolutionary algorithm, and the learning rate can also be controlled by setting a lower error limit, thereby avoiding the overfitting phenomenon. Because of the iterative capability of the evolutionary algorithm itself, the one-way propagation design of DNM becomes a model with back propagation capability. This also means that it has some learning capability and its accuracy increases with the number of iterations [46,47].

2.3. Proposed New Model

The use of the sigmoid function in DNM is not a real biological study of the signal processing of neurons but a compromise to obtain a close approximation to the impulse electrical signal and to preserve the continuous features. Of course, this is also since the mathematical resolution of individual neurons at work is not yet resolved. Under the influence of the two-layer sigmoid function, the data structure presented by the DNM approximates the inhibition in neurons, which allows it to achieve close functionality. Although the action of DNM can be changed to excitation by changing the external circuit channel, it exhibits an inhibitory effect. One of the new approach proposed in this paper is an alternative way of stimulating neurons obtained by improving the DNM, i.e., excitation. Its two underlying sigmoid functions can be expressed as
Y i , j = 1 1 + e k · ( w i , j · x i q i , j )
H = 1 1 + e k · ( V O s o m a )
Another improvement proposed in this paper is based on the neurotransmitter-inspired mimicry of nerve impulse signals with DNM, which mimics the process of neurotransmitter generation and action. The formula can be expressed as follows:
b = ( D 1 2 ) α
Z j = b · i = 1 i Y i , j
where b is the value designed to detect the complexity of the problem, and the more complex the problem, the larger the value of b. α is a factor related to the number of problem types. Since b improves the results of dendritic output, its effect is similar to that of a stimulant. However, this also leads to the possibility that neurons may also be activated to targets that should not otherwise respond, so a suitable, adaptive function can achieve a more reasonable effect from the neurotransmitter.
Moreover, D is the dimension size generated during training, which is positively related to the number of branches M and can be expressed as
D = 2 · M · J
where J is the dimensional size of the problem itself.
The action of the neurotransmitters does not affect the training process of DNM but changes its topology. Figure 3 shows the topology of DNM-R and DNM-RP. One of the changes is the addition of a new node R in the process from Y to Soma. DNM-P has the exact same topology as DNM. None of the improvements changed the training process of DNM. The realization method of the four models including the original DNM is
  • DNM uses Equations (1) and (3)–(5);
  • DNM-R uses Equations (1), (4), (5) and (8)–(10);
  • DNM-P uses Equations (3), (4), (6) and (7);
  • DNM-RP uses Equations (4) and (6)–(10).
Figure 4, from left to right, shows the single sigmoid function diagram of DNM, DNM-P, DNM-R, and DNM-RP. DNM and DNM-P show completely opposite properties in the mathematical distribution. That means the original inhibition is shown to be excitation on DNM-P. DNM-R and DNM-RP have a higher slope of the vertical axis relative to the horizontal axis when compared to DNM and DNM-P, implying more sensitivity in processing information. Similar to the comparison of DNM and DNM-P, DNM-R and DNM-RP show opposite mathematical distributions.

3. Results

In the experimental validation process, we choose ten classification problems from the UCI dataset for testing. These test sets are not up to date, but still have optimization potential, so they are ideal for use as validation models with large effects. All results are based on a personal computer with Intel(R) Core (TM) i7-9700 CPU @ 3.00GHz and 16G RAM. Table 1 shows the parameter setting of all algorithms in training DNMs. To enhance the sensitivity of parameters to features, such as k vs. qs, it is essential to adjust them according to the problem at hand. This is because the original data may contain disparity between digits, which can vary across different problems. While increasing the value of M can improve accuracy, reducing it can simplify the iterative process, particularly for more challenging problems, where achieving better results is difficult. The values of the parameters listed in Table 1 were obtained through repeated experiments and represent a more balanced approach for each problem.
All three improvements will be compared with the original DNM. In order to make the experimental results more accurate, five algorithms commonly used for training DNM were selected for the experimental procedure. The W / T / L means the amount of win/tie/loss for the current model compared to the DNM results. The bold data represent the best results for the current problem among all four models. R a n k stands for the ranking results obtained through the Friedman Rank. M e a n is the average result under thirty runs, and S t d is the variance of these thirty results. The value of the result represents the accuracy rate, and the result is 1.0 when the accuracy rate is 100%. In order to show the effectiveness of the improvements, we drew box diagrams for analysis and presentation of the results of the five algorithms for five different problems taken from the five algorithms. When analyzing the results of training four models for each algorithm, their respective advantages and disadvantages are discussed, but this is not absolute since the degree of fitness varies between algorithms and different models. This paper proposes the improvement of DNM as a means of providing some ideas for improvement rather than as a complete solution.

3.1. Result of BBO

Biogeography-based optimization (BBO) is a swarm intelligence optimization algorithm proposed by Prof. Simon in 2008 [48]. Inspired by biogeography, the design of the migration operator and the variation operator mimics the migration and variation processes of species between biogeographic habitats, respectively. Table 2 shows the results of BBO in training. From the results, all three improvements led to changes in performance, with DNM-R and DNM-RP showing the most significant improvement. On average, DNM-R demonstrated a 3% improvement in accuracy, while DNM-RP showed an average improvement of 1.6%. However, DNM-P exhibited an average accuracy decrease of −1%, possibly due to the model’s search space not being suitable for BBO, leading to local optima or overfitting. The classification problem is a practical problem, and the comparison of using the optimal result in the comparison also has some significance. Table 3 shows the best result of the algorithm in thirty runs. The best solution ranking is also the highest for DNM-RP. This means that if DNM-RP is used as the trained model, better results than DNM can be obtained. Figure 5 shows the receiver operating characteristic curve (ROC) of BBO in problem “Heart”. It means all four models tested on this problem showed their classification results to be valid, but the accuracy of the three improved models was higher. It is arguable that the improved model is more competitive and reliable than DNM for BBO. Figure 6 shows the box diagram of BBO in problem “Heart”, and the median accuracy of all three new models was better than that of the original model. In the figure, DNM and DNM-P behave close to each other and DNM-R and DNM-RP behave close to each other. This implies that the new neurotransmitter proposed in this paper plays an important role under the problem. Therefore, if BBO is employed as the training algorithm, DNM-R or DNM-RP should be preferred as the training model for the study. In practical applications, DNM-RP should be utilized as a tool since it exhibits better performance in terms of both average and best results.

3.2. Result of SASS

SASS is an adaptive spherical search (SS) algorithm, which was proposed to solve the bound-constrained non-linear global optimization problem in 2019. Table 4 shows the experimental result of SASS. From there, it is difficult for different models to achieve advantages on all problems for high-performing algorithms. For the problems “Heart” and “Ionosphere”, DNM-R showed a notable improvement in mean accuracy of over 1%, indicating significant progress. Similarly, DNM-P demonstrated remarkable performance improvement of more than 5% for “KrVsKpEW” and “Tic-tac-toe”. For DNM-RP, its role is regressive. Compared to the boost in BBO, the results shown under SASS training prove that the degree of fitness varies between algorithms and different models is important, and then a richer variety of models has a better chance to solve realistic problems. In Table 5, while comparing the best results of SASS, it is clearer to see that a single model does not have the full advantage. Although the DNM ranked highest under the overall ranking, it obtained the best results in only half of the problems; the other models still have their advantages. Figure 7 shows the ROC of SASS in problem “BreastEW”, DNM-RP has the most stable performance among them. Since different models have problems in which they excel, it can be assumed that our improvements are necessary. Figure 8 shows the box diagram of SASS in problem “BreastEW”, and the median accuracy of DNM-RP was better than that of others. It is evident that training DNM using this algorithm leads to a large number of extreme solutions, indicating the need to repeat DNM training with this algorithm multiple times in practical applications, resulting in significant waste of computational resources and time. However, if DNM-R is used as the trained model, it can be applied quickly after a short training period, thus compensating for the work performed before using a more accurate solution. Therefore, for training with SASS, we prefer to use DNM-R.

3.3. Result of CJADE

Chaotic local search-based differential evolution algorithms for optimization (CJADE) is an advanced algorithm that uses chaotic local search [49]. Due to the strong convergence ability common in differential evolutionary algorithms (DEs) as well as the weak exploration ability, its extremes often appear in DNM training. Because CJADE emphasizes local search, its risk of falling into a local optimum is also greatly increased (good results will be better, and poor results will be worse). Table 6 and Table 7 show the average results and the best results of CJADE training. The new models somewhat optimize the search structure for most problems, thus producing fewer extreme values and more stable results. Therefore, in the training of CJADE, the results of all three new models are better than DNM. In the experiments conducted using CJADE, it was observed that the problem “SpectEW” consistently achieved the best results when trained with the first three algorithms using DNM. This suggests that DNM is well suited for solving this problem, and it may not be advisable to use the new model for similar problems. The comparison of the best results shows that DNM-R and DNM-RP with the new neurotransmitter is a more suitable model compared with DNM. This certainly validates the validity of this design once again. The results of DNM are clearly invalid for the question “Ionosphere”, while DNM-R and DNM-RP improve the accuracy to over 90%, which is a huge improvement compared to the 18% accuracy of DNM. Compared to DNM, DNM-RP improves accuracy by an average of 10%, DNM-R improves accuracy by an average of 10.5%, and DNM-P improves accuracy by only 1.8%. Figure 9 shows the ROC of CJADE in problem “Ionosphere”. Among them, the results of DNM and DNM-P showed that their training was useless, and DNM-RP, although improved, was still useless. Only the training of DNM-R showed full validity. Figure 10 shows the box diagram of CJADE in problem “Ionosphere”, and the median accuracy of all three new models was better than that of the original model. Due to its higher median and extremely high stability, DNM-P is considered to be the preferable option for this problem. However, given that the combined performance of DNM-P is not impressive, it would be best to use DNM-RP when dealing with a new and unresolved problem. Since DNM and DNM-RP are identical in the best results of problem “SpectEW”, and the average ranking of DNM-RP is better than that of DNM and the comparison of repeated experiments is better than that of DNM, there is no problem in using DNM-RP instead of DNM.

3.4. Result of SCJADE

SCJADE is an improvement based on CJADE [50], and its improvement in chaotic local search has further enhanced the algorithm exploitation capability. The performance demonstrated by this most biased exploitation algorithm on neuron training is also of reference value because it may exhibit more extreme results, such as higher best accuracy and worse lowest accuracy. With this type of algorithm, there is an opportunity to explore results that cannot be obtained with other algorithms for a problem. Table 8 and Table 9 show the average results and the best results of SCJADE training. The results show a high degree of similarity to CJADE, and it can be concluded that upgrading the exploitation capability of the algorithm does not lead to significant improvements when training DNMs to solve classification problems. However, in the ranking of the best results, all the improved models achieved a better ranking than DNM. More exploitation algorithms are more capable of training neurons to obtain better best results. Compared to DNM, DNM-RP improves accuracy by an average of 9.7%, DNM-R improves accuracy by an average of 10.8%, and DNM-P improves accuracy by only 1.6%. Compared to CJADE, there is less accuracy improvement when training with SCJADE. Figure 11 shows the ROC of SCJADE in problem “CongressEW”. The graph likewise shows that training on the DNM-R is the best, which is also the same as for CJADE. Figure 12 shows the box diagram of SCJADE in problem “CongressEW”; the median accuracy of DNM-RP is better than that of others. When it comes to training with SCJADE, we highly recommend using DNM-R and DNM-RP models with new neurotransmitters, as they showed the best performance. Based on the training outcomes of CJADE and SCJADE, we conclude that using this class of algorithms to train neurons is not a good option since they both significantly underperformed compared to BBO and SASS.

3.5. Result of SHADE

SHADE has a better balance in the search process compared to the improvements of CJADE for DE. In the past with DNM training, it could always achieve the best results as well. Table 10 and Table 11 show the average results and the best results of SHADE training. The results also show that none of the three improved models can achieve an advantage for the full problem when trained with a more powerful algorithm, such as SHADE. Instead, improvements in some specific problems proved to be valuable for model improvements. Overall, DNM-R exhibits accuracy comparable to DNM, with a slight overall improvement. On the other hand, DNM-RP shows a slightly lower accuracy rate compared to DNM. When analyzed in conjunction with the results of DNM-P, this can be attributed to the unfavorable effect of neuronal excitation improvement on SHADE training. However, this does not prove that our improvement is meaningless because DNM-P and DNM-RP have the best accuracy in some problems, such as “KrVsKpEW” and “BreastEW”. Figure 13 shows the ROC of SHADE in problem “Australia”. The images show that all four models have some effect on the training of this problem. Figure 14 shows the box diagram of SHADE in problem “Australia”, and the median accuracy of DNM-RP was better than that of others. Although the best result of DNM is clearly better than the other three models, such extreme values require more computational resources to be obtained, so it can better save computational resources when using DNM-RP. Therefore, the trade-off between models becomes difficult when using SHADE as the training algorithm. In terms of results, a more balanced outcome can be achieved using DNM or DNM-R, which is beneficial for dealing with unknown problems. For problems that require higher accuracy, we suggest training all four models to obtain the best results.

4. Discussion

After analyzing the results of the five algorithms in four models, it is known that the new model proposed in this paper is effective and valuable. However, we still need further analysis of the four models to explore whether they are inseparable. In this section, we will train with SHADE as the only algorithm for a fair analysis of the results. Table 12 shows the average running times of every problem. The running times of all four models are very close to each other. Therefore, it can be considered that the computational speed of all four models in this paper depends on the training algorithm rather than the models themselves. From the data, it is evident that the training time for DNM is very short, taking only five hours to train thirty runs for each of the ten problems. Even if all four models are trained continuously, the time and computational resources spent are acceptable. Therefore, it is feasible to use all four models for training when solving problems with high accuracy requirements and low time requirements. However, for problems with low accuracy requirements and high time requirements, a model with a better chance of achieving a feasible solution should be chosen. After analyzing all the data, the models suitable for each problem are summarized for the ten classification problems used in this paper. Table 13 shows the conclusion of it. When using SHADE as a training algorithm, we recommend using DNM-R as a single neuron model because it achieved the best performance in three of the ten problems. Although DNM-P also achieved the best results in the three problems, its performance on the inferior problems was too far away compared to DNM and therefore is not recommended. However, if computational and time resources are not an issue, we suggest using all models as training objects, as this could lead to the optimal solution. Due to the fast training speed of DNM, we highly recommend solving the problem in this manner. When training a single neuron using algorithms other than SHADE, it is more likely to achieve good results by using DNM-RP. This holds true for algorithms such as BBO, SASS, CJADE, and SCJADE. Among the results of all the algorithms, only the problem “SpectEW” is definitely selected for DNM. In the absence of an algorithm for training, the use of DNM-RP is likely to lead to a feasible solution.

5. Conclusions

The three new models proposed in this paper were developed based on the activity of excitation and inhibition. Its effectiveness is demonstrated by extensive experimental data of the five algorithms. Although DNM-RP has the best overall performance in the results, it still has the problem of performing worse compared to DNM. The discussion of all four models reveals that they each have their own strengths, as do the different neuronal cells in the human central nervous system. Although a single neuron has some processing power, training a neuron to classify problems with not a large number of features shows a bottleneck in its performance. The five algorithms chosen in this paper to train four models rarely achieved more than 95% accuracy in all ten problems. Therefore, this paper argues that the proposal of more kinds of rich neuronal models is beneficial for the development of the field. Meanwhile, the network composition of more different neuronal models will be more capable of improving the ability of computers to simulate human thinking. The three new models proposed in this paper will also try to be used to optimize areas where DNM was used in the past. At the same time, the networking of these four models will be carried out together.

Author Contributions

Conceptualization, Y.Y. and H.Y.; methodology, Y.Y. and H.Y.; software, Y.Y. and H.Y.; validation, Y.Y., H.Y. and H.L.; formal analysis, H.L.; investigation, Y.Y.; resources, X.L.; data curation, C.Z.; writing—original draft preparation, Y.Y.; writing—review and editing, H.Y.; visualization, Y.Y.; supervision, Y.T.; project administration, H.Y. All authors have read and agreed to the published version of the manuscript.

Funding

This research received no external funding.

Data Availability Statement

Data will be made available upon request by contacting the corresponding author’s email address. The source code of the model will be made public through the URL: https://velvety-frangollo-5d54c2.netlify.app/ (accessed on 26 February 2023).

Conflicts of Interest

The authors declare no conflict of interest.

Abbreviations

The following abbreviations are used in this manuscript:
DNMDendritic neuron model
CNSCentral nervous system
ANNArtificial neural network
SNNSpiking neuron network
MHAsMeta-heuristic algorithms
GAGenetic algorithm
PSOParticle swarm optimization
ABCArtificial bee colony algorithm
BBOBiogeography-based optimization
SASSSpherical search algorithm
CJADEChaotic local search-Based differential evolution algorithms
SCJADEYet another state-of-the-art differential evolution algorithm
SHADESuccess-history based parameter adaptation for Differential Evolution
ROCReceiver operating characteristic curve

References

  1. Zang, Y.; Hong, S.; De Schutter, E. Firing rate-dependent phase responses of Purkinje cells support transient oscillations. eLife 2020, 9, e60692. [Google Scholar] [CrossRef] [PubMed]
  2. Zang, Y.; Marder, E. Neuronal morphology enhances robustness to perturbations of channel densities. Proc. Natl. Acad. Sci. USA 2023, 120, e2219049120. [Google Scholar] [CrossRef] [PubMed]
  3. Ramírez, O.A.; Couve, A. The endoplasmic reticulum and protein trafficking in dendrites and axons. Trends Cell Biol. 2011, 21, 219–227. [Google Scholar] [CrossRef] [PubMed]
  4. Shayani, H.; Bentley, P.; Tyrrell, A.M. A cellular structure for online routing of digital spiking neuron axons and dendrites on FPGAs. In Proceedings of the 8th International Conference—Evolvable Systems: From Biology to Hardware (ICES 2008), Prague, Czech Republic, 21–24 September 2008; pp. 273–284. [Google Scholar] [CrossRef]
  5. Bullock, T.H.; Bennett, M.V.L.; Johnston, D.; Josephson, R.; Marder, E.; Fields, R.D. The Neuron Doctrine, Redux. Science 2005, 310, 791–793. [Google Scholar] [CrossRef] [Green Version]
  6. Chklovskii, D.B. Synaptic Connectivity and Neuronal Morphology: Two Sides of the Same Coin. Neuron 2004, 43, 609–617. [Google Scholar] [CrossRef] [Green Version]
  7. Knijnenburg, T.A.; Wang, L.; Zimmermann, M.T.; Chambwe, N.; Gao, G.F.; Cherniack, A.D.; Fan, H.; Shen, H.; Way, G.P.; Greene, C.S.; et al. Genomic and Molecular Landscape of DNA Damage Repair Deficiency across The Cancer Genome Atlas. Cell Rep. 2018, 23, 239–254.e6. [Google Scholar] [CrossRef] [Green Version]
  8. Khaliq, Z.M.; Raman, I.M. Relative contributions of axonal and somatic Na channels to action potential initiation in cerebellar Purkinje neurons. J. Neurosci. 2006, 26, 1935–1944. [Google Scholar] [CrossRef] [Green Version]
  9. Doyle, J.P.; Dougherty, J.D.; Heiman, M.; Schmidt, E.F.; Stevens, T.R.; Ma, G.; Bupp, S.; Shrestha, P.; Shah, R.D.; Doughty, M.L.; et al. Application of a Translational Profiling Approach for the Comparative Analysis of CNS Cell Types. Cell 2008, 135, 749–762. [Google Scholar] [CrossRef] [Green Version]
  10. Hyman, S.E. Neurotransmitters. Curr. Biol. 2005, 15, R154–R158. [Google Scholar] [CrossRef] [Green Version]
  11. Krogh, A. What are artificial neural networks? Nat. Biotechnol. 2008, 26, 195–197. [Google Scholar] [CrossRef]
  12. Chakraverty, S.; Sahoo, D.M.; Mahato, N.R.; Chakraverty, S.; Sahoo, D.M.; Mahato, N.R. McCulloch–Pitts neural network model. In Concepts of Soft Computing: Fuzzy and ANN with Programming; Springer: Singapore, 2019; pp. 167–173. [Google Scholar] [CrossRef]
  13. Li, Z.; Liu, F.; Yang, W.; Peng, S.; Zhou, J. A Survey of Convolutional Neural Networks: Analysis, Applications, and Prospects. IEEE Trans. Neural Netw. Learn. Syst. 2022, 33, 6999–7019. [Google Scholar] [CrossRef] [PubMed]
  14. Bengio, Y.; Boulanger-Lewandowski, N.; Pascanu, R. Advances in optimizing recurrent networks. In Proceedings of the 2013 IEEE International Conference on Acoustics, Speech and Signal Processing, Vancouver, BC, Canada, 26–31 May 2013; pp. 8624–8628. [Google Scholar] [CrossRef] [Green Version]
  15. Hu, Y.; Tang, H.; Pan, G. Spiking Deep Residual Networks. IEEE Trans. Neural Networks Learn. Syst. 2021, 1–6. [Google Scholar] [CrossRef]
  16. Wang, H.; Yeung, D.Y. A Survey on Bayesian Deep Learning. ACM Comput. Surv. 2020, 53, 1–37. [Google Scholar] [CrossRef]
  17. Das, R.; Sen, S.; Maulik, U. A Survey on Fuzzy Deep Neural Networks. ACM Comput. Surv. 2020, 53, 1–25. [Google Scholar] [CrossRef]
  18. Sato, A.; Yamada, K. Generalized Learning Vector Quantization. In Proceedings of the Advances in Neural Information Processing Systems, Denver, CO, USA, 27–30 November 1995; Touretzky, D., Mozer, M., Hasselmo, M., Eds.; MIT Press: Cambridge, MA, USA, 1995; Volume 8. [Google Scholar]
  19. Miikkulainen, R.; Liang, J.; Meyerson, E.; Rawal, A.; Fink, D.; Francon, O.; Raju, B.; Shahrzad, H.; Navruzyan, A.; Duffy, N.; et al. Chapter 15—Evolving Deep Neural Networks. In Artificial Intelligence in the Age of Neural Networks and Brain Computing; Kozma, R., Alippi, C., Choe, Y., Morabito, F.C., Eds.; Academic Press: Cambridge, MA, USA, 2019; pp. 293–312. [Google Scholar] [CrossRef] [Green Version]
  20. Billard, A.G.; Calinon, S.; Dillmann, R. Learning from humans. In Springer Handbook of Robotics; Springer: Cham, Switzerland, 2016; pp. 1995–2014. [Google Scholar] [CrossRef]
  21. Izhikevich, E. Simple model of spiking neurons. IEEE Trans. Neural Netw. 2003, 14, 1569–1572. [Google Scholar] [CrossRef] [Green Version]
  22. Tavanaei, A.; Ghodrati, M.; Kheradpisheh, S.R.; Masquelier, T.; Maida, A. Deep learning in spiking neural networks. Neural Netw. 2019, 111, 47–63. [Google Scholar] [CrossRef] [PubMed] [Green Version]
  23. Linares-Barranco, B.; Sanchez-Sinencio, E.; Rodriguez-Vazquez, A.; Huertas, J. A CMOS implementation of FitzHugh-Nagumo neuron model. IEEE J. Solid-State Circuits 1991, 26, 956–965. [Google Scholar] [CrossRef]
  24. An, J.; Liu, F.; Shen, F.; Zhao, J.; Li, R.; Gao, K. IC neuron: An efficient unit to construct neural networks. Neural Netw. 2022, 145, 177–188. [Google Scholar] [CrossRef]
  25. Ghosh-Dastidar, S.; Adeli, H. Third Generation Neural Networks: Spiking Neural Networks. In Proceedings of the Advances in Computational Intelligence, Mexico City, Mexico, 22–23 June 2009; Yu, W., Sanchez, E.N., Eds.; Springer: Berlin/Heidelberg, Germany, 2009; pp. 167–178. [Google Scholar]
  26. Lee, C.; Hasegawa, H.; Gao, S. Complex-Valued Neural Networks: A Comprehensive Survey. IEEE/CAA J. Autom. Sin. 2022, 9, 1406–1426. [Google Scholar] [CrossRef]
  27. Zang, Y.; De Schutter, E. The cellular electrophysiological properties underlying multiplexed coding in Purkinje cells. J. Neurosci. 2021, 41, 1850–1863. [Google Scholar] [CrossRef]
  28. Xu, Z.; Wang, Z.; Li, J.; Jin, T.; Meng, X.; Gao, S. Dendritic neuron model trained by information feedback-enhanced differential evolution algorithm for classification. Knowl.-Based Syst. 2021, 233, 107536. [Google Scholar] [CrossRef]
  29. Tang, Y.; Song, Z.; Zhu, Y.; Hou, M.; Tang, C.; Ji, J. Adopting a dendritic neural model for predicting stock price index movement. Expert Syst. Appl. 2022, 205, 117637. [Google Scholar] [CrossRef]
  30. Ji, J.; Tang, C.; Zhao, J.; Tang, Z.; Todo, Y. A survey on dendritic neuron model: Mechanisms, algorithms and practical applications. Neurocomputing 2022, 489, 390–406. [Google Scholar] [CrossRef]
  31. Zhou, T.; Gao, S.; Wang, J.; Chu, C.; Todo, Y.; Tang, Z. Financial time series prediction using a dendritic neuron model. Knowl.-Based Syst. 2016, 105, 214–224. [Google Scholar] [CrossRef]
  32. Wang, S.; Yu, Y.; Zou, L.; Li, S.; Yu, H.; Todo, Y.; Gao, S. A Novel Median Dendritic Neuron Model for Prediction. IEEE Access 2020, 8, 192339–192351. [Google Scholar] [CrossRef]
  33. Peng, Q.; Gao, S.; Wang, Y.; Yi, J.; Yang, G.; Todo, Y. An Extension Network of Dendritic Neurons. Comput. Intell. Neurosci. 2023, 2023, 7037124. [Google Scholar] [CrossRef]
  34. Wang, R.L.; Lei, Z.; Zhang, Z.; Gao, S. Dendritic convolutional neural network. IEEJ Trans. Electr. Electron. Eng. 2022, 17, 302–304. [Google Scholar] [CrossRef]
  35. Yu, Y.; Lei, Z.; Wang, Y.; Zhang, T.; Peng, C.; Gao, S. Improving Dendritic Neuron Model With Dynamic Scale-Free Network-Based Differential Evolution. IEEE/CAA J. Autom. Sin. 2022, 9, 99–110. [Google Scholar] [CrossRef]
  36. Wang, Z.; Gao, S.; Wang, J.; Yang, H.; Todo, Y. A dendritic neuron model with adaptive synapses trained by differential evolution algorithm. Comput. Intell. Neurosci. 2020, 2020, 2710561. [Google Scholar] [CrossRef] [Green Version]
  37. Qian, X.; Wang, Y.; Cao, S.; Todo, Y.; Gao, S. MrDNM: A novel mutual information-based dendritic neuron model. Comput. Intell. Neurosci. 2019, 2019, 7362931. [Google Scholar] [CrossRef] [Green Version]
  38. Graybiel, A.M. Neurotransmitters and neuromodulators in the basal ganglia. Trends Neurosci. 1990, 13, 244–254. [Google Scholar] [CrossRef] [PubMed]
  39. Snyder, S.H. Brain Peptides as Neurotransmitters. Science 1980, 209, 976–983. [Google Scholar] [CrossRef] [Green Version]
  40. Poli, R.; Kennedy, J.; Blackwell, T. Particle swarm optimization. Swarm Intell. 2007, 1, 33–57. [Google Scholar] [CrossRef]
  41. Mirjalili, S.; Mirjalili, S. Genetic algorithm. In Evolutionary Algorithms and Neural Networks: Theory and Applications; Springer: Cham, Switzerland, 2019; pp. 43–55. [Google Scholar] [CrossRef]
  42. Karaboga, D. Artificial bee colony algorithm. Scholarpedia 2010, 5, 6915. [Google Scholar] [CrossRef]
  43. Tanabe, R.; Fukunaga, A. Success-history based parameter adaptation for differential evolution. In Proceedings of the 2013 IEEE Congress on Evolutionary Computation, Cancun, Mexico, 20–23 June 2013; pp. 71–78. [Google Scholar] [CrossRef] [Green Version]
  44. Kumar, A.; Misra, R.K.; Singh, D.; Mishra, S.; Das, S. The spherical search algorithm for bound-constrained global optimization problems. Appl. Soft Comput. 2019, 85, 105734. [Google Scholar] [CrossRef]
  45. Wang, K.; Wang, Y.; Tao, S.; Cai, Z.; Lei, Z.; Gao, S. Spherical search algorithm with adaptive population control for global continuous optimization problems. Appl. Soft Comput. 2023, 132, 109845. [Google Scholar] [CrossRef]
  46. Li, X.; Li, J.; Yang, H.; Wang, Y.; Gao, S. Population interaction network in representative differential evolution algorithms: Power-law outperforms Poisson distribution. Phys. A Stat. Mech. Its Appl. 2022, 603, 127764. [Google Scholar] [CrossRef]
  47. Yu, Y.; Gao, S.; Zhou, M.; Wang, Y.; Lei, Z.; Zhang, T.; Wang, J. Scale-free network-based differential evolution to solve function optimization and parameter estimation of photovoltaic models. Swarm Evol. Comput. 2022, 74, 101142. [Google Scholar] [CrossRef]
  48. Simon, D. Biogeography-Based Optimization. IEEE Trans. Evol. Comput. 2008, 12, 702–713. [Google Scholar] [CrossRef] [Green Version]
  49. Gao, S.; Yu, Y.; Wang, Y.; Wang, J.; Cheng, J.; Zhou, M. Chaotic Local Search-Based Differential Evolution Algorithms for Optimization. IEEE Trans. Syst. Man Cybern. Syst. 2021, 51, 3954–3967. [Google Scholar] [CrossRef]
  50. Xu, Z.; Gao, S.; Yang, H.; Lei, Z. SCJADE: Yet Another State-of-the-Art Differential Evolution Algorithm. IEEJ Trans. Electr. Electron. Eng. 2021, 16, 644–646. [Google Scholar] [CrossRef]
Figure 1. Training process of DNM.
Mathematics 11 01701 g001
Figure 2. The topological architecture of DNM.
Mathematics 11 01701 g002
Figure 3. The topological architecture of DNM-R and DNM-RP.
Mathematics 11 01701 g003
Figure 4. The function diagram of 4 models.
Mathematics 11 01701 g004
Figure 5. Accuracy obtained by BBO.
Mathematics 11 01701 g005
Figure 6. Box diagram of BBO.
Mathematics 11 01701 g006
Figure 7. Accuracy obtained by SASS.
Mathematics 11 01701 g007
Figure 8. Box diagram of SASS.
Mathematics 11 01701 g008
Figure 9. Accuracy obtained by CJADE.
Mathematics 11 01701 g009
Figure 10. Box diagram of CJADE.
Mathematics 11 01701 g010
Figure 11. Accuracy obtained by SCJADE.
Mathematics 11 01701 g011
Figure 12. Box diagram of SCJADE.
Mathematics 11 01701 g012
Figure 13. Accuracy obtained by SHADE.
Mathematics 11 01701 g013
Figure 14. Box diagram of SHADE.
Mathematics 11 01701 g014
Table 1. Parameter setting.
FunMqsk
SpectEW20.00.15.0
KrVsKpEW20.00.15.0
Vote10.00.315.0
Heart20.00.310.0
Ionosphere3.00.55.0
BreastEW3.00.55.0
CongressEW3.00.120.0
Australia5.00.320.0
German10.00.310.0
Tic-tac-toe10.00.95.0
Table 2. Experimental result of BBO.
FunBBO
DNMDNM-RDNM-PDNM-RP
MeanStdMeanStdMeanStdMeanStd
SpectEW0.79890.02850.75610.03330.61940.01710.68630.0439
KrVsKpEW0.74490.05900.88520.03270.81090.07790.89720.0390
Vote0.92190.02950.92560.01720.91610.04190.91810.0207
Heart0.85470.02450.92460.01500.89920.01980.92570.0109
Ionosphere0.93290.03820.94590.03680.78760.01370.89250.0471
BreastEW0.91100.01630.94270.01740.87020.02430.94800.0117
CongressEW0.95180.02290.95360.01440.94970.02250.95670.0141
Australia0.84280.02320.85220.01180.85010.03530.85430.0094
German0.70300.07690.73900.01670.74740.02040.73570.0207
Tic-tac-toe0.74220.02550.77470.04890.80890.01980.77180.0203
W/T/L-/-/-9/0/15/0/57/0/3
Table 3. Best result of BBO.
FunBBO
DNMDNM-RDNM-PDNM-RP
SpectEW0.84490.68980.68980.7594
KrVsKpEW0.82710.91630.91630.9421
Vote0.95000.95000.95000.9417
Heart0.93600.92930.92930.9428
Ionosphere0.94700.80130.80130.9536
BreastEW0.94710.91760.91760.9706
CongressEW0.97690.96920.96920.9846
Australia0.87440.87920.87920.8744
German0.77330.78330.78330.7633
Tic-tac-toe0.80940.83550.83550.8172
Rank2.552.652.652.15
Table 4. Experimental result of SASS.
FunSASS
DNMDNM-RDNM-PDNM-RP
MeanStdMeanStdMeanStdMeanStd
SpectEW0.80460.02760.72280.04090.68950.03330.72500.0405
KrVsKpEW0.79240.02330.84850.03100.88990.05390.78190.0492
Vote0.93060.01770.92500.01800.93390.01350.93080.0114
Heart0.85360.03750.95050.01110.93450.01390.93650.0112
Ionosphere0.94190.00280.96200.01300.79470.00000.90750.0328
BreastEW0.88410.08750.91840.01780.88880.05080.95650.0092
CongressEW0.96590.01210.95560.01080.95510.00640.95310.0118
Australia0.85520.00690.85360.01390.85560.00790.85750.0109
German0.76020.00810.74530.01530.75880.00770.74280.0118
Tic-tac-toe0.77260.03640.82490.02740.84190.01730.76140.0156
W/T/L-/-/-5/0/56/0/44/0/6
Table 5. Best result of SASS.
FunSASS
DNMDNM-RDNM-PDNM-RP
SpectEW0.83420.78610.77010.7861
KrVsKpEW0.82710.90610.91630.9366
Vote0.95830.95000.95000.9583
Heart0.96300.96970.95620.9596
Ionosphere0.94700.98010.79470.9536
BreastEW0.95290.94710.93530.9706
CongressEW0.97690.97690.96920.9692
Australia0.88890.87920.86960.8792
German0.77670.77670.77330.7600
Tic-tac-toe0.87730.89560.87730.7990
Rank2.002.053.452.50
Table 6. Experimental result of CJADE.
FunCJADE
DNMDNM-RDNM-PDNM-RP
MeanStdMeanStdMeanStdMeanStd
SpectEW0.84210.07220.66740.14710.30550.20560.70620.1297
KrVsKpEW0.47890.02860.63130.09120.52930.00880.57700.0618
Vote0.77360.12610.80830.12350.72080.18470.78640.1840
Heart0.68800.09290.80930.05390.73780.10550.81020.0607
Ionosphere0.17880.00000.71520.20010.82210.00480.67860.2348
BreastEW0.63530.00000.62630.04940.36470.00000.60240.2264
CongressEW0.79280.14640.86030.12130.73080.25290.82230.2043
Australia0.68370.17690.79690.08700.73690.12960.76490.1298
German0.35120.09820.66990.09490.73020.01150.72480.0175
Tic-tac-toe0.59200.10770.64110.09290.67630.03420.61210.1211
W/T/L-/-/-8/0/26/0/48/0/2
Table 7. Best result of CJADE.
FunCJADE
DNMDNM-RDNM-PDNM-RP
SpectEW0.91980.83960.71120.9198
KrVsKpEW0.59150.80130.57430.7183
Vote0.95000.93330.93330.9417
Heart0.84180.86200.83160.8519
Ionosphere0.17880.90730.84770.9073
BreastEW0.63530.63530.36470.9647
CongressEW0.96920.96920.96150.9692
Australia0.85990.85510.85510.8599
German0.62000.76000.75000.7533
Tic-tac-toe0.69450.79110.76500.7441
Rank2.652.003.501.85
Table 8. Experimental result of SCJADE.
FunSCJADE
DNMDNM-RDNM-PDNM-RP
MeanStdMeanStdMeanStdMeanStd
SpectEW0.89110.04810.65860.19880.32300.21630.66760.0907
KrVsKpEW0.48340.04230.60290.07550.53100.01960.57360.0517
Vote0.82110.11480.80250.12510.71560.19610.78280.1867
Heart0.73520.08590.78380.09050.76090.08220.81780.0421
Ionosphere0.17880.00000.79120.13620.82120.00000.70550.1857
BreastEW0.64000.02580.64290.04190.36470.00000.62840.2440
CongressEW0.82150.14400.87670.12510.69280.26810.87690.1606
Australia0.65190.14590.79260.11490.74440.15780.77620.1140
German0.35820.11110.67290.09910.72970.01520.72600.0189
Tic-tac-toe0.61910.09070.67310.03180.67910.03020.63740.0814
W/T/L-/-/-8/0/26/0/47/0/3
Table 9. Best result of SCJADE.
FunSCJADE
DNMDNM-RDNM-PDNM-RP
SpectEW0.91980.88770.78070.8021
KrVsKpEW0.69950.74650.63460.6854
Vote0.94170.90830.94170.9500
Heart0.85520.86200.86870.8620
Ionosphere0.17880.94700.82120.8940
BreastEW0.77650.86470.36470.9412
CongressEW0.96150.96920.96150.9692
Australia0.86470.86470.94120.8744
German0.71670.76330.75000.7567
Tic-tac-toe0.69450.73630.74930.7102
Rank3.152.052.702.10
Table 10. Experimental result of SHADE.
FunSHADE
DNMDNM-RDNM-PDNM-RP
MeanStdMeanStdMeanStdMeanStd
SpectEW0.79540.02710.73760.04670.68270.02740.74690.0317
KrVsKpEW0.79590.02730.83740.01720.91140.02670.77850.0312
Vote0.92720.01330.92610.01510.93750.00870.93190.0133
Heart0.86890.01190.88450.00940.87270.01330.88350.0066
Ionosphere0.94080.00170.95870.01230.79450.00120.91100.0211
BreastEW0.91250.04010.91550.01250.89140.01060.95220.0124
CongressEW0.95870.01130.96210.00970.95560.01140.95590.0083
Australia0.84880.00740.84570.00870.85560.00930.85800.0093
German0.75400.01520.74740.01320.74490.01020.74900.0111
Tic-tac-toe0.76760.03230.75030.02220.77760.03430.71010.0255
W/T/L-/-/-5/0/55/0/54/0/6
Table 11. Best result of SHADE.
FunSHADE
DNMDNM-RDNM-PDNM-RP
SpectEW0.83420.82890.72730.8021
KrVsKpEW0.82160.86460.91630.8599
Vote0.95000.95000.95830.9500
Heart0.91250.90240.89900.8956
Ionosphere0.94700.98010.79470.9470
BreastEW0.93530.94120.91760.9706
CongressEW0.97690.97690.97690.9692
Australia0.87920.86960.87440.8744
German0.76670.77330.76330.7733
Tic-tac-toe0.82510.80420.82770.7702
Rank2.252.252.652.85
Table 12. Run time of SHADE.
CPU Time(S)
FunDNMDNM-RDNM-PDNM-RP
Ionosphere16.015.214.815.4
Australia27.027.627.327.4
KrVsKpEW425.0419.3420.9418.6
BreastEW25.825.025.224.8
German96.494.094.094.5
Heart34.634.734.534.7
CongressEW14.614.414.514.4
SpectEW16.315.916.015.9
Tic-tac-toe38.938.938.838.9
Vote18.117.918.117.9
total712.7703.1703.9702.6
Table 13. Recommended models of SHADE.
FunSHADE
SpectEWDNM
KrVsKpEWDNM-P
VoteDNM-P
HeartDNM-R
IonosphereDNM-R
BreastEWDNM-RP
CongressEWDNM-R
AustraliaDNM-RP
GermanDNM
Tic-tac-toeDNM-P
Disclaimer/Publisher’s Note: The statements, opinions and data contained in all publications are solely those of the individual author(s) and contributor(s) and not of MDPI and/or the editor(s). MDPI and/or the editor(s) disclaim responsibility for any injury to people or property resulting from any ideas, methods, instructions or products referred to in the content.

