Abstract
With the transformation and upgrading of the world economy entering a new normal, changes in the fields of industry and consumption have brought new business opportunities, and there is a large space for the less-than-truckload (LTL) express market. Considering the urban network resource operation status, this study aims to solve the optimization problem of urban location selection for LTL express under the common delivery model. To minimize the total cost of logistics and distribution, we established an integer programming model with constraints such as radiation range and service-capacity limitations. A model with a fixed reality-node strategy, an expanded initial antibody group strategy, improved traditional elite individual retention strategy and a node-clustering strategy was introduced. An improved immune optimization algorithm was further designed to obtain globally optimal solutions. With the comparison of existing algorithms, the results verified the practicability of the proposed model to solve the urban location-selection problems for LTL express. We then conducted an empirical analysis of a real-world enterprise’s reasonable urban network location selection in a central-south city of China. The simulation results further verified the effectiveness of our proposed algorithm. This study provides new solutions and methods for resource utilization and urban network optimization of LTL-express enterprises.
Keywords:
common distribution; LTL express; urban network selection; global optimization; improved immune optimization algorithm MSC:
68T07
1. Introduction
Express, LTL express and vehicle transport are the three main modes of transport in the road freight industry. Express customers are extremely scattered and have timeliness requirements and market barriers higher than LTL express and vehicle transport. The current concentration is far ahead of the vehicle transport and LTL-express market [1,2]. LTL express mainly covers 30–3000 kg of goods, including industrial products, semi-finished products, parts and components, etc. The customers are mainly enterprise-type customers such as manufacturing enterprises, distributors and retailers. Customers are scattered, and logistics service providers need to provide services such as loading and carpooling, transshipment distribution, and distribution. The process is more complicated than vehicle transportation, and the market concentration is low grade [3,4].
LTL express represents a large market and highly dispersed market pattern. In 2023, China’s road freight logistics market will reach RMB 6 trillion, accounting for 50% of China’s logistics costs. Of this, the market size of express delivery, less-than-truckload express and vehicle transportation is about RMB 0.9 trillion, RMB 1.5 trillion and RMB 3.2 trillion, respectively. The average annual compound growth rate in the past five years was 30, 5.6 and 0.6% [3], respectively. The less-than-truckload express market is highly fragmented, with more than 200,000 market participants [5]. However, the unified market of less-than-truckload is not enough, and the allocation of logistics resources is unreasonable and insufficient. The multimodal transportation system requires improvement, particularly in addressing the low efficiency levels related to cross-mode transport and cross-operation link convergence and conversion; the standardization of transport units is not high. The whole-chain operation efficiency is not satisfactory, and the cost is huge. The stock logistics infrastructure network’s support and guidance capability for the industrial layout and domestic demand consumption under the new development pattern is not adequate [6]. Addressing the need for adaptability in logistics services requires tackling the challenges of surplus low-end service supply and shortage of high-end service supply [7,8,9]. The freight transport structure needs to be optimized, as the proportion of long-distance transport of bulk road cargo is still high. The logistics industry operates at a large scale, yet it has not fully realized the benefits of economies of scale. This is especially true in the highway freight market, where competition is highly homogeneous and unfair practices are prevalent. As a result, the industry’s level of competitiveness needs to be improved. The modern logistics system is not organized, intensive, networked or socialized, and the backbone logistics infrastructure network is not optimal. The LTL-express transportation network location problem (LTLTNLP) needs to be solved [10].
The content of this paper is summarized as follows: Section 2 focuses on the literature review; Section 3, Section 4 and Section 5 explain the variable definitions, model establishment, initial model solution and the improvement of the algorithm; Section 6 presents the empirical analysis results; Section 7 summarizes the results and draws conclusions and Section 8 describes the research discussion and conclusions.
2. Literature Review
2.1. Urban Distribution Network Location Problem
Most of the research on the allocation system has been carried out in the urban allocation system from the perspective of social benefit and enterprise benefit. With the development of e-commerce and information technology, the logistics center can usually achieve the purpose of efficient operation through the information operation of the enterprise [11], thereby reducing the unnecessary waste of resources caused by distribution, and saving costs to the enterprise itself. With the process of urbanization, the number of urban distribution vehicles and the distribution distance increases [12], which leads to the need for multiple objects in the urban distribution system to cooperate to achieve system optimization. On the one hand, with the deepening of joint distribution research, several scholars have established joint distribution systems for different industries and made preliminary progress [13]. The concept of distribution is used in terminal distribution transactions in e-commerce. On the other hand, the construction of terminal joint distribution stations can promote the sustainable development of terminal distribution networks [14].
Yuan [15] used data from the Los Angeles area of the United States; they examined the spatial distribution of warehouses and adjacent facilities related to different demographic and socio-economic characteristics, and found that the relationship between storage facilities and activities in the urban distribution networks and household income was uneven. Yang et al. [16] showed that research on the economic attributes of freight, land use, road infrastructure and road-network variables can help transportation planners to understand truck dynamics related to traffic safety [17] and develop operational measures to mitigate the impact of growth. The existing research on the location of urban logistics facilities and their impact on externalities often focuses on the start and end of freight activities within the metropolitan area, while ignoring the role of freight with origin or destination outside the metropolitan area [18]. Sakai et al. [19] applied data from the Paris region of France to collect characterization data on the location and activities of logistics facilities, revealing the key location characteristics that affect the location of logistics facilities, such as zoning regulations, wholesale work accessibility, population density and highway accessibility, and the heterogeneity of the impact of these characteristics on activity categories.
2.2. The Location Problem of Outlets in Urban Distribution Network
Up to now, researchers have made significant progress in the study of distribution-outlet location selection. Specifically, they have fully demonstrated the various factors and costs that affect the location selection of distribution outlets. Additionally, they have applied various technical methods to optimize the location-selection model and enhance the efficiency of the distribution network. Location cost has been resolved. In the static location problem of the logistics network, scholars applied both qualitative and quantitative methods. At the method level, a multicriteria decision-making method for urban network location planning under uncertainty is proposed, which can provide decision-makers with a network location method reference at the network construction level [20]. The location model constructed by mathematical equations can be applied to the location optimization of the urban logistics network, providing a good application method for intercity network coordination [21].
The logistics industry has undergone a number of innovations, including transportation algorithms, distribution equipment. At the same time, the warehousing industry has experienced changes in the scale and location of facilities, for instance, the establishment of a large number of large warehouses in the suburbs of the city [22]. With the rise of the city circle, many warehouse layouts have changed, and the environmental impact associated with warehousing activities has been increasing in recent decades. This research focuses on the uneven distribution of warehousing facilities in disadvantaged communities and explores how this difference is caused by the interaction between various socio-economic processes [23]. Holl and Mariotti [24] analyzed the impact of highway development on the performance of Spanish logistics sector enterprises, and analyzed the panel data with instrumental variable estimation. The results showed that the highway has a significant impact on the performance of logistics enterprises, but it has important spatial heterogeneity.
2.3. The Impact of Urban Distribution Nodes on the Network
Scholars have begun to pay attention to the influence of distribution network nodes and the relationship between nodes on the network structure, and quantitatively analyze the relationship between vehicles through social network analysis theory and complex network theory. Basically, study of the road network to deepen the understanding of the network structure [25]. Intercity vehicle traffic strategies and traffic management, as well as an effective emergency facility layout and rational configuration can provide new ideas for logistics enterprises [26] for cost savings in network transportation by identifying the most critical transportation routes in the urban logistics network [27]. In the study of network dynamic positioning, for example, heuristic algorithms are often used to solve discrete dynamic network localization problems [28]. The localization of hybrid facilities is also used to verify the effectiveness of the algorithm [29]. Scholars can design by the method of uncertain dynamic location problem [29], which greatly enriches the solutions of logistics location selection.
The main quantitative methods for solving the location problem with the different constraints mentioned above include the gravity center method [30], transportation planning method [31], cluster method [32,33,34,35], CFLP method [36], etc. However, most of the scholars use a heuristic algorithm or heuristic extension algorithm [37].
The literature mainly studies the optimization of dynamic and static urban network layouts and multi-objective optimization, and the optimization of the urban network layout optimization model algorithm. There are few studies on the location of the urban network of LTL-express enterprises. The existing research on the optimization of the urban network layout provides the basis of this paper, and more research is urgently needed on the optimization of the urban network layout for LTL-express enterprises.
With the consideration of the various influencing factors of the LTL-express enterprises in the common distribution environment, the minimization of the total distribution cost was taken as the goal, and the current situation of network construction was taken as the constraint condition of network location selection. At the same time, the search range of the initial antibody group was expanded, and the random probability of the selection of cross and diversity evaluation parameters was set, which improved the traditional elite individual retention strategy. Finally, an example was given to verify the accuracy and effectiveness of the proposed algorithm.
To fill the research gap, based on the development of LTL-express enterprises, this paper comprehensively considered the construction and resource allocation capabilities of enterprises and the number of network constructions, and designed an optimized integer programming model with the goal of minimizing the total cost of location and transportation. With the application of the real data of an enterprise, this study explored actual operations of the enterprise and proposed an improved immune optimization algorithm. We also introduced a variety of improvement strategies, combined with the cross iteration of the operator applied to the empirical analysis, and further verified the robustness and superiority of the improved immune optimization algorithm.
3. Model Construction
3.1. Description of Urban Network Location Problem
This paper studied the static logistics network location problem with a single distribution center, numerous demand nodes, multi-established networks, service scope constraints, and network capacity constraints. Firstly, in the process of network location selection, the specific location and demand of the established network, the location, demand, rate of each demand node, and the location data of the urban distribution center of the enterprise were taken as constraints to establish the location model with the minimum total cost of distribution as the goal. Secondly, the specific coordinate set of all LTL-express demand nodes in a city was crawled from websites. We carried out screening according to the actual situation, such as geographical conditions and enterprise construction, forecast the freight demand of each demand node according to the demand calculation formula and made corrections according to the actual market operation. It was necessary to select a certain number of addresses to establish the initial scheme of the LTL-express enterprise network. Finally, based on the initial scheme, according to the characteristics of the interaction between the established network and the new network in the network location selection of the city network, the improved immune optimization algorithm was used to obtain the final network location-selection scheme, as shown in Figure 1.
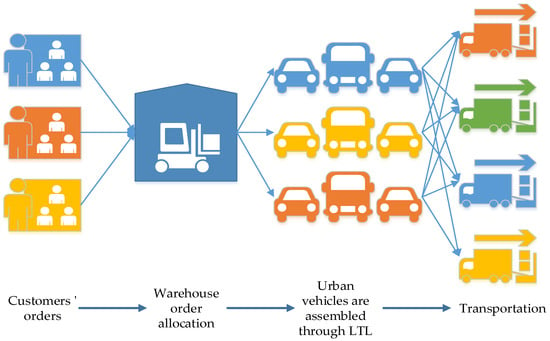
Figure 1.
Description of urban network location problem.
3.2. Hypothesis of Urban Network Location Model
Before the establishment of the model, we made the following assumptions in the logistics network location model:
- (1)
- The scale and capacity of the network can always meet the demand of the demand nodes, and it is determined by the demand within the distribution radiation range;
- (2)
- A demand node is only supplied by one network;
- (3)
- The distance between urban demand nodes is known;
- (4)
- The specific capacity and service capacity of each outlet are known;
- (5)
- Logistics and transportation costs between urban outlets are known;
- (6)
- There is a linear correlation between the service capacity level of the network and the capacity.
3.3. Establishment of Location Model for Urban Network
The symbols and descriptions involved in the model are shown in Table 1.

Table 1.
Model symbol description.
Based on the above assumptions, this model is a location model, which needs to find n terminal nodes from m demand nodes. Urban distribution should not only consider the distribution of customer demand points in the city, but also pay attention to the allocation of distribution center resources and the scheduling of transportation vehicles in the enterprise city. In general, the distribution cost should be an important factor of concern to the enterprise. The layout of multiple nodes needs to consider many factors, and the model construction should be more complex. To simplify the problem, make the calculation convenient, and be more accurate and closer to the actual situation, this paper takes the minimum total distribution cost as the optimization goal, and establishes the following model:
The constraint condition is:
The objective function is composed of transportation costs between distribution centers and demand nodes, transportation costs between logistics centers and distribution centers, and punishment costs. The objective function is composed of transportation costs between distribution centers and demand nodes, transportation costs between logistics centers and distribution centers, and punishment costs. Formula (1) indicates that n terminal nodes are selected from m demand nodes as actual terminal nodes; Formula (3) indicates that the candidate terminal nodes need to be selected when the pairing relationship is established; Formula (4) indicates whether the terminal nodes is selected; Formula (5) represents the balance of freight volume. The freight volume from demand nodes to terminal nodes is equal to the freight volume from terminal nodes to the distribution center. Formula (6) represents the capacity limitation of the terminal nodes; Formula (7) represents the terminal node’s service distance constraint; Formula (8) indicates that the number of built terminal nodes does not exceed the actual number of terminal nodes.
4. Initial Solution of the Model
The initial scheme of the urban network location model of the LTL-express enterprise is mainly solved by the basic immune optimization algorithm. Firstly, the initial scheme for generating the network location of the LTL-express enterprise is established, and the diversity of the solution is evaluated. Then, the network address is determined by immune operation. This method has a certain scientific and reference significance in the network location selection of LTL-express enterprise. The specific steps are as follows:
- (1)
- Identification of antigens.
Based on the comprehensive analysis of the problems studied, the model and other constraints for practical problems are established as antigens.
- (2)
- Generation of immune antibody groups.
The initial antibodies of the immune system are generated randomly in the range of feasible solutions.
- (3)
- Diversity assessment.
The evaluation of antibodies by the immune system includes the calculation of affinity and antibody concentration.
- (4)
- Generation of paternal cells.
The immune optimization algorithm involves the update and selection of memory cells during its operation process. By memorizing the current optimal solution and selecting new solutions, the algorithm constantly updates and screens for more excellent solutions. If memory cells show high affinity to antigens, these antibodies are stored in memory cells. Then the repulsion between antibodies was calculated, and the antibodies with the highest affinity to the antigen were deleted.
- (5)
- Degree of satisfaction of judgment results relative to the end of the calculation.
When the antibody produced by the above steps matches the antigen, the degree of matching, or meets the end conditions, the shutdown can be selected.
- (6)
- Generation of new populations.
The generation of a new population is realized by an immune operator. The calculation process of the immune operator includes selection, crossover, and mutation. The new population calculated by an immune operator is the same as natural evolution. The greater the antibody affinity, the higher the probability of being selected.
- (7)
- Output of initial location options.
5. Improved Immune Optimization Algorithm
Location problem is a typical non-deterministic polynomial (NP)-hard problem, which is difficult to solve by ordinary methods, and NP-hard problem is a computational problem that is extremely difficult to solve with current algorithms, as finding an exact solution in a reasonable amount of time is not feasible. To improve the efficiency of the solution, heuristic algorithms are widely used, among which the immune optimization algorithm has a wide range of applications and strong robustness. Therefore, before the algorithm is solved, we (1) introduced a fixed real-node strategy according to the reality of the enterprise, and fixed a certain number of selected nodes; (2) expanded the initial antibody group, adjusted the crossover and mutation probability, and diversity evaluation parameters through multiple simulations, and reset the corresponding penalty function threshold to expand the solution space; (3) improved the traditional elite individual retention strategy to retain the elite solution by the probability formula; and (4) introduced the node-clustering strategy to determine the scope and number of service demand nodes by clustering the selected nodes.
The specific implementation steps are as follows:
- (1)
- Formation of antibody groups.
In this paper, the natural number encoding rule was adopted. Each network location-selection scheme can form an antibody with length p (p represents the number of outlets), and each antibody represents the sequence of the demand nodes selected as outlets. After expanding the search range, this encoding method can meet the constraints (9) and (12).
- (2)
- Calculation of the recognition degree of antibody and antigen.
The affinity between antibody and antigen is used to indicate the recognition degree of antibody to antigen. Here, the affinity function is designed for the above network location model.
where means the objective function; the second term in the denominator indicates that the solution violates the distance constraint, and the threshold is reset from the Changsha logistics market. After several simulations, the range in [100, 200] shows that the location result is better, which is close to the actual operation level, and C takes a larger positive number.
The affinity between antibodies reflects the similarity between antibodies. It is:
where is the same number of bits in antibody and antibody ; L is the length of antibody.
- (3)
- Calculation of the proportion of antibodies.
The antibody concentration C is the proportion of similar antibodies in the population, it is:
is the total number of antibodies,; is a preset threshold.
- (4)
- Calculation of expected reproduction probability.
We expected reproductive probability in the population. The expected reproductive probability of each individual is determined by the affinity between antibody and antigen A and antibody concentration C; it is:
Among them, is a constant. The higher the individual fitness, the greater the expected reproduction probability. The greater the individual concentration, the smaller the probability of reproduction.
- (5)
- Improved elite retention strategies.
The goodness of the antibody was evaluated by combining affinity and concentration. When the reproduction probability was obtained, the average fitness of the best individuals and populations was recorded, and the parent group was formed. With the improved elite retention strategy, we applied the probability formula:. As T decreases, the probability of accepting the elite solution decreases based on the ability of immune selection and the crossover operator to move. As a result, no elite solution is accepted. is expressed as the difference between the elite solution and the current solution. Comparing the acceptance probability and random probability, we determine the choice of elite solutions, and update the memory population later.
- (6)
- Immune operation.
The probability that an individual is selected is the expected reproduction probability. The single-point crossover method is used for the crossover operation. Through randomly expanding the search range, the mutation position is selected for mutation. The selection and mutation probability formulas are used. The diversity evaluation parameters are calculated by random probability. After many simulations, the probability range and parameter range were [0.5, 0.9], [0.4, 0.8] and [0.90, 0.95].
- (7)
- Output location optimization results and algorithm iteration process.
6. Steps of Improving Immune Optimization Algorithm
The steps for improving the immune optimization algorithm are shown in Figure 2. Specifically,
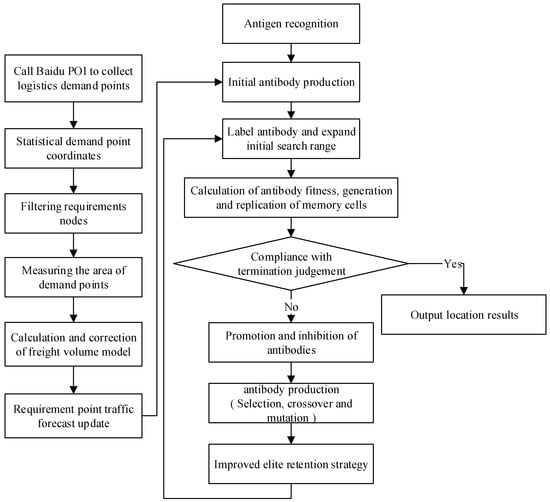
Figure 2.
Flow chart of the improved immune optimization algorithm.
- (1)
- Baidu API open source data was invoked to obtain demand nodes, which were regarded as candidate nodes, and we randomly selected N individuals as selected nodes.
- (2)
- Combined with the actual situation and based on the existing demand nodes, we entered the existing eight network coordinates as demand nodes. The attributes and logistics real estate demand nodes were marked as fixed nodes.
- (3)
- We calculated the distance between the demand nodes and the coordinate positions of each network.
- (4)
- According to the calculation formula of distribution cost, we considered the freight volume of the demand node, the freight rate of the demand node to the network node, the freight rate of the network node to the distribution center, the radiation range of the network node, etc. The distribution cost of each demand node and each network will be calculated.
- (5)
- It was judged whether the fluctuation range of the average fitness value in the fitness function of the convergence curve was smaller than [0, 0.1]. The current network location-selection scheme remains the most appropriate, provided that the system’s size remains unchanged. Otherwise, the N individuals were randomly selected and the elite retention strategy was adopted to retain the relevant individuals.
- (6)
- We determined whether the number of iterations reached the maximum. If yes, we immediately stopped the operation; otherwise, we continued the operation.
- (7)
- When the optimal location scheme was obtained, the immune algorithm convergence curve and location coordinates were output.
7. Empirical Analysis of Urban Network Location—A Case Study of Changsha City
7.1. Empirical Data of Changsha Network Location
According to the construction demands of Enterprise L, and through reasonable calculation of factors such as market share and market share proportion, the number of network location selections in a certain enterprise was set to 36. We used Python to collect, clean, and screen the data of the demand nodes; the demand nodes in Changsha were formulated as 130. Combined with the actual research situation, the freight rate of the demand noes to the network was set to 3 (RMB/ton/km), and the network to the distribution center was set to 2 (RMB/ton/km), which were determined according to the actual situation.
MATLAB was used for the empirical solution, and the appropriate expression form of the solution was designed. After the generation of the population, the evaluation was carried out to observe whether the constraint conditions were met. Otherwise, according to the calculation results of the formation of the parent group, the elite retention strategy was adopted to form a new group for further calculation. The algorithm parameters were set as follows: population size 80, memory capacity 10, iteration number 6000, crossover probability 0.5, mutation probability 0.4, diversity evaluation parameter 0.95, and the number of nodes was 36. The number of designated outlets was 8 (established network).
The details are shown in Table 2.

Table 2.
Basic parameter settings.
Selection of demand node coordinates and calculation of freight volume data.
The specific coordinates and measured area of several demand nodes are shown in Table 3 below.

Table 3.
Requirements for node information collection.
Considering the main problems that this paper aims to solve, the prediction method of the land-use planning model of the logistics park was mathematically changed, and it was flexibly changed into the demand node freight volume prediction model.
The formula is as follows:
where S is the total area of logistics park construction (104 m2); L is the total volume flow of Hunan Province (104 t) for the planning target year; for the planning target year, the proportion of third-party logistics operations through logistics parks to the total logistics operations of third-party logistics; α is the land use parameter of unit production capacity (m2/t). Through reasonable scaling analogy, S is defined as a single logistics park construction area (104 m2); L is set to predict the total amount of a single logistics park (104 t) in the planning target year; i1 and i2, and α remain unchanged.
Regarding the non-logistics park demand node-correction scheme, the non-logistics park correction formula is:
where i3 is the proportion of the operation volume of the third-party logistics through non-logistics parks in the total logistics operation volume of the third-party logistics in the planning target year, which should be greater than 1-i2 in theory, and about 30–40% according to the type of demand node i3. After market research and reference, the unit production capacity land of the non-logistics park demand node was about 0.5–0.7 times that of the logistics park, and the actual land area of the non-logistics park demand node was about 3–8 times that of the occupied area. = 2.798α was calculated by comprehensive analysis.
We reasonably inferred the total freight volume of each region through the total area of logistics park construction in each region, the proportion of third-party logistics operations in logistics parks to the total logistics operations of third-party logistics, and land-use parameters. We then calculated the total cost of distribution using the distance in the algorithm and the iteration of the model.
The freight volume distribution of the demand nodes in Changsha City is shown in Figure 3.
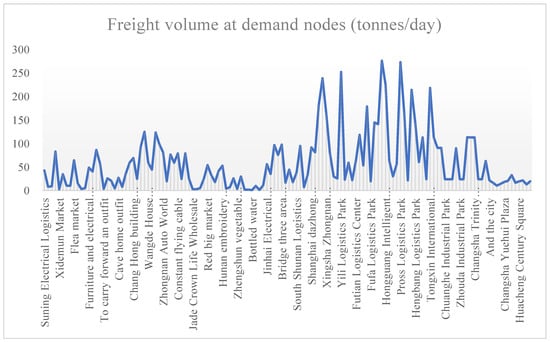
Figure 3.
Freight volume distribution map of demand nodes in Changsha City.
Figure 3 shows the distribution of freight volume at several demand nodes. It was concluded that the demand nodes with significant freight demand were mainly concentrated in logistics parks and wholesale markets, followed by industrial parks and home-appliance building materials markets. At the same time, these locations belong to the daily circulation area of bulk goods, which meets the requirements of the service objectives of LTL-express enterprises. It also shows that with the increasing economic level, the types of LTL-express goods are diversified, not just raw materials in traditional manufacturing industries. More importantly, the diversification of cargo types shows that LTL-express enterprises are also facing a trend of diversification of service objectives, with increasing challenges and opportunities. It is also important to grasp the development opportunities and cultivate the ability of enterprises to provide multitype services in the face of diversified needs.
Then, the transport volume of each demand node was calculated as the quantity demanded, as shown in Figure 4.
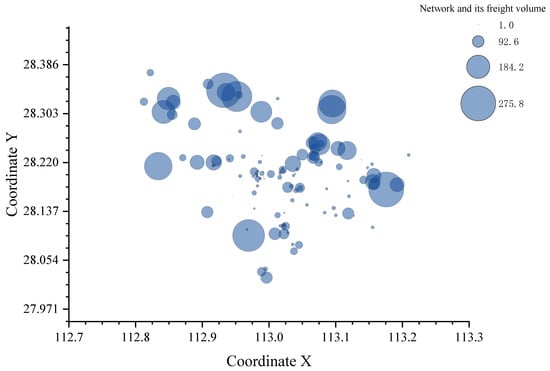
Figure 4.
LTL-express demand heat map in Changsha City.
At present, there are more than 1800 LTL-express companies in Changsha, of which 35% are mainly outside the province and 65% are mainly inside the province. The LTL-express gathering area has been moved from the high bridge as the center of the LTL market (including the high bridge logistics market, Guitang, Hengji, bridge three areas, Licangku area, etc.) and Mawangdui as the center of the LTL-express market (including Jiudaowan, Huiyuan, Nanhu market, etc.) to Xingshadong No. 11 Road and Langli area (Yuntong, Xinchuang’an, Shoubang, Hailunhong Guangyuncang, Langli Industrial Park, Zhonghuan, etc.), Huangjiang Road on both sides (Zhonggang, Shitai, Huantong, etc.), the area currently accounts for about 80% of the LTL-express market in Changsha City. The LTL market grows steadily, and the concentration becomes higher, showing a trend in networking.
The demand heat map of Changsha’s LTL express shows that the demand nodes of Changsha’s LTL express are mainly concentrated in Hedong and Hebei, with regional distribution, showing aggregation characteristics, close to the consumption area and the city center. It indicates that the demand node obtained sufficient resources. With the development of cities, the number of demand nodes is daily increasing. Enterprises need to control the demand information in time to make network adjustments.
The distribution of demand nodes in Changsha is shown in Figure 5, which is a candidate network.
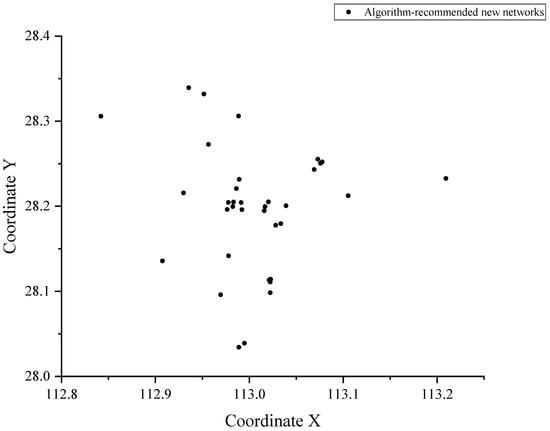
Figure 5.
Distribution of demand networks in Changsha City.
It can be seen from Figure 5 that the demand nodes in Changsha are mainly concentrated in Tianxin District and Kaifu District. In the figure, the central region is mainly composed of small and intensive industries, mostly building materials and shops, and the northern region is composed mostly of logistics parks and large markets. The eastern and western regions are mostly large industrial parks and auto parts cities, while the southern regions are mostly large markets, industrial parks, and logistics parks.
According to the non-use attributes of the LTL-express goods and the different operating scales of the outlets, the current LTL-express enterprises mainly come from warehouses and outlets, and customers prefer outlets close to the LTL-express market to receive and deliver goods. With the continuous improvement of hardware and supporting facilities, Changsha LTL-express park attracts more and more from Xingsha East 11th Road and Langli. Huantong, logistics headquarters and Xinfengda Huangjiang Avenue Logistics Park special line attract more complementary parks near Langli town.
Enterprise L in Changsha has built networks as shown in Figure 6.
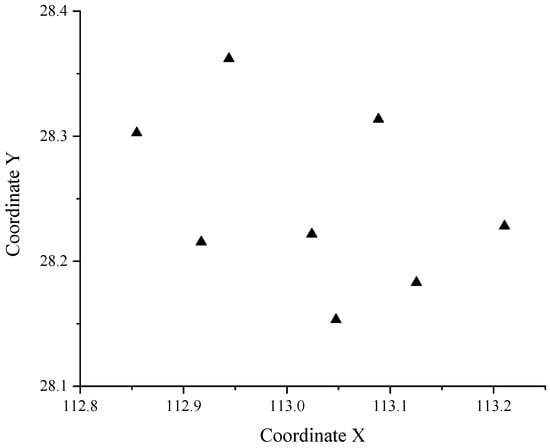
Figure 6.
Enterprise established networks in Changsha City.
Figure 6 shows the established outlets of Enterprise L in Changsha. It can be seen that the service scope covers most areas of Changsha, including Wangcheng District, Yuelu District, Kaifu District, Yuhua District, Changsha County, and Tianxin District, which are distributed in a decentralized manner. The main service objective is the city-center goods supply. In addition, the LTL-express outlets have low requirements on the operating site. To maintain the supply of the main goods, it should increase the surrounding supporting storage area. However, due to small numbers, it cannot occupy the LT-express market in Changsha well, and it is urgent that it should select new outlets.
7.2. Empirical Analysis of Changsha Network Location
Based on the eight established outlets (in Changsha), the experimental results of the optimal location scheme of the immune algorithm are shown in Figure 7. The first white node indicates the demand node; the second node is black, indicating the selection node; and the third node is a pentagonal star, indicating the distribution center.
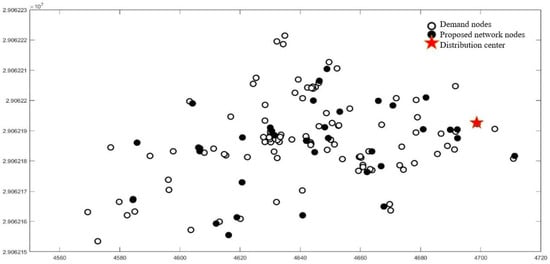
Figure 7.
Optimal location scheme.
It can be seen from Figure 7 that the outlets are reasonably distributed around the demand nodes. Within the limits of their service capabilities, they can easily meet the customer demand nodes within their scope, and the overall distribution is relatively uniform, showing the characteristics of agglomeration and high concentration, which is in line with the grid development trend of the market. The main source of goods in Changsha is concentrated in the eastern area. The number of outlets in the eastern area is large, concentrated near the city center, and penetrating Changsha County.
The connections in the figure represent the membership relationship, as shown in Figure 8. From the figure, the membership relationships of an urban network are mainly determined by their service range and serviceability. With a reasonable layout, the actual utilization rate of an urban network can reach the optimal level to serve customers.
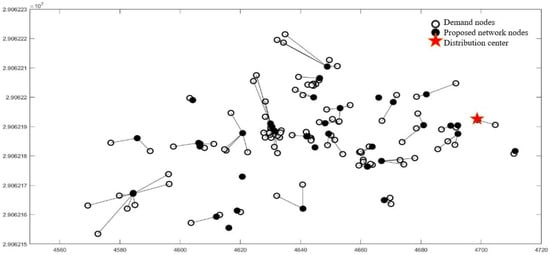
Figure 8.
Membership diagram of network nodes.
To evaluate the effectiveness and practicability of the proposed algorithm, the basic immune optimization algorithm, genetic algorithm, and particle swarm optimization algorithm were selected for comparison, as shown in Figure 9. The horizontal axis represents the number of iterations, and the vertical axis represents the fitness value of the best individual in each generation, namely the optimal value.
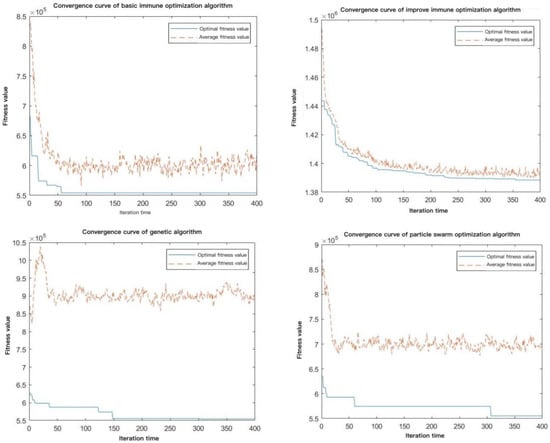
Figure 9.
Algorithm convergence curve comparison graph.
From the experimental results in this empirical study, the basic immune optimization algorithm converges too fast, with the average completion of convergence in the 50th generation, the genetic algorithm with the average completion of convergence in the 150th generation, and the particle swarm algorithm with the average completion of convergence in the 300th generation. The average fitness is far away from the optimal fitness value, which is significantly greater than 0.5, and the operation effect is poor. The layout of an urban network is chaotic, and it is impossible to complete the optimization task of an urban enterprise network location. The application of an improved immune optimization algorithm convergence speed is moderate, running 400 times and the average in the 200th generation. The algorithm achieves a convergence effect by attaining the optimal fitness value and maintaining it within the range of [1.4, 1.45]. Once the average fitness value no longer exhibits significant changes and the difference between the closest and optimal fitness values is less than 0.001, the algorithm has reached its closest or optimal fitness value.
Combining a number of transportation companies such as SF, we expanded the size of all LTL-express freight demand points in the city to 2021 and increased to two distribution centers, as shown in Figure 10. Finally, 101 demand points were obtained by the improved immune optimization algorithm, as shown in Figure 11.
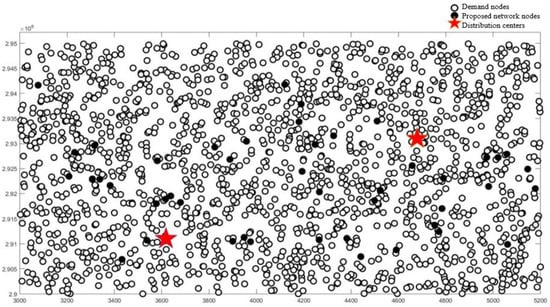
Figure 10.
Schematic of the 2021 demand points and distribution centers.
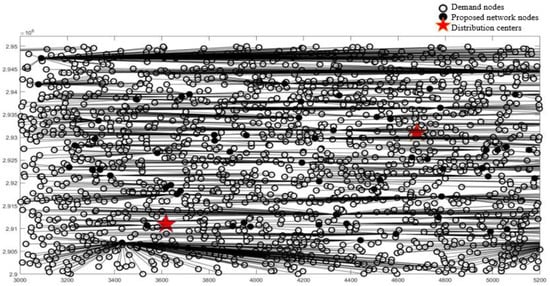
Figure 11.
The 101 algorithms recommended location results.
At present, the northern area is not the Changsha LTL-express gathering area, but the rent is relatively low, and it also has certain logistics development prospects. The policy of leasing idle industrial land and collecting reserved land in Changsha County is relatively loose, which provides convenience for the operation of the logistics line. Combined with the established network, the overall layout of the network is a vertical, in-depth and horizontal development. The source of goods is mainly distributed in the eastern area. Wangcheng District, Yuhua District, Changsha County, and other regional sources of goods need to be developed to rapidly expand the share of the LTL-express market.
8. Discussion and Conclusions
8.1. Discussion
With the slowdown of globalization, less-than-truckload logistics has gradually become one of the main ways for intercity cargo transportation. The improvement in enterprise intercity network layout ability, to a certain extent, can reflect the effectiveness of the expansion of enterprises and the degree of management characteristics. Improving the level of enterprise knowledge accumulation and promoting the flow of internal and external management are important bases for building enterprise innovation capability. Greater investment in supply-chain networks will result in increasing marginal returns and improve the ability of firms to withstand risks from environmental turbulence.
In the context of a transitional economy, timely capturing variation information is crucial for initiating innovation, but enterprises have not yet raised variation perception to the strategic perception level and incorporated it into the enterprise innovation system. Open innovation is conducive to improving the innovation ability of enterprises, but this benefit should be based on moderate openness. Excessive openness may bring harm instead.
Enterprises should make full use of the strategic perception potential provided by the supply-chain network, not just limited to the acquisition and sharing of tangible resources. Enterprises need to balance internal and external knowledge-sharing activities to obtain better benefits. In the production and operation costs, the establishment of outlets can help enterprises to speed up the construction of supply-chain network, help enterprises to roll out the urbanization process, so as to speed up the improvement of enterprise logistics level [9,38].
At the level of logistics decision-making, enterprises can reduce operating costs and improve operating efficiency through experience and technical means. The improved algorithm provided in this paper can effectively improve the customer service level of the corresponding region through model optimization and recommended outlets, thereby improving customer satisfaction. On the other hand, through the scheduling of transportation vehicles and personnel, optimizing the regional service network can also help enterprises to reduce the operating costs and personnel costs of outlets, accelerate the digital transformation of enterprises, enhance the competitiveness of similar enterprises, and achieve the effect of accelerating the industry’s leading position.
8.2. Conclusions
In the context of the common distribution mode, a location optimization scheme of LTL-express enterprises based on the constructed urban network is proposed to solve the traditional urban network location problem. The objective function is constructed from the perspective of system optimization. At the same time, taking into account the multi-agent interests such as urban network operation and customer-service level, the construction cost of a logistics urban network is alleviated by reasonably using the resources of the constructed urban network, to achieve the goal of global optimization and total distribution-cost optimization. In addition, to better solve this problem, an improved immune optimization algorithm was designed, and a good solution effect for enterprises in urban network locations was obtained. The comparative analysis of the simulation results verified that the improved immune optimization algorithm proposed in this paper has a strong solving ability for the urban network location problem with complex constraints, and improves the practicability of the theoretical results of this problem. We thus suggest future research considering the construction of a multi-objective optimization function with a variety of heuristic algorithms to study more effective algorithms.
Future research could benefit from exploring the development of an enterprise’s own advantages, aiming to mitigate weaknesses resulting from suboptimal management and network layout [32]. Starting from the distribution center and operation outlets in the urban supply-chain network, this paper provides a better development plan from the perspective of enterprise management through model optimization and an improved algorithm [27]. In addition, the existing research pays more attention to the impact of facility location and algorithm design, and less attention to the location and optimization of outlets in the less-than-truckload logistics business. This study enriches the enterprise management theory in the direction of less-than-truckload logistics location.
At present, scholars have achieved rich results from the study of dynamic and static urban network layout optimization and location, but there are few studies on the combination of less-than-truckload express enterprises and the overall layout. In terms of the sharing of less-than-truckload express network resources, the existing research focuses more on the qualitative analysis of model sharing and the formulation of normative systems. There is little analysis on the actual needs and applications, thus requiring more research and optimization in the field.
Author Contributions
Conceptualization, K.T. and C.L.; methodology, K.T.; software, K.T.; validation, K.T., F.X. and X.F.; formal analysis, K.T. and F.X.; resources, C.L.; data curation, K.T.; writing—original draft preparation, K.T.; writing—review and editing, C.L. and X.F.; visualization, K.T.; supervision, C.L.; funding acquisition, X.F. All authors have read and agreed to the published version of the manuscript.
Funding
This work was supported in part by the National Natural Science Foundation of China under Grant 62176065, in part by the Guangdong Provincial National Science Foundation under Grant 2021A1515012017, and in part by the Science and Technology Planning Project of Guangdong Province, China, under Grant 2019B110210002.
Data Availability Statement
Publicly available datasets were analyzed in this study. This data can be found here: [https://www.chinawutong.com/, accessed on 16 November 2022].
Conflicts of Interest
The authors declare no conflict of interest.
References
- Chen, H.X. Combinatorial clock-proxy exchange for carrier collaboration in less than truck load transportation. Transp. Res. Part E-Logist. Transp. Rev. 2016, 91, 152–172. [Google Scholar] [CrossRef]
- Li, J.S.; Rong, G.; Feng, Y.P. Request selection and exchange approach for carrier collaboration based on auction of a single request. Transp. Res. Part E-Logist. Transp. Rev. 2015, 84, 23–39. [Google Scholar] [CrossRef]
- Kuyzu, G.; Akyol, C.G.; Ergun, O.; Savelsbergh, M. Bid price optimization for truckload carriers in simultaneous transportation procurement auctions. Transp. Res. Part B-Methodol. 2015, 73, 34–58. [Google Scholar] [CrossRef]
- Triki, C.; Oprea, S.; Beraldi, P.; Crainic, T.G. The stochastic bid generation problem in combinatorial transportation auctions. Eur. J. Oper. Res. 2014, 236, 991–999. [Google Scholar] [CrossRef]
- Belhor, M.; El-Amraoui, A.; Jemai, A.; Delmotte, F. Multi-objective evolutionary approach based on K-means clustering for home health care routing and scheduling problem. Expert Syst. Appl. 2023, 213, 15. [Google Scholar] [CrossRef]
- Pellegrini, P.; Castelli, L.; Pesenti, R. Secondary trading of airport slots as a combinatorial exchange. Transp. Res. Part E-Logist. Transp. Rev. 2012, 48, 1009–1022. [Google Scholar] [CrossRef]
- Ozener, O.O.; Ergun, O.; Savelsbergh, M. Lane-Exchange Mechanisms for Truckload Carrier Collaboration. Transp. Sci. 2011, 45, 1–17. [Google Scholar] [CrossRef]
- Berger, S.; Bierwirth, C. Solutions to the request reassignment problem in collaborative carrier networks. Transp. Res. Part E-Logist. Transp. Rev. 2010, 46, 627–638. [Google Scholar] [CrossRef]
- Goel, A.; Gruhn, V. A General Vehicle Routing Problem. Eur. J. Oper. Res. 2008, 191, 650–660. [Google Scholar] [CrossRef]
- Dai, B.; Chen, H.X.; Yang, G.K. Price-setting based combinatorial auction approach for carrier collaboration with pickup and delivery requests. Oper. Res. 2014, 14, 361–386. [Google Scholar] [CrossRef]
- Taniguchi, E.; Noritake, M.; Yamada, T.; Izumitani, T. Optimal size and location planning of public logistics terminals. Transp. Res. Part E-Logist. Transp. Rev. 1999, 35, 207–222. [Google Scholar] [CrossRef]
- Crainic, T.G.; Ricciardi, N.; Storchi, G. Models for Evaluating and Planning City Logistics Systems. Transp. Sci. 2009, 43, 432–454. [Google Scholar] [CrossRef]
- Ruiz-Meza, J.; Meza-Peralta, K.; Montoya-Torres, J.R.; Gonzalez-Feliu, J. Location of Urban Logistics Spaces (ULS) for Two-Echelon Distribution Systems. Axioms 2021, 10, 214. [Google Scholar] [CrossRef]
- Ren, J.J.; Li, H.X.; Zhang, M.M.; Wu, C. Massive-scale graph mining for e-commerce cold chain analysis and optimization. Future Gener. Comput. Syst. Int. J. eSci. 2021, 125, 526–531. [Google Scholar] [CrossRef]
- Yuan, Q. Location of Warehouses and Environmental Justice. J. Plan. Educ. Res. 2021, 41, 282–293. [Google Scholar] [CrossRef]
- Yang, C.; Chen, M.Y.; Yuan, Q. The geography of freight-related accidents in the era of E-commerce: Evidence from the Los Angeles metropolitan area. J. Transp. Geogr. 2021, 92, 102989. [Google Scholar] [CrossRef]
- Yang, C.; Chen, M.Y.; Yuan, Q. The application of XGBoost and SHAP to examining the factors in freight truck-related crashes: An exploratory analysis. Accid. Anal. Prev. 2021, 158, 106153. [Google Scholar] [CrossRef] [PubMed]
- Sakai, T.; Kawamura, K.; Hyodo, T. Logistics facilities for intra and inter-regional shipping: Spatial distributions, location choice factors, and externality. J. Transp. Geogr. 2020, 86, 102783. [Google Scholar] [CrossRef]
- Sakai, T.; Beziat, A.; Heitz, A. Location factors for logistics facilities: Location choice modeling considering activity categories. J. Transp. Geogr. 2020, 85, 102710. [Google Scholar] [CrossRef]
- Wen, Q.Y.; Yan, Q.Y.; Qu, J.J.; Liu, Y. Fuzzy Ensemble of Multi-Criteria Decision Making Methods for Heating Energy Transition in Danish Households. Mathematics 2021, 9, 2420. [Google Scholar] [CrossRef]
- Lin, M.D.; Liu, P.Y.; Yang, M.D.; Lin, Y.H. Optimized allocation of scooter battery swapping station under demand uncertainty. Sustain. Cities Soc. 2021, 71, 102963. [Google Scholar] [CrossRef]
- Kang, S. Warehouse location choice: A case study in Los Angeles, CA. J. Transp. Geogr. 2020, 88, 102297. [Google Scholar] [CrossRef]
- Yuan, Q. Environmental Justice in Warehousing Location: State of the Art. J. Plan. Lit. 2018, 33, 287–298. [Google Scholar] [CrossRef]
- Holl, A.; Mariotti, I. Highways and firm performance in the logistics industry. J. Transp. Geogr. 2018, 72, 139–150. [Google Scholar] [CrossRef]
- Ghasemi, P.; Khalili-Damghani, K. A robust simulation-optimization approach for pre-disaster multi-period location-allocation-inventory planning. Math. Comput. Simul. 2021, 179, 69–95. [Google Scholar] [CrossRef]
- Takedomi, S.; Ishigaki, T.; Hanatsuka, Y.; Mori, T. Facility location optimization with pMP modeling incorporating waiting time prediction function for emergency road services. Comput. Ind. Eng. 2022, 164, 107859. [Google Scholar] [CrossRef]
- Hu, X.G.; Zhang, H.G.; Ma, D.Z.; Wang, R.; Wang, T.B.A.; Xie, X.P. Real-Time Leak Location of Long-Distance Pipeline Using Adaptive Dynamic Programming. IEEE Trans. Neural Netw. Learn. Syst. 2021, 1–10. [Google Scholar] [CrossRef]
- Sobreira, L.T.P.; Cunto, F. Disaggregated traffic conditions and road crashes in urban signalized intersections. J. Saf. Res. 2021, 77, 202–211. [Google Scholar] [CrossRef]
- Su, Z.Y.; Li, W.T.; Li, J.C.; Cheng, B. Heterogeneous fleet vehicle scheduling problems for dynamic pickup and delivery problem with time windows in shared logistics platform: Formulation, instances and algorithms. Int. J. Syst. Sci.-Oper. Logist. 2022, 9, 199–223. [Google Scholar] [CrossRef]
- Jia, X.H.; Zhang, D.H. Prediction of maritime logistics service risks applying soft set based association rule: An early warning model. Reliab. Eng. Syst. Saf. 2021, 207, 107339. [Google Scholar] [CrossRef]
- Cheriet, A.; Bachir, A.; Lasla, N.; Abdallah, M. On optimal anchor placement for area-based localisation in wireless sensor networks. IET Wirel. Sens. Syst. 2021, 11, 67–77. [Google Scholar] [CrossRef]
- Lizbetinova, L.; Lejskova, P.; Nedeliakova, E.; Caha, Z.; Hitka, M. The growing importance of ecological factors to employees in the transport and logistics sector. Econ. Res.-Ekon. Istraz. 2022, 35, 4379–4403. [Google Scholar] [CrossRef]
- Kong, X.T.R.; Kang, K.; Zhong, R.Y.; Luo, H.; Xu, S.X. Cyber physical system-enabled on-demand logistics trading. Int. J. Prod. Econ. 2021, 233, 108005. [Google Scholar] [CrossRef]
- Lei, T.; Lv, Y.Q.; Zhang, Y.J.; Cao, X.H. Logistics service provider selection decision making for healthcare industry based on a novel weighted density-based hierarchical clustering. Adv. Eng. Inform. 2021, 48, 101301. [Google Scholar] [CrossRef]
- Hosseini, S.D.; Verma, M. Equitable routing of rail hazardous materials shipments using CVaR methodology. Comput. Oper. Res. 2021, 129, 105222. [Google Scholar] [CrossRef]
- Vieira, B.S.; Ribeiro, G.M.; Bahiense, L.; Cruz, R.; Mendes, A.B.; Laporte, G. Exact and heuristic algorithms for the fleet composition and periodic routing problem of offshore supply vessels with berth allocation decisions. Eur. J. Oper. Res. 2021, 295, 908–923. [Google Scholar] [CrossRef]
- Xue, Y.H.; Zhu, Z.Q. Hybrid Flow Table Installation: Optimizing Remote Placements of Flow Tables on Servers to Enhance PDP Switches for In-Network Computing. IEEE Trans. Netw. Serv. Manag. 2021, 18, 429–440. [Google Scholar] [CrossRef]
- Cruijssen, F.; Cools, M.; Dullaert, W. Horizontal cooperation in logistics: Opportunities and impediments. Transp. Res. Part E-Logist. Transp. Rev. 2007, 43, 129–142. [Google Scholar] [CrossRef]
Disclaimer/Publisher’s Note: The statements, opinions and data contained in all publications are solely those of the individual author(s) and contributor(s) and not of MDPI and/or the editor(s). MDPI and/or the editor(s) disclaim responsibility for any injury to people or property resulting from any ideas, methods, instructions or products referred to in the content. |
© 2023 by the authors. Licensee MDPI, Basel, Switzerland. This article is an open access article distributed under the terms and conditions of the Creative Commons Attribution (CC BY) license (https://creativecommons.org/licenses/by/4.0/).