Abstract
Many practical decisions are more realistic concerning preventing bad decisions than seeking better ones. However, there has been no behavioral decision theory research on avoiding the worst decisions. This study is the first behavioral decision research on decision strategies from the perspective of avoiding the worst decisions. We conducted a computer simulation with the Mersenne Twister method and a psychological experiment using the monitoring information acquisition method for two-stage decision strategies of all combinations for different decision strategies: lexicographic, lexicographic semi-order, elimination by aspect, conjunctive, disjunctive, weighted additive, equally weighted additive, additive difference, and a majority of confirming dimensions. The rate of choosing the least expected utility value among the alternatives was computed as the rate of choosing the worst alternative in each condition. The results suggest that attention-based decision rules such as disjunctive strategy lead to a worse decision, and that striving to make the best choice can conversely often lead to the worst outcome. From the simulation and the experiment, we concluded that simple decision strategies such as considering what is most important can lead to avoiding the worst decisions. The findings of this study provide practical implications for decision support in emergency situations.
Keywords:
multi-attribute decision-making; decision strategy; worst decision; Mersenne Twister method; process tracing method; monitoring information acquisition; lexicographic strategy; weighted-additive strategy; psychological experiment MSC:
62C12; 62P1; 90B50; 91B06; 91C99; 91E10
1. Introduction
People often want to make the best decisions for themselves [1,2,3,4]; however, they may also make decisions that are not very desirable from their point of view [5]. For example, we may make impulsive purchases that we would not typically want to make when shopping or make medical decisions that may be dangerous to our health or lives. Contrastingly, a group may adopt risky alternatives that are inherently unwanted by all members and that are inferior concerning the preference relations of the group as a whole [6,7,8]. Here, we use the term “bad decision” to represent a choice that the decision-maker views to be of poor quality and irrational. This also corresponds to the decision-making that Aristotle called akrasia. Although most recent behavioral economics and decision theories focus on aspects of poor decision-making [3,9,10,11,12], most research remains focused on deviations from standards of human rationality such as the traditional expected utility theory and its variants [3,5,6,13,14]. However, our research objective is to find the most realistic and appropriate decision-making strategies to avoid bad decisions, especially the worst possible ones. To illustrate, conventional behavioral economics has identified sub-optimal cases and their factors in, for example, financial and consumer decision-making. In this research approach, we will examine the processes and factors that lead to the worst decisions in these areas and examine how to prevent them. For example, in cases such as the recent coronavirus disease 2019 (COVID-19) pandemic, people are trying to avoid the worst rather than aiming for optimal decision-making; thus, such decision-making research is needed. However, there has been no behavioral decision theoretic research on avoiding such worst-case decisions [5].
This study examines how to prevent the worst-case decision-making by referring to the Pareto optimal and scalarization function approaches and other previous studies on multi-objective optimization [15,16,17], the previous computer simulation and experimental studies in behavioral decision-making [18,19,20], and the theoretical studies such as lexicographic decision-making [21]. Regarding the previous computer simulation and experimental studies on conventional decision-making strategies; first, they have only analyzed them from the perspective of choosing the best option; second, Monte Carlo methods were used for generating pseudo-random numbers in simulations, but they need to be improved [21]; third, the optimality of decision-making from the index of efficiency in comparison with the cognitive effort of simulation decision-making has not been examined; and fourth, various decision-making strategies have not been systematically examined from the perspective of a two-stage decision-making strategy. Therefore, in this study, we conducted computer simulations using the Mersenne Twister method [22] for all combinations of two-stage decision-making strategies: lexicographic, lexicographic semi-ordering, elimination by aspects, conjunctive, disjunctive, weighted additive, equally weighted additive, weighted additive difference, and majority rule, and psychological experiments were conducted to define a new index of decision-making efficiency and analyzed in terms of the best and worst decisions. In each condition, the rate of choosing the option with the lowest expected utility value among the alternatives was calculated as the rate of choosing the worst option. Elementary information processing and relative accuracy were also calculated for all combinations of decision strategy pairs for the two-stage decision-making process. While the traditional utility theory requires decision makers to make the best choice, the experimental results suggest that attempting to make the best choice can inversely lead to the worst outcome. The simulation and experimental results also suggest that rather simple decision strategies, such as a combination of lexicographic and weighted additive strategies that consider the most important ones, can lead to avoiding the worst decisions. In conclusion, the results of this study suggest that psychologically and operationally easy decision strategies prevent the worst decisions. Although these findings are limited as discussed in the later section, this is the first study to date on preventing worst-case decision-making from the perspective of decision-making strategies, and it provides practical implications for decision support in emergency situations.
2. Literature Review
Traditional behavioral economics research has centered on explaining actual decision-making concerning deviations from theoretical predictions in economics, such as the expected utility theory practical decisions, which are more realistic concerning preventing bad decisions than seeking better ones [3,5,6,13,14]. Although the main purpose of this study is to investigate worst-case decision-making, existing theoretical and empirical findings on optimal decision-making to date are useful. First, there are prior studies on multi-objective optimization, such as Pareto optimization and scalar functions [15,16,17].
There is also a need for optimization methods that support fast and flexible decision-making under diverse and competing values and fluctuating system environments. Minimizing or maximizing an objective function under constraints is referred to as optimization. Multi-objective optimization problems are addressed in engineering, economics, business administration, sociology, and many other fields. The Pareto-optimal solution, which is a reasonable norm for this multi-objective optimization, is generally a set of countless alternatives. Many computational methods considered that multi-objective analysis was developed to obtain this Pareto-optimal solution set, and various applications have been reported [15,16,17]. The scalarization method is a classical method to find the Pareto solution to a multi-objective optimization problem [15,17]. In this method, multiple objective functions are converted to a single objective in a way to obtain the optimal solution. For example, the linearized weighted sum method (aggregate objective function) [17] creates a single weighted objective function by giving weights to each objective function to obtain the optimal solution. In the multi-attribute decision theory, such a scalarized function is called an additive utility function. From the standpoint of the axiomatic measurement theory, it is called an additive conjoint system. An additive utility function representing an additive conjoint system can be thought of as the result of implementing an additive decision strategy. Considering good and bad decisions from this perspective, we can see that the best decision corresponds to maximizing the additive value utility assignment by the strategy. The worst decision corresponds to minimizing this value.
An additive decision strategy can be thought of as an expression of an additive utility function from the perspective of process tracing in decision-making. An additive decision-making strategy involves the consideration of all alternatives at every level, which are comprehensively evaluated to determine the best alternative. An additive decision-making strategy can be thought of as a representation of an additive utility function in terms of process tracing in decision-making. As a mathematical model, the additive decision strategy satisfies the conditions assumed in the additive conjoint system, such as independence, double cancellation, solvability and Archimedean axioms, but from the perspective of process tracing, all options are considered at all levels and comprehensively evaluated to determine the best option [4,5].
There are two types of additive strategies: weighted-additive strategies, in which each attribute receives a different weight value; and the opposite, equal additive strategies. All decision-making strategies can be categorized as compensatory and non-compensatory [4,18]. A compensatory decision-making strategy is one where a low evaluation value of one attribute is compensated by a high evaluation value of another attribute, resulting in an overall evaluation. In compensatory strategies, information is considered from all alternatives. Conversely, there is no compensating relationship between attributes in non-compensatory decision strategies where the order in which alternatives and attributes are considered may lead to inconsistent decision outcomes.
First, we compared the weighted additive (WAD) strategy with the lexicographic strategy (LEX) by selecting the option with the highest rating for the most important attribute and the next most if there was a tie in value for the most important attribute. Previous computer simulation studies have shown that LEX has relatively high accuracy and low cognitive load [6,13,19,20]. It is empirically known that compensatory models in econometric models can approximate non-compensatory models such as LEX; however, the specific mathematical conditions for this are unknown. To solve this problem, existing research showed that lexicographic decision-making could be represented by a linear model with constraints on the parameters when the level of attributes is discrete [16,21]. They obtained necessary and sufficient conditions for a weighted-additive decision-making strategy and corresponding linear utility function to represent a standard lexicographic model in certain conditions. LEX and WAD are incompatible unless the weights of essential attributes are considerably superior to the other; the correspondence between LEX and WAD is well predicted from previous theoretical analysis and econometric studies. However, the conditions under which LEX and WAD correspond are limited and not always fully clarified mathematically. Furthermore, the probability of LEX selecting the worst alternative is, mathematically, not well understood. Therefore, we examined how the probability of choosing the worst alternative is affected by various decision-making strategies, including LEX, through computer simulations and experiments
In our simulations, we drew on previous studies that examined the best decision-making [19,20]. As noted in the introduction, these previous studies did not consider the worst decisions. In addition, there are some issues regarding the method of generating pseudo-random numbers. In this study, we conducted simulations using the Mersenne Twister method for all possible pairings of the nine diverse decision strategies. We will also refer to prior computer simulations and experimental studies on behavioral decision making [18,19,20] and theoretical studies such as lexical decision making [21] to examine how to prevent worst-case decision making. The Mersenne Twister method, proposed by Matsumoto and Nishimura [22], is its proven long period of 219,937−1 (≈4.315 × 106,001), which, as the name implies, is a (24th) Mersenne prime, and some of the guaranteed features are achieved by the internal use of Mersenne primes. Further, since the pseudo-random numbers are evenly distributed in high dimensions (623 dimensions), we can expect negligible correlation between successive values in the output. In the experiment, we used (1) a multi-attribute decision-making task using the information-monitoring acquisition method [18,19] and (2) a questionnaire survey with a specified decision-making strategy used in the previous decision research [23]. The classical study by Payne et al. [19] dealt with the main decision-making strategies, while Takemura et al.’s [20] study examined all combinations of the two-stage decision-making strategies: lexicographic, lexicographic semi-ordering, elimination by aspects, conjunctive, disjunctive, weighted additive, equally weighted additive, weighted additive difference, and majority rule. This study also applies the Mersenne Twister method [22] to the two-stage decision strategies and examines the worst-case decision-making. In addition, in the previous study, the optimality of decision making from the index of efficiency of decision-making relative to cognitive effort has not been examined. We examined efficiency by creating an index of accuracy divided by operationally defined cognitive effort.
Regarding psychological experiments, there is a classic study by Payne et al. [19] in a form corresponding to the simulation, but the two-stage decision strategies have not been studied in a sufficiently organized manner, but also the procedures for the identification of decision strategies have been insufficient. In particular, we have improved the information monitoring method [4,23], a kind of the process tracking technique, by implementing it on a computer so that it is possible to examine whether the decision strategies are properly implemented, and then further confirming it with a posteriori questionnaire. In the experiment, we used (1) a multi-attribute decision-making task using the information-monitoring acquisition method [18,19] and (2) a questionnaire survey with a specified decision-making strategy used in the previous decision research [23].
3. Materials and Methods
This section first describes the methodology and specific procedures of the computer simulations conducted in this study, followed by a description of the methodology, apparatus, experimental participants, and experimental procedures of the psychological experiment.
3.1. Methods of Simulation
We conducted simulations using the Mersenne Twister method for all possible pairings of the nine diverse decision strategies. Subsequently, a set of alternatives comprising multiple attributes was created. The value of each attribute can take an integer value from 0 to 1000, and these values were generated using a uniform random number generator. In addition, the importance of each attribute was a real number between 0 and 1, generated using a uniform random number generator.
To formulate a multi-attribute decision-making task, the number of options from the first to the second stage was determined as three or less [19]. To enable more than three options in a two-stage decision, three levels were set for the number of options at the beginning of the decision-making process: 5, 8, and 10. Similarly, the number of attributes was preset to three levels: 3, 5, and 8 [19] while accounting for the presence or absence of dominant options in each decision task. The importance of the attributes was randomly generated and applied using two different creation methods that diverged according to the high and low variance settings.
We created 10,000 multi-attribute decision-making tasks with a total of 36 conditions: number of options (three levels: 5, 8, and 10) × number of attributes (three levels: 3, 5, and 8) × variance in importance (two levels: high and low) × presence of a dominant option (two levels). In the first stage, five types of strategies were used: conjunctive (CON), disjunctive (DIS), elimination by aspects (EBA), LEX, and lexicographic semi-order (LEX-S). Decisions were made using a single strategy without narrowing down the choices (i.e., single strategy). In the second stage, nine strategies were used: CON, DIS, EBA, LEX, LEX-S, WAD, equal-weighted strategy (EQW), additive difference (ADF), and majority of confirming dimensions (MCD). Therefore, we simulated 45 strategy combinations. From these simulations, we calculated the average elementary information processes (EIP) and relative accuracy () defined for each strategy and the best- and worst-choice rates under the expected value index.
First, we calculated the cognitive effort involved in implementing each strategy (EIP, operationally defined as the number of basic information processing operations) and the RA of the decision outcome (operationally defined as a weighted additive index that takes the value of 1 if the outcome is exactly the same and 0 if the response is completely random) for each condition [19]. The following indices were first computed:
Essentially, RA is defined as follows [19]:
where is the expected value chosen by the decision strategy in question, is the expected value when choosing randomly, and is the expected value when choosing by a weighted-additive decision strategy. is the expected value of the choice made by a weighted-additive decision strategy. Therefore, when a decision is made in a weighted-additive manner, is 1, and when a random choice is made, is 0. The index is an index of how close the decision is to a weighted-additive decision, and what we call accuracy is only an index of how close the decision is to a weighted-additive decision.
Although this measure gives us the concerning the expected value, it does indicate our probability of selecting the most desirable and best option. Therefore, we calculated the probability of that choice for each condition. Since the indicator is based on random choices and does not base itself on the value of the least desirable option [19], we obtained the Minimum () as an alternative indicator based on the minimum value.
In addition, as an indicator of bad decision-making, we calculated the rate of choosing the options with the lowest expected value, as well. This can be interpreted as the rate of adopting the worst option.
Thus, in this study, we obtained (1) the EIP’s elementary score; (2) the rate of choosing the alternative with the maximum expected value (the best-choice rate); (3) the rate of choosing the alternative with the minimum expected value (the worst-choice rate); (4) ; (5) ; and (6) the efficiency index, which is divided by EIP (for more information on the and results, see Figure A1, Figure A2, Figure A3 and Figure A4 and Figure A5, Figure A6, Figure A7 and Figure A8, respectively).
3.2. Method of Experiment
3.2.1. Participants in the Experiment
The participants of the current study were 40 university students (25 women and 15 men, mean age: 21.28 years, = 1.58). Of these, four were excluded due to missing values or other data inadequacies; therefore, we analyzed the data of 36 participants.
3.2.2. Experimental Apparatus
For this experiment, we implemented the Visual Basic program software for stimulus presentation and information monitoring of the information retrieval board. In addition, an iPhone stopwatch application was used to measure the time.
As a method for examining decision strategies, the process tracking technique has been developed [4,5]. The process tracing technique is mainly based on the following two methods: (1) the verbal protocol method, in which experimental participants are asked to dictate their internal thoughts during the decision-making process in a choice situation, and the recording is used to examine what decision-making strategies were used; and (2) the eye gaze method, in which an eye camera is used to track the gaze of experimental participants during the decision-making process.
In this study, the monitoring information acquisition method was incorporated into a computerized system for quick and easy examination. This method reveals from which attributes of which options and in what order the information was acquired by the participants in the experiment before reaching a decision. In this method, the participants are not given any information about the alternatives at the beginning of the decision task, but are given information about the attributes of each alternative from an information board. In this information board, the alternatives are arranged in columns and the attributes in rows, in a matrix format. The information monitoring acquisition methods allow us to see which alternatives and attributes the participants paid attention to, and in what order they explored the information, because the participants freely and independently explore the information they want to see.
3.2.3. Tasks and Strategies Used in the Experiment
Participants were presented with the 36 strategies in a randomized order to avoid order and learning effects.
3.2.4. Procedure of the Experiment
We asked participants to perform two tasks: (1) a multi-attribute decision-making task using the information-monitoring method and (2) a questionnaire survey with a specified decision-making strategy. The former required participants to choose one of the decision strategies that were specified in advance. Moreover, to evaluate the application of the selected decision strategies, the experimenter used an information-monitoring program in Visual Basic. The program was implemented on a PC equipped with an information display board that could record changes in the attributes that participants attended to when the stimuli were presented (Figure A21 presents a sample of the experimental screen). In this experiment, the decision-making task required participants to purchase a laptop computer as a stimulus (Table A3 lists the attributes of the laptop computers used in the experiment). A combination of decision-making strategies was created in advance for participants to make the second-stage decision. The general flow of this experiment is shown in Appendix B Figure A22.
Before the experiment, the experimenter instructed participants to select an option according to a specified decision-making strategy and that the task was to purchase a laptop computer. Next, the decision-making strategies to be used in this experiment were presented on the computer screen: one for narrowing down the six choices to two (the first stage) and another for choosing one of the two choices (the second stage). After explaining the strategy, the experimenter clarified any potential queries of participants and confirmed their understanding of the strategy. Specifically, each time the strategy was changed, the experimenter presented participants with a “confirmation of understanding of decision strategy” questionnaire and asked them to select the strategy to be used from the options to verify their understanding. The explanation and confirmation of the strategies were repeated until participants could select the specified strategy. After confirmation, instructions were provided to use the touch screen for the decision-making task, and a practice trial was conducted. In the practice trial, the participants performed a task that simulated a situation where they had to rent an apartment. After the practice trial was over, we moved on to the main trial. The experimenter instructed participants that “from this point on, the task will be based on the assumption of a situation where a laptop computer is purchased,” and had them perform a choice task using a decision strategy that had been taught to them beforehand.
In this main trial, after completing the choice task, the participants were asked to answer a post-decision questionnaire. In the questionnaire, the participants were asked to fill in the choices they made using the specified decision strategy, the difficulties and confusion they experienced when using the specified strategy, the uncertainty they felt in the choice process, and the uncertainty they felt when making the choice, using the “Decision Making Scale” from previous studies [4,23]. As soon as the participants were asked to fill out this form, they moved on to the next trial. After performing the choice task for all strategy combinations (36 possible combinations), the participants were asked to complete the “Evaluation of the Decision-Making Task” questionnaire, and the experiment was terminated with a reward equivalent to JPY 2500. The evaluation of the decision-making task consisted of three items: satisfaction with the value of each level (0–100 points), the degree of importance given to each attribute when performing the product selection task (7-point scale), and the evaluation score of the choices. The results of the questionnaire for the evaluation of decision-making tasks were used to calculate the score of each option by multiplying the importance of the attribute with the satisfaction for each level, and the options with the highest (i.e., the best option) and lowest satisfaction levels (i.e., the worst option) were estimated for each participant. Next, we calculated the probabilities of choosing the best and worst options in each strategy (best option adoption rate and worst option adoption rate). We used the R Software (The R Foundation for Statistical Computing, c/o Institute for Statistics and Mathematics, Wirtschaftsuniversität Wien 1020 Vienna, Austria) to perform conjoint analysis and formulate the combination of attributes and levels used in the experiment. We conducted this analysis to identify the “good” options that differed among individuals and to determine if participants could actually choose the “good” options from the group of options when they used their decision-making strategy. The average experiment time per participant was 2.5 h.
4. Results
4.1. Simulation
We examined the difference between using a single decision-making strategy and combining two decision-making strategies in various decision-making tasks as listed in Table A1 using a computer simulation with the Mersenne Twister random number generation method. First, we measured the cognitive effort and RA of the decision outcomes when one strategy narrowed down the potential choices. Thereafter, another strategy determined the choices and compared them. This combined method was then compared to the decision-making process, wherein only one approach is used from start to finish without any combination of decision-making strategies. Next, we examined how different combinations of decision strategies affect the RA of decision-making and cognitive effort when two-stage decision strategies are used for a measure of decision-making (See Table A2). We used two basic decision-making strategies. First, we used an additive strategy. There are two types of additive approaches. In one strategy, each attribute is given a different weight (WAD). In the other, no weighting value is given (EQW). The ADF, CON, DIS, and LEX types were used. LEX-S was also employed when slight differences (5% of the range of the attribute value) within a specific range were considered equal, and a decision was made according to the next most important attribute. The EBA and MCD types were used, as well.
To obtain an index of the worst choice, we first calculated the rate of choosing the worst option. We designated this index as the rate of selecting the lowest expected value among the alternatives in each condition. Figure 1 presents the results for different numbers of alternatives when the number of options was reduced to two in the first stage to study the two-stage strategy. As can be seen from Figure 1, the compensatory decision strategy did not choose the worst option. Nonetheless, the non-compensatory strategy, which reduces the number of options to two by LEX or LEX-S, is unlikely to select the worst option, as well. In particular, when the second stage of processing is conducted with a compensatory strategy such as WAD, the worst option is not chosen, indicating that the total cognitive effort is low. The probability of choosing the worst option depends on the number of alternatives and attributes. However, surprisingly, this tendency was generally observed in all conditions (further information on the worst- and best-choice rate in the two-stage decision-making for each of the alternatives in the second stage is seen in Figure A9, Figure A10, Figure A11 and Figure A12 and Figure A13, Figure A14, Figure A15 and Figure A16, respectively). The results show that while it is clear from the RA definition that the worst choice rate for WAD is zero, the two-stage decision-making strategy of narrowing the choices in the first stage with LEX and LEX-S has a much lower worst choice rate of less than 5 percent in all conditions.
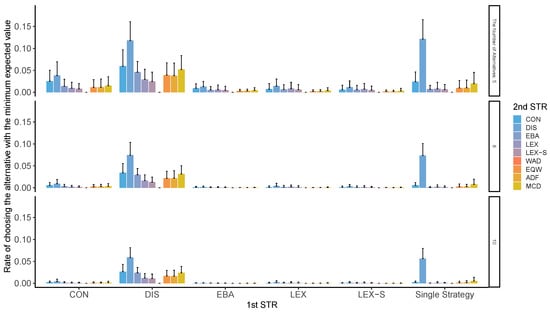
Figure 1.
Worst-choice rate in two-stage decision-making when the number of alternatives left in the second stage is two for the different number of alternatives. Note: ADF: additive difference; CON: conjunctive; DIS: disjunctive; EBA: elimination by aspects; EQW: equal-weighted strategy; LEX: lexicographic; LEX-S: lexicographic semi-order; MCD: majority of confirming dimensions; STR: strategy; WAD: weighted additive.
Contrastingly, when DIS was used in the first stage of the refinement process, the likelihood of selecting the worst alternative was reduced. DIS, on the other hand, has a maximum worst-case choice rate of about 15 percent, which is higher than the other strategies. This reduction also occurred when DIS was used in the second stage; DIS is a strategy that adopts an option when the level of any attribute exceeds the sufficient condition. Comparatively, when DIS was used in the first stage of narrowing, the results showed that people were more likely to choose the worst option when they were blinded by the salient attribute features, and the likelihood of choosing the worst option was reduced. This reduction occurred even when DIS was used in the second stage. Therefore, this suggests that people are more likely to choose the worst option when they are blinded by salient attribute features. Furthermore, this feature of DIS indicates that when people make biased judgments based on their attention to events, they are more likely to make the wrong decision.
We computed the index of cognitive EIP [19] in the two-stage strategy. Figure 2 shows the EIP results for the different number of options when the number of options is narrowed down to two in the first stage. In general, choosing the last two options requires less cognitive effort than selecting the last three options.
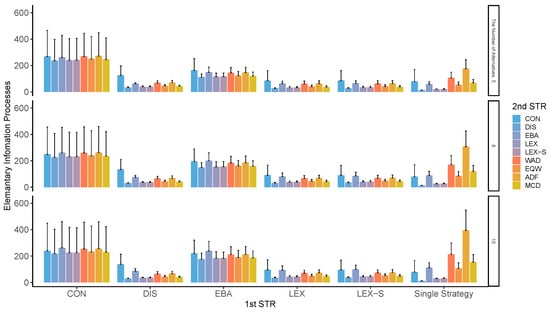
Figure 2.
Average elementary information processes in two-stage decision-making when the number of alternatives left in the second stage is two for the different number of alternatives. Note: ADF: additive difference; CON: conjunctive; DIS: disjunctive; EBA: elimination by aspects; EQW: equal-weighted strategy; LEX: lexicographic; LEX-S: lexicographic semi-order; MCD: majority of confirming dimensions; STR: strategy; WAD: weighted additive.
Efficiency was calculated by dividing the accuracy index [19] by the EIP index, as shown in Figure 3. It can be seen that the non-compensatory LEX and LEX-S are relatively efficient on their own. Particularly, the two-stage strategy using WAD after narrowing down the number of options to two or three is the most efficient. This tendency varied depending on the number of alternatives and attributes. Surprisingly, the tendency for LEX to be more efficient was generally observed in all conditions. However, the decision strategy was less efficient when DIS was used for the first stage of refinement, the entire process, and the second stage (Figure A17, Figure A18, Figure A19 and Figure A20 presents further information on average EIPs in two-stage decision-making for each of the alternatives in the second stage).
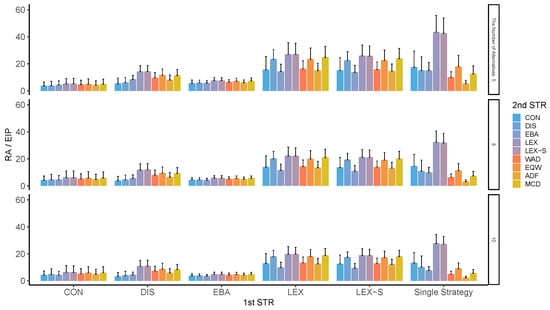
Figure 3.
Efficiency rates (relative accuracy ()/elementary information processes (EIP)) in two-stage decision-making when the number of alternatives left in the second stage is two for the different number of alternatives. Note: ADF: additive difference; CON: conjunctive; DIS: disjunctive; EBA: elimination by aspects; EQW: equal-weighted strategy; LEX: lexicographic; LEX-S: lexicographic semi-order; MCD: majority of confirming dimensions; STR: strategy; WAD: weighted additive.
4.2. Experiment
In the experimental study, we asked participants to perform two tasks: a multi-attribute decision-making task using the information-monitoring method and a questionnaire after specifying the decision strategy. The following eight strategies were tested in this experiment: EQW, WAD, ADF, MCD, CON, DIS, LEX, and EBA. The LEX-S used in the simulations was excluded because the simulation results were almost identical to those of LEX and because of the difficulty in setting marginal differences. In addition, four non-compensatory strategies—CON, DIS, EBA, and LEX—were used in the first stage, and all eight were used in the second stage. Although there were 32 possible combinations, we excluded combinations in which the same strategy is used in the first and second stages (e.g., CON + CON, DIS + DIS, etc.). These choices are rarely posted in multi-stage decision-making in our daily lives. Ultimately, we used 28 second-stage strategies. In the multi-attribute decision-making task, the participants were asked to choose an option using a decision strategy after that strategy had been specified in advance. To check and analyze whether the participants could use the decision strategies specified by the experimenter, we used an information-monitoring program. This program was implemented on a PC with an information presentation board that could record the changes in attributes that participants paid attention to when the stimuli were presented. We used a decision-making task in which participants were asked to purchase a laptop computer. The importance of the attributes and the value of each attribute level were multiplied to calculate the score for each option using the questionnaire results. The options with the highest satisfaction level (the best) and the lowest satisfaction level (the worst) were estimated for each participant. The probability of choosing the best option and the worst option for each strategy (best option and worst option adoption rates) were then calculated. Interestingly, compared to other strategies, the WAD strategy participants did not choose the best alternatives, nor did they avoid the worst more frequently. Although most of the participants understood what an additive strategy is, they could not carry it out. We deposited a ZIP file containing the original data files and a program to reproduce our analysis. This file is available at https://osf.io/s4y5t/(accessed on 3 October 2022).
These results indicate that it was very difficult to perform the WAD strategy assumed in the additive conjoint structure. Our findings suggest that the additive rule might not be practical and may not result in the best decisions in real-life contexts. In addition, previous studies in social psychology reveal that people seeking rationality tend to be rather susceptible to depression and report a low level of subjective welfare [24]. Figure 4 shows the worst-choice rates of the conjoint analysis and the weight estimation of both the single- and two-stage strategies (Figure A23 presents the best-choice rate of the conjoint analysis and the weight estimation task for single- and two-stage decision-making).
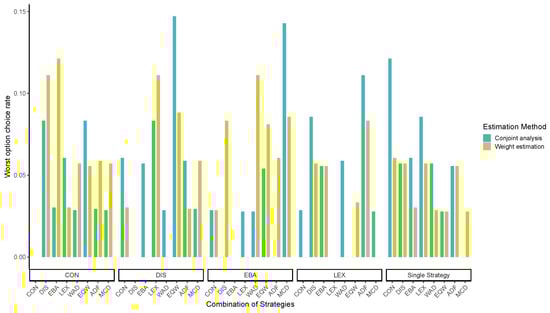
Figure 4.
Worst-choice rate of the conjoint analysis and weight estimation for the single- and two-stage decision strategies. Note: ADF: additive difference; CON: conjunctive; DIS: disjunctive; EBA: elimination by aspects; EQW: equal-weighted strategy; LEX: lexicographic; LEX-S: lexicographic semi-order; MCD: majority of confirming dimensions; STR: strategy; WAD: weighted additive.
Additionally, Figure 4 shows that DIS + EQW had the highest worst-choice rate by conjoint analysis, followed by EBA + MCD. In contrast to the results of the computer simulations, there was no significant difference in the worst-choice rate among the decision strategies, and WAD did not particularly prevent the worst from happening most frequently. Furthermore, the results of the experiment indicated that the combination of LEX and WAD was not the most effective, but was relatively more effective in making better decisions and avoiding the worst possible one.
A Bayesian analysis was performed assuming that the frequency x with which the best and worst alternatives were adopted followed a binomial distribution . Using RSTAN (version 2.21.5), we generated four chains with a length of 2000, the burn-in period was set to 1000, and the posterior distribution was approximated by 4000 random numbers obtained by the Hamiltonian Monte Carlo method. Using the posterior distribution with the above random numbers, we also determined (1) the difference between the two strategies, (2) the difference between p and the chance level for the individual strategies, and (3) the difference between p and 1 for WAD. The number of valid votes was large, and < 1.1.
Table 1 shows the results, including the mean, standard deviation, and 95% credible interval, of the posterior distribution. Regarding (1), there was a difference between CON and DIS, DIF and DIS, and LEX-WAD and DIS with 95% credible, which were the best-choice rates based on conjoint analysis. Concerning (2), there was a difference between the best-choice rates based on conjoint analysis of CON, DIF, DIS, and LEX-WAD from the chance level, with 95% credible. Only DIS did not differ from the chance level and did not lead to better decisions than the chance level. In addition, regarding the worst-choice rate based on conjoint analysis and the weight estimation method for EQW and WAD, the differences between the means were within the 95% credible interval. Concerning (3), differences in the best- and worst-choice rates for WAD based on conjoint analysis and the weight estimation method were within the 95% credible interval. This indicates that WAD is not the best choice as assumed in the simulation, but neither does it correspond to only the worst choices.

Table 1.
Results of the Bayesian analysis.
5. Discussion
This study examines decision process research from the perspective of preventing worst-case choices using computer simulations and experiments. The result of this study shows that a strategy such as WAD is effective in preventing the worst decision, but the experimental result indicates that this strategy has a high cognitive load and is difficult to implement. The simulation result reveals that the two-stage decision strategy of narrowing the choices in the first stage with LEX and LEX-S has a much lower worst choice rate of less than 5 percent in all conditions. DIS was found to have the largest worst choice rate of about 15 percent, which is higher than the other strategies.
The implications of this study are as follows. First, using a compensatory decision-making strategy such as WAD may seem desirable at first glance because it focuses on the diverse features of attributes and integrates complex information. However, in actual decision-making, it is quite difficult to execute in a way that leads to taking the best decision and may even lead to taking the worst decision. This decision-making strategy is not recommended, especially in emergency situations. This result suggests that, despite using decision-making strategies that are consistent with an additive multi-attribute utility model, people do not contribute to making better decisions; moreover, they do not avoid the worst decisions. This finding is consistent with previous research [25]—that even if people pay a cost to obtain and share more information, they cannot reflect it in their decisions. Second, a strategy such as DIS, which requires less information processing but shifts attention to less important attributes, is less likely to lead to good decision-making. Such decisions are more likely to be made in emergencies. We believe that the reason many individuals have made poor decisions during the COVID-19 pandemic may be due to the use of the DIS strategy. Finally, it was suggested that a two-phased decision-making strategy, such as LEX in the first stage and WAD among the remaining few alternatives in the second stage, which focuses on the most important attributes, requires less cognitive effort, and makes it easier to avoid making the worst decision and instead choose the better option.
Although there are some problems with this study, such as the limited number of participants in the experiment, the experimental results show that, as in the computer simulation, simple decision-making strategies such as the combination of the lexicographic and weighted-additive types lead to better decisions, preventing bad decisions, and a smaller psychological effort burden. The practical significance of this is that in both managerial and consumer decision-making, a simple decision strategy that considers what is important leads to better decisions and is effective in preventing bad decisions, rather than a decision strategy that has a high information processing load, such as aiming for the best. It also showed that a disjunctive decision strategy that is guided by attention to specific attributes leads to bad decisions. This suggests that decisions guided in a particular direction, such as propaganda, often lead to bad decisions.
6. Conclusions
This study is the first to investigate, by a computer simulation and psychological experiment, which decision-making strategies are efficient in terms of preventing the worst-case decision-making, and which require less cognitive effort. Although many phenomena related to bad or irrational decision making have been reported in the fields of cognitive psychology, social psychology, clinical psychology, behavioral decision theory, and behavioral economics, there is a lack of empirical and theoretical research that clarifies the micro decision-making process. Despite the importance of the findings of previous studies in behavioral economics and behavioral decision theory, there is a need for research methods and findings on the decision-making process from a worst-case perspective. In this context, there is a growing demand to understand how to avoid worst-case decision making. Previous behavioral decision theory research has only examined the decision-making process from the perspective of best decision deviations, and this study is considered to have opened the door to research from the perspective of preventing worst-case decision-making.
In addition to being the first study to examine decision-making from the perspective of preventing worst-case decision making, this study not only conducted the first study from the perspective of preventing worst-case decision making, but also combined organizational strategies to examine two-stage strategies in simulation, improved the method for generating pseudo-random numbers, and improved the information monitoring acquisition method in experimentation.
The findings of this study showed that the use of a two-stage strategy with low cognitive load, in which the options are narrowed down to about two options in the LEX and then the options are considered in the WAD, is not only effective in terms of preventing worst-case decisions, but also efficient in terms of pursuing the best decisions. We also showed that using a decision-making strategy with high cognitive load, such as WAD, is difficult in practice. Although traditional utility and social choice theories in economics require decision makers to make the best choice, the present experimental results suggest that it is difficult to conclude that trying to make the best choice is inversely proportional to the probability of avoiding the worst outcome. The results of the computer simulations and experiments suggest, rather, that a simple decision-making strategy of considering what is most important can lead to avoiding the worst decisions. These findings have implications for decision support, especially in emergency situations. In emergency situations, for example, evacuation from a natural disaster, there are many situations that are so urgent in time that many cognitive efforts cannot be split, and efficient decision-making methods are required for these situations. The findings of this study, although limited, provide suggestions for decision support methods.
Future directions for this research include proposing methods in specific situations to avoid the worst-case decision-making, understanding real-world decision-making not in laboratory situations, extending this research in group decision-making, and dealing with decision-making under uncertainty. In particular, how to deal with uncertainty has been an important and challenging topic and has received a great deal of attention [26,27]. Many methods such as extended soft sets [28]; fuzzy rough sets [29]; hesitant fuzzy linguistics [30]; theory of evidence [31]; D-numbers [32]; random permutation sets [33]; and others methods such as evidential fuzzy multi-criteria decision-making based on belief entropy [34], generalized quantum evidence theory [35], and generalized divergence-based decision making method with an application to pattern classification [36] have been developed. We believe that future research should expand the scope of consideration to include such uncertainty issues and incorporate methods developed to deal with recent uncertainty problems.
Author Contributions
Conceptualization, K.T.; methodology, K.T., Y.T., T.I.; computer simulation, Y.T., K.T.; visualization, Y.T., T.I., K.T.; funding acquisition, K.T.; project administration, K.T.; supervision, K.T.; writing—original draft, K.T.; writing—review and editing, T.I., Y.T. All authors have read and agreed to the published version of the manuscript.
Funding
This research was funded by the Japan Society for the Promotion of Science [KAKENHI 17K03637, and 22H00893] and the The Waseda University Grant [2020R-012, and 2021R-003].
Institutional Review Board Statement
The protocol and experiment in this study were reviewed and approved by the Waseda University Ethics Committee (no. 2021-074).
Informed Consent Statement
Informed consent was obtained from all subjects involved in the study.
Data Availability Statement
We have deposited a zip file that contains the original data files as well as programs to replicate our analyses. The file is available at https://osf.io/s4y5t/ (accessed on 3 October 2022).
Acknowledgments
We thank Baruch Fischhoff of Carnegie Mellon University and David Leiser of Ben Gurion University of the Negev for their valuable advice on this research. We thank Miyu Kureta and Takumi Suganuma from Waseda University for their assistance in the experiment. Finally, we are deeply grateful to the four anonymous reviewers for their valuable comments and suggestions.
Conflicts of Interest
The authors declare that they have no known competing financial interests or personal relationships that could have appeared to influence the work reported in this study. The funders had no role in the design of the study; in the collection, analyses, or interpretation of data; in the writing of the manuscript, or in the decision to publish the results.
Appendix A. Simulation
Table A1.
Decision strategies used in this study.
Table A1.
Decision strategies used in this study.
| Strategy | Explanation |
|---|---|
| Weighted Additive (WAD) | Examine the weighted value of all attributes for each option and choose the option with the highest value. |
| Equal-weighted Additive (EQW) | Examine the value of all attributes for each option and choose the option with the highest value. However, no weighting is assigned to the attribute values. |
| Additive Difference (ADF) | The evaluation values of any pair of alternatives are compared for each attribute. When there are three or more alternatives, the winning alternatives are compared one after another in a tournament-like fashion, and the final alternative is adopted. |
| Conjunctive (CON) | Each attribute has a set of necessary conditions, and if any one of the attributes does not satisfy the necessary conditions, the information processing of the alternative is terminated and the alternative is rejected, regardless of the values of the other attributes. In the case of choosing only one option with this decision strategy, the first option that exceeds the necessary conditions across all attributes will be chosen. |
| Disjunctive (DIS) | Sufficient conditions are set for each attribute, and if any one attribute satisfies the sufficient condition, the alternative is adopted regardless of the values of the other attributes. |
| Lexicographic (LEX) | The option with the highest rating is chosen for the most important attribute. If there is a tie for the most important attribute, the next most important attribute is chosen. |
| Lexicographic Semi-order (LEX-S) | The option with the highest rating is chosen as the most important attribute. If there is a tie for the most important attribute, the next most important attribute is chosen. However, if a small difference within a certain range is also considered at the same rank, the next most important attribute is used for judgment. |
| Elimination by Aspects (EBA) | The option with the highest rating is chosen as the most important attribute. If there is a tie for the most important attribute, the next most important attribute is chosen. However, if a small difference within a certain range is also considered at the same rank, the next most important attribute is used for judgment. |
| Majority of Confirming Dimensions (MCD) | The evaluation values of any pair of alternatives are compared for each attribute in a brute-force fashion. The evaluation method differs from the additive difference method in that it compares the number of dominant attributes and adopts the option that has the highest winning rate in the round-robin comparison. |
Table A2.
Two-stage decision strategies used in the simulation.
Table A2.
Two-stage decision strategies used in the simulation.
| The First Stage | The Second Stage | The First Stage | The Second Stage |
|---|---|---|---|
| CON | CON | LEX | CON |
| CON | DIS | LEX | DIS |
| CON | EBA | LEX | EBA |
| CON | LEX | LEX | LEX |
| CON | LEX-S | LEX | LEX-S |
| CON | WAD | LEX | WAD |
| CON | EQW | LEX | EQW |
| CON | ADF | LEX | ADF |
| CON | MCD | LEX | MCD |
| DIS | CON | LEX-S | CON |
| DIS | DIS | LEX-S | DIS |
| DIS | EBA | LEX-S | EBA |
| DIS | LEX | LEX-S | LEX |
| DIS | LEX-S | LEX-S | LEX-S |
| DIS | WAD | LEX-S | WAD |
| DIS | EQW | LEX-S | EQW |
| DIS | ADF | LEX-S | ADF |
| DIS | MCD | LEX-S | MCD |
| EBA | CON | ||
| EBA | DIS | ||
| EBA | EBA | ||
| EBA | LEX | ||
| EBA | LEX-S | ||
| EBA | WAD | ||
| EBA | EQW | ||
| EBA | ADF | ||
| EBA | MCD |
Note: In the simulations, we also executed a condition in which the choice is based on a single strategy. The single strategies that we used were CON, DIS, EBA, LEX, LEX-S, WAD, EQW, ADF, and MCD. Therefore, 54 strategies were used in the simulation. ADF: additive difference; CON: conjunctive; DIS: disjunctive; EBA: elimination by aspects; EQW: equal-weighted strategy; LEX: lexicographic; LEX-S: lexicographic semi-order; MCD: majority of confirming dimensions; WAD: weighted additive.
Appendix A.1. RA and MRA in Two-Stage Decision-Making
Although these two indicators ( and ) are different in concept, the results of the analysis show almost similar patterns. As can be seen from Figure A1 through Figure A8, compensatory decision strategies have high ; however, non-compensatory strategies such as LEX and LEX-S, which limit the number of alternatives to two or three, also reveal that the possibility of choosing the worst alternative is low. In particular, the is higher when the second stage is performed in a compensatory type such as WAD. The pattern of varied depending on the number of alternatives and attributes, variation in the importance of attributes, and the presence or absence of superior alternatives; surprisingly, however, this trend was generally observed in all conditions. Contrastingly, the accuracy of the results is relatively low when DIS is used for the first stage of refinement, for the entire process, and even for the second stage. As indicated earlier, not only is the low, but the worst results are also likely to be obtained.

Figure A1.
RA in two-stage decision-making when only two alternatives are left in the second stage. Note: ADF: additive difference; CON: conjunctive; DIS: disjunctive; EBA: elimination by aspects; EQW: equal-weighted strategy; LEX: lexicographic; LEX-S: lexicographic semi-order; MCD: majority of confirming dimensions; STR: strategy; WAD: weighted additive.

Figure A2.
RA in two-stage decision-making when the number of alternatives left in the second stage is three. Note: ADF: additive difference; CON: conjunctive; DIS: disjunctive; EBA: elimination by aspects; EQW: equal-weighted strategy; LEX: lexicographic; LEX-S: lexicographic semi-order; MCD: majority of confirming dimensions; STR: strategy; WAD: weighted additive.

Figure A3.
RA in two-stage decision-making when only two alternatives are left in the second stage for the different numbers of attributes. Note: ADF: additive difference; CON: conjunctive; DIS: disjunctive; EBA: elimination by aspects; EQW: equal-weighted strategy; LEX: lexicographic; LEX-S: lexicographic semi-order; MCD: majority of confirming dimensions; STR: strategy; WAD: weighted additive.

Figure A4.
RA in two-stage decision-making when three alternatives are left in the second stage for the different numbers of attributes. Note: ADF: additive difference; CON: conjunctive; DIS: disjunctive; EBA: elimination by aspects; EQW: equal-weighted strategy; LEX: lexicographic; LEX-S: lexicographic semi-order; MCD: majority of confirming dimensions; STR: strategy; WAD: weighted additive.

Figure A5.
MRA in two-stage decision-making when only two alternatives are left in the second stage for the different numbers of alternatives. Note: ADF: additive difference; CON: conjunctive; DIS: disjunctive; EBA: elimination by aspects; EQW: equal-weighted strategy; LEX: lexicographic; LEX-S: lexicographic semi-order; MCD: majority of confirming dimensions; STR: strategy; WAD: weighted additive.

Figure A6.
MRA in two-stage decision-making when three alternatives are left in the second stage. Note: ADF: additive difference; CON: conjunctive; DIS: disjunctive; EBA: elimination by aspects; EQW: equal-weighted strategy; LEX: lexicographic; LEX-S: lexicographic semi-order; MCD: majority of confirming dimensions; STR: strategy; WAD: weighted additive.

Figure A7.
MRA in two-stage decision-making when only two alternatives are left in the second stage for the different numbers of attributes. ADF: additive difference; CON: conjunctive; DIS: disjunctive; EBA: elimination by aspects; EQW: equal-weighted strategy; LEX: lexicographic; LEX-S: lexicographic semi-order; MCD: majority of confirming dimensions; STR: strategy; WAD: weighted additive.

Figure A8.
MRA in two-stage decision-making when three alternatives are left in the second stage for the different numbers of attributes. Note: ADF: additive difference; CON: conjunctive; DIS: disjunctive; EBA: elimination by aspects; EQW: equal-weighted strategy; LEX: lexicographic; LEX-S: lexicographic semi-order; MCD: majority of confirming dimensions; STR: strategy; WAD: weighted additive.
Appendix A.2. Worst-Choice Rate in Two-Stage Decision-Making
Figure A9, Figure A10, Figure A11 and Figure A12 clearly show that those using compensatory decision strategies do not choose the worst option; however, even with the non-compensatory strategies with two or three options in LEX and LEX-SEMI, the participants are less likely to choose the worst option. In particular, when the second stage of processing is performed using a compensatory strategy such as WAD, it is difficult to choose the worst possible outcome. When a decision strategy, such as LEX or LEX-SEMI, requires little cognitive effort, the total cognitive effort is low, and the worst possible option is difficult to choose. The probability of choosing the worst option depends on the number of options and attributes; surprisingly, however, this tendency was generally observed in all conditions. When DIS was used to narrow down the first stage, it was used throughout. When DIS was used in the second stage, the probability of choosing the worst option also decreased.

Figure A9.
Worst-choice rate in two-stage decision-making when only two alternatives are left in the second stage. Note: ADF: additive difference; CON: conjunctive; DIS: disjunctive; EBA: elimination by aspects; EQW: equal-weighted strategy; LEX: lexicographic; LEX-S: lexicographic semi-order; MCD: majority of confirming dimensions; STR: strategy; WAD: weighted additive.

Figure A10.
Worst-choice rate in two-stage decision-making when three alternatives are left in the second stage. Note: ADF: additive difference; CON: conjunctive; DIS: disjunctive; EBA: elimination by aspects; EQW: equal-weighted strategy; LEX: lexicographic; LEX-S: lexicographic semi-order; MCD: majority of confirming dimensions; STR: strategy; WAD: weighted additive.

Figure A11.
Worst-choice rate in two-stage decision-making when only two alternatives are left in the second stage for the different numbers of attributes. Note: ADF: additive difference; CON: conjunctive; DIS: disjunctive; EBA: elimination by aspects; EQW: equal-weighted strategy; LEX: lexicographic; LEX-S: lexicographic semi-order; MCD: majority of confirming dimensions; STR: strategy; WAD: weighted additive.

Figure A12.
Worst choice rate in two-stage decision-making when three alternatives are left in the second stage for the different numbers of attributes. Note: ADF: additive difference; CON: conjunctive; DIS: disjunctive; EBA: elimination by aspects; EQW: equal-weighted strategy; LEX: lexicographic; LEX-S: lexicographic semi-order; MCD: majority of confirming dimensions; STR: strategy; WAD: weighted additive.
Appendix A.3. Best-Choice Rate in Two-Stage Decision-Making
In each condition, the rate of choosing the option with the largest expected value among the alternatives was calculated as the rate of choosing the best option. As can be seen from Figure A13, Figure A14, Figure A15 and Figure A16, the compensatory decision strategy does not lead to the selection of the worst option; however, even the non-compensatory strategies with two or three options of LEX and LEX-SEMI are likely to lead to the selection of the best option.
In particular, when second-stage processing is performed using compensatory strategies, such as WAD, the best option is less likely to be selected; further, when the decision strategies with less total cognitive effort such as LEX and LEX-SEMI are used, the total cognitive effort is lower and the worst outcome is less likely to be selected. In contrast, the probability of choosing the worst option is also higher when DIS is used for the first stage of narrowing down the options on the whole. Moreover, for the second stage, the DIS strategy adopts an option when one attribute to which attention is directed exceeds the sufficient condition. This pattern of results is a mirror image of the worst decision case.

Figure A13.
Best-choice rate in two-stage decision-making when only two alternatives are left in the second stage. Note: ADF: additive difference; CON: conjunctive; DIS: disjunctive; EBA: elimination by aspects; EQW: equal-weighted strategy; LEX: lexicographic; LEX-S: lexicographic semi-order; MCD: majority of confirming dimensions; STR: strategy; WAD: weighted additive.

Figure A14.
Best choice rate in two-stage decision-making when three alternatives are left in the second stage. Note: ADF: additive difference; CON: conjunctive; DIS: disjunctive; EBA: elimination by aspects; EQW: equal-weighted strategy; LEX: lexicographic; LEX-S: lexicographic semi-order; MCD: majority of confirming dimensions; STR: strategy; WAD: weighted additive.

Figure A15.
Best-choice rate in two-stage decision-making when only two alternatives are left in the second stage for the different numbers of attributes. ADF: additive difference; CON: conjunctive; DIS: disjunctive; EBA: elimination by aspects; EQW: equal-weighted strategy; LEX: lexicographic; LEX-S: lexicographic semi-order; MCD: majority of confirming dimensions; STR: strategy; WAD: weighted additive.

Figure A16.
Best-choice rate in two-stage decision-making when three alternatives are left in the second stage for the different numbers of attributes. ADF: additive difference; CON: conjunctive; DIS: disjunctive; EBA: elimination by aspects; EQW: equal-weighted strategy; LEX: lexicographic; LEX-S: lexicographic semi-order; MCD: majority of confirming dimensions; STR: strategy; WAD: weighted additive.
Appendix A.4. Average EIPs in Two-Stage Decision-Making
Figure A17 through Figure A20 clearly show that the group that used CON and EBA to narrow down the options in the first stage shows a larger cognitive effort than the cognitive effort exerted by other groups, possibly because CON and EBA take more time to process the cases where the numbers of narrowing options that meet the necessary conditions do not go as planned. Of course, WAD, EQW, and ADF require less cognitive effort.

Figure A17.
Average EIPs in two-stage decision-making when only two alternatives are left in the second stage. Note: ADF: additive difference; CON: conjunctive; DIS: disjunctive; EBA: elimination by aspects; EQW: equal-weighted strategy; LEX: lexicographic; LEX-S: lexicographic semi-order; MCD: majority of confirming dimensions; STR: strategy; WAD: weighted additive.

Figure A18.
Average EIPs in two-stage decision-making when three alternatives are left in the second stage. Note: ADF: additive difference; CON: conjunctive; DIS: disjunctive; EBA: elimination by aspects; EQW: equal-weighted strategy; LEX: lexicographic; LEX-S: lexicographic semi-order; MCD: majority of confirming dimensions; STR: strategy; WAD: weighted additive.

Figure A19.
Average EIPs in two-stage decision-making when only two alternatives are left in the second stage for the different numbers of attributes. Note: ADF: additive difference; CON: conjunctive; DIS: disjunctive; EBA: elimination by aspects; EQW: equal-weighted strategy; LEX: lexicographic; LEX-S: lexicographic semi-order; MCD: majority of confirming dimensions; STR: strategy; WAD: weighted additive.

Figure A20.
Average EIPs in two-stage decision-making when alternatives left in the second stage is three for the different numbers of attributes. Note: ADF: additive difference; CON: conjunctive; DIS: disjunctive; EBA: elimination by aspects; EQW: equal-weighted strategy; LEX: lexicographic; LEX-S: lexicographic semi-order; MCD: majority of confirming dimensions; STR: strategy; WAD: weighted additive.
Appendix B. Experiment
Table A3.
Attributes and their levels in the decision-making task.
Table A3.
Attributes and their levels in the decision-making task.
| Attribute | Level | ||
|---|---|---|---|
| Price | 60,000 yen | 80,000 yen | 100,000 yen |
| Weight | 0.8 kg | 1.2 kg | 1.6 kg |
| Battery | 5 h | 10 h | 15 h |
| Warranty period | 1 year | 2 years | 3 years |
| CPU | 1.5 GHz | 2.0 GHz | 2.5 GHz |
| Memory | 4 GB | 8 GB | 16 GB |
Note: The level of the attributes of the laptop computer used as a choice was scored at 1, 2, or 3 for each of the three levels using the equal-weighted strategy, and the scores were balanced among each choice so that any choice would have 12 points. To avoid order effects in the trials, the presentation position of each option was randomized in each trial.

Figure A21.
Example of stimulus presentation screen.

Figure A22.
General flow of the experiment.
Figure A23 shows the adoption rate of the best option by both conjoint analysis and the weight estimation task. For the best-choice rate, there was no significant difference between the strategies, unlike the simulation results. In addition, single-stage WAD was not significantly superior to LEX, CON, EBA, and other two-stage strategies.

Figure A23.
Best-choice rate of the conjoint analysis and the weight estimation task for single- and two-stage decision-making. Note: ADF: additive difference; CON: conjunctive; DIS: disjunctive; EBA: elimination by aspects; EQW: equal-weighted strategy; LEX: lexicographic; LEX-S: lexicographic semi-order; MCD: majority of confirming dimensions; STR: strategy; WAD: weighted additive.
References
- Hertwig, R.; Grüne-Yanoff, T. Nudging and boosting: Steering or empowering good decisions. Perspect. Psychol. Sci. 2017, 12, 973–986. [Google Scholar] [CrossRef]
- Summerfield, C.; Tsetsos, K. Do humans make good decisions? Trends Cogn. Sci. 2015, 19, 27–34. [Google Scholar] [CrossRef] [PubMed]
- Summerfield, C.; Tsetsos, K. Rationality and efficiency in human decision-making. In The Cognitive Neurosciences VII; Gazzaniga, M., Ed.; MIT Press: Cambridge, MA, USA, 2020; pp. 427–438. [Google Scholar]
- Takemura, K. Behavioral Decision Theory: Psychological and Mathematical Descriptions of Human Choice Behavior, 2nd ed.; Springer: Tokyo, Japan, 2021. [Google Scholar]
- Takemura, K. Escaping from Bad Decisions: A Behavioral Decision-Theoretic Perspective; Academic Press: New York, NY, USA, 2021. [Google Scholar]
- Gigerenzer, G.; Todd, P.M.; ABC Research Group. Simple Heuristics That Make Us Smart; Oxford University Press: New York, NY, USA, 1999. [Google Scholar]
- Janis, I.L. Victims of Groupthink; Houghton Mifflin: Boston, MA, USA, 1972. [Google Scholar]
- Janis, I.L. Groupthink: Psychological Studies of Policy Decisions and Fiascoes, 2nd ed.; Houghton Mifflins: Boston, MA, USA, 1982. [Google Scholar]
- Bault, N.; Rusconi, E. The art of influencing consumer choices: A reflection on recent advances in decision neuroscience. Front. Psychol. 2020, 10, 3009. [Google Scholar] [CrossRef] [PubMed]
- Trueblood, J.S.; Brown, S.D.; Heathcote, A. The multiattribute linear ballistic accumulator model of context effects in multialternative choice. Psychol. Rev. 2014, 121, 179. [Google Scholar] [CrossRef] [PubMed]
- Tsetsos, K.; Chater, N.; Usher, M. Salience driven value integration explains decision biases and preference reversal. Proc. Natl. Acad. Sci. USA 2012, 109, 9659–9664. [Google Scholar] [CrossRef] [PubMed]
- Tsetsos, K.; Moran, R.; Moreland, J.; Chater, N.; Usher, M.; Summerfield, C. Economic irrationality is optimal during noisy decision making. Proc. Natl. Acad. Sci. USA 2016, 113, 3102–3107. [Google Scholar] [CrossRef]
- Brandstätter, E.; Gigerenzer, G.; Hertwig, R. The priority heuristic: Making choices without trade-offs. Psychol. Rev. 2006, 113, 409. [Google Scholar] [CrossRef]
- Gigerenzer, G.; Reb, J.; Luan, S. Smart heuristics for individuals, teams, and organizations. Annu. Rev. Organ. Psychol. Organ. Behav. 2022, 9, 171–198. [Google Scholar] [CrossRef]
- Ehrgott, M. Multicriteria Optimization, 2nd ed.; Springer: Berlin/Heidelberg, Germany, 2005. [Google Scholar]
- Martignon, L.; Hoffrage, U. Fast, frugal, and fit: Simple heuristics for paired comparison. Theory Decis. 2002, 52, 29–71. [Google Scholar] [CrossRef]
- Miettinen, K. Nonlinear Multiobjective Optimization; Kluwer Academic Publishers: Alphen am Rhein, The Netherlands, 1999. [Google Scholar]
- Bettman, J.R. Information Processing Theory of Consumer Choice; Addison-Wesley Pub. Co.: Boston, MA, USA, 1979. [Google Scholar]
- Payne, J.W.; Bettman, J.R.; Johnson, E.J. The Adaptive Decision Maker; Cambridge University Press: Cambridge, UK, 1993. [Google Scholar]
- Takemura, K.; Haraguchi, R.; Tamari, Y. Cognitive effort accuracy of decision strategies in multi-attribute decision-making process: A behavioral decision theoretic approach using computer simulation technique. Cogn. Stud. 2015, 22, 368–387. [Google Scholar]
- Kohli, R.; Jedidi, K. Representation and inference of lexicographic preference models and their variants. Mark. Sci. 2007, 26, 380–399. [Google Scholar] [CrossRef]
- Matsumoto, M.; Nishimura, T. Mersenne twister: A 623-dimensionally equidistributed uniform pseudo-random number generator. ACM Trans. Model. Comput. Simul. TOMACS 1998, 8, 3–30. [Google Scholar] [CrossRef]
- Takemura, K. Psychology of Decision Making: Investigation of Its Process; Fukumura Shuppan: Tokyo, Japan, 1996. [Google Scholar]
- Schwartz, B.; Ward, A.; Monterosso, J.; Lyubomirsky, S.; White, K.; Lehman, D.R. Maximizing versus satisficing: Happiness is a matter of choice. J. Personal. Soc. Psychol. 2002, 83, 1178. [Google Scholar] [CrossRef] [PubMed]
- Klein, N.; O’Brien, E. People use less information than they think to make up their minds. Proc. Natl. Acad. Sci. USA 2018, 115, 13222–13227. [Google Scholar] [CrossRef] [PubMed]
- Denoeux, T. Maximum likelihood estimation from uncertain data in the belief function framework. IEEE Trans. Knowl. Data Eng. 2011, 25, 119–130. [Google Scholar] [CrossRef]
- Bryson, N.; Mobolurin, A. A qualitative discriminant approach for generating quantitative belief functions. IEEE Trans. Knowl. Data Eng. 1998, 10, 345–348. [Google Scholar] [CrossRef]
- Feng, F.; Cho, J.; Pedrycz, W.; Fujita, H.; Herawan, T. Soft set based association rule mining. Knowl.-Based Syst. 2016, 111, 268–282. [Google Scholar] [CrossRef]
- Ye, J.; Zhan, J.; Ding, W.; Fujita, H. A novel fuzzy rough set model with fuzzy neighborhood operators. Inf. Sci. 2021, 544, 266–297. [Google Scholar] [CrossRef]
- Liu, P.; Zhang, X.; Pedrycz, W. A consensus model for hesitant fuzzy linguistic group decision-making in the framework of Dempster–Shafer evidence theory. Knowl.-Based Syst. 2021, 212, 106559. [Google Scholar] [CrossRef]
- Calzada, A.; Liu, J.; Wang, H.; Kashyap, A. A new dynamic rule activation method for extended belief rule-based systems. IEEE Trans. Knowl. Data Eng. 2014, 27, 880–894. [Google Scholar] [CrossRef]
- Deng, X.; Deng, Y. D-AHP method with different credibility of information. Soft Comput. 2019, 23, 683–691. [Google Scholar] [CrossRef]
- Deng, Y. Random permutation set. Int. J. Comput. Commun. Control 2022, 17. [Google Scholar] [CrossRef]
- Xiao, F. EFMCDM: Evidential fuzzy multicriteria decision making based on belief entropy. IEEE Trans. Fuzzy Syst. 2019, 28, 1477–1491. [Google Scholar] [CrossRef]
- Xiao, F. Generalized quantum evidence theory. Appl. Intell. 2022, 1–16. [Google Scholar] [CrossRef]
- Xiao, F.; Wen, J.; Pedrycz, W. Generalized divergence-based decision making method with an application to pattern classification. IEEE Trans. Knowl. Data Eng. 2022, 1. [Google Scholar] [CrossRef]
Disclaimer/Publisher’s Note: The statements, opinions and data contained in all publications are solely those of the individual author(s) and contributor(s) and not of MDPI and/or the editor(s). MDPI and/or the editor(s) disclaim responsibility for any injury to people or property resulting from any ideas, methods, instructions or products referred to in the content. |
© 2023 by the authors. Licensee MDPI, Basel, Switzerland. This article is an open access article distributed under the terms and conditions of the Creative Commons Attribution (CC BY) license (https://creativecommons.org/licenses/by/4.0/).