

Mathematical Modeling of Air Distribution in Mines Considering Different Ventilation Modes


Abstract
1. Introduction
- Provide the required amount of air in all working areas to remove harmful impurities (gas and dust).
- Minimize energy consumption for mine ventilation.
- Even 1D calculation is time-consuming for large ventilation networks.
- The addition of spatial dimensions does not add accuracy to the simulation results due to the error in the initial data of the model and the presence of unaccounted-for random factors.
2. Methodology
2.1. Experimental Section
2.2. Theoretical Section
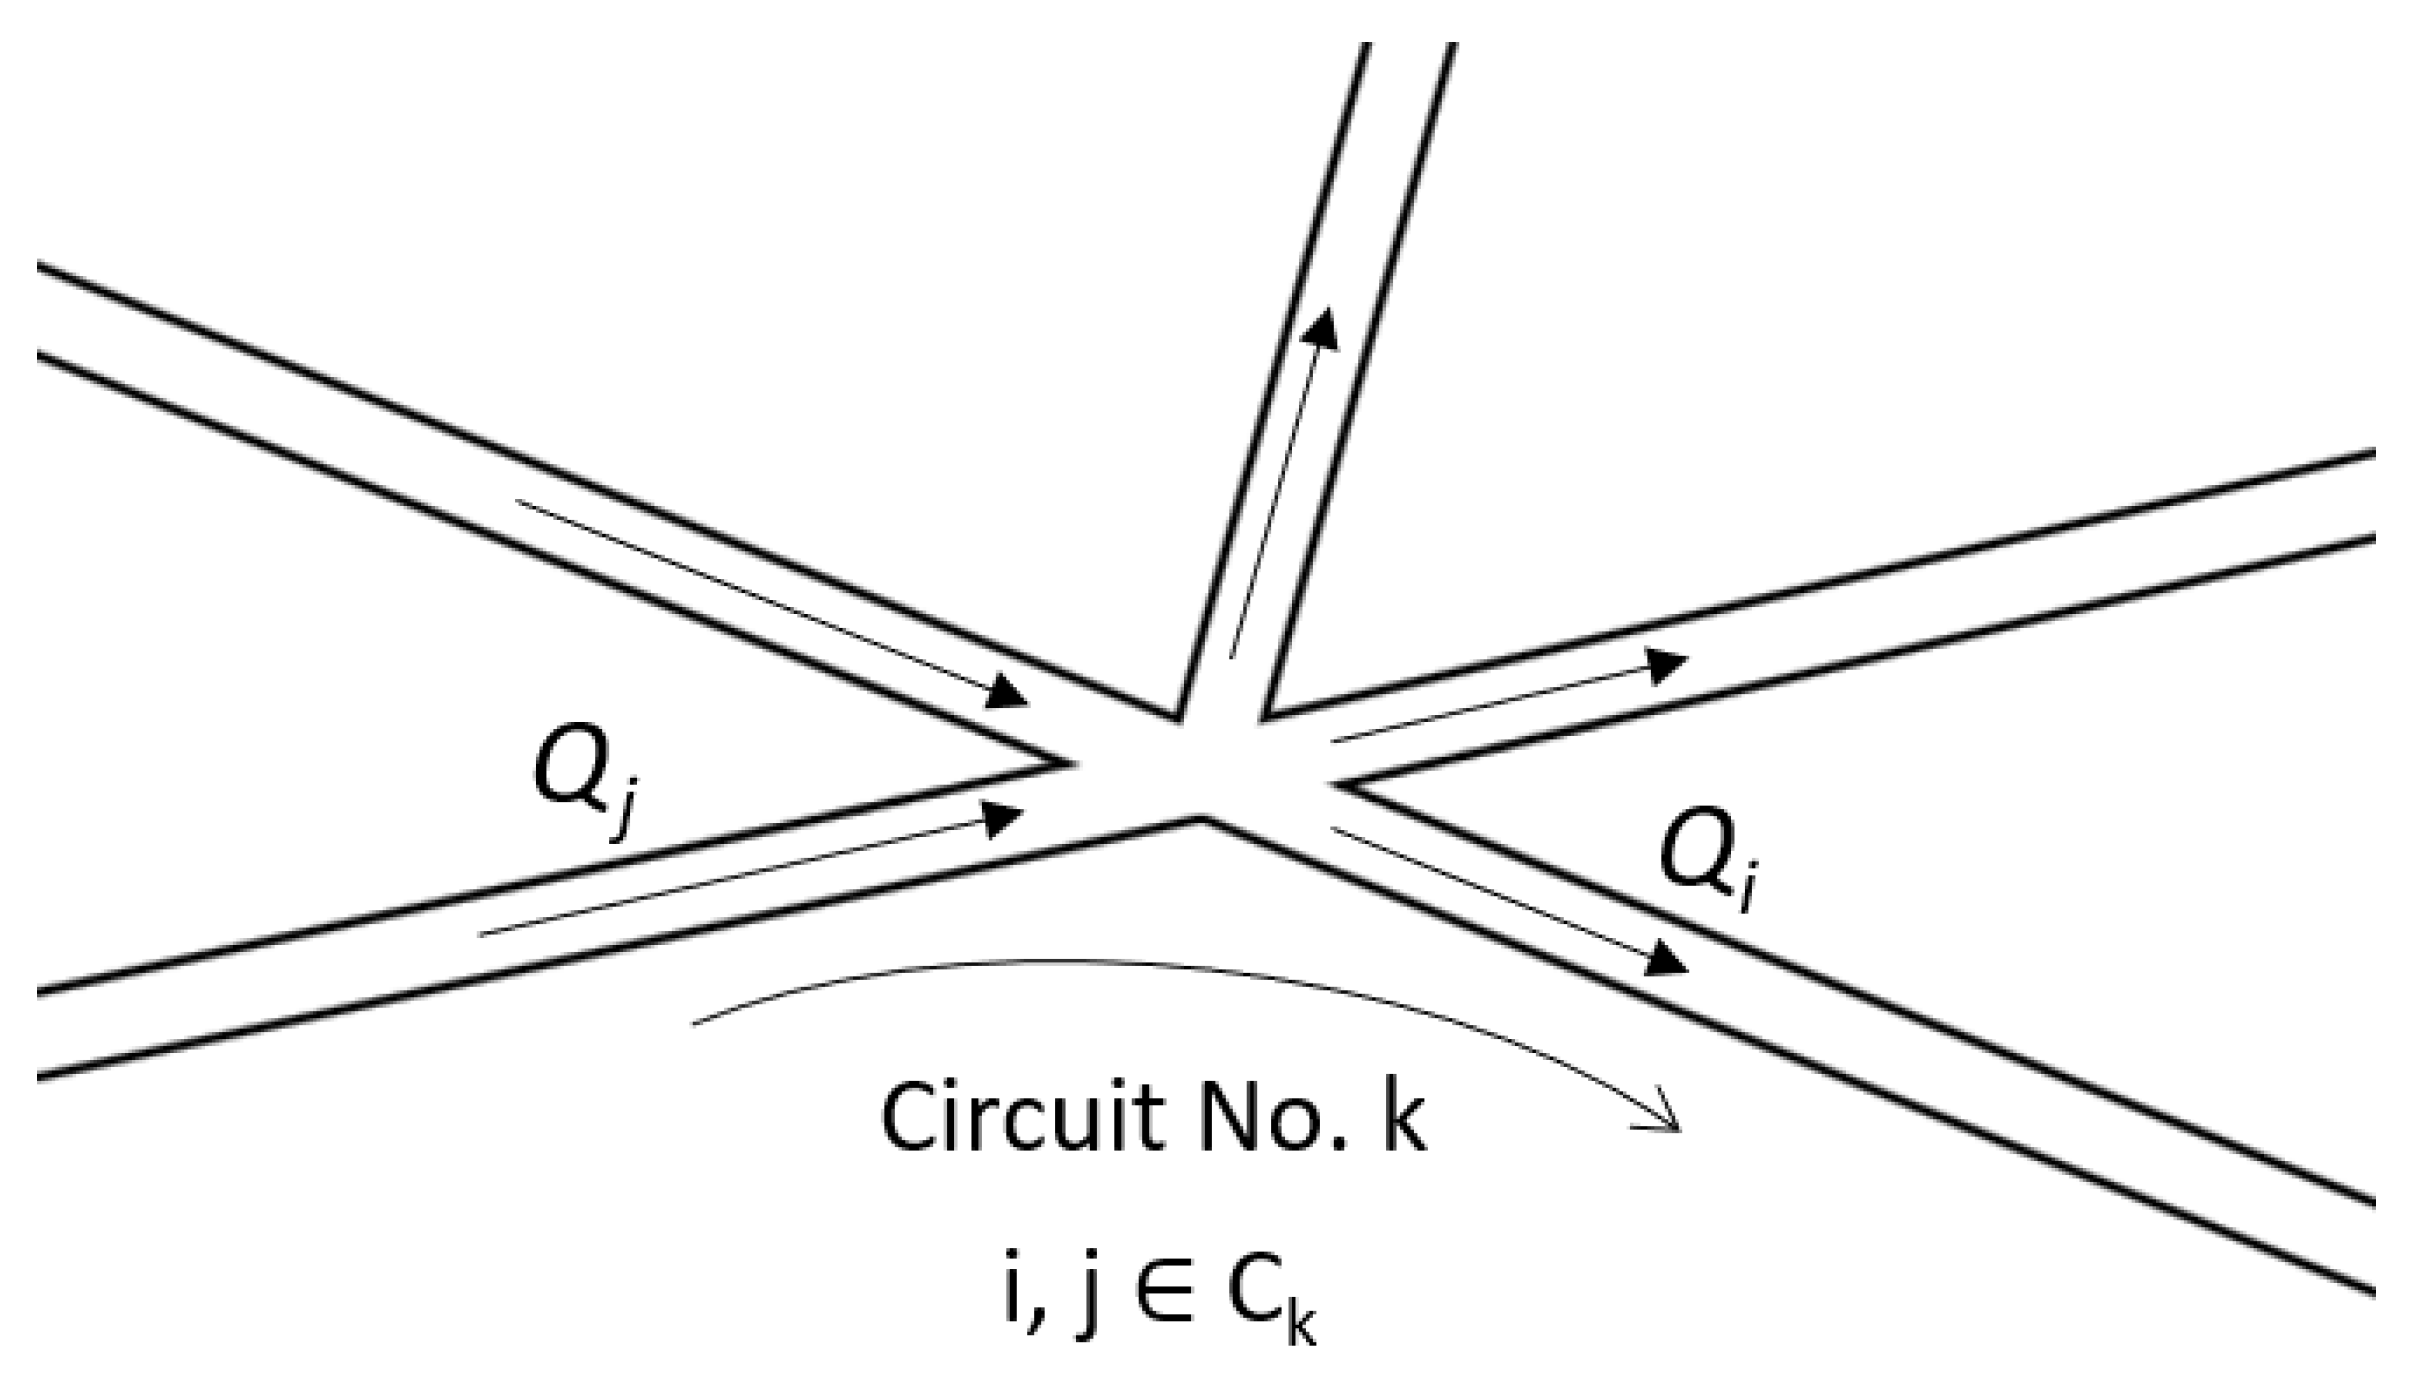
- if the direction of branch No. i coincides with the direction of bypassing loop No. k.
- if the direction of branch No. i does not coincide with the direction of bypassing loop No. k.
- if branch No. is not included in loop No. .
- if branch No. i starts at vertex No. j.
- if branch No. i ends at node No. j.
- if branch No. i is not connected to node No. j.
3. Results
3.1. Experimental Section
- Almost all other measurement points had a reversal percentage lower than 65%.
- There was a point where the percentage of reversal was unusually high, close to 100%.
3.2. Theoretical Section
4. Discussion
5. Conclusions
- Shock losses significantly affected the air distribution in the system of mine airways of the underground level. At the same time, the total air resistance of the mine was weakly dependent on the variation in shock losses. However, it also changed due to changes in natural draft.
- The changes in the distribution of air in the ventilation network were associated both with changes in the shock losses of mine airway junctions and with changes in the losses of ventilation structures at the connections between the main air supply and return airways.
- A mathematical model is proposed that can describe the air distribution in the mine ventilation network when the ventilation mode is changed. The theoretical calculations agree quite well with experimental data for the case of planned reversal of the main fan of a potash mine (relative error of no more than 15%).
Author Contributions
Funding
Data Availability Statement
Conflicts of Interest
References
- Maltsev, S.V.; Semin, M.A.; Kormshchikov, D.S. A Method to Determine Aerodynamic Drag Coefficient in Copper–Nickel Mine Shafts. J. Min. Sci. 2020, 56, 1032–1039. [Google Scholar] [CrossRef]
- Wang, J.; Jia, M.; Bin, L.; Wang, L.; Zhong, D. Regulation and Optimization of Air Quantity in a Mine Ventilation Network with Multiple Fans. Arch. Min. Sci. 2022, 67, 179. [Google Scholar]
- Semin, M.A.; Levin, L.Y.; Maltsev, S.V. Development of automated mine ventilation control systems for Belarusian potash mines. Arch. Min. Sci. 2020, 65, 803–820. [Google Scholar]
- Li, J.; Li, Y.; Zhang, J.; Li, B.; Zhang, Z.; Dong, J.; Cui, Y. Accurate and real-time network calculation for mine ventilation without wind resistance measurement. J. Wind. Eng. Ind. Aerodyn. 2022, 230, 105183. [Google Scholar] [CrossRef]
- Hao, H.; Jiang, S.; Wang, K.; Zhang, Y.; Wu, Z. Multi-branch joint adjustment method of mine ventilation based on sensitivity. Int. J. Vent. 2022, 1–18. [Google Scholar] [CrossRef]
- Kormshchikov, D.S.; Paleev, D.Y.; Minin, I.V. Introduction of Aero Set software application in mines of Ural Mining and Metallurgical Company. Gorn. Zhurnal 2021, 2021, 70–74. [Google Scholar] [CrossRef]
- Liu, L.; Liu, J.; Zhou, Q.; Huang, D. Machine learning algorithm selection for windage alteration fault diagnosis of mine ventilation system. Adv. Eng. Inform. 2022, 53, 101666. [Google Scholar] [CrossRef]
- Kychkin, A.; Nikolaev, A. IoT-based mine ventilation control system architecture with digital twin. In Proceedings of the 2020 International Conference on Industrial Engineering, Applications and Manufacturing (ICIEAM), Sochi, Russia, 18–22 May 2020; pp. 1–5. [Google Scholar]
- Kumar, M.; Maity, T.; Kirar, M.K. Energy Savings through VOD (Ventilation-on-Demand) Analysis in Indian Underground Coal Mine. IEEE Access 2022, 10, 93525–93533. [Google Scholar] [CrossRef]
- Jia, P.; Jia, J.; Song, L.; Li, Z.; Li, B. Theory of RPOD adjustment of air volume for mine intelligent ventilation. Int. J. Vent. 2022, 21, 316–329. [Google Scholar] [CrossRef]
- Isaevich, A.; Semin, M.; Levin, L.; Ivantsov, A.; Lyubimova, T. Study on the Dust Content in Dead-End Drifts in the Potash Mines for Various Ventilation Modes. Sustainability 2022, 14, 3030. [Google Scholar] [CrossRef]
- Kurnia, J.C.; Sasmito, A.P.; Mujumdar, A.S. Simulation of a novel intermittent ventilation system for underground mines. Tunn. Undergr. Space Technol. 2014, 42, 206–215. [Google Scholar] [CrossRef]
- Yi, H.; Kim, M.; Lee, D.; Park, J. Applications of Computational Fluid Dynamics for Mine Ventilation in Mineral Development. Energies 2022, 15, 8405. [Google Scholar] [CrossRef]
- Wu, Z.Y.; Jiang, S.G.; He, X.J.; Wang, L.Y.; Lin, B.Q. Study of 3-D numerical simulation for gas transfer in the goaf of the coal mining. J. China Univ. Min. Technol. 2007, 17, 152–157. [Google Scholar] [CrossRef]
- Zhang, H.; Fava, L.; Cai, M.; Vayenas, N.; Acuña, E. A hybrid methodology for investigating DPM concentration distribution in underground mines. Tunn. Undergr. Space Technol. 2021, 115, 104042. [Google Scholar] [CrossRef]
- Hu, Y.; Koroleva, O.I.; Krstić, M. Nonlinear control of mine ventilation networks. Syst. Control. Lett. 2003, 49, 239–254. [Google Scholar] [CrossRef]
- Kazakov, B.P.; Shalimov, A.V.; Semin, M.A. Stability of natural ventilation mode after main fan stoppage. Int. J. Heat Mass Transf. 2015, 86, 288–293. [Google Scholar] [CrossRef]
- Novella-Rodriguez, D.F.; Witrant, E.; Commault, C. Physical Modeling and Structural Properties of Small-Scale Mine Ventilation Networks. Mathematics 2022, 10, 1253. [Google Scholar] [CrossRef]
- Acuña, E.I.; Lowndes, I.S. A review of primary mine ventilation system optimization. Interfaces 2014, 44, 163–175. [Google Scholar] [CrossRef]
- Hurtado, J.P.; Díaz, N.; Acuña, E.I.; Fernández, J. Shock losses characterization of ventilation circuits for block caving production levels. Tunn. Undergr. Space Technol. 2014, 41, 88–94. [Google Scholar] [CrossRef]
- Gou, Y.; Shi, X.; Zhou, J.; Qiu, X.; Chen, X. Characterization and effects of the shock losses in a parallel fan station in the underground mine. Energies 2017, 10, 785. [Google Scholar] [CrossRef]
- De Souza, E. Improving the energy efficiency of mine fan assemblages. Appl. Therm. Eng. 2015, 90, 1092–1097. [Google Scholar] [CrossRef]
- McPherson, M.J. Subsurface Ventilation and Environmental Engineering; Springer Science & Business Media: Berlin, Germany, 2012. [Google Scholar]
- Zeqiri, I.; Gashi, J.; Brahimaj, F.; Zeqiri, R. Effectiveness of ventilation regulation in a simple diagonal system of underground mines. Min. Miner. Depos. 2022, 16, 81–86. [Google Scholar] [CrossRef]
- Levin, L.Y.; Semin, M.A. Influence of shock losses on air distribution in underground mines. J. Min. Sci. 2019, 55, 287–296. [Google Scholar] [CrossRef]
- Shalimov, A.V. Numerical modeling of air flows in mines under emergency state ventilation. J. Min. Sci. 2011, 47, 807–813. [Google Scholar] [CrossRef]
- Pach, G.; Różański, Z.; Wrona, P.; Niewiadomski, A.; Zapletal, P.; Zubíček, V. Reversal ventilation as a method of fire hazard mitigation in the mines. Energies 2020, 13, 1755. [Google Scholar] [CrossRef]
- Li, Z.; Lu, B.; Wang, T.; Wang, Y. Simulation on the Asynchronous Reverse Ventilation in Multi-airshaft Mine. J. Syst. Simul. 2016, 28, 2979. [Google Scholar]
- Kormshchikov, D.S.; Kuzminykh, E.G.; Semin, M.A. Safety of Reversing Air Flow in the Ventilation Shafts of the Mines in the Cold Season in the Absence of Heating. Bezop. Tr. Promyshlennosti 2022, 2022, 14–19. [Google Scholar] [CrossRef]
- Shalimov, A.V. Theoretical Foundations of Forecasting, Prevention and Control of Emergency Violations of Mine Ventilation. Ph.D. Thesis, Mining Institute, Perm, Russia, 2012; 296p. (In Russian). [Google Scholar]
- Roghanchi, P.; Kocsis, K.C. Quantifying the thermal damping effect in underground vertical shafts using the nonlinear autoregressive with external input (NARX) algorithm. Int. J. Min. Sci. Technol. 2019, 29, 255–262. [Google Scholar] [CrossRef]
- Merenkov, A.P.; Khasilev, V.Y. Theory of Hydraulic Circuits; Nauka Publishing House: Moscow, Russia, 1985; 230p. [Google Scholar]
- Levin, L.Y.; Semin, M.A.; Gazizullin, R.R. Development of local resistance determinaton method for mine ventilation networks. Min. Inf. Anal. Bull. 2014, 2014, 200–205. [Google Scholar]
- Bascompta, M.; Sanmiquel, L.; Anticoi, H.F.; Oliva, J. Ventilation friction factor determination and comparison: Two case studies of potash mining. J. South. Afr. Inst. Min. Metall. 2019, 119, 865–870. [Google Scholar] [CrossRef]
- Mokhirev, N.N.; Luk’ianov, N.G. The coefficient of aerodynamic resistance of potassium mine workings. Vent. Shafts Mines 1977, 4, 72–76. (In Russian) [Google Scholar]
- Şuvar, M.; Cioclea, D.; Gherghe, I.; Păsculescu, V. Advanced software for mine ventilation networks solving. Environ. Eng. Manag. J. 2012, 11, 1235–1239. [Google Scholar] [CrossRef]
- Kazakov, B.P.; Shalimov, A.V.; Levin, L.Y. Ventilating large cross-section tunnels with using ventilator working without a brattice. Proc. Tula States Univ.-Sci. Earth 2010, 2, 89–97. [Google Scholar]
- Meyer, J.P.; Marx, W.M. The Minimizing of Pressure Losses in a Fan Drift-Mine Shaft Intersection, Using Computational Fluid Dynamics. Res. Dev. J. 1993, 9, 3. [Google Scholar]
- Tukkaraja, P.; Sastry, B.S.; Samanta, B. Estimation of shock loss factors at shaft bottom junction using computational fluid dynamics and scale model studies. CIM J. 2010, 1, 130–139. [Google Scholar]


| No. | Location | Airflow, m3/s | RRN, % | |
|---|---|---|---|---|
| Normal Mode | Reverse Mode | |||
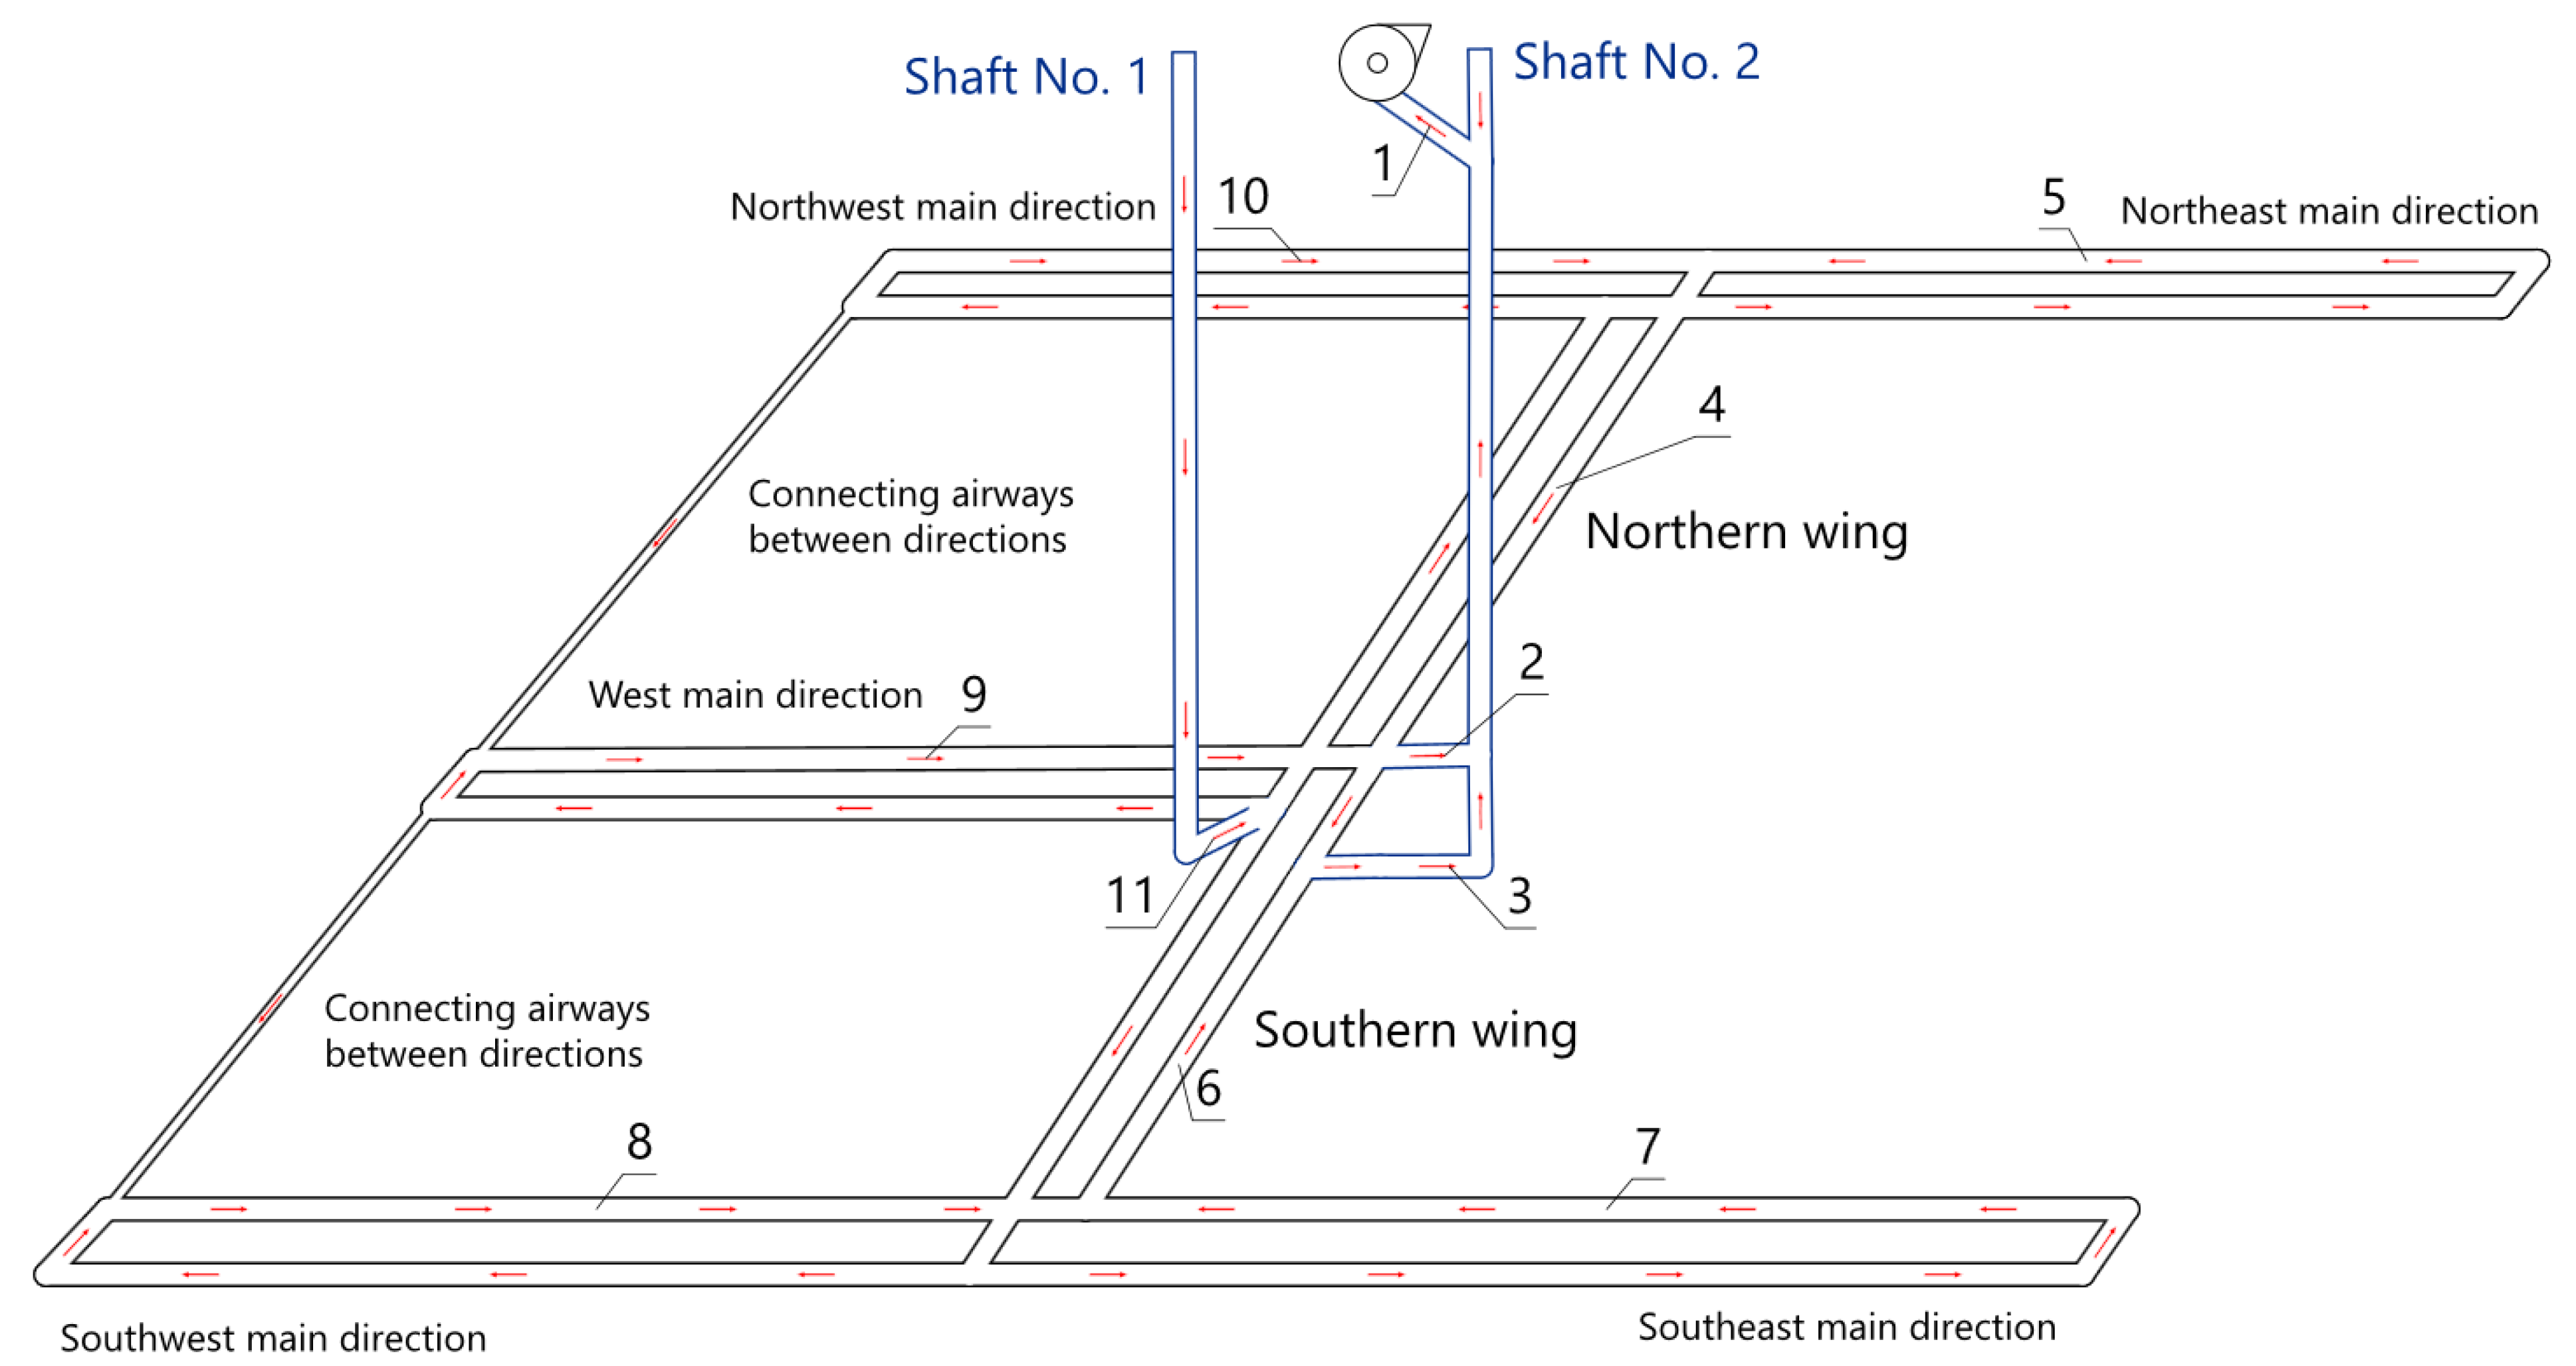
| 1 | Main fan drift | 401.2 | 260.0 | 64.8 |
| 2 | Ventilation shaft (elev. of −222 m) | 305.4 | 181.8 | 59.5 |
| 3 | Ventilation shaft (elev. of −258 m) | 63.2 | 62.9 | 99.5 |
| 4 | Northern wing | 51.5 | 29.4 | 57.1 |
| 5 | Main northeast direction | 33.9 | 19.1 | 56.3 |
| 6 | Main northwest direction | 35.5 | 20.6 | 58.0 |
| 7 | Southern wing | 81.4 | 44.2 | 54.3 |
| 8 | Main southeast direction | 10.4 | 4.7 | 45.3 |
| 9 | Main southwest direction | 31.7 | 16.4 | 51.7 |
| 10 | Main west direction | 70.3 | 36.6 | 52.0 |
| 11 | Air-supply shaft (elev. of −259 m) | 324 | 214.9 | 66.3 |
| Parameter | Normal Mode | Reverse Mode | Change, % |
|---|---|---|---|
| Discharge, m3/s | 401 (375) | 260 (255) | 64.8 (68) |
| Head, Pa | 2380 (1700) | 800 (950) | 27.3 (55.8) |
| Air resistance of the underground part of the mine, N·s2/m8 | 0.0148 (0.0121) | 0.0118 (0.0147) | 64.8 (121.5) |
| Measuring Point | Normal Mode | Reverse Mode | ||
|---|---|---|---|---|
| Humidity, % | Humidity, % | |||
| Atmosphere | 20.0 | 50.0 | 21.6 | 41.0 |
| 1 | 7.0 | 30.0 | 19.8 | 47.5 |
| 2 | 15.8 | — | 16.4 | — |
| 10 | 12.3 | — | 11.5 | — |
| 11 | 19.1 | 50.8 | 16.2 | 60.4 |
| Measuring Point | Measured RRN, % | Simulation | |||
|---|---|---|---|---|---|
| Calculated RRN (Shock Losses), % | Deviation from Meas., % | Calculated RRN (Shock Losses + Leakages), % | Deviation from Meas., % | ||
| Main fan drift | 64.8 | 61.9 | −4.4 | 61.2 | −5.5 |
| Ventilation shaft (elev. of −222 m) | 59.5 | 57.7 | −3.1 | 56.9 | −4.4 |
| Ventilation shaft (elev. of −258 m) | 99.5 | 86.7 | −12.8 | 85.4 | −14.2 |
| Northern wing | 57.1 | 62.3 | 9.1 | 61.2 | 7.2 |
| Main northeast direction | 56.3 | 56.4 | 0.2 | 52.9 | −6.0 |
| Main northwest direction | 58.0 | 67.6 | 16.6 | 62.6 | 7.9 |
| Southern wing | 54.3 | 58.9 | 8.4 | 57.9 | 6.6 |
| Main southeast direction | 45.3 | 58.1 | 28.2 | 48.4 | 6.8 |
| Main southwest direction | 51.7 | 57.6 | 11.3 | 52.8 | 2.1 |
| Main west direction | 52.0 | 60.3 | 15.9 | 55.2 | 6.2 |
| Month | Experiment | Simulation | |||
|---|---|---|---|---|---|
| Without Natural Draft | Deviation, % | Including Natural Draft | Deviation, % | ||
| June | 0.0118 | 0.0132 | 11.9% | 0.0122 | 3.3% |
| October | 0.0147 | 0.0132 | 10.2% | 0.0145 | 1.3% |
Disclaimer/Publisher’s Note: The statements, opinions and data contained in all publications are solely those of the individual author(s) and contributor(s) and not of MDPI and/or the editor(s). MDPI and/or the editor(s) disclaim responsibility for any injury to people or property resulting from any ideas, methods, instructions or products referred to in the content. |
© 2023 by the authors. Licensee MDPI, Basel, Switzerland. This article is an open access article distributed under the terms and conditions of the Creative Commons Attribution (CC BY) license (https://creativecommons.org/licenses/by/4.0/).
Share and Cite
Semin, M.; Levin, L. Mathematical Modeling of Air Distribution in Mines Considering Different Ventilation Modes. Mathematics 2023, 11, 989. https://doi.org/10.3390/math11040989
Semin M, Levin L. Mathematical Modeling of Air Distribution in Mines Considering Different Ventilation Modes. Mathematics. 2023; 11(4):989. https://doi.org/10.3390/math11040989
Chicago/Turabian StyleSemin, Mikhail, and Lev Levin. 2023. "Mathematical Modeling of Air Distribution in Mines Considering Different Ventilation Modes" Mathematics 11, no. 4: 989. https://doi.org/10.3390/math11040989
APA StyleSemin, M., & Levin, L. (2023). Mathematical Modeling of Air Distribution in Mines Considering Different Ventilation Modes. Mathematics, 11(4), 989. https://doi.org/10.3390/math11040989