Abstract
Determining the attitude of a non-cooperative target in space is an important frontier issue in the aerospace field, and has important application value in the fields of malfunctioning satellite state assessment and non-cooperative target detection in space. This paper proposes a non-cooperative target attitude estimation method based on the deep learning of ground and space access (GSA) scene radar images to solve this problem. In GSA scenes, the observed target satellite can be imaged not only by inverse synthetic-aperture radar (ISAR), but also by space-based optical satellites, with space-based optical images providing more accurate attitude estimates for the target. The spatial orientation of the intersection of the orbital planes of the target and observation satellites can be changed by fine tuning the orbit of the observation satellite. The intersection of the orbital planes is controlled to ensure that it is collinear with the position vector of the target satellite when it is accessible to the radar. Thus, a series of GSA scenes are generated. In these GSA scenes, the high-precision attitude values of the target satellite can be estimated from the space-based optical images obtained by the observation satellite. Thus, the corresponding relationship between a series of ISAR images and the attitude estimation of the target at this moment can be obtained. Because the target attitude can be accurately estimated from the GSA scenes obtained by a space-based optical telescope, these attitude estimation values can be used as training datasets of ISAR images, and deep learning training can be performed on ISAR images of GSA scenes. This paper proposes an instantaneous attitude estimation method based on a deep network, which can achieve robust attitude estimation under different signal-to-noise ratio conditions. First, ISAR observation and imaging models were created, and the theoretical projection relationship from the three-dimensional point cloud to the ISAR imaging plane was constructed based on the radar line of sight. Under the premise that the ISAR imaging plane was fixed, the ISAR imaging results, theoretical projection map, and target attitude were in a one-to-one correspondence, which meant that the mapping relationship could be learned using a deep network. Specifically, in order to suppress noise interference, a UNet++ network with strong feature extraction ability was used to learn the mapping relationship between the ISAR imaging results and the theoretical projection map to achieve ISAR image enhancement. The shifted window (swin) transformer was then used to learn the mapping relationship between the enhanced ISAR images and target attitude to achieve instantaneous attitude estimation. Finally, the effectiveness of the proposed method was verified using electromagnetic simulation data, and it was found that the average attitude estimation error of the proposed method was less than 1°.
MSC:
68T07
1. Introduction
Determining the attitude of a non-cooperative target in space has important application value in the aerospace field. Potential applications include assessing the flight state of a malfunctioning satellite, preparing target information for space debris-related missions [1,2], and estimating the point on the ground where a remote sensing satellite’s lens is pointing by estimating its attitude [3].
Inverse synthetic-aperture radar (ISAR) is a type of ground-based radar used for space targets. It can be used to acquire target images under all weather conditions and at all times.
Because the ISAR imaging detection of space targets can obtain information about a target’s attitude over a long distance, it is an important means of estimating the attitudes of non-cooperative targets in space.
In terms of ISAR image attitude determination, because a single ISAR image of a single station is not sufficient for three-dimensional space attitude estimation, multi-station ground-based radar co-vision has been used in many studies for ISAR image attitude determination [4,5]. For attitude estimation based on sparse image data, informatics methods are used, such as multi-feature fusion [6], compressed sensing [7], a hidden Markov model [8], accommodation parameters [9], and a Gaussian window [10]. In recent years, with the development of artificial intelligence neural network technology, the application of a deep learning network to attitude estimation using ISAR images has obtained better simulation data [3,11,12]. Although various methods are used, ISAR-based image attitude estimation is still less accurate than optical-image attitude estimation.
In terms of optical-image attitude determination, in recent years, convolutional neural network (CNN) technology has realized highly accurate reconstruction and attitude estimation based on optical images. In fields such as human-organ image reconstruction [13,14,15], multi-view image reconstruction [16,17], wave modeling [18], face modeling [19], architectural modeling [20], and human pose analysis, a CNN can achieve three-dimensional reconstruction and attitude estimation [21,22].
In space-based optical image attitude determination, CNNs are mainly used in fields such as space target imaging [23,24,25,26] and autonomous rendezvous and docking [27,28]. Its attitude determination method is often combined with the three-dimensional modeling and recognition of the target [29,30]. In recent years, artificial neural networks have achieved good application results in the fields of the three-dimensional reconstruction and the attitude estimation of targets in space [31,32,33,34].
This paper is structured as follows. Section 2 presents a method of non-cooperative target attitude estimation. This is a non-cooperative target attitude estimation method based on the machine learning of GSA scene radar images. Section 3 presents the construction method for the GSA scenes. Section 4 gives the framework used for the machine learning. Section 5 shows how the effectiveness of the attitude estimation method proposed in this paper was verified using a test bed with high-fidelity simulation data. Section 6 summarizes the full text.
2. Non-Cooperative Target Attitude Estimation Method Based on Machine Learning of Radar Images in GSA Scenes
A direct way to use radar images to determine attitude is to use a deep learning neural network to learn radar images. After training, the network can output the attitude.
However, this is based on the premise that the training dataset shows a one-to-one correspondence between the radar images and attitude values.
This requires the training data to meet two necessary conditions.
(1) There is a one-to-one correspondence between the radar images and attitude values.
First, the observation coordinate system shown in Figure 1 needs to be defined.
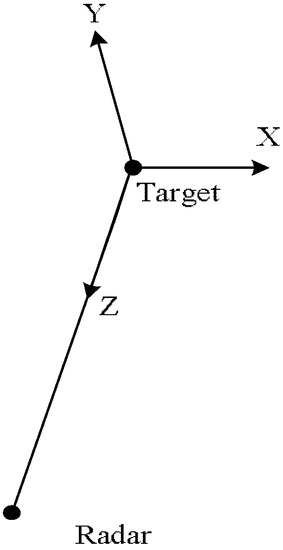
Figure 1.
Schematic diagram of the observation coordinate system.
The vector direction of the target pointing to the radar is taken as the Z axis, and the direction of the cross product between the relative velocity direction and the Z axis is taken as the Y axis. The right-hand rule is used with Z and Y to determine the X axis, and the origin of the coordinate system is located at the centroid of the target.
The attitude angle in the following observation coordinate system then needs to be defined.
The Euler angle that rotates from the target body coordinate system, Body, to the observation coordinate system, Obs, is the attitude angle in the observation system.
Finally, the following lemma needs to be given.
Lemma 1.
The attitude angles of a space target in the observation coordinate system have a one-to-one correspondence with the ISAR images.
Only when the attitudes are defined in the observation coordinate system can the target radar images have a one-to-one correspondence with the attitude values. In other words, if two radar images are identical, they must have the same attitude values in the observation coordinate system. This is because when the attitude angle of the observation system is determined, the angles between the direction of the radar waves irradiating the target and the X, Y, and Z axes of the target body coordinate system are uniquely determined.
(2) The data should come from GSA scenes.
When the radar images the target, in order to obtain an accurate value for the target’s attitude, a space-based satellite should be used to simultaneously image the target and estimate the attitude, as shown in Figure 2 below.
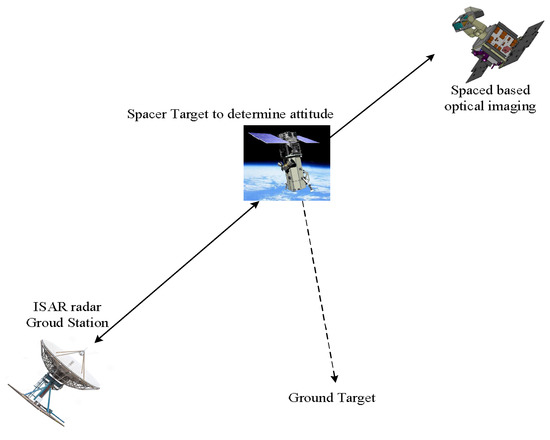
Figure 2.
GSA scene.
As stated in the literature review, methods have been developed to determine the attitude based on optical images, and determining the attitude of a target based on space-based optical images is also an engineering problem that has been solved. Therefore, this is not the research content of this paper. The only problem that needs to be solved is the simultaneous use of a satellite in space to optically image the target at the moment of radar imaging. This concerns the construction of GSA scenes, as discussed in the next section.
3. Building of GSA Scene with Co-Vision from Space and Earth
3.1. Methods and Ideas
Here, the ground station is designated as GS. The target satellite to be observed by the GSA is Sat_Target, and the shooting satellite is Sat_Obs. The basic idea of building GSA scenes is to slightly change the orbital parameters of Sat_Obs, Ha (apogee height) and Hp (perigee height), so that Sat_Obs is close to Sat_Target while Sat_Target can be observed by the ISAR of GS, thus generating GSA scenes.
3.2. Method for Solving Orbital Maneuver
3.2.1. Step 1: Alignment Maneuver of the Track Surface Intersection
The intersection vector of the Sat_Obs orbital plane and Sat_Target orbital plane is set as , which can be expressed as follows:
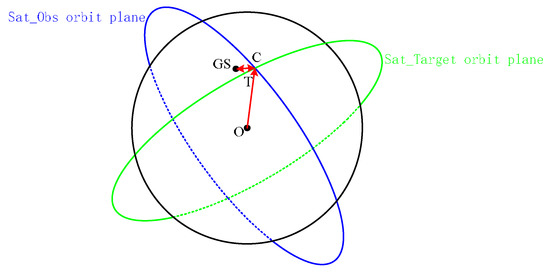
Figure 3.
GSA scene building principle.
As shown in Figure 3, as long as and coincide, GSA can be generated.
where and are defined as follows:
where Ω, , , , and are the right ascension, horizontal velocity, inclination, semi-major axis, and eccentricity of the ascending node of satellite Sat_Target and satellite Sat_Obs, respectively. Re is the Earth’s radius, and J2 is the J2-perturbed parameter.
The required orbital adjustment can be obtained using the following algorithm. This algorithm mainly realizes the alignment of the two orbital plane intersections by using the change in the orbital plane intersection caused by the orbital plane precession of the J2 gravitational term.
Algorithm 1.
Step A: Calculate all the access of Sat_Target to GS, and get the sequence of [T_access, XYZ_access], where T_access is the sequence of all the access moments, and XYZ_access is the XYZ position coordinates in the J2000 coordinate system corresponding to these access moments.
Step B: Search for a suitable T_access within the acceptable range of a and e changes, so as to satisfy the following:
As long as the above equation is satisfied, intersection point C of the orbital planes of the two satellites can be made accessible to GS, thereby completing the alignment of the intersecting orbital planes.
3.2.2. Step 2: In-Plane Pursuit Orbital Maneuver
Only the orbital plane conditions are produced in the last step, and it is necessary to carry out orbit control of Sat_Obs in the orbital plane one or two orbital periods before reaching the intersection point, as well as mild control of a, e, and ω (argument of perigee), so that Sat_Obs can chase after Sat_Target in the orbital plane and reach XYZ_access at time T_access. This problem can be solved as a Lambert problem. This kind of in-plane catching-up problem has been well solved in academia, so no further description is given here.
3.3. Calculation Example
The initial conditions are listed in Table 1. The latitude and longitude of GS are 31.1 N 121.3 E.

Table 1.
Initial calculation conditions.
Based on Sat_Target and GS, the [T_access, XYZ_access] sequence is calculated first, and then shooting changes Ha and Hp to minimize the difference between and XYZ_access.
This example shows that when the apogee altitude of Sat_Obs increases by 19 km and the perigee altitude increases by 29.3 km, can almost coincide with XYZ_access when T_access is 2022-12-4 11:28:29, and the difference is equivalent to a distance between them of only 6 km, as shown in Figure 4. This distance is sufficient for Sat_Obs to perform high-definition imaging and high-precision attitude determination of Sat_Target using an optical telescope.
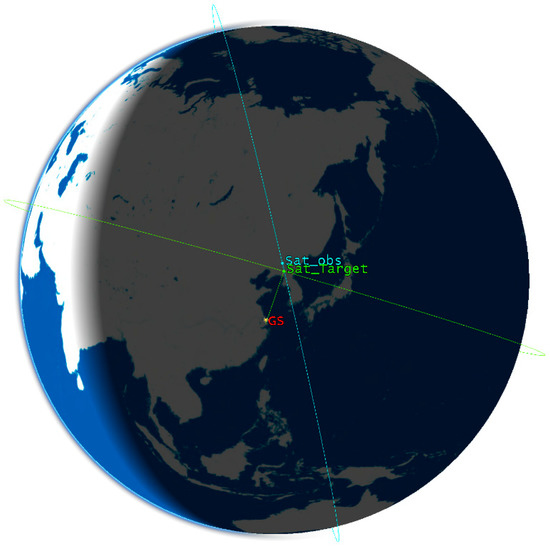
Figure 4.
Calculation example scene.
4. Attitude Estimation Based on Deep Network
4.1. Brief Introduction
Space target state estimation aims to obtain state parameters such as the target’s on-orbit attitude movement and geometric structure. It is a key technology for completing tasks such as target action intention analysis, troubleshooting potential failure threats, and predicting on-orbit situations. This study had the goal of providing a method for determining the real attitude of a target using an optical telescope and learning the mapping relationship between ISAR images and the real attitudes using a deep network so as to efficiently realize instantaneous attitude estimation based on single-frame ISAR images.
4.2. Attitude Estimation Modeling
In the orbital coordinate system, the on-orbit attitude of a three-axis stable space target remains unchanged. ISAR is used to observe the target for a long time. The movement of the target along its orbit makes the target rotate relative to the radar line of sight and produce Doppler modulation on the echo. A sequence of high-resolution ISAR images of the target can be obtained by the sub-aperture division and imaging processing of the echo data.
An ISAR observation and imaging model of a three-axis stable space target is shown in Figure 5, in which O-XYZ represents the orbital coordinate system. In the long-term continuous observation process, the radar line of sight at each observation moment forms a green curved surface in Figure 5. Among these, the direction vector of the radar line of sight at time is determined by pitch angle and azimuth angle . Specifically, is the angle between the radar line of sight and its projection vector on the XOY plane, and is the rotation angle of and the X axis in the counterclockwise direction, with and . The radar line-of-sight direction vector at time can be expressed as follows:
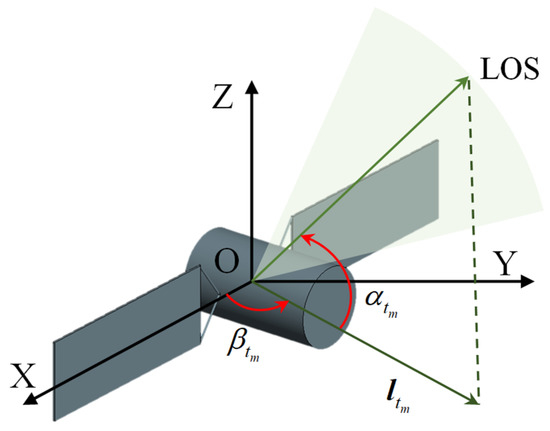
Figure 5.
ISAR observation and imaging model.
For the kth scattering center, , on the target, its coordinates are recorded as . The projection of the scattering center in the distance direction of the ISAR imaging plane is shown as follows:
The velocity of the scattering center along the distance direction is calculated as follows:
where
and and represent the change rates of the pitch angle and azimuth angle at time , respectively. Then, the Doppler of scattering center at time can be obtained:
where is the wavelength of the signal emitted by the radar. Therefore, at time , the projection position of scattering center on the imaging plane satisfies the following equation:
where is the projection coordinates of the scattering center, and is the imaging projection matrix.
The on-orbit attitude of the target is defined by the Euler angle, and , , and represent the azimuth, pitch, and yaw of the attitude angle, respectively. Compared to the target body coordinate system, the target attitude in the orbit coordinate system is determined by the three-dimensional rotation matrix, , as follows:
where , , and represent the rotation matrices corresponding to the Euler angles. Assuming that the coordinates of scattering center are in the target body coordinate system, the following equation is obtained:
Then, considering the attitude of the target in the orbital coordinates, the projection relation of the ISAR imaging of the scattering center at time can be completely expressed as follows:
4.3. Attitude Estimation Based on Deep Network
In order to realize the instantaneous attitude estimation of the space target, this section proposes instantaneous attitude estimation methods based on a deep network, namely ISAR image enhancement based on UNet++ [35] and instantaneous attitude estimation based on the shifted window (swin) transformer [36]. Finally, the training steps of the proposed methods are given.
4.3.1. ISAR Image Enhancement Based on UNet++
ISAR observes and receives the echoes from non-cooperative targets, compensates the translation components, which are not beneficial to imaging, and then transforms them into turntable models for imaging. However, because of the occlusion effect, the key components of the target can be missing in the imaging results, and the quality of the imaging results can be poor under noisy conditions. These problems can lead to a low-accuracy attitude estimation based on a deep network. To enhance the ISAR imaging results, UNet++, which has strong feature extraction ability, is used to learn the mapping relationship between the ISAR imaging results and theoretical binary projection images, and to provide high-quality imaging results for subsequent attitude estimation.
A flow chart of the ISAR image enhancement based on UNet++ is shown in Figure 6. The network input is the ISAR imaging result, and the deep features of the ISAR image are extracted through a series of convolution and down-sampling operations. The image is then restored by up-sampling, and more high-resolution information is obtained by using a dense jump connection. Thus, the details of the input image can be more completely restored, and the restoration accuracy can be improved. In order to make full use of the structural advantages of UNet++ and to apply it to ISAR image enhancement, a convolution layer with one channel is added after , , , and , and its output is averaged to obtain the final ISAR image enhancement result.
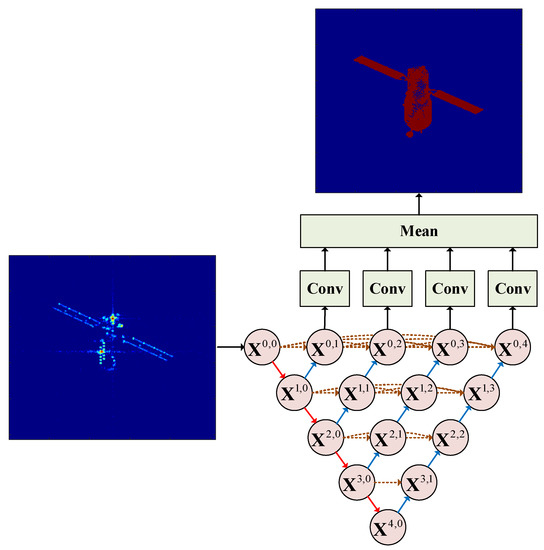
Figure 6.
Flow chart of ISAR image enhancement based on UNet++.
Let represent the output of node , where represents the down-sampling layer number of the encoder, and represents the convolution layer number of the dense hopping connection. The output of each node can then be expressed as follows:
where represents two convolution layers with linear rectification activation functions. The convolution kernel size is , and the number of convolution kernels is shown in Table 2. As shown by the red downward arrow in Figure 6, represents the down-sampling operation, which is realized by a pool layer with kernels, as shown by the blue upward arrow in Figure 6. represents the up-sampling operation, which is realized by a deconvolution layer with kernels and a step size of 2. In addition, indicates a splicing operation, and the brown arrow indicates a dense jump connection.

Table 2.
Number of convolution kernels.
To achieve better ISAR image enhancement results, the proposed method uses theoretical binary projection images as labels for end-to-end training, and the loss function is defined as the normalized mean square error between network output and label ,
where represents the Frobenius norm.
4.3.2. Instantaneous Attitude Estimation Based on Swin Transformer
When the radar line of sight is fixed, the attitude angle has a one-to-one correspondence to the enhanced ISAR image. Therefore, this study used the swin transformer to learn the mapping relationship.
A flow chart of the instantaneous attitude estimation based on the swin transformer is shown in Figure 7. First, an enhanced ISAR imaging result with a size of is inputted into the network. It is then divided into non-overlapping patch sets by patch partition, based on a patch of 4 × 4 adjacent pixels, and each patch is flattened in the channel direction to obtain a feature map of . Four stages are then stacked to build feature maps of different sizes for attention calculation. The first stage changes the feature dimension from 16 to using linear embedding, and the other three stages are down-sampled by patch merging. Thus, the height and width of the feature maps are halved, and the depth is doubled. The feature map sizes are , , and . After changing the dimension of the feature maps, the swin transformer modules are repeatedly stacked, with the swin transformer modules in subsequent stages stacked 2, 2, 6, and 2 times. A single swin transformer module is shown in the dashed box on the right side of Figure 7. It is connected using layer normalization (LN) with a windows multi-head self-attention (W-MSA) module, or a shifted windows multi-head self-attention (SW-MSA) module, in which the LN layer is used to normalize different channels of the same sample to ensure the stability of the data feature distribution. Among them, the self-attention mechanism [37] is the key module of the transformer, and its calculation method is as follows:
where is the query, is the key, is the value, and is the query dimension.
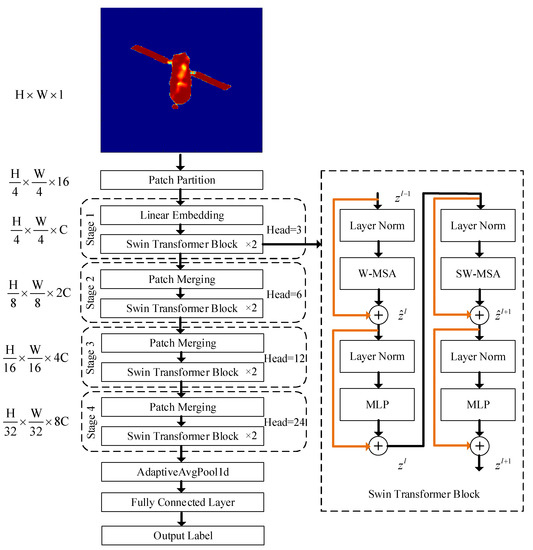
Figure 7.
Flow chart of attitude estimation based on swin transformer.
Multi-head self-attention is used to process the original input sequence into self-attention groups, splice the results, and perform a linear transformation to obtain the final output result:
where each self-attention module defines , and the weight matrix satisfies the following:
W-MSA in the swin transformer module further divides the image block into non-overlapping areas and calculates the multi-head self-attention in the areas. In W-MSA, only the self-attention calculation is performed in each window. Thus, the information cannot be transmitted between windows. Therefore, the SW-MSA module is introduced. After the non-overlapping windows are divided in the Lth layer, the windows are re-divided in the Lth+1 layer with an offset of half the window distance, which allows the information of some windows in different layers to interact. Next, another LN layer is inputted to connect the multilayer perceptron (MLP). The MLP is a feedforward network that uses the GeLU function as an activation function, with the goal of completing the non-linear transformation and improving the fitting ability of the algorithm. In addition, subsequent stages have 3, 6, 12, and 24 heads. The residual connection added to each swin transformer module is shown in the yellow line in Figure 7. This module has two different structures and needs to be used in pairs: the first structure uses W-MSA, and the second structure connects with SW-MSA. During the process of passing through this module, the output of each part is shown in Equations (19)–(22):
The dimension of the last stage output feature is . A feature vector with a length of can be obtained by a one-dimensional AdaptiveAvgPool1d with an output dimension of 1, and the Euler angle estimation can be obtained by a fully connected layer with a dimension of 3.
The network loss function is defined as the mean square error between output Euler angle and label Euler angle :
where three Euler angles are represented as .
The swin transformer has the hierarchy, locality, and translation invariance characteristics. The hierarchy is reflected in the feature extraction stage, which uses a hierarchical construction method similar to a CNN. The input image is down-sampled 4 times, 8 times, and 16 times to obtain a multi-scale feature map. The locality is mainly reflected in the process of the self-attention calculation, in which the calculation is constrained in a divided local non-overlapping window. The calculation complexity of W-MSA and traditional MSA is as follows:
where is the window size for the self-attention calculation. It can be seen that the complexity of the algorithm has changed from a square relationship with the image size to a linear relationship, which greatly reduces the amount of calculation and improves the efficiency of the algorithm. In SW-MSA, the division of non-overlapping windows is offset by half a window compared with W-MSA, which allows the information of the upper and lower windows to effectively interact. Compared with the common sliding window design in a CNN, it retains the translation invariability without reducing the accuracy.
4.3.3. Network Training
The proposed method consists of two deep networks, the UNet++ for ISAR image enhancement and the swin transformer for attitude estimation. During network training, the epoch is set to 100, the batch size is set to 32, and the initial learning rate is set to . With an increase in the epoch, exponential attenuation is then performed with an attenuation rate of 0.98. Finally, the network parameters are optimized using the Adam optimizer. For each epoch, the network training steps can be summarized as follows:
(1) Randomly obtain an ISAR imaging result for the batch size from a training dataset;
(2) Input the ISAR imaging results into UNet++, output the enhanced ISAR imaging results, and calculate the loss function according to Equation (15);
(3) Input the enhanced ISAR imaging results into the swin transformer, output the Euler angle estimation values, and calculate the loss function according to Equation (22);
(4) Update the swin transformer network parameters;
(5) Update the UNet++ network parameters;
(6) Repeat steps 1–5 until all the training data are taken.
After the network is trained, any ISAR imaging result can be inputted into the network to simultaneously realize ISAR image enhancement and instantaneous attitude estimation.
5. Data Simulation Verification Results
5.1. Basic Settings
This section shows how Tiangong was chosen as the observation target. Its three-dimensional model is shown in Figure 8. After obtaining a three-dimensional model, an attitude estimation simulation experiment was carried out to verify the effectiveness of the proposed method. First, an echo was simulated by FEKO electromagnetic calculation software using the simulation parameters listed in Table 3.
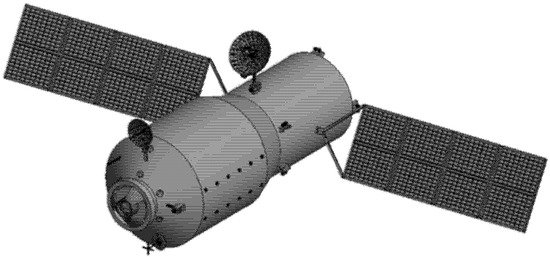
Figure 8.
Three-dimensional model of Tiangong.

Table 3.
Radar simulation parameters.
5.2. Data Generation and Processing
(1) Data set generation: As can be seen from Table 3, the radar line of sight was fixed, the pitch angle was 0°, the azimuth angle varied from −2.55 to +2.55, and the angular interval was 0.02°. At this time, the ISAR imaging results showed a one-to-one correspondence to its attitude angle (namely the Euler angle). Therefore, in order to obtain the training dataset, a total of 5000 ISAR imaging results with randomly varying attitude angles were generated by simulation, and a theoretical binary projection diagram was generated by Equation (10). The ISAR imaging results, theoretical binary projection diagram, and attitude angles were used for training. Three Euler angles were randomly distributed between −45° and +45°, with 4000 ISAR imaging results used for training sets and 1000 used for testing sets.
(2) ISAR image enhancement: First, ISAR imaging results were taken as network inputs, and UNet++ was trained with theoretical binary projection as the label. After training UNet++, ISAR imaging results were randomly used for testing. An imaging result is shown in Figure 9. It can be seen that the network output and theoretical binary projection results were similar after the ISAR imaging results were enhanced by the proposed method, which proved the effectiveness of the proposed method.
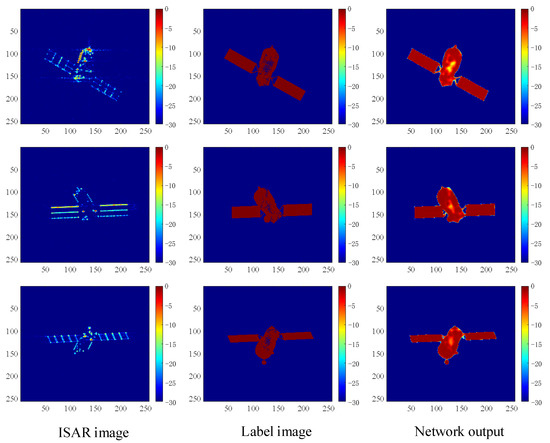
Figure 9.
ISAR image enhancement results based on UNet++.
(3) Instantaneous attitude estimation: In order to realize instantaneous attitude estimation, the original ISAR images and image enhancement results were used as inputs, and the true value of the Euler angle was used as a label to train the swin transformer. Table 4 lists the average Euler angle estimation error on 1000 test datasets after training. It can be seen that the attitude estimation error with image enhancement was smaller than that without image enhancement, which proved the effectiveness of the proposed method. Random ISAR imaging results were taken for testing. Test data 1 is shown in Figure 10 and Figure 11, and the attitude estimation results are listed in Table 5 and Table 6. It can be seen that the data enhancement results were clear enough to show the structural components of the target, and the attitude estimation result was more accurate with less error, which proved the effectiveness of the proposed method.

Table 4.
Euler angle estimation error based on swin transformer.

Figure 10.
The imaging results of test data 1.

Figure 11.
The imaging results of test data 2.

Table 5.
The attitude estimation results of test data 1.

Table 6.
The attitude estimation results of test data 2.
5.3. Noise Robustness Analysis
To analyze the robustness of the proposed method to noise, the signal-to-noise ratio (SNR) of the training dataset was set to randomly change within a range of −3 dB to +15 dB, and the test SNR was set to 0, 5, and 10 dB. Table 7 shows the average Euler angle estimation error of 1000 test samples after the network training. It can be seen that the proposed method had the smallest estimation error under the different SNR conditions, and the fluctuation was small, which proved that the proposed method is robust to noise.

Table 7.
Average Euler angle estimation error values of test set under different SNR conditions.
At the same time, two random test images were selected for visual analysis. The imaging results are shown in Figure 12 and Figure 13, and the Euler angle estimation results are listed in Table 8 and Table 9.
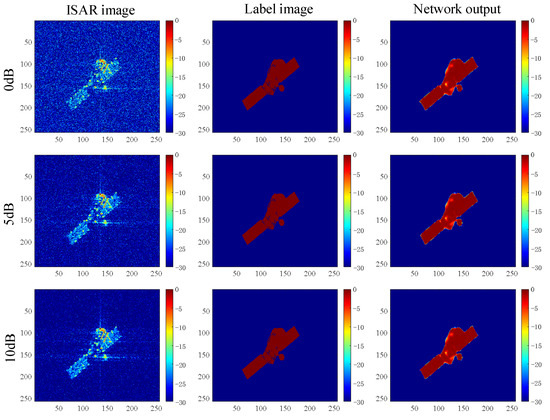
Figure 12.
The imaging results of test data 3 under different SNRs.
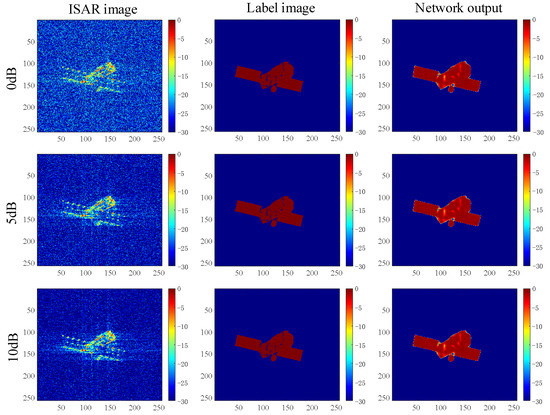
Figure 13.
The imaging results of test data 4 under different SNRs.

Table 8.
The Euler angle estimation results of test data 3.

Table 9.
The Euler angle estimation results of test data 4.
6. Conclusions
This paper presented an effective method for estimating the attitude of a non-cooperative target in space using deep learning based on radar images of GSA scenes. This method generates many GSA scenes through orbital maneuvers. Taking advantage of the fact that the attitude of the target in the GSA scenes can be estimated more accurately by space-based optical telescopes, these attitude estimates are used as a training dataset of ISAR images. Deep learning training is then carried out on the ISAR images of the GSA scenes. An experimental verification under simulation conditions showed that the attitude estimation accuracy of the method for non-cooperative targets could reach a level of within 1°. The high estimation accuracy of this method would allow it to be widely used in fields such as malfunctioning satellite state analysis and space target detection.
Author Contributions
Methodology, C.H., R.Z., K.Y. and X.L.; project administration, Y.Y. (Yang Yang), X.M. and G.G.; software, Y.Y. (Yuan Yang); validation, F.Z. and L.L. All authors have read and agreed to the published version of the manuscript.
Funding
This work is supported by the National Key Research and Development Program of China [Grant number 2016YFB0501301]; the National Key Research and Development Program of China [Grant number 2017YFC1500904]; and the National 973 Program of China [Grant number 613237201506].
Data Availability Statement
There was no data created, and the conditions for data generation have been described in the article.
Acknowledgments
Thanks to author Yi Lu for his great contributions to the idea for and the writing of the article.
Conflicts of Interest
The authors declare that they have no conflict of interest.
References
- Huo, C.Y.; Yin, H.C.; Wei, X.; Xing, X.Y.; Liang, M. Attitude estimation method of space targets by 3D reconstruction of principal axis from ISAR image. Procedia Comput. Sci. 2019, 147, 158–164. [Google Scholar] [CrossRef]
- Du, R.; Liu, L.; Bai, X.; Zhou, Z.; Zhou, F. Instantaneous attitude estimation of spacecraft utilizing joint optical-and-ISAR observation. IEEE Trans. Geosci. Remote Sens. 2022, 60, 5112114. [Google Scholar] [CrossRef]
- Wang, J.; Du, L.; Li, Y.; Lyu, G.; Chen, B. Attitude and size estimation of satellite targets based on ISAR image interpretation. IEEE Trans. Geosci. Remote Sens. 2021, 60, 5109015. [Google Scholar] [CrossRef]
- Zhou, Y.; Zhang, L.; Cao, Y. Attitude estimation for space targets by exploiting the quadratic phase coefficients of inverse synthetic aperture radar imagery. IEEE Trans. Geosci. Remote Sens. 2019, 57, 3858–3872. [Google Scholar] [CrossRef]
- Zhou, Y.; Zhang, L.; Cao, Y. Dynamic estimation of spin spacecraft based on multiple-station ISAR images. IEEE Trans. Geosci. Remote Sens. 2020, 58, 2977–2989. [Google Scholar] [CrossRef]
- Wang, J.; Li, Y.; Song, M.; Xing, M. Joint estimation of absolute attitude and size for satellite targets based on multi-feature fusion of single ISAR image. IEEE Trans. Geosci. Remote Sens. 2022, 60, 5111720. [Google Scholar] [CrossRef]
- Wang, F.; Eibert, T.F.; Jin, Y.Q. Simulation of ISAR imaging for a space target and reconstruction under sparse sampling via compressed sensing. IEEE Trans. Geosci. Remote Sens. 2015, 53, 3432–3441. [Google Scholar] [CrossRef]
- Zhou, Y.; Wei, S.; Zhang, L.; Zhang, W.; Ma, Y. Dynamic estimation of spin satellite from the single-station ISAR image sequence with the hidden Markov model. IEEE Trans. Aerosp. Electron. Syst. 2022, 58, 4626–4638. [Google Scholar] [CrossRef]
- Kou, P.; Liu, Y.; Zhong, W.; Tian, B.; Wu, W.; Zhang, C. Axial attitude estimation of spacecraft in orbit based on ISAR image sequence. IEEE J. Sel. Top. Appl. Earth Obs. Remote Sens. 2021, 14, 7246–7258. [Google Scholar] [CrossRef]
- Wang, Y.; Cao, R.; Huang, X. ISAR imaging of maneuvering target based on the estimation of time varying amplitude with Gaussian window. IEEE Sens. J. 2019, 19, 11180–11191. [Google Scholar] [CrossRef]
- Xue, R.; Bai, X.; Zhou, F. SAISAR-Net: A robust sequential adjustment ISAR image classification network. IEEE Trans. Geosci. Remote Sens. 2021, 60, 5214715. [Google Scholar] [CrossRef]
- Xie, P.; Zhang, L.; Ma, Y.; Zhou, Y.; Wang, X. Attitude estimation and geometry inversion of satellite based on oriented object fetection. IEEE Geosci. Remote Sens. Lett. 2022, 19, 4023505. [Google Scholar] [CrossRef]
- Tang, S.; Yang, X.; Shajudeen, P.; Sears, C.; Taraballi, F.; Weiner, B.; Tasciotti, E.; Dollahon, D.; Park, H.; Righetti, R. A CNN-based method to reconstruct 3-D spine surfaces from US images in vivo. Med. Image Anal. 2021, 74, 102221. [Google Scholar] [CrossRef] [PubMed]
- Kim, H.; Lee, K.; Lee, D.; Baek, N. 3D Reconstruction of Leg Bones from X-Ray Images Using CNN-Based Feature Analysis. In Proceedings of the 2019 International Conference on Information and Communication Technology Convergence (ICTC), Jeju, Republic of Korea, 16–18 October 2019; pp. 669–672. [Google Scholar] [CrossRef]
- Joseph, S.S.; Dennisan, A. Optimised CNN based brain tumour detection and 3D reconstruction. Comput. Methods Biomech. Biomed. Eng. Imaging Vis. 2022, 1–16. [Google Scholar] [CrossRef]
- Ge, Y.; Zhang, Q.; Shen, Y.; Sun, Y.; Huang, C. A 3D reconstruction method based on multi-views of contours segmented with CNN-transformer for long bones. Int. J. Comput. Assist. Radiol. Surg. 2022, 17, 1891–1902. [Google Scholar] [CrossRef] [PubMed]
- Murez, Z.; Van As, T.; Bartolozzi, J.; Sinha, A.; Badrinarayanan, V.; Rabinovich, A. Atlas: End-to-End 3D Scene Reconstruction from Posed Images. In Proceedings of the European Conference on Computer Vision 2020, Glasgow, UK, 23–28 August 2020; pp. 414–431. [Google Scholar] [CrossRef]
- Pistellato, M.; Bergamasco, F.; Torsello, A.; Barbariol, F.; Yoo, J.; Jeong, J.Y.; Benetazzo, A. A physics-driven CNN model for real-time sea waves 3D reconstruction. Remote Sens. 2021, 13, 3780. [Google Scholar] [CrossRef]
- Winarno, E.; Al Amin, I.H.; Hartati, S.; Adi, P.W. Face recognition based on CNN 2D-3D reconstruction using shape and texture vectors combining. Indones. J. Electr. Eng. Inform. 2020, 8, 378–384. [Google Scholar] [CrossRef]
- Tong, Z.; Gao, J.; Zhang, H. Recognition, location, measurement, and 3D reconstruction of concealed cracks using convolutional neural networks. Constr. Build. Mater. 2017, 146, 775–787. [Google Scholar] [CrossRef]
- Radenović, F.; Tolias, G.; Chum, O. Fine-tuning CNN image retrieval with no human annotation. IEEE Trans. Pattern Anal. Mach. Intell. 2019, 41, 1655–1668. [Google Scholar] [CrossRef]
- Afifi, A.J.; Magnusson, J.; Soomro, T.A.; Hellwich, O. Pixel2Point: 3D object reconstruction from a single image using CNN and initial sphere. IEEE Access 2020, 9, 110–121. [Google Scholar] [CrossRef]
- Space Based Space Surveillance SBSS. Available online: http://www.globalsecurity.org/space/systems/sbss.htm (accessed on 26 December 2022).
- Sharma, J. Space-based visible space surveillance performance. J. Guid. Control Dyn. 2000, 23, 153–158. [Google Scholar] [CrossRef]
- Ogawa, N.; Terui, F.; Mimasu, Y.; Yoshikawa, K.; Ono, G.; Yasuda, S.; Matsushima, K.; Masuda, T.; Hihara, H.; Sano, J.; et al. Image-based autonomous navigation of Hayabusa2 using artificial landmarks: The design and brief in-flight results of the first landing on asteroid Ryugu. Astrodynamics 2020, 4, 89–103. [Google Scholar] [CrossRef]
- Anzai, Y.; Yairi, T.; Takeishi, N.; Tsuda, Y.; Ogawa, N. Visual localization for asteroid touchdown operation based on local image features. Astrodynamics 2020, 4, 149–161. [Google Scholar] [CrossRef]
- Kelsey, J.M.; Byrne, J.; Cosgrove, M.; Seereeram, S.; Mehra, R.K. Vision-Based Relative Pose Estimation for Autonomous Rendezvous and Docking. In Proceedings of the 2006 IEEE Aerospace Conference, Big Sky, MT, USA, 4–11 March 2006; p. 20. [Google Scholar] [CrossRef]
- Cinelli, M.; Ortore, E.; Laneve, G.; Circi, C. Geometrical approach for an optimal inter-satellite visibility. Astrodynamics 2021, 5, 237–248. [Google Scholar] [CrossRef]
- Wang, H.; Zhang, W. Infrared characteristics of on-orbit targets based on space-based optical observation. Opt. Commun. 2013, 290, 69–75. [Google Scholar] [CrossRef]
- Zhang, H.; Jiang, Z.; Elgammal, A. Satellite recognition and pose estimation using homeomorphic manifold analysis. IEEE Trans. Aerosp. Electron. Syst. 2015, 51, 785–792. [Google Scholar] [CrossRef]
- Yang, X.; Wu, T.; Wang, N.; Huang, Y.; Song, B.; Gao, X. HCNN-PSI: A hybrid CNN with partial semantic information for space target recognition. Pattern Recognit. 2020, 108, 107531. [Google Scholar] [CrossRef]
- Guthrie, B.; Kim, M.; Urrutxua, H.; Hare, J. Image-based attitude determination of co-orbiting satellites using deep learning technologies. Aerosp. Sci. Technol. 2022, 120, 107232. [Google Scholar] [CrossRef]
- Shi, J.; Zhang, R.; Guo, S.; Yang, Y.; Xu, R.; Niu, W.; Li, J. Space targets adaptive optics images blind restoration by convolutional neural network. Opt. Eng. 2019, 58, 093102. [Google Scholar] [CrossRef]
- De Vittori, A.; Cipollone, R.; Di Lizia, P.; Massari, M. Real-time space object tracklet extraction from telescope survey images with machine learning. Astrodynamics 2022, 6, 205–218. [Google Scholar] [CrossRef]
- Zhou, Z.; Siddiquee, M.M.; Tajbakhsh, N.; Liang, J. Unet++: Redesigning skip connections to exploit multiscale features in image segmentation. IEEE Trans. Med. Imaging 2020, 39, 1856–1867. [Google Scholar] [CrossRef] [PubMed]
- Liu, Z.; Lin, Y.; Cao, Y.; Hu, H.; Wei, Y.; Zhang, Z.; Lin, S.; Guo, B. Swin transformer: Hierarchical vision transformer using shifted Windows. arXiv 2021, arXiv:2103.14030. [Google Scholar]
- Vaswani, A.; Shazeer, N.; Parmar, N.; Uszkoreit, J.; Jones, L.; Gomez, A.N.; Kaiser, Ł.; Polosukhin, I. Attention is All You Need. In Proceedings of the 31st Conference on Neural Information Processing Systems (NIPS 2017), Long Beach, CA, USA, 4–9 December 2017. [Google Scholar]
Disclaimer/Publisher’s Note: The statements, opinions and data contained in all publications are solely those of the individual author(s) and contributor(s) and not of MDPI and/or the editor(s). MDPI and/or the editor(s) disclaim responsibility for any injury to people or property resulting from any ideas, methods, instructions or products referred to in the content. |
© 2023 by the authors. Licensee MDPI, Basel, Switzerland. This article is an open access article distributed under the terms and conditions of the Creative Commons Attribution (CC BY) license (https://creativecommons.org/licenses/by/4.0/).