Abstract
Building constraints hinder building operations from meeting a project’s time, budget, and quality objectives. For a construction project to provide satisfying results, it is essential to recognize and address such constraints early on. Unfortunately, research on the causes of building constraints and their implications for building management has been limited. Therefore, there is a pressing need to study the sources of constraints and how they impact project results. Consequently, this study addresses this gap by examining the hurdles confronting Egypt’s general building construction projects. Building constraints were identified from previous studies, which were then contextually investigated using a survey questionnaire within the Egyptian construction sector. The exploratory factor analysis (EFA) findings indicated that the constraint factors could be divided into six constructs: environment, stakeholders, regulations, policies, management, and traditional beliefs and ownership. Partial least square structural equation modeling was also utilized to create a constraint factor model. The findings demonstrated that environmental restrictions were significant obstacles to the effective execution of a project. The results of this research can assist decision makers in Egypt’s building sector in cutting costs and improving sustainability by easing the effects of limiting variables.
MSC:
17B20
1. Introduction
The construction sector in Egypt receives at least 9% of the country’s labor force and accounts for at least half of the country’s overall investment [1]. More importantly, the Egyptian construction industry greatly contributes to the country’s ability to attract foreign investments and create new jobs. However, the building industry is complex because of its diverse components, such as the parties involved at each stage of a project’s lifecycle, the intricate design details involved, and the wide range of codes, ordinances, and regulations that must be adhered to [2,3,4,5,6]. Furthermore, the fluctuation in the unit prices of construction materials in the past decade in Egypt could significantly affect the optimal design details and, consequently, the construction costs [7]. Construction projects, according to Ogunbayo et al. [8,9], are plagued by a wide variety of difficulties throughout their life cycles, including budget and schedule overruns, scope creep, disagreement, and subpar results.
Javed et al. [10] and Whelton et al. [11] define building limitations as the conditions or causes that restrict the growth of construction activities toward meeting a project’s triple objectives of time, money, and quality, which are the criteria for project success. A project’s constraints can be defined as the points at which the project’s performance deviates from what has been initially planned, according to Bhavsar and Solanki [12]. According to Mishra and Mallik [13], construction sites’ complexity, prolonged performance, uneven financial flows, and complicated contractual arrangements are some factors that result in delays in completing construction projects on schedule and within budget. According to Ogundipe et al. [14] and Whelton et al. [11], stakeholders should have anticipated potential project limitations by learning about project dynamics and the connections between various constraints before work begins. By understanding these limitations, practical procedures could be employed to mitigate their effects via strategic planning and management [15].
Amusan et al. [16] and Fashina et al. [17] argue that completing a construction project is risky and vulnerable to various constraints that might threaten its timely completion. According to Bhavsar and Solanki [12], adequate construction project performance depends on the successful management of such constraints. Tanko et al. [18] report that failing to address these constraints affects a project’s implementation and could cause disagreements and lawsuits between the project’s stakeholders. Irfan et al. [19] observed that all contract parties must be involved when constraints are discussed. If these constraints are not properly managed, they will adversely affect the contractual relationships between the stakeholders. Time and expense overruns, decreased profit and productivity, and harmed contractual relations are all consequences of constraints on the operation of building projects [20]. Because disregarding them might generate conflicts and disagreements, as well as sabotage stakeholders’ relationships, Narh et al. [21] and Ahlemann et al. [22] argue that constraints should be recognized and controlled at the early stages of a project. Accordingly, the scope and quality of a project might be jeopardized throughout the design and implementation phases if constraints are not identified and handled, leading to disagreements among stakeholders and additional costs for the customers and contractors [7,23].
Nevertheless, Blismas et al. [24] state that not enough prior research has addressed the causes of disputes and project constraints in the construction sector. The factors that cause building constraints and their effects on building operations are seldom investigated. Thus, given the speed with which the construction industry is growing and operating, there is a compelling need to investigate the causes of constraints and how they influence the achievement of project objectives.
Although Deep et al. [25] attempted to evaluate the significance of variables that affect the success of highway construction projects, their findings cannot be generalized to other types of construction projects. Given the technical nature of highway construction, it is not easy to draw direct parallels between highway projects and other building projects. In addition, their study was conducted in a different developing country; therefore, the methods used in their construction projects may not be appropriate for the Egyptian context. Thus, this research aims to fill the knowledge gap by analyzing the factors that limit the success of general building construction projects in Egypt. The article components contributing to this research’s aim include a literature survey, methodology, data collection, data analysis, results, discussion of findings, and conclusion.
2. Research Background
Constraints in Construction Due to Various Factors
Successful construction projects achieve their objectives in terms of time, money, product quality, and risk management [26]. Because of their importance to project results, construction projects must devote time and effort to investigating restrictions on risk, resources, and management techniques [24]. The conventional concept of the triple constraints (i.e., cost, quality, and time) in construction project management has been replaced by a paradigm shift that emphasizes identifying major crucial constraint factors [27]. For instance, financial difficulties, natural disasters, inadequate site management, poor planning, low stakeholder experience, and shortage of equipment and materials were identified by Haseeb et al. [28] as the primary causes of building constraints in the execution of construction projects in Pakistan. The impact of stakeholder disagreement on project constraints was also studied by Blismas et al. [24], who narrowed down the causes of these factors to poor quality delivery, lack of communication, safety provisions, changes in design, labor productivity, and environmental protection. Ogunlana et al. [29] have set multiple variables concerning Thailand’s construction sector; they include issues with owners, designers, project managers, contractors, and material suppliers.
Zakeri et al. [30] sought to understand the factors affecting the productivity of Iranian building operatives. Subsequently, they reported that the key factors driving constraints are design deficiency, shortage of material, lack of equipment and tools, weather conditions, and equipment breakdown. Stakeholders’ evaluation of constraints to project completion was the focus of research by Durdyev and Hosseini [31]. Fifty variables were identified as the causes of constraints in construction project delivery, most of which occurred in underdeveloped nations. Lack of coordination between stakeholders, poor communication, ineffective planning, weather conditions, financial issues, material shortages, equipment shortages, payment delays, poor site management, lack of qualified stakeholders, and labor shortages were identified as the most common factors preventing projects from being completed on time. Similar findings were reported by Bhavsar and Solanki [12], whose study found that land acquisition, improper allocation of finances to parties, safety provisions, building legislation, government labor laws, a dispute in the contractual agreement, flawed drawing and details, causes of a lag in fixing design defects, and significantly lower project success rates are associated with incorrect project cost estimates.
Ajayi et al. [32] identified four external environmental variables in Nigeria that cause constraints and impact project performance: land acquisition disputes, weather conditions, government policies, and economic circumstances. In addition, Akanni et al. [33] classified these elements into the following categories: legal, political, building resources and techniques, financial, physical, and social. Cash flow issues, clients’ economic challenges, and substandard procurement were all highlighted by Ogunde et al. [34]. Ugulu et al. [35] suggested that factors such as an insufficient incentive system, a labor’s health issues, delays in materials, and a lack of necessary site facilities could significantly harm a project’s productivity. Bitamba and An [36] identified production contract and scheduling, client and management, lack of experienced designers and stakeholders, and owner’s payment delay as the causes of constraints in the Congolese construction sector. A similar list was compiled by Muhwezi et al. [37], which included delays by the consultant in evaluating the modifications of the work’s scope, financial embezzlement by the contractor, lack of competence on the part of the contractor, faulty design, and improper site investigation.
According to Akinyede [38], construction constraints in South Africa can be traced back to disagreements over contracts, unrecorded alterations to design, lack of funds, imbalance in the cost of materials, expensive equipment, failure to effectively communicate between the designers and contractors, volatile economy, and fluctuating currency exchange rate. Akinyede [38] and Khabisi et al. [39] aimed to investigate what factors lead to budget overruns and how those overruns may be controlled. Both studies relied on descriptive statistical methods to analyze data from the points of view of consultants and contractors. These studies examined the causes of constraints in construction projects from the perspective of the conventional notion of the “triple constraints” in such projects, as comprehended by construction industry experts. However, the present study’s contributions are distinct from those of the aforementioned studies because the gathered data are analyzed using descriptive statistics, exploratory factor analysis (EFA), and structural equation modeling. Using the data from the literature, Table 1 illustrates the elements causing limits on construction projects that guide our investigation. These factors reflect the positions espoused by many researchers about constraints in building projects.

Table 1.
The causes of building delays.
3. Research Methodology
This research set out to determine which variables were limiting the success of construction projects in the Egyptian building industry. To this end, a critical literature survey and distinct data collection and organization phases were employed. The authors compiled and analyzed a wide range of resources, including government reports, academic papers, and green building standards, as their data. After analyzing the data, the previous studies were classified and refined. Reducing the volume of the collected data was an integral part of the data review process. This was accomplished by sorting and classifying the data into appropriate classes.
This procedure, which included data collection, refinement, and categorization, aided the authors in analyzing the raw data and formulating the hypotheses through continuous assessment. The PLS-SEM was then constructed after conducting a thorough study to create hypotheses that were then tested using empirical data [41,42]. Three key steps were utilized to develop the conceptual model for this study: (1) identifying model constructs, (2) classifying model constructs, and (3) exploring the link between constructs [43]. Figure 1 depicts the research methodology procedure. The procedure began with categorizing the factors using EFA after reviewing the available research on the topic and ended with exploring the correlations between these factors using structural equation modeling (SEM).
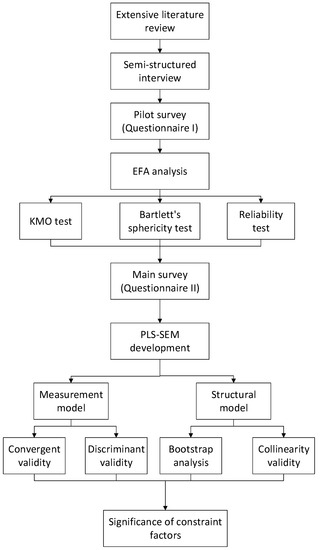
Figure 1.
Research methodology.
PLS-SEM has received much interest in many different domains, but it has excelled especially in business research and in the social sciences [44]. Numerous studies that examined the PLS-SEM method have been published in recent high-impact SSCI journals [45,46,47]. To model the importance of the constraints impacting project performance in the Egyptian building sector using SEM, we analyzed the data using the latest software version, SMART-PLS 3.2.7. While the differences between PLS-SEM and CB-SEM are slight, it is widely acknowledged that PLS-SEM performs better for predicting purposes [48,49]. Measurement and structural model analysis constitute the basis of the statistical analysis undertaken in a study. The measurement model exposes the items’ present connection to their latent structure [50]. The following subsections briefly discuss the measurement model’s validity and the structural model analysis.
3.1. Convergent Validity
The degree of agreement between two or more measures (CSFs) of the same set or items is known as convergent validity [51]. The following tests might be used to assess the convergent validity of the PLS-derived constructs: Cronbach’s alpha , the average variance extracted (AVE), and the composite reliability score [52]. The threshold of moderate dependability of the composite is suggested by Nunnally and Bernstein [53], who choose a value of 0.70 as their recommendation. However, values over 0.70 are considered suitable for any study [54]. The convergent validity of a model’s constructs may be assessed using AVE; values above 0.50 are considered to be adequate [54].
3.2. Discriminant Validity
Discriminant validity implies that the phenomena under investigation are not detected by any measures in SEM [55], ensuring that the concept being reviewed is empirically distinct or unique. Campbell and Fiske [56] argue that there must not be high differences across measurements to acquire discriminant validity.
3.3. Structural Model Analysis
The present research used SEM to model the importance of the constraint variables that influence project performance. It is necessary to determine the path coefficients between the observed coefficients to achieve this goal. Thus, a one-way causal relationship (i.e., path relation) is presumed between £ (constraint factors affecting project performance constructs) and µ (constraint factors affecting project performance). For this case, the structural model, known as the inner relation, is expressed using the structural relationship between £, µ, and € as follows [57]:
where β represents the route coefficient between various constraint factors and project performance variables. It is projected that €1 will continue to hold the structural residual variance at this tier. In this context, β stands for the weight in a multiple regression model, which is the same as the weight. It is expected to have a statistically significant sign that corresponds to the model’s predictions. Following the advice of Henseler et al. [44] and using the bootstrapping technique included in SmartPLS 3.2.7, we calculated the standard errors of the route coefficients using 5000 subsamples and used them to determine the t-statistics for hypothesis testing. The PLS model’s inner relations were then represented by six structural equations for the constraint variables affecting the project performance components.
µ = β£ + €1
3.4. Data Collection
To investigate the constraint factors affecting project performance, a wide group of residential building industry players in Egypt was consulted for survey items. The participants included quantity surveyors, civil engineers, project managers, contract engineers, site agents, and architects. The survey consisted of two primary parts: the respondent’s background and the constraint factors affecting project performance. Clients, consultants, and contractors were all contacted.
Because the concept of constraint factors is still relatively new in Egypt, stratified sampling of a particular subgroup was explored. The respondents evaluated each factor based on their experience and knowledge, according to a 5-point scale used in prior investigations, with 1 being nil or very little, 2 being little, 3 being moderate, 4 being high, and 5 being extremely high. The sample size employed in the present study was determined based on the methodological purpose analysis [58]. According to Yin [59], a small sample size is acceptable for executing PLS-SEM. Here, the response rate was around 70%, with 100 people responding out of 150. Given the study’s nature, this return rate was considered appropriate [60,61].
4. Data Analysis and Results
4.1. EFA for Constraint Factors Affecting Project Performance
EFA was utilized using SPSS software to analyze the factors’ structure concerning the 29 constraint factors. A number of connections’ distinguishing characteristics in terms of factorability were used. Whether or not the partial correlations between the variables are small can be determined using the factor homogeneity metric KMO [62]. The KMO index can take on values between 0 and 1, with 0.6 being the threshold below which the factor analysis can be successful [63]. Specifically, we employed the Bartlett sphericity test to determine if the correlation matrix was an identity matrix. According to Pallant [64], if the sphericity analysis by Bartlett (p < 0.05) is significant, then the factor analysis is valid [65]. The sphericity test performed by using Bartlett’s test (x2 (406) = 1813.480, p < 0.05) and the Kaiser–Meyer–Olkin (KMO) (Table 2) sample adequacy measure (0.857) were both above the minimum acceptable value of 0.6.
Table 2.
Kaiser–Meyer–Olkin (KMO) measure and Bartlett’s test.
When examining the anti-image correlation matrix, it was found that all the diagonals were higher than 0.5, suggesting that all elements could be included in the factor analysis. The variances in all factors were evaluated, and extremely low values (i.e., less than 0.3) indicated the variables that did not fit the factor solution. Table 3 presents the communalities of all the considered factors. Here, all the founding communalities exceed the criterion.
Table 3.
Communalities of 29 constraint factors.
The EFA findings for all the 29 constraint factors yielded six factors with eigenvalues greater than one (Table 4). The six components’ total variance and eigenvalues were both 67.064%. However, Table 4 shows that two factors F29 and F22 have been deleted based on cross loading. When evaluating the components (i.e., factors) that are recovered and established, Pallant [64] argued that an objective assessment of the scree plot and matrix is essential. Figure 2 illustrates the scree plot for the considered components. When analyzing the scree plot, a significant shift in the plot form is observed, and only the sections above that point are sought.
Table 4.
Factor loadings based principal component analysis with varimax rotation of constraint factors.
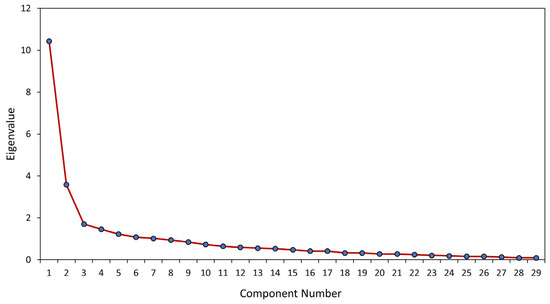
Figure 2.
Scree plot for sustainability components.
Statistics were established for the EFA-derived factors. We selected the variables for each factor stage using the variable having the highest loading in the structural matrix. Cronbach’s alpha for newly developed measures should be at least 0.6, as suggested by Nunnally [66]. Values higher than 0.75 are regarded to be of high accuracy. Consequently, since the Cronbach’s alpha values are more than 0.75, they are adequate (0.90). The average set correlations are more than 0.75, indicative of stable internal variables across the board for all objects [67].
4.2. PLS-SEM Model Development
Evaluating the reflective measurement models (i.e., constraint factors) in PLS-SEM entails checking for convergent validity, discriminant validity, and internal reliability. Once the measurement model’s reliability and validity are confirmed, the structural model can be analyzed [68]. Table 5 depicts the convergent validity results, indicating that all constructs in the model satisfy the and > 0.70 criteria [69].
Table 5.
Convergent validity results.
The AVE must be greater than 0.5 in order to pass [52]. Each construct has been shown to have passed the AVE test as shown in Table 5. Results like this demonstrate that the measurement model is consistent and convergent within itself. As a result, the study model can be relied upon to assess each component separately and properly, without confounding the results. When there are a lot of external loads on a construct, it means that the items that matter for that construct are all very closely related. Consistently removing items off a scale that have extremely low outer loadings (i.e., less than 0.4) is recommended [49]. The outer loadings for both the original and revised measurement models are displayed in Table 5. This allows for the eventual acceptance of any and all environmental stresses.
4.2.1. Discriminant Validity
When a concept can be differentiated from other conceptions according to the criteria employed to create the distinction, we say that it has discriminant validity. Thus, the concept is new and incorporates events that are poorly described by other constructs in the model, as evidenced by its discriminant validity [70]. Several methods can assess discriminant validity, including those listed in Table 6 and Table 7 (Fornell and Larcker [52] criteria and Heterotrait-Monotrait ratio of correlations, respectively).
Table 6.
Fornell and Larcker analysis.
Table 7.
HTMT analysis.
Discriminant validity may be evaluated by looking at the square root of the AVE for a particular construct and comparing it to the correlations between that construct and all other constructs. According to Fornell and Larcker [52] guidelines, the square root of the AVE must be larger than the correlation between the latent variables. The results in Table 6 and Table 7 show that the measurement model’s discriminant validity is supported by the data [71].
4.2.2. Path Model Validation
The collinearity among the formative objects of the construct was investigated using the variable inflation factor calculation once it was proven that the factors affecting project performance constituted a formative construct (VIF). Since no VIF is larger than 3.5, the higher-order structures receive a special favor from each subdomain. The route coefficients’ statistical significance was then predicted using a bootstrapping technique. Figure 3, Figure 4, and Table 8 demonstrate that all pathways are significantly higher than zero [51].
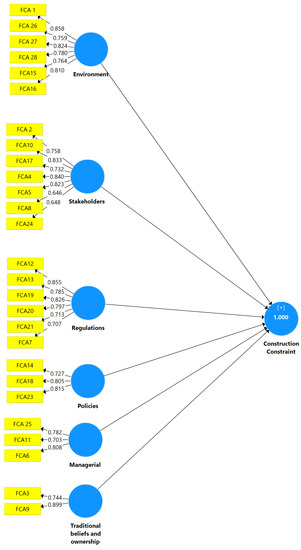
Figure 3.
Outer loading analysis.
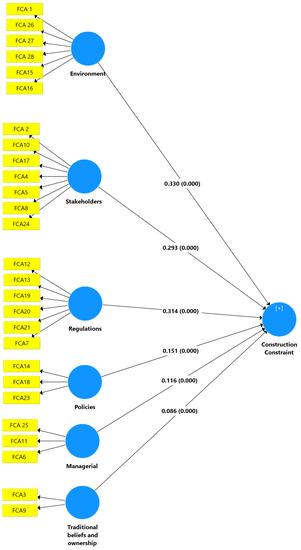
Figure 4.
The PLS-SEM structural model. (The values of β and outer loading are shown on arrows).
Table 8.
Path analysis.
5. Discussion
After analyzing the six primary constructs and their components, it can been observed that they have direct positive and significant relationships with construction constraint.
First, the environment-related factors significantly influence construction constraint, with an external coefficient of 0.330. This first primary component includes the following factors: (1) climate change resilience; (2) plan for disassembly and disposal; (3) problems with garbage, sewage, dust, vibration, and sound; (4) air, water, or ground pollution; (5) implementation of eco-friendly resources; and (6) environmental and transport sustainability. These findings coincide with refs. [19,28,31], stating that environmental factors, such as environmental preservation, climate change resilience, and weak transportation infrastructure, contribute to construction restrictions and poor project performance in the construction sector.
Second, the regulation-related factors are considered the second major factors, with an external coefficient of 0.314. This second primary component includes the following factors: (1) strikes among the construction workforce; (2) building regulations; (3) safety regulations; (4) land acquisition; (5) access to a readily available community of workers; and (6) labor legislation (of the current government). These findings coincide with those of refs. [12,26,32], stating that lack of adherence to safety rules of government, contractual dispute-related difficulties, and land acquisition are causes producing construction bottlenecks in the construction sector, affecting project performance.
Third, the stakeholder-related factors are considered the third major factors, with an external coefficient of 0.293. This third primary component includes the following factors: (1) poorly predicted project costs; (2) problems with the absence of on-site monitoring; (3) material supply disruption; (4) poor communication; (5) lack of necessary tools; (6) lack of forethought and organization; and (7) design issues that take too long to solve. These findings coincide with those of refs. [17,28,30], stating that incorrect project cost prediction and delays in resolving design modifications impose restraints on stakeholders in construction project management.
Fourth, the policy-related factors are considered the fourth major factors, with an external coefficient of 0.151. This fourth primary component includes the following factors: (1) alterations to the blueprints/design; (2) challenges in gaining work authorization; and (3) the use of inexperienced workers. These findings coincide with those of refs. [18,24,28], stating that modifications in drawings/design, delays in permit issuance, and lack of experienced workers lead to construction constraints that negatively impact project performance in the construction industry.
Fifth, the management-related factors are considered the fifth major factors, with an external coefficient of 0.116. This fifth primary component includes the following factors: (1) weak inter-stakeholder coordination; (2) neglecting to finish the job properly; and (3) financial institutions being reluctant to lend. These findings coincide with those of refs. [24,28], stating that these managerial factors lead to construction constraints affecting project performance within the construction sector.
Sixth, traditional beliefs and ownership-related factors are considered the sixth significant factors, with an external coefficient of 0.086. This sixth primary component includes (1) traditional beliefs of people and (2) money issues associated with ownership. These findings coincide with those of refs. [8,34], stating that client financial concerns and traditional beliefs are all significant causes of construction constraints influencing project performance in the construction sector.
6. Conclusions
The term “building constraints” refers to any hurdles preventing construction operations from fulfilling a project’s schedule, money, or quality goals. It is vital to recognize and resolve such constraints at an early stage of a building project in order for the project to give satisfactory outcomes. Regrettably, there have not been many studies on the factors that generate building constraints and the consequences those factors have on building management. Consequently, there is an urgent need for research to understand the factors that cause constraints and the effect those factors have on the outcomes of projects. As a result, this study aimed to solve this gap by investigating the challenges that Egypt’s general building construction projects faced. Building constraints were identified from previous studies, which were subsequently studied contextually via a survey questionnaire within the Egyptian construction industry. The results of an exploratory factor analysis (EFA) indicated that the factors that acted as a constraint could be broken down into six different constructs. These constructs included the following: the environment, stakeholders, regulations, policies, management, as well as traditional beliefs and ownership. Partial least square structural equation modeling (PLS-SEM) was another technique used in developing the constraint factor model by collecting data from 100 Egyptian industry experts. According to the results, environmental regulations were a substantial barrier to the efficient completion of a project. The research results can serve as a guide for decision makers in the Egyptian construction sector looking to lower costs and enhance sustainability by eliminating constraint issues.
Author Contributions
Conceptualization, M.R. and A.F.K.; methodology, A.F.K.; software, A.F.K.; validation, A.F.K.; formal analysis, A.F.K.; investigation, M.R. and A.F.K.; resources, M.R. and M.M.H.; data curation, M.R. and M.M.H.; writing—original draft preparation, M.R., A.F.K., M.M.H. and A.O.D.; writing—review and editing, M.R., A.F.K., M.M.H. and A.O.D.; visualization, M.R. and A.F.K.; supervision, A.F.K. and A.O.D.; project administration, A.F.K. and A.O.D.; funding acquisition, M.R., A.F.K., M.M.H. and A.O.D. All authors have read and agreed to the published version of the manuscript.
Funding
This study is supported via funding from Prince Sattam bin Abdulaziz University project number (PSAU/2023/R/1444).
Institutional Review Board Statement
Not applicable.
Informed Consent Statement
Not applicable.
Data Availability Statement
All data generated or used in this study are available from the corresponding author upon request.
Acknowledgments
This study is supported via funding from Prince Sattam bin Abdulaziz University project number (PSAU/2023/R/1444).
Conflicts of Interest
The authors declare no conflict of interest.
References
- Sakr, D.A.; Sherif, A.; El-Haggar, S.M. Environmental management systems’ awareness: An investigation of top 50 contractors in Egypt. J. Clean. Prod. 2010, 18, 210–218. [Google Scholar] [CrossRef]
- Olander, S. Stakeholder impact analysis in construction project management. Constr. Manag. Econ. 2007, 25, 277–287. [Google Scholar] [CrossRef]
- Isa, R.B.; Jimoh, R.; Achuenu, E. An overview of the contribution of construction sector to sustainable development in Nigeria. J. Business Manag. 2013, 1, 1–6. [Google Scholar]
- Mwangi, M. Factors Influencing Performance of Contractors in the Road Construction Sector: Case of Selected Contractors in Kenya. Doctoral Dissertation, University of Nairobi, Nairobi, Kenya, 2016. [Google Scholar]
- Aidy, A.; Rady, M.; Mashhour, I.M.; Mahfouz, S.Y. Structural Design Optimization of Flat Slab Hospital Buildings Using Genetic Algorithms. Buildings 2022, 12, 2195. [Google Scholar] [CrossRef]
- Rady, M.; Mahfouz, S.Y. Effects of Concrete Grades and Column Spacings on the Optimal Design of Reinforced Concrete Buildings. Materials 2022, 15, 4290. [Google Scholar] [CrossRef] [PubMed]
- Rady, M.; Mahfouz, S.Y.; Taher, S.E.-D.F. Optimal Design of Reinforced Concrete Materials in Construction. Materials 2022, 15, 2625. [Google Scholar] [CrossRef]
- Ogunbayo, B.F.; Aigbavboa, C.O.; Thwala, W.; Akinradewo, O.; Ikuabe, M.; Adekunle, S.A. Review of Culture in Maintenance Management of Public Buildings in Developing Countries. Buildings 2022, 12, 677. [Google Scholar] [CrossRef]
- Ogunbayo, B.F.; Ohis Aigbavboa, C.; Thwala, W.D.; Akinradewo, O.I. Assessing maintenance budget elements for building maintenance management in Nigerian built environment: A Delphi study. Built Environ. Proj. Asset Manag. 2022, 12, 649–666. [Google Scholar] [CrossRef]
- Javed, A.A.; Pan, W.; Chen, L.; Zhan, W. A systemic exploration of drivers for and constraints on construction productivity enhancement. Built Environ. Proj. Asset Manag. 2018, 8, 239–252. [Google Scholar] [CrossRef]
- Whelton, M.; Pennanen, A.; Ballard, G. Knowledge emergence and adaptive management: An exploration on the co-production of project needs and requirements by client-specialist groups. In Knowledge Management in the Construction Industry: A Socio-Technical Perspective; IGI Global: Hershey, PA, USA, 2005; pp. 251–275. [Google Scholar]
- Bhavsar, U.M.; Solanki, J.V. Identification Of Constraints In Construction Projects. Int. Research. J. Eng. Technol. 2020, 7, 6302–6307. [Google Scholar]
- Mishra, A.K.; Mallik, K. Factors and impact of risk management practice on success of construction projects of housing developers, Kathmandu, Nepal. Int. J. Sci. Basic Appl. Res. (IJSBAR) 2017, 36, 206–232. [Google Scholar]
- Ogundipe, K.E.; Olaniran, H.F.; Ajao, A.M.; Ogunbayo, B.F. Assessing the Impact of Quality Supervision on Construction Operatives ‘Project Delivery in Nigeria. Int. J. Civ. Eng. Technol. 2018, 9, 426–439. [Google Scholar]
- Tam, C.M.; Tong, T.K.L.; Chiu, G.W.C. Comparing non-structural fuzzy decision support system and analytical hierarchy process in decision-making for construction problems. Eur. J. Oper. Res. 2006, 174, 1317–1324. [Google Scholar] [CrossRef]
- Amusan, L.M.; Aigbavboa, C.O.; Olubiyi, T.E.; Babatunde, O.F. Informatics Approach to Innovative Site Management Practices for Improving Construction Works. Int. Rev. Civ. Eng. (IRECE) 2021, 12, 108. [Google Scholar] [CrossRef]
- Fashina, A.A.; Omar, M.A.; Sheikh, A.A.; Fakunle, F.F. Exploring the significant factors that influence delays in construction projects in Hargeisa. Heliyon 2021, 7, e06826. [Google Scholar] [CrossRef] [PubMed]
- Tanko, B.L.; Abdullah, F.; Ramly, Z.M. Stakeholders Assessment of Constraints to Project Delivery in the Nigerian Construction Industry. Int. J. Built Environ. Sustain. 2017, 4, 160. [Google Scholar] [CrossRef]
- Irfan, M.; Thaheem, M.J.; Gabriel, H.F.; Malik, M.S.A.; Nasir, A.R. Effect of stakeholder’s conflicts on project constraints: A tale of the construction industry. Int. J. Confl. Manag. 2019, 30, 538–565. [Google Scholar] [CrossRef]
- Khahro, S.H.; Memon, N.A.; Ali, T.H.; Memon, Z.A. Improving material waste management performance: An attribute study for provential projects. Int. J. Civ. Eng. Technol. 2016, 7, 498–506. [Google Scholar]
- Narh, O.C.; Owusu, E.E.; Oduro-Apeatu, K.; Narh, T.-W.J. An exploratory study of professional conflicts and disputes within the construction industry. Int. J. Manag. Stud. Res. 2015, 3, 44–65. [Google Scholar]
- Ahlemann, F.; El Arbi, F.; Kaiser, M.G.; Heck, A. A process framework for theoretically grounded prescriptive research in the project management field. Int. J. Proj. Manag. 2013, 31, 43–56. [Google Scholar] [CrossRef]
- Siegelaub, J.M. Six (Yes Six!) Constraints: An Enhanced Model for Project Control. In Proceedings of the PMI® Global Congress 2007—North America, Atlanta, GA, USA, 6–9 October 2007. [Google Scholar]
- Blismas, N.G.; Pendlebury, M.; Gibb, A.; Pasquire, C. Constraints to the Use of Off-site Production on Construction Projects. Archit. Eng. Des. Manag. 2005, 1, 153–162. [Google Scholar] [CrossRef]
- Deep, S.; Banerjee, S.; Dixit, S.; Vatin, N.I. Critical Factors Influencing the Performance of Highway Projects: An Empirical Evaluation. Buildings 2022, 12, 849. [Google Scholar] [CrossRef]
- Edum-Fotwe, F.T.; McCaffer, R. Developing project management competency: Perspectives from the construction industry. Int. J. Proj. Manag. 2000, 18, 111–124. [Google Scholar] [CrossRef]
- Institute, P.M. A Guide to the Project Management Body of Knowledge: PMBOK (R) Guide; Project Management Institute: Newtown Square, PA, USA, 2013. [Google Scholar]
- Haseeb, M.; Bibi, A.; Rabbani, W. Problems of projects and effects of delays in the construction industry of Pakistan. Aust. J. Bus. Manag. Res. 2011, 1, 41–50. [Google Scholar] [CrossRef]
- Ogunlana, S.O.; Promkuntong, K.; Jearkjirm, V. Construction delays in a fast-growing economy: Comparing Thailand with other economies. Int. J. Proj. Manag. 1996, 14, 37–45. [Google Scholar] [CrossRef]
- Zakeri, M.; Olomolaiye, P.O.; Holt, G.D.; Harris, F.C. A survey of constraints on Iranian construction operatives’ productivity. Constr. Manag. Econ. 1996, 14, 417–426. [Google Scholar] [CrossRef]
- Durdyev, S.; Hosseini, M.R. Causes of delays on construction projects: A comprehensive list. Int. J. Manag. Proj. Bus. 2020, 13, 20–46. [Google Scholar] [CrossRef]
- Ajayi, O.M.; Ogunsanmi, O.E.; Ajayi, K.A.; Ofili, C.M. The Construction, Building and Real Estate Research Conference of the Royal Institution of Chartered Surveyors (COBRA 2010). In Proceedings of the Royal Institution of Chartered Surveyors (RICS), Salford, UK, 2–3 September 2010. [Google Scholar]
- Akanni, P.O.; Oke, A.E.; Akpomiemie, O.A. Impact of environmental factors on building project performance in Delta State, Nigeria. HBRC J. 2015, 11, 91–97. [Google Scholar] [CrossRef]
- Ogunde, A.O.; Dafe, O.E.; Akinola, G.A.; Ogundipe, K.E.; Oloke, O.C.; Ademola, S.A.; Akuete, E.; Olaniran, H.F. Factors Militating Against Prompt Delivery of Construction Projects in Lagos Megacity, Nigeria: Contractors’ Perspective. Mediterr. J. Soc. Sci. 2017, 8, 233. [Google Scholar] [CrossRef]
- Ugulu, R.A.; Arewa, A.; Allen, S. Project-specific constraints influencing productivity of tradespeople in the Nigerian construction industry. Built Environ. Proj. Asset Manag. 2020, 10, 94–109. [Google Scholar] [CrossRef]
- Bitamba, B.F.; An, S.H. 12 study on factors affecting the performance of construction projects in the democratic republic of the congo. S. Afr. J. Ind. Eng. 2020, 31. [Google Scholar] [CrossRef]
- Muhwezi, L.; Acai, J.; Otim, G. An assessment of the factors causing delays on building construction projects in Uganda. Int. J. Constr. Eng. Manag. 2014, 3, 13–23. [Google Scholar]
- Akinyede, I.J. Framework for Effective Management of Cost Constraint on Building Project Delivery in South Africa. Doctoral Dissertation, Cape Peninsula University of Technology, Cape Town, South Africa, 2014. [Google Scholar]
- Khabisi, J.; Aigbavboa, C.; Thwala, W. Causes of cost overruns in public sector construction projects in South Africa. In ICCREM 2016: BIM Application and Off-Site Construction; American Society of Civil Engineers: Reston, VA, USA, 2017; pp. 1311–1317. [Google Scholar]
- Durdyev, S.; Omarov, M.; Ismail, S. Causes of delay in residential construction projects in Cambodia. Cogent Eng. 2017, 4, 1291117. [Google Scholar] [CrossRef]
- Shields, P.M.; Tajalli, H. Intermediate theory: The missing link in successful student scholarship. J. Public Aff. Educ. 2006, 12, 313–334. [Google Scholar] [CrossRef]
- Chileshe, N.; Rameezdeen, R.; Hosseini, M.R.; Martek, I.; Li, H.X.; Panjehbashi-Aghdam, P. Factors driving the implementation of reverse logistics: A quantified model for the construction industry. Waste Manag. 2018, 79, 48–57. [Google Scholar] [CrossRef]
- Christensen, C.M. The ongoing process of building a theory of disruption. J. Prod. Innov. Manag. 2006, 23, 39–55. [Google Scholar] [CrossRef]
- Henseler, J.; Hubona, G.; Ray, P.A. Using PLS path modeling in new technology research: Updated guidelines. Ind. Manag. Data Syst. 2016, 116, 2–20. [Google Scholar] [CrossRef]
- Banihashemi, S.; Hosseini, M.R.; Golizadeh, H.; Sankaran, S. Critical success factors (CSFs) for integration of sustainability into construction project management practices in developing countries. Int. J. Proj. Manag. 2017, 35, 1103–1119. [Google Scholar] [CrossRef]
- Lee, C.; Hallak, R. Investigating the moderating role of education on a structural model of restaurant performance using multi-group PLS-SEM analysis. J. Bus. Res. 2018, 88, 298–305. [Google Scholar] [CrossRef]
- Hult, G.T.M.; Hair, J.F., Jr.; Proksch, D.; Sarstedt, M.; Pinkwart, A.; Ringle, C.M. Addressing endogeneity in international marketing applications of partial least squares structural equation modeling. J. Int. Mark. 2018, 26, 1–21. [Google Scholar] [CrossRef]
- Hair Jr, J.F.; Matthews, L.M.; Matthews, R.L.; Sarstedt, M. PLS-SEM or CB-SEM: Updated guidelines on which method to use. Int. J. Multivar. Data Anal. 2017, 1, 107–123. [Google Scholar] [CrossRef]
- Hair, J.F.; Ringle, C.M.; Sarstedt, M. PLS-SEM: Indeed a silver bullet. J. Mark. Theory Pract. 2011, 19, 139–152. [Google Scholar] [CrossRef]
- Al-Ashmori, Y.Y.; Othman, I.; Rahmawati, Y.; Amran, Y.M.; Sabah, S.A.; Rafindadi, A.D.U.; Mikić, M. BIM benefits and its influence on the BIM implementation in Malaysia. Ain Shams Eng. J. 2020, 11, 1013–1019. [Google Scholar] [CrossRef]
- Hulland, J. Use of partial least squares (PLS) in strategic management research: A review of four recent studies. Strateg. Manag. J. 1999, 20, 195–204. [Google Scholar] [CrossRef]
- Fornell, C.; Larcker, D.F. Evaluating structural equation models with unobservable variables and measurement error. J. Mark. Res. 1981, 18, 39–50. [Google Scholar] [CrossRef]
- Nunnally, J.C.; Bernstein, I. Psychometric Theory. In The Role of University in the Development of Entrepreneurial Vocations: A Spanish Study; McGraw-Hill: New York, NY, USA, 1978. [Google Scholar]
- Wong, K.K.-K. Partial least squares structural equation modeling (PLS-SEM) techniques using SmartPLS. Mark. Bull. 2013, 24, 1–32. [Google Scholar]
- Hair, J.F.; Anderson, R.E.; Babin, B.J.; Black, W.C. Multivariate Data Analysis: A Global Perspective; Pearson: Upper Saddle River, NJ, USA, 2010; Volume 7. [Google Scholar]
- Campbell, D.T.; Fiske, D.W. Convergent and discriminant validation by the multitrait-multimethod matrix. Psychol. Bull. 1959, 56, 81. [Google Scholar] [CrossRef]
- Alkilani, S.G.R.Z. Performance Measurement and Improvement Model for Small and Medium Contractors in Developing Countries. Ph.D. Thesis, School of Construction Management and Property, The University of New South Wales, Sydney, Australia, 2018. [Google Scholar]
- Badewi, A. Investigating Benefits Realisation Process for Enterprise Resource Planning Systems. Unpublished. Ph.D. Thesis, School of Aerospace, Transport and Manufacturing, Cranfield University, Bedford, UK, 2016. [Google Scholar]
- Yin, R.K. Case Study Research: Design and Methods, 4th ed.; Applied Social Research Methods Series; SAGE Publications: Thousand Oaks, CA, USA, 2009; Volume 5. [Google Scholar]
- Kothari, C. Research Methodology Methods and Techniques, 2nd ed.; New Age International Publishers: Delhi, India, 2009. [Google Scholar]
- Wahyuni, D. The research design maze: Understanding paradigms, cases, methods and methodologies. J. Appl. Manag. Account. Res. 2012, 10, 69–80. [Google Scholar]
- Sharma, S. Applied Multivariate Techniques; John Wiley and Sons: Hoboken, NJ, USA, 1996. [Google Scholar]
- Tabachnick, B.G.; Fidell, L.S.; Ullman, J.B. Using Multivariate Statistics; Pearson: Boston, MA, USA, 2007; Volume 5. [Google Scholar]
- Pallant, J. SPSS Survival Manual, 3rd ed.; McGrath Hill: New York, NY, USA, 2007; p. 15. [Google Scholar]
- Tavakol, M.; Dennick, R. Making sense of Cronbach’s alpha. Int. J. Med. Educ. 2011, 2, 53. [Google Scholar] [CrossRef]
- Nunnally, J.C. Psychometric Theory 3E; Tata McGraw-Hill Education: New York, NY, USA, 1994. [Google Scholar]
- Field, A. Discovering Statistics Using SPSS (3. Baskı); Sage Publications: Thousand Oaks, CA, USA, 2009. [Google Scholar]
- Hair, J.F.; Black, W.C.; Babin, B.J.; Anderson, R.E.; Tatham, R.L. Multivariate Data Analysis; Pearson Prentice Hall: Upper Saddle River, NJ, USA, 2006; Volume 6. [Google Scholar]
- Hair, J.F., Jr.; Hult, G.T.M.; Ringle, C.; Sarstedt, M. A Primer on Partial Least Squares Structural Equation Modeling (PLS-SEM); Sage Publications: Thousand Oaks, CA, USA, 2016. [Google Scholar]
- Hair, J.F.; Ringle, C.M.; Sarstedt, M. Partial least squares structural equation modeling: Rigorous applications, better results and higher acceptance. Long Range Plan. 2013, 46, 1–12. [Google Scholar] [CrossRef]
- Chin, W.W.; Newsted, P.R. Structural equation modeling analysis with small samples using partial least squares. Stat. Strateg. Small Sample Res. 1999, 1, 307–341. [Google Scholar]
Disclaimer/Publisher’s Note: The statements, opinions and data contained in all publications are solely those of the individual author(s) and contributor(s) and not of MDPI and/or the editor(s). MDPI and/or the editor(s) disclaim responsibility for any injury to people or property resulting from any ideas, methods, instructions or products referred to in the content. |
© 2023 by the authors. Licensee MDPI, Basel, Switzerland. This article is an open access article distributed under the terms and conditions of the Creative Commons Attribution (CC BY) license (https://creativecommons.org/licenses/by/4.0/).