Abstract
Streaming data sequences arise from various areas in the era of big data, and it is challenging to explore efficient online models that adapt to them. To address the potential heterogeneity, we introduce a new online estimation procedure to analyze the constantly incoming streaming datasets. The underlying model structures are assumed to be the generalized linear models with dynamic regression coefficients. Our key idea lies in introducing a vector of unknown parameters to measure the differences between batch-specific regression coefficients from adjacent data blocks. This is followed by the usage of the adaptive lasso penalization methodology to accurately select nonzero components, which indicates the existence of dynamic coefficients. We provide detailed derivations to demonstrate how our proposed method not only fits within the online updating framework in which the old estimator is recursively replaced with a new one based solely on the current individual-level samples and historical summary statistics but also adaptively avoids undesirable estimation biases coming from the potential changes in model parameters of interest. Computational issues are also discussed in detail to facilitate implementation. Its practical performance is demonstrated through both extensive simulations and a real case study. In summary, we contribute to a novel online method that efficiently adapts to streaming data environment, addresses potential heterogeneity, and mitigates estimation biases from changes in coefficients.
Keywords:
adaptive lasso; data streams; dynamic coefficients; online estimation; regression analysis MSC:
62-08
1. Introduction
As the digital age progresses, big data has become the new currency, generating a tremendous amount of information, more than ever before. In the area of regression analysis, new challenges arise when a sequence of data batches arrives constantly, or in other words, comes in an online manner, and this is a type of data that has become a core component in big data fields [1]. Specifically, if the streaming characteristic is ignored, researchers typically need to load entire historical individual-level observations at each stage of statistical analysis. However, in the environment of streaming data blocks, practitioners face the challenge of avoiding the need for storing the previous data and updating the model estimation with only the current individual-level data and historical summary statistics. The online methodologies designed for this purpose are formally referred to as approaches that can meet this demand. A detailed comparison of key mechanisms for batch processing and streaming processing can be found in Figure 1. We clarify that in the context of this paper, the term “summary statistics” is used to refer to the estimated parameters up to the previous batches. This usage is consistent with the existing literature on online stream data analysis, such as Luo and Song [2], which will be mentioned later. However, we acknowledge that this term traditionally refers to measures such as mean, variance, skewness, etc. In our usage, summary statistics actually aim at emphasizing that online methods do not require historical data but rather rely on the aggregated data derived from them.
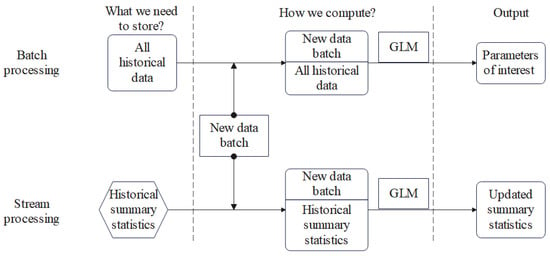
Figure 1.
Comparison of mechanisms for batch processing and streaming processing.
The generalized linear model (GLM) [3] is one of the most widely used models to examine how covariates affect the values of responses of interest for subjects, and it includes several specific models as special cases, such as the linear model, the logistic model, and the Poisson model, among many others. In recent times, many statistical techniques have been proposed to analyze streaming data sequences using the GLM framework. These techniques can be categorized into several main groups. The first category is the commonly used stochastic gradient descent algorithm, which has been investigated and applied to the online scenarios we are interested in [4,5,6,7]. Another type of online approach that has been well proposed specifically involves the cumulative estimating equation estimator for linear models and the cumulatively updating estimating equation estimator for non-linear models [8]. Additionally, a renewable estimation and inference procedure for GLM has also been developed [2], and its applications in analyzing streaming data with clustering [9] or other more general phenomena have also been discussed in the literature [10,11,12,13,14,15,16,17].
Nevertheless, most of the existing methods for analyzing streaming datasets are designed by assuming that all sequentially available data batches are sampled from the same pre-specified model structure with common unknown parameters. Since this widely adopted assumption for streaming data might be violated in many real-world applications, it is important to consider heterogeneity or data drift, which means that underlying model specifications are likely to be changed over time [18]. Directly applying the online methods that ignore this issue may invalidate the model accuracy for the current data batch due to the potentially incorrect estimates of the parameters of interest. Therefore, it is crucial to extend the existing online estimation procedures, originally designed for common model structures, to address the challenge of heterogeneity. We are grateful to an anonymous reviewer for pointing out that our setup shares similarities with random coefficient models, as discussed in Klein [19] and Hsiao [20], and with the regime-switching models in the field of time series, as described in Hamilton [21]. We appreciate the diverse methods of estimating random coefficient models, including Bayesian updating and estimation with all data, and our proposed method offers a valuable addition to this field. Our method, from the perspective of the frequentist, is suited for analyzing streaming datasets, a modern context that motivates our research.
As a motivating example, we focus on the airline on-time statistics database that is accessible publicly. Since October 1987, it has been constantly updating its records in terms of all commercial flights’ flight arrival and departure details within the USA.Further details will be elaborated in Section 4.3. A preliminary analysis is conducted there by fitting a series of logistic models to all data batches collected by year separately, in which estimates at each stage should be considered valid since they will be affected by the potentially different previous observations. We find that patterns for regression coefficient estimates changed dramatically, which implies significant population heterogeneity among individuals from various data batches.
Our main contributions in this paper are presented in this paragraph. We develop a novel approach that not only analyzes sequentially arrived data batches in a streaming manner but also adaptively avoids undesirable estimation biases arising from potential changes in the model parameters of interest. Specifically, we focus on the generalized linear model and extend it to fall within the online updating framework, in which the old estimator is recursively replaced with a new one based only on the current individual-level samples and historical summary statistics. To tackle the potential heterogeneity, our key idea lies in introducing a vector of unknown parameters to measure the differences between batch-specific regression coefficients from adjacent data blocks. Then, the adaptive lasso penalization methodology [22] is used to accurately select nonzero components. We show detailed derivations and discuss issues about computation to further facilitate the implementation of our approach, indicating that it can simultaneously enhance computing efficiency and reduce storage space. We also conduct extensive numerical studies to validate the practical performance of our newly proposed approach.
We structure the remaining parts of this article as follows. We provide a comprehensive summary our assumed streaming framework of model setup in Section 2 and then propose an adaptive online estimation procedure for the corresponding dynamic regression coefficients in Section 3. Section 4 presents numerical comparisons based on both simulated data with various settings and real data concerning flight arrival and departure records. In Section 5, we summarize this paper with a discussion.
2. The Model Setup
Instead of loading the entire dataset all at once, as in the offline setting, we consider an online scenario in which observations become available sequentially in blocks. For the streaming environment we are interested in, we assume that a series of data batches arrives sequentially, and at the current time point b with , there are independent and identically distributed copies, denoted by
from , in which is a random variable that represents our response of interest and is a vector of measured covariates whose dimension is p. Denote , the cumulative sample size, and let be the cumulative collection of datasets.
For , we assume that the conditional on , the underlying response follows the generalized linear model [3], which assigns the conditional density function of given to be formulated as
where is the corresponding bth vector of unknown batch-specific regression coefficients with dimension p, is a nuisance parameter, and and are known functions. In the Gaussian linear model, it is known that is the variance parameter, while in both the logistic and Poisson models, instead. Note that we can also equivalently express (1) via , where is a known link function.
Remark 1.
Although we suppose that samples in each data batch are independent and identically distributed, observations across different are not necessarily following the same population distributed. More precisely, in view of our model setup presented in (1), potential heterogeneity is allowed to come from changes in regression coefficients. However, the underlying model structures for different data batches are the same, that is, a common generalized linear model. A similar strategy has been used in Luo and Song [18], although they only focus on linear models and impose stricter restrictions on the patterns of how coefficients change.
We aim at making valid estimates of for each currently arriving data batch with . Generally speaking, for statistical analysis in the environment of streaming data with dynamic coefficients we are interested in, there are at least two challenges in practical application. The first one is that loading the whole dataset is infeasible since the previous data is not available any more in an online setting; that is, we only have access to the current data batch and a set of historical summary statistics, denoted by . Another one is that at each accumulation point b, it is possible that we have , meaning that has at least one nonzero component [18]. Due to the potential dynamic coefficients of the current data batch , using the undesirable historical information directly might lead to incorrectly estimated regression coefficients for those we are interested in at the latest moment. Therefore, any newly updated results or seeming efficiency gains should be treated with caution. In a word, new adaptive online methods that can find estimators tailored for heterogeneous streaming data driven by the generalized linear model with dynamic regression coefficients are desired.
3. Proposed Methodology
Our proposed adaptive online method that can accommodate the potential violation of the homogeneity is preliminarily presented in Section 3.1, along with a discussion of its advantages. A more detailed explanation of the underlying motivation and derivation are deferred to Section 3.2. Additionally, computational issues will be discussed in Section 3.3.
3.1. Online Estimation of Dynamic Coefficients
Before presenting our proposed approach, we first discuss two other estimators that will help us understand the advantages of the estimator we will propose shortly after. At the accumulation point b for , we define the following two estimators:
where for , we denote the logarithm of the likelihood function for observations as follows:
and the definition of the objective function used here is indeed the same as that of , except that the summation is taken over all data samples in . We can see that estimates the current batch-specific regression coefficient based on only, meaning that it adapts to the online updating framework since its calculation does not need any historical individual-level observations in . By contrary, the offline estimator needs all sample in and is consequently infeasible in our setting of streaming data.
Remark 2.
It is evident that the estimator naturally avoids the underlying heterogeneity problem and maintains its consistency. Nevertheless, is potentially inefficient due to the absence of historical data . To see that, consider the most ideal scenario that all data batches come sequentially from the same mechanism of underlying population; that is, does not vary across data batches. In such cases, the efficiency of will certainly be lower than that of . Due to these reasons, we term as the online conservative estimator, which can serve as a benchmark in comparison with the proposed method we will develop.
At each accumulation point b, we introduce a p-dimensional parameter vector to accommodate the increment between two adjacent batch-specific regression coefficients
for , which is also termed as the heterogeneous degree between and in this article. Most of the existing methods in the context of online learning [2,8,9] ignore the potential heterogeneity; that is, they implicitly demanded that
or equivalently, , where denotes a matrix consisting of zeros with suitable dimension. It is possible that the vector at the accumulation point b has nonzero components. Thus, adaptively detecting the sparsity structure in could be an effective way to validate the heterogeneity assumption.
We next provide the definition of our proposed adaptive online estimation methodology without delving into excessive explanation. Details of our motivation and derivation will be presented later in Section 3.2. At the accumulation point b with , our proposed online estimator for the underlying dynamic covariate effect is recursively defined as the maximizer
where we denote the function with respect to and
at each bth accumulation point with , where is the tuning parameter and we set , , and , in which denotes the negative second derivative of the logarithm of the likelihood function defined in (3). The specific penalty function we choose is the adaptive lasso penalty [22]. We point out that there are also other alternatives, such as the smoothly clipped absolute deviation penalty [23] and the minimax concave penalty [24], and all of them can produce the consistent estimates and sparse solutions that we are interested in. In comparison with other penalty functions, the adaptive lasso penalty we used is easier to optimize and the algorithm converges very fast. In Section 3.3, more details about the computational algorithm for this newly devised optimization issue in (6) will be discussed.
Remark 3.
From the specific definition, we can see that our proposed online estimator at the accumulation point b () depends on the data only through the current data batch and the historical summary statistics
In other words, a previous estimator is recursively updated to when the new data block of the current observations of interest arrives for . After we obtain the new estimator, the data batch is not needed to be accessible any more except its summary statistics that will be useful in the next stage.
Remark 4.
Note that if we are confident that the assumption stated in (5) holds true, we can directly exclude the penalty term away and in the maximization of (6). In this case, it can be verified that the resulting online estimator simplifies to the one that is adapted to the homogeneous streaming data and has been previously discussed in Luo and Song [2]. The corresponding estimator, denoted as , can be equivalently expressed using the first derivative of objective function; that is, we recursively solve
for all , where and for with . Hence, the existing homogeneous estimator is a special case of the estimator we have just proposed. However, these estimators do not take the underlying dynamical characteristics of regression coefficients into consideration and might not estimate consistent parameters when the covariate effects change.
3.2. Motivation and Derivation of the Proposed Estimator
For a better understanding of our motivation for the construction in (6), let us come back to (6) again. From the notation of nuisance vectors defined in (4), we can deduce that the batch-specific vector of regression coefficients can be equivalently rewritten as
for and . Starting from the first data batch, we assume that we have possessed a series of online updated estimators and until the th data block (). Here, and are just pre-defined notations and specific mathematical definitions will be presented later. They will be shown to coincide with and , which has been proposed in the previous subsection.
Intuitively, we can estimate our current regression coefficient of interest and heterogeneous degree by maximizing the objective function with respect to and
at the accumulation point b. However, optimizing the objective function (9) directly is infeasible since its first term relies on the whole historical raw dataset, but these data will no longer be stored in the streaming setting. To overcome this issue, at the bth accumulation point, we replace each component for summation, that is, , with
for , which can be viewed as a second-order Taylor approximation of at a pre-specified point .
Consequently, we obtain the following approximated function:
Note that the calculation of does not need any historical individual-level data in any more but needs a series of summary statistics. Hence, we can conduct adaptive online estimation based on the refined function. Specifically, at the accumulation point b with , we define an online estimator by recursively calculating
We can show next in Theorem 1 that our proposed online estimator and presented in (6) at the accumulation point b is indeed equivalent to the maximizer of .
Theorem 1.
For all , the maximizer of equals that of , that is,
In other words, recursively optimizing the objective function as defined in (6) is equivalent to recursively optimizing .
Proof.
Write and let in which if and if for . According to the Karush–Kuhn–Tucker (KKT) conditions, we know that at the accumulation point b (), the maximizer that maximizes the function should satisfy the following set of equations:
where we define
Then, we further re-write into a recursive form as follows:
Based on this formula, it can be deduced that solving the online estimators from the set of KKT conditions for all presented in (10) is equivalent to solving them from the following set of equations:
for all . The equivalence lies in the fact that Equation (11) is indeed the KKT conditions for maximizing . Hence, we complete the proof. □
From Theorem 1, we know that defining our proposed adaptive online estimator based on or is equivalent. However, optimizing directly is not satisfactory since the calculation of relies on and
at the time point b, and it is obvious that contains many more historical summary statistics in comparison to . Therefore, to minimize the use of summary statistics and conserve storage memory, it is necessary to further transform it into , which is a more concise objective function.
3.3. Tuning Parameter Selection and Implentation Algorithm
We first discuss the selection of tuning parameters . From the literature, we know that the accuracy of selection and consistency of estimation for the penalty-based approaches depend on an careful choice of the tuning parameter [25,26]. In the offline setting, various methods for parameter tuning have been used in the literature, such as cross-validation (CV), generalized cross-validation (GCV), the Akaike information criterion (AIC), and the Bayesian information criterion (BIC), among many others [27,28,29]. However, in the streaming data setting, where the entire cumulative dataset at accumulation point b with is not assumed to be fully accessible, traditional offline criteria cannot be directly calculated and are no longer feasible.
To align with the streaming environment, we devise the following online BIC information criterion at the bth accumulation point for our proposed method:
where and denotes the cardinality of an arbitrary set . The online BIC criterion can appropriately balance the model fits and the model complexity. Thus, the chosen is defined as
where denotes the candidate set consisting of potentially desirable values of . We can find that this tuning parameter selection approach adapts to the online environment we are interested in since the newly defined online BIC criterion only depends on and the historical summary statistics .
We next present an algorithm in implementing the proposed online estimation method in an online updating scheme. To optimize the objective function in (6), we suggest an algorithm for the purpose of finding the maximizer by following similar steps to those in Zhang and Lu [30]. As mentioned in that paper, we approximate the objective function in (6) with the help of an iterative least-squares procedure coming from the updating step of the Newton–Raphson algorithm. Then, by imposing the adaptive lasso penalty, we solve the resulting problem with a lasso-penalized least-squares form at each iteration. Various algorithms can be used to optimize this standard problem, such as the proximal gradient descent, the coordinate descent, and the shooting algorithm, among others [29,30,31]. It has been demonstrated to be computationally efficient through numerical experiments. We briefly list the steps for the implementing of our proposed adaptive online estimator for dynamic regression coefficients coming from the generalized linear model as follows:
- Step 1.
- Sequentially input arriving datasets from model (1).
- Step 2.
- Compute and using initial dataset .
- Step 3.
- For each :
- Read in dataset .
- Calculate using only and set .
- For in a sequence tuning parameter , obtain and by optimizing the objective function (6).
- Choose optimal via the online BIC criterion shown in (12).
- Set and , and update .
- Save the newest set of summary statistics as defined in (7).
- Release dataset from the memory
- Step 4.
- Output the parameters of interest and for each .
We emphasize here, as pointed out in the previous literature, that analyzing data in a streaming manner not only saves storage space but also significantly reduces computation time. Offline methods that load and fit all historical data are time-consuming. However, neither offline nor previous online methods have considered the potential heterogeneity of the data. Our newly proposed method can flexibly address this phenomenon. Frankly speaking, compared to online methods that assume data homogeneity, our method increases the computational complexity due to the usage of penalty terms. But thanks to the online setting, the increasing of computational complexity is linear with respect to the number of data batches and should not be significant when the cumulative sample size is large, since only a small number of samples need to be loaded each time and we do not need to load all of the historical data directly.
4. Numerical Studies
We have conducted a series of numerical studies to evaluate the finite sample performance of our proposed adaptive online estimation procedure in the generalized linear model with dynamic regression coefficients. In this paper, we primarily focus on the logistic model, but it is worth noting that other types of generalized linear models can be implemented similarly. Both simulated experiments and a real case data are considered.
4.1. Mathematical Formulation for a Special Case: The Logistic Model
As we have generally derived the estimation procedures based on the framework of the generalized linear model, we will now provide the detailed mathematical expressions of necessary quantities via this special case of interest. Denote . The density function for a single sample used in the logistic model is
In comparison with the general form as presented in (1), we have , and here in the logistic model.
Then, at the accumulation point b, the log-likelihood function based on the data can be expressed as
With this formulation in hand, the first derivative, or equivalently, the score function, and the negative second derivative, or equivalently, the information matrix, are
respectively. In the next section of numerical studies, we will illustrate our proposed method via the logistic model.
4.2. Simulation Experiments
We adopt the logistic model structure to represent the potential response of interest. To facilitate our presentation, we suppose that there is a terminal point B, and for each , we sequantially generate the streaming data batches with binary outcomes and covariates , resulting in a full dataset with a total sample size . For ease of presentation, we directly set for all b and also suppose that the sample sizes of all data batches are , for all . Given , follows a Bernoulli distribution with probability of success and dispersion parameter . A logistic model takes the form
for , where we set , with generated from a bivariate normal distribution (marginal standard normal with covariance 0.4). Note that and are correlated and both discrete and continuous random variables have been involved to mimic a more realistic scene.
We consider the following four simulation cases with different numbers of data batches and different magnitudes of heterogeneous degrees:
- Case 1.
- , , and .
- Case 2.
- , , and .
- Case 3.
- , , , .
- Case 4.
- , , , .
All remaining heterogeneous degrees that have not been specified are zero vectors. Two different sample sizes of and 800 are conducted for these cases. In comparison with Case 1, Case 2 features smaller heterogeneous degrees. Case 3 and Case 4 are different in the values of B and they contain more data streams than Case 1 and Case 2, making them more complex. It is worth noting that B chosen in Case 1 and Case 2 is relatively small, and the reason is that we can view the gradual changes more clearly in the performances of online estimators. A total of 500 repetitions are conducted for each simulation setting.
First, we view from the results to investigate whether the newly proposed method can estimate heterogeneous degrees and detect heterogeneous ones appropriately. For Case 1, we show simulation results about sparsity estimation for all streaming stages in Table 1, while for Case 2, the corresponding results are shown in Table 2. We report the proportion of times for the proposed methods of underselecting (U), overselecting (O), and exactly selecting (E) the nonzero ones in each streaming stage. These measures can tell us how well the proposed method performs in identifying potential changes of effects. To evaluate the estimation accuracy of heterogeneous degrees, we further report the estimated mean squared error (MSE). In Table 1 and Table 2, we have also reported the frequencies of all heterogeneous degrees that have been estimated as nonzero ones. It can be observed that the E value exhibits relatively high values. In addition, as the sample size increased from 400 to 800, the occurrence of mistake selections was reduced significantly. The extent of these mistake selections was relatively small and can be considered negligible. The results of frequencies indicate that at batch 6 and 11, the variable can be fully selected 500 times. From all these results, we can find that our newly proposed online method performs well in terms of identifying the potential existence of dynamic regression coefficients.

Table 1.
Results for sparsity evaluation of heterogeneous degrees for Case 1.

Table 2.
Results for sparsity evaluation of heterogeneous degrees for Case 2.
Summarized simulation results for the sparsity estimation of heterogeneous degrees under both Case 3 and Case 4 are shown in Table 3. Only simulation results at and next to those blocks of observations that have nonzero components of heterogeneous degree vectors are shown for ease of presentation. We find that our proposed estimator shows similar results as before from the perspective of identifying and quantifying dynamic effects even when heterogeneous data batches occur many more times. When the homogeneity holds in comparison with the former data batch, the estimation accuracy evaluated by MSE is reduced greatly due to the consideration of historical useful information.

Table 3.
Results for sparsity evaluation of heterogeneous degrees for Cases 3 and 4.
To provide a more intuitive presentation of the estimated regression coefficients, we employ boxplots to illustrate the estimated regression coefficients across all cases. In Figure 2, the results for Case 1 with the sample size 400 are shown. Similar results for Case 2 with the sample size 400, and both cases with the sample size 800 are respectively shown in Figure A1–Figure A3 in Appendix A. Note that in all reported figures, we have labeled our proposed estimator as “Online-Hetero”. In addition, we have considered various other methods for comparison, including the online estimator proposed by Luo and Song [2], referred to as “Online”, which has also been introduced in our Remark 4, and the online conservative estimator, termed as “Online-Conser”, which has been defined in Equation (2) and discussed in Remark 2. The method “Online” has been shown in Luo and Song [2] to outperform other existing methods under homogeneity. In addressing the heterogeneity problem, the “Online-Conser” method serves as a benchmark compared to the proposed method since it naturally mitigates the underlying heterogeneity issue, ensuring its consistency by estimating the current batch-specific regression coefficient solely based on the current data batch. Hence, these chosen methods for comparison are representative.
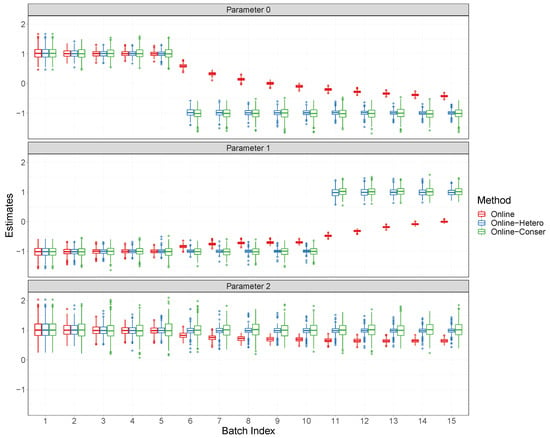
Figure 2.
Boxplots for regression coefficients for Case 1 with batch size 400.
The boxplots for parameters 0 and 1 demonstrate that, in the presence of heterogeneity, the Online-Conser can promptly detect it and provide consistent estimates. However, due to neglecting the underlying existence of dynamic regression coefficients, the biases of the Online estimator are quite large. The Online method also exhibits a tendency to progressively converge towards the altered degree of heterogeneity as the number of data batches increases, and even in the absence of heterogeneity for parameter 2, it displays slight deviation, as shown in these boxplots. In contrast, our proposed method demonstrates the ability to adaptively detect potential changes in regression coefficients, resulting in unbiased estimates. Furthermore, compared to the online conservative estimator, our proposed estimator significantly improves efficiency as homogeneous data accumulates, even though we need to deal with occasional coefficient changes. We can also find that although there are occasional changes of coefficients, our proposed estimator can lead to a large efficiency gain, in comparison with the online conservative estimator, when the homogeneous data accumulate. In other words, the conservative estimator results in lower efficiency since it ignores historical information directly and only uses current data.
We then turn our attention to Case 3 and Case 4. The boxplot for estimated regression coefficients at the terminal point for Case 3 is shown in Figure 3, and a similar boxplot for Case 4 is presented in Figure A4 in Appendix A. We present only the terminal point as we have introduced the offline method (denoted by “Offline”), which requires data from the entire sample size. Additionally, given the larger number of data blocks in these cases, presenting the results in the same manner as before would result in an overly lengthy display. This makes it challenging to clearly show our findings. In these scenarios, where heterogeneity arises occasionally, the biases of both the Online estimator and the Offline estimator are notably unsatisfactory at the terminal point. In contrast, our proposed method, Online-Hetero, delivers satisfactory results due to its adaptive capability in detecting heterogeneous degrees.
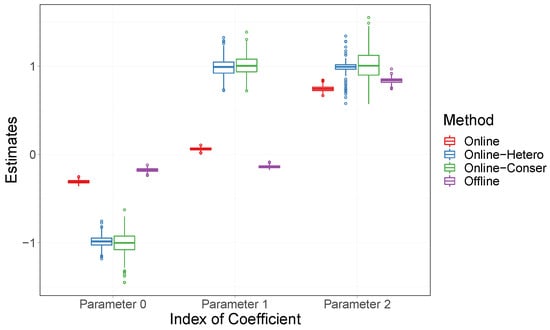
Figure 3.
Boxplots for regression coefficients at the terminal point B for Case 3.
4.3. Real Data Analysis
4.3.1. Presentation of the Streaming Airline Data
In this subsection, our online methodology is applied to the airline on-time statistics mentioned in the introduction part, available at the corresponding website (https://zenodo.org/record/1246060 (accessed on 25 October 2023)).
To provide a general demonstration of the effectiveness of our newly proposed method, we use this dataset to investigate the effects of factors such as distance and departure time on late arrival for those flights that are of medium and large distances (greater that 2400 miles) on weekends in the year 2008. The records are extracted from the database in accordance with these characteristics.
Here are more details about the real data we will analyze. A flight is termed as a late arrival if it is late by more than 15 min. The variable named “distance” is continuous in miles, and the variable named “night” is binary with 1 if the corresponding flight takes off between 8 p.m. and 5 a.m. and 0 otherwise. These are commonly chosen and analyzed variables in the literature [8]. Finally, a total of 46264 eligible flights are included in our study. The proportion of late arrivals is . In addition, night flights account for of all records. The median distance is 2553 miles. To analyze the data in a streaming manner, we arrange all records in the data based on their actual occurrence in time and then partition them into 12 distinct data blocks according to the month. The sample sizes vary for each block in our study, and these sizes span a range from a minimum of 3109 samples in the smallest block to a maximum of 5134 samples in the largest block. While we could consider a larger dataset with more batches, doing so might complicate the graphical representation of our analysis results. By limiting our analysis to a year’s worth of data, we can present the advantages of our method in a way that is both aesthetically pleasing and easy to understand. However, it is important to note that our method is not limited to this number of data blocks, meaning that we can handle many more in practical applications, as demonstrated in our previous simulation experiments.
4.3.2. Fitting in an Online Manner Using Various Approaches
We first apply the conservative estimation approach on these streaming data batches, or, in other words, we fit a series of logistic models to monthly individual data batches separately. In Figure 4, we show the trace plots of the regression coefficients for distance and night via dotted lines. It is evident that the trend for the coefficients of distance has an obvious change in about month 6, while the trend for coefficients of night exhibits a significant change in about month 10. These observations indicate the potential existence of heterogeneity coming from dynamic effects. The estimation results of the conservative estimator are considered as a standard reference since each estimate is based solely on the current data batch and should be consistent. However, as demonstrated by the dotted line in Figure 4, this method exhibits significant fluctuations, which is consistent with the phenomena observed in simulation experiments in Section 4.2.
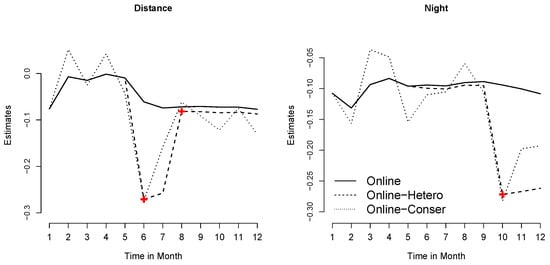
Figure 4.
Trace plots of regression coefficients for different methods.
Subsequently, we apply the online estimator of Luo and Song [2], which has also been used in the simulation subsection and does not account for potential heterogeneity. As seen in Figure 4 (dashed lines), the fluctuations in the estimates obtained from the Online method are more stable compared to those from the Online-Conser method, primarily due to the consideration of previous information. Nevertheless, the estimated regression coefficient curves of the Online method differ significantly from those of the Online-Conser method. This discrepancy suggests that the estimates provided by the Online method could potentially be biased, and the Online method cannot accurately detect potential changes in regression coefficients.
Alternatively, we apply our proposed online estimation method to adaptively update estimates for regression coefficients. Trace plots of regression coefficients for different covariates have also been presented in Figure 4 using solid lines. Our proposed method successfully identifies the abrupt changes in distance and night that were not observed in the results from the Online-Conser method. In this graph, we have marked the locations where heterogeneity was identified with red plus signs. These marks correspond to non-zero elements in the estimates of the nuisance parameters provided by the penalty method. For example, the break of night indicates that after month 10, there is a larger negative effect on flights that take off at night. The 95% pointwise confidence intervals based on bootstrapping for our proposed Online-Hetero estimator are plotted in Figure 5. These results highlight the value of identifying dynamic regression coefficients to produce more convincing estimation results in the streaming data environment, which is becoming increasingly prevalent in practice.
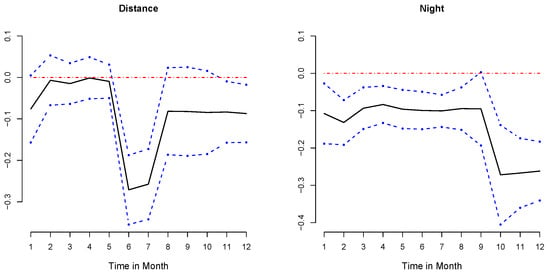
Figure 5.
The 95% bootstrap pointwise confidence intervals for proposed method.
5. Discussion
We present a novel online estimation procedure to analyze the streaming datasets, and the underlying model structures are assumed to be the generalized linear models with dynamic regression coefficients. Based on detailed derivations, we have demonstrated that our proposed method can not only adapt to the online updating framework but also avoid undesirable estimation biases coming from the potential changes in the model parameters of interest. From the numerical experiments of our simulations and a real-world case in the previous Section 4, we observe the crucial importance of identifying potential heterogeneity. Ignoring the changes in parameters can lead to significant biases, thereby losing important information contained in the data. The proposed online estimation procedure holds significant potential for real-world applications, particularly in the era of big data. It is especially relevant for scenarios where data is constantly incoming in a streaming manner, such as financial markets, social media analytics, and real-time health monitoring systems. By addressing potential heterogeneity and dynamically adjusting to changes in parameters, our method can provide more accurate insights. This could lead to improved decision-making and statistical accuracy in these fields.
Although there are many advantages, we admit that there still exist important issues that need to be solved in the future. First, we only focus on the simplest scenario of observations and one future direction would be to extend the current methods to analyze other types of data in a heterogeneous streaming data environment, including but not limited to clustered data [9] and survival data [32]. Second, we have assumed that the heterogeneity only comes from the changes in batch-specific regression coefficients for simplicity, while the model structure, that is, the generalized linear model, remains the same across all data batches. In an existing paper [18], an online estimation method that combines a linear state–space model and Kalman recursive technique has been proposed. However, a similar issue is encountered in their approach. More general heterogeneity needs to be considered, such as changes in the model structures. In addition, we only suggest using the bootstrap technique in the empirical analysis instead of deriving the asymptotic distributions with explicit formula for standard errors. More theoretical derivations need to be conducted to facilitate such an important step to further speed the computation. We will investigate these non-trivial issues in future projects.
Author Contributions
Conceptualization, J.W., J.D. and S.L.; Methodology, J.D. and J.W.; Formal analysis, J.D., J.W. and J.Y.; Investigation, J.D., J.W., S.L. and X.C.; Writing—original draft preparation, J.W., J.D. and S.L.; Supervision, S.L., J.Y. and X.C; Funding acquisition, S.L. and J.W. All authors have read and agreed to the published version of the manuscript.
Funding
This research received no external funding.
Data Availability Statement
The authors acknowledge the efforts in the creation of the database of the airline on-time statistics, which is available from the website at https://zenodo.org/record/1246060 (accessed on 25 October 2023).
Acknowledgments
The authors are grateful to the Joint Editor, Associate Editor, and reviewers for their constructive suggestions and insightful comments.
Conflicts of Interest
The authors declare no conflict of interest.
Abbreviations
The following abbreviations are used in this manuscript:
| GLM | Generalized linear model |
Appendix A. Supplementary Numerical Results
This appendix contains some additional numerical results referenced in Section 4 of the main text. In addition, boxplots of the estimated regression coefficients for Case 1 with the sample size 4 and both Case 1 and Case 2 with the sample size 800 are shown in Figure A1, Figure A2, and Figure A3, respectively. In Figure A4, we show the boxplots of estimated regression coefficients at the terminal point for Case 4.
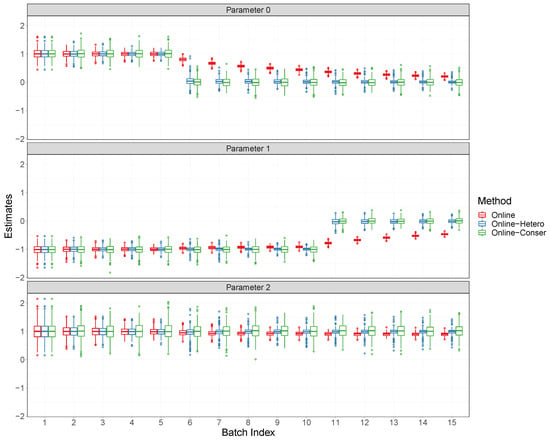
Figure A1.
Boxplots for regression coefficients for Case 2 with batch size 400.
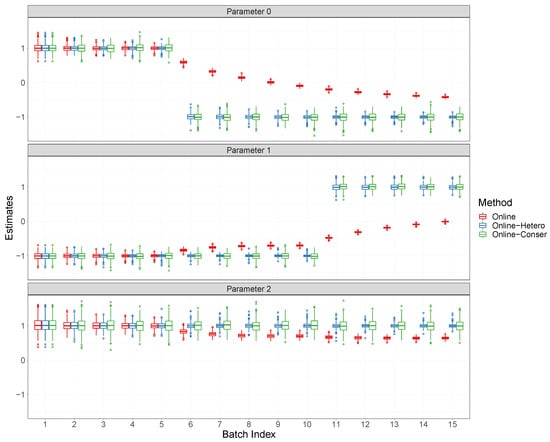
Figure A2.
Boxplots for regression coefficients for Case 1 with batch size 800.
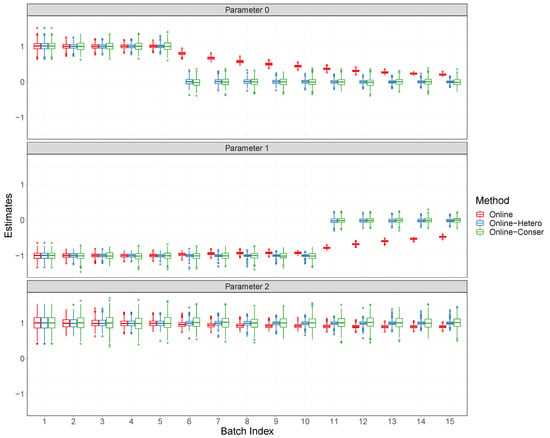
Figure A3.
Boxplots for regression coefficients for Case 2 with batch size 800.
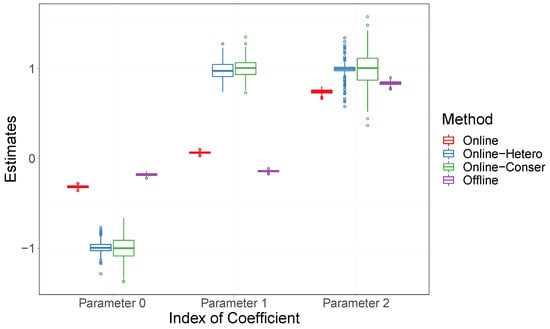
Figure A4.
Boxplots for regression coefficients at the terminal point B for Case 4.
References
- Wang, C.; Chen, M.H.; Schifano, E.; Wu, J.; Yan, J. Statistical methods and computing for big data. Stat. Its Interface 2016, 9, 399–414. [Google Scholar] [CrossRef]
- Luo, L.; Song, P.X.K. Renewable estimation and incremental inference in generalized linear models with streaming data sets. J. R. Stat. Soc. Ser. (Stat. Methodol.) 2020, 82, 69–97. [Google Scholar] [CrossRef]
- McCullagh, P.; Nelder, J.A. Generalized Linear Models; Routledge: New York, NY, USA, 2019. [Google Scholar]
- Robbins, H.; Monro, S. A Stochastic Approximation Method. Ann. Math. Stat. 1951, 22, 400–407. [Google Scholar] [CrossRef]
- Toulis, P.; Airoldi, E.M. Scalable estimation strategies based on stochastic approximations: Classical results and new insights. Stat. Comput. 2015, 25, 781–795. [Google Scholar] [CrossRef] [PubMed]
- Toulis, P.; Airoldi, E.M. Asymptotic and finite-sample properties of estimators based on stochastic gradients. Ann. Stat. 2017, 45, 1694–1727. [Google Scholar] [CrossRef]
- Fang, Y. Scalable statistical inference for averaged implicit stochastic gradient descent. Scand. J. Stat. 2019, 46, 987–1002. [Google Scholar] [CrossRef]
- Schifano, E.D.; Wu, J.; Wang, C.; Yan, J.; Chen, M.H. Online updating of statistical inference in the big data setting. Technometrics 2016, 58, 393–403. [Google Scholar] [CrossRef]
- Luo, L.; Zhou, L.; Song, P.X.K. Real-time regression analysis of streaming clustered data with possible abnormal data batches. J. Am. Stat. Assoc. 2022, 543, 2029–2044. [Google Scholar] [CrossRef]
- Wang, K.; Wang, H.; Li, S. Renewable quantile regression for streaming datasets. Knowl. Based Syst. 2022, 235, 107675. [Google Scholar] [CrossRef]
- Jiang, R.; Yu, K. Renewable quantile regression for streaming data sets. Neurocomputing 2022, 508, 208–224. [Google Scholar] [CrossRef]
- Sun, X.; Wang, H.; Cai, C.; Yao, M.; Wang, K. Online renewable smooth quantile regression. Comput. Stat. Data Anal. 2023, 185, 107781. [Google Scholar] [CrossRef]
- Wang, T.; Zhang, H.; Sun, L. Renewable learning for multiplicative regression with streaming datasets. Comput. Stat. 2023, 1–28. [Google Scholar] [CrossRef]
- Ma, X.; Lin, L.; Gai, Y. A general framework of online updating variable selection for generalized linear models with streaming datasets. J. Stat. Comput. Simul. 2023, 93, 325–340. [Google Scholar] [CrossRef]
- Hector, E.C.; Luo, L.; Song, P.X.K. Parallel-and-stream accelerator for computationally fast supervised learning. Comput. Stat. Data Anal. 2023, 177, 107587. [Google Scholar] [CrossRef]
- Han, R.; Luo, L.; Lin, Y.; Huang, J. Online inference with debiased stochastic gradient descent. Biometrika 2023, asad046. [Google Scholar] [CrossRef]
- Luo, L.; Wang, J.; Hector, E.C. Statistical inference for streamed longitudinal data. arXiv 2022, arXiv:2208.02890. [Google Scholar] [CrossRef]
- Luo, L.; Song, P.X.K. Multivariate online regression analysis with heterogeneous streaming data. Can. J. Stat. 2023, 51, 111–133. [Google Scholar] [CrossRef]
- Klein, L. A Textbook of Econometrics; Prentice-Hall: Upper Saddle River, NJ, USA, 1953. [Google Scholar]
- Hsiao, C. Analysis of Panel Data; Cambridge University Press: New York, NY, USA, 1986. [Google Scholar]
- Hamilton, J.D. Time Series Analysis; Princeton University Press: Princeton, NJ, USA, 1994. [Google Scholar]
- Zou, H. The adaptive lasso and its oracle properties. J. Am. Stat. Assoc. 2006, 101, 1418–1429. [Google Scholar] [CrossRef]
- Fan, J.; Li, R. Variable Selection via Nonconcave Penalized Likelihood and its Oracle Properties. J. Am. Stat. Assoc. 2001, 96, 1348–1360. [Google Scholar] [CrossRef]
- Zhang, C.H. Nearly unbiased variable selection under minimax concave penalty. Ann. Stat. 2010, 38, 894–942. [Google Scholar] [CrossRef]
- Wang, H.; Leng, C. Unified LASSO estimation by least squares approximation. J. Am. Stat. Assoc. 2007, 102, 1039–1048. [Google Scholar] [CrossRef]
- Wang, H.; Li, B.; Leng, C. Shrinkage tuning parameter selection with a diverging number of parameters. J. R. Stat. Soc. Ser. (Stat. Methodol.) 2009, 71, 671–683. [Google Scholar] [CrossRef]
- Akaike, H. A new look at the statistical model identification. IEEE Trans. Autom. Control 1974, 19, 716–723. [Google Scholar] [CrossRef]
- Schwarz, G. Estimating the dimension of a model. Ann. Stat. 1978, 6, 461–464. [Google Scholar] [CrossRef]
- Tibshirani, R. Regression shrinkage and selection via the lasso. J. R. Stat. Soc. Ser. (Stat. Methodol.) 1996, 58, 267–288. [Google Scholar] [CrossRef]
- Zhang, H.H.; Lu, W. Adaptive Lasso for Cox’s proportional hazards model. Biometrika 2007, 94, 691–703. [Google Scholar] [CrossRef]
- Friedman, J.; Hastie, T.; Tibshirani, R. Regularization Paths for Generalized Linear Models via Coordinate Descent. J. Stat. Softw. 2010, 33, 1–22. [Google Scholar] [CrossRef] [PubMed]
- Cox, D.R. Regression models and life tables (with discussion). J. R. Stat. Soc. Ser. (Stat. Methodol.) 1972, 34, 187–202. [Google Scholar]
Disclaimer/Publisher’s Note: The statements, opinions and data contained in all publications are solely those of the individual author(s) and contributor(s) and not of MDPI and/or the editor(s). MDPI and/or the editor(s) disclaim responsibility for any injury to people or property resulting from any ideas, methods, instructions or products referred to in the content. |
© 2023 by the authors. Licensee MDPI, Basel, Switzerland. This article is an open access article distributed under the terms and conditions of the Creative Commons Attribution (CC BY) license (https://creativecommons.org/licenses/by/4.0/).