1. Introduction
The organization is a bounded social entity comprising interconnected elements arranged in a specific manner. Multi-level organizations, characterized by an internal top-down structure and encompassing multiple sectors, have emerged as the predominant form of social organization. These multi-level organizations are characterized by their extensive scale across different countries or regions, intricate job profiles, and diverse workforce composition. Human resource planning constitutes a critical challenge for multi-level organizations to effectively meet their operational requirements and strategic objectives. Human resource planning (HRP), also known as workforce planning [
1,
2,
3,
4], is an activity that governs and manages the macro perspective to optimize the composition of personnel at all levels within multi-level organizations to achieve a state of equilibrium.
Previously, HRP primarily relied on statistical analysis to address workforce gaps in key positions [
5], but it lacked a macro perspective for grasping and optimizing the organizational personnel structure. In recent years, scholars have tackled this issue through mathematical modeling approaches. For instance, Lin [
6] models the multi-criteria human resource allocation problem as a multi-stage combinatorial optimization problem and sets the objective function from the organizational standpoint to simultaneously minimize the cost and maximize the benefit of human resource allocation. Hall [
7] addresses HRP for U.S. Army officers using the CPLEX11.2 solver, constructing an officer flow network based on rank and managing personnel flow through recruitment, promotion, and retirement strategies to minimize deviation from target force structure. More current HRP studies will be detailed in
Section 2. These studies model and solve the problems according to their respective characteristics and are more scientific and rational than the earlier HRP methods.
However, existing research often overlooks the realistic features and complex characteristics of multi-level organizations when modeling and solving problems. The models and methods studied primarily focus on the lower-level organization, which only represents personnel mobility simplistically. In multi-level organizations, human resources planning necessitates comprehensive control over staff inflow and outflow, as well as the equilibrium of units across all levels of the organization, etc. Due to the multi-level characteristics in such organizations, human resources planning also presents a hierarchical characteristic, i.e., the human resources planning of the next level is related to the previous level, and there are correlations between different levels. The development of these organizations is typically influenced by multiple factors; thus, periodic implementation of human resources planning becomes imperative to maintain a dynamically balanced personnel structure across all organizational levels.
Based on the above characteristics of human resource planning problems in multi-level organizations, the current research in practical application may give rise to the following issues:
- (1)
The complexity of a multi-level organizational structure and the presence of numerous low-level units, without consideration, can result in extensive computational requirements due to the substantial size of these units.
- (2)
Planning without considering the hierarchical structure may result in an excessive turnover rate within higher-level organizations, such as minimal turnover among the topmost organizations.
- (3)
The personnel turnover at each level of the organization typically encompasses various factors, posing challenges in establishing reasonable constraints and objective functions.
Therefore, this paper is based on the realistic characteristics of multi-level organizations and fully considers the personnel flow across levels and units as well as the requirements of HRP. It proposes an optimization problem and model for HRP networks in multi-level organizations, incorporating differentiated objective functions and constraints from both organizational and individual perspectives. Moreover, it expands the application of traditional HRP methods to address the complexities inherent in multi-level organizations. Furthermore, we propose an improved late acceptance hill climbing algorithm based on the tabu and retrieval strategy (TR-LAHC). This approach aims to optimize the organizational personnel structure by effectively allocating limited human resources across different levels and positions, thereby maximizing their overall effectiveness.
The structure of this paper is as follows:
Section 2 provides a summary of the existing research on HRP and related algorithms.
Section 3 presents the problem of multi-level organization human resource planning and develops a multi-level HRP network optimization model, including an introduction to the model’s constraints and objective functions.
Section 4 presents the TR-LAHC algorithm, including framework, initialization strategy, neighborhood structure, and retrieval strategy.
Section 5 describes the experimental setup and presents the experimental results. Finally,
Section 6 concludes this paper with a comprehensive discussion summarizing our findings and discussing future research directions for this problem.
2. Related Work
This paper presents a comprehensive overview of HRP research across four dimensions: authors (year), research object, objective function and solution method, as shown in
Table 1. Specifically, about the research object dimension, this section focuses on whether the studies involve multi-level organizations; furthermore, concerning the objective function dimension, this section examines the number of objective functions and whether they are set from an organizational or individual development perspective.
Lin et al. [
6] modeled the multi-criteria human resource allocation problem as a multi-stage combination optimization problem, set the objective function from the organizational perspective to minimize the cost and maximize the benefit of human resource allocation at the same time, and proposed a multi-objective hybrid genetic algorithm to solve this problem. Nirmalad et al. [
8] investigated the problem of planning for the recruitment and promotion of personnel in an organization based on a dynamic planning algorithm with an objective function of minimizing the cost incurred by the organization in conducting the recruitment and promotion process of personnel. Hall et al. [
7] solved the HRP problem for U.S. Army officers based on the CPLEX11.2 solver, constructed an officer flow network based on the rank level of officers, and controlled the flow of personnel from three perspectives: recruiting, promoting, and retiring to achieve the goal of minimizing the bias value of the personnel structure of the current unit and the target state. Bastian et al. [
9] investigated the HRP planning problem in the U.S. Army Medical Department, modeling the problem as a mixed-integer programming model that considers various types of constraints on personnel during the recruitment and promotion process to minimize the deviation of the current personnel structure from the target state. Komarudin et al. [
10] aimed at maximizing individual employee job satisfaction and promotion stability and evaluated these two indicators based on fuzzy theory. In modeling and solving, they combined the two objectives into one objective function, modeled this problem as a mixed integer programming problem, and solved it based on the branch-and-bound method. Zais et al. [
2] constructed a Markov chain model based on U.S. Army officer turnover data that predicts officer retention based on current personnel status to anticipate measures related to talent retention. This study provides feedback to calculate the pay incentives for officers at different stages of their careers based on employment in the civilian sector. Also, it validates the predictive power of the Markov chain model. Jaillet et al. [
11] first proposed a method for assessing the riskiness of an organization’s current human resource situation and solved this problem based on the cut-plane method to minimize the organizational risk factor. Abdessameud et al. [
12] conducted a study on the HRP planning problem in the Belgian army by constructing an army personnel flow network and setting an objective function from an organizational point of view to reach the target state of the organizational structure by controlling the personnel flow. This study modeled this process as a mixed-integer programming problem and solved it based on the CPLEX solver. Dong [
13] established an intelligent scheduling model of enterprise human resources based on inverse relationship to meet the needs of human resources enterprises to implement strategies by maximizing employees’ performance. Wang [
14] aimed at the problem of human resources allocation in the process of enterprise management; this research established a corresponding mathematical model and solved the optimal allocation model of human resources based on particle swarm optimization algorithm.
In terms of research objects, current studies on HRP focus on multi-level organizations, like the military, large enterprises, and government administrations. This characteristic necessitates consideration in modeling and solving HRP problems; however, existing research has not adequately explored the influence of different hierarchical units on personnel mobility.
In terms of the setting of the objective function, most of the studies set the objective function from the perspective of the organization, mainly to make the human resource structure of the organization reach its ideal state. A few studies set the objective function from the perspective of the individual development of the personnel in the organization. In reality, however, multi-level organizations need to achieve a win–win situation for both the organization and the individual in HRP, a situation that still needs to be addressed in existing research. Therefore, this paper represents the multi-level organization personnel flow problem utilizing a multi-level organization personnel flow network, constructs a multi-level human resource network optimization model, and sets the objective function from the perspectives of both the organization and the individual to solve the actual problem.
In terms of solution methods, researchers choose different methods for solving the problem according to the characteristics of their respective research problems, including intelligent optimization algorithms, exact solution algorithms, Markov chain models, etc., and some of the researchers also use commercial solvers for solving the problem, such as CPLEX, OpenSolver, and so on. In the above methods, the intelligent optimization algorithm represented by the metaheuristic algorithm can solve complex problems in a shorter time, and it has become the mainstream method for solving all kinds of complex optimization problems at this stage. After experimental comparison, the overdue acceptance algorithm shows more solving effect and solving speed in solving the optimization model of the human resource network of the multi-level organization. The late acceptance hill climbing algorithm (LAHC) [
15,
16] efficiently jumps out of the local optimum by accepting the solution before a specific time (step), and has shown excellent solution results in many real-world problems [
17,
18,
19,
20,
21]. Compared with simulated annealing [
22] and the great deluge algorithm [
23], the algorithm is simple in principle, which retains the asymptotic convergence of the hill-climbing method and has the intelligence of jumping out of the local optimum.
Among the current research related to HRP, the majority focuses on setting the objective function from an organizational perspective, paying more attention to the balance of personnel structure. Also, a few studies set the objective function from the perspective of individual development. However, in reality, both perspectives need to be considered in human resource planning to achieve a “win–win” situation for both the organization and the individual, which is not yet touched upon in the current research. In addition, in a multi-level organization, personnel mobility also has a multi-level characteristic, which should also be considered in the modeling and solving of HRP problems, and this characteristic has not been sufficiently taken into account in the current research.
This paper focuses on addressing the human resource planning problem within a multi-level organizational context by incorporating multi-level organizations’ unique characteristics into the modeling and solving processes. Furthermore, in setting the objective function, considerations are given to both organizational and individual development perspectives, thereby enabling optimization of both the organizational personnel structure and individuals’ growth within the organization. Aiming at the characteristics of HRP for multi-level organizations, this paper proposes an improved late acceptance algorithm based on tabu and retrieval strategy and two types of neighborhood operators. The proposed algorithm is applied to solve this problem based on the late acceptance algorithm. It sets up simulation experiments to test the model’s performance and the effectiveness of the algorithm.
3. Modeling
In this section, firstly, we present a mathematical representation of the multi-level organizational human resource planning problem. Then, we model the problem as a network and construct an optimization model for the multi-level organization human resource network. Finally, we describe the constraints and objective functions of this model.
3.1. Problem
In order to address personnel mobility across levels and units in a multi-level organization, managers are increasingly concerned with formulating appropriate structures for each level and determining the optimal number of personnel. The key challenge lies in effectively planning and expressing the personnel mobility between units at each level, ensuring a balanced state throughout the organization. HRP in such organizations typically involves controlling internal and external movements of personnel, as well as facilitating transfers between different levels or positions within the organization [
24,
25]. Various organizational situations often give rise to personnel mobility during practical activities.
- (1)
Organizational managers need to respond to the actual situation of organizational development and other corresponding organizational structure distribution adjustments;
- (2)
Regular entry and exit of personnel, such as recruitment and dismissal;
- (3)
Regular internal mobility, such as promotion and exchange of personnel.
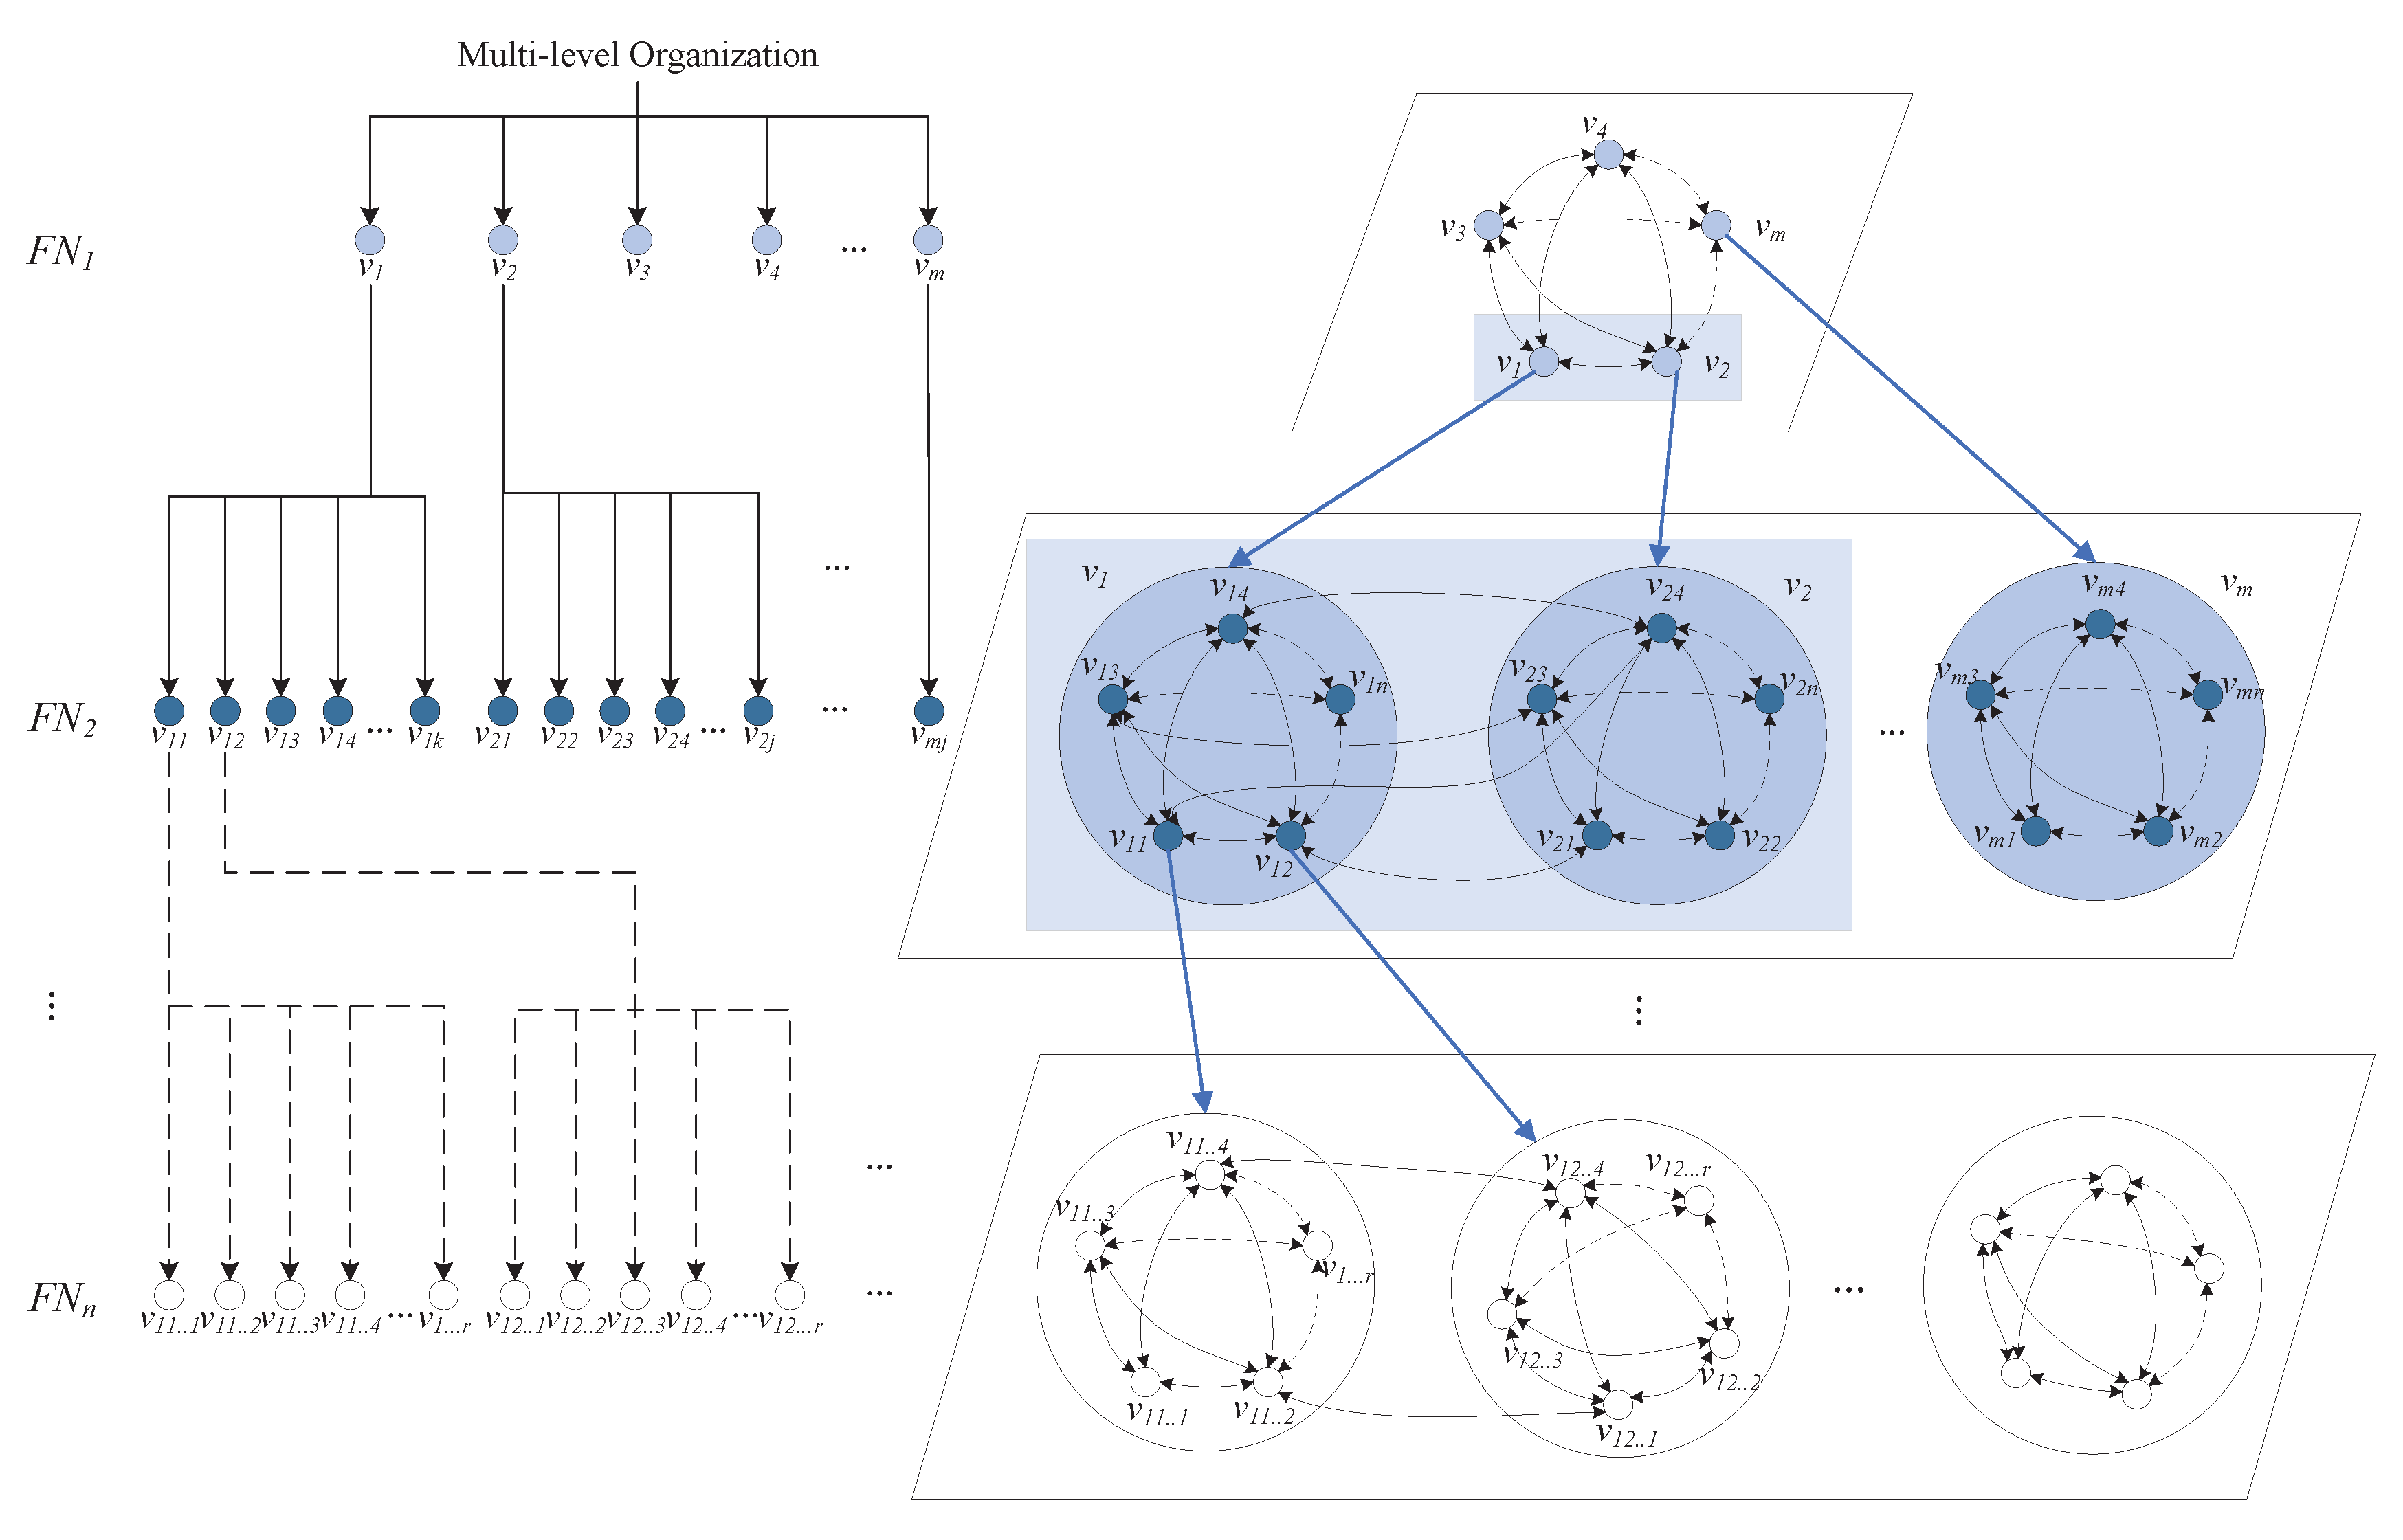
This paper constructs a multi-level staff flow network to address the aforementioned issues to depict personnel mobility within multi-level organizations. This paper constructs a multi-level staff flow network to represent the personnel mobility scenario seen in a multi-level organization. It is based on the assumption that both the organizational structure and staffing levels are predetermined, as illustrated in
Figure 1.
This flow network (FN) contains multiple levels, and its structure can be represented in a generalized form, as depicted by Equation (1). Each flow network in level
p can be regarded as a set of nodes and edges, as shown in Equation (2).
The set represents a collection of flow networks, while the set denotes the subset of level p flow networks. Similarly, the sets and represent the nodes and edges in level p flow networks.
In the multi-level staff flow network shown in
Figure 1, each node
represents a unit contained within a multi-level organization, and the edges between the nodes represent the existence of staff flow between units. According to the actual situation of the organization, each node can contain several attributes, such as the name of the unit to which the node corresponds, its priority, the rank of the personnel it contains, and the existing volume. Meanwhile, each node consists of the nodes belonging to the next level, i.e., the subnodes of the next level together constitute the nodes of the previous level. Similarly, each edge may have several attributes, such as the start and end of the flow, the type of flow, the amount of movement of people, etc.
Since the multi-level staff flow network constructed in this paper has multi-level characteristics and the amount of staff flow between nodes should be an integer, the optimization process of this network is modeled as a multi-stage integer planning problem. According to the organizational hierarchical structure, top-down planning of organizational personnel exchange starts from the uppermost network and plans the amount of personnel flow among the nodes of the uppermost network; then, based on the results of the personnel flow planning of the upper network, the amount of personnel flow is allocated to each subnode of each uppermost node, and so on, until the amount of personnel flow is allocated to the lowest hierarchical node. The problem can be generalized and expressed as:
Decision variables:
The set represents the objective functions, where denotes the number of personnel movements at level and refers to a set of constraints at level p.
Regarding the constraints of the generalized model, the first condition is that the maximum value of the decision variables in optimizing the entire multi-level staff flow network does not exceed M. The second condition is that the constraints considered in optimizing the multi-level staff flow network at each level need to be set according to the context of the different problems.
3.2. Symbols and Variables
This section gives the symbols, variables, and their corresponding meanings associated with the multi-level human resource network optimization model. The symbols and variables represent the specifics shown in
Table 2.
Decision variables: .
denotes the total number of people flowing from the level p node i to node j, and denotes the total number of the level p nodes.
The decision variables denotes the personnel flow from the level th node under the level th node, to the level th node under the level th node.
3.3. Constraint
According to the multi-level staff flow network optimization model, the optimization of different levels is interconnected, and the optimization of the following network often needs to be carried out based on the upper network’s optimization results, which also affects the setting of the objective function and constraints in each stage of the integer programming problem. Therefore, based on the actual situation, while considering the organization’s staff structure and personal development, this part builds a multi-level organization staff flow network optimization model with the following constraints:
3.3.1. Level p Constraints
The level p flow network mainly focuses on controlling the staffing structure of the enterprise from an organizational perspective by controlling the ratio of overstaffing in each type of node within a reasonable limit under the condition that the relevant constraints are satisfied.
Constraints 1: Control the inflow of personnel. To ensure that the inflows to the nodes remain within a reasonable range, it is necessary to ensure that the number of people moving into the nodes does not exceed a certain ratio of the establishment, which depends on the organization.
Constraints 2: Control outflow of personnel. To keep the number of outflows at nodes below a reasonable range, it is necessary to keep the number of outflows from nodes to a certain percentage of the establishment, which depends on the organization.
Constraints 3: Control the internal promotions of personnel. The number of internal promotions must be not less than a certain percentage of the set number, which varies according to the organization.
Constraints 4: Control the overstaffing or shortfall. To prevent overstaffing or shortfalls at the nodes beyond reasonable limits, it is necessary to keep the percentage of overstaffing or shortfalls at each node after turnover from exceeding a predefined threshold, which usually depends on the organizational situation.
3.3.2. Level Constraints
Since level network optimization is based on level p network optimization, i.e., the results of optimization of the level p network are the inputs of optimization of the level network, level network optimization should mainly satisfy the constraints related to the results of optimization of the level p network:
Constraints 5: Balanced turnover of personnel. The number of personnel movements on each level
p edge should equal the total number of movements on the level
edges it contains.
Constraints 6: In-degree balance. The in-degree (the number of people moving in) of each level
p node should equal the sum of the entry degrees of the level
nodes it contains.
Constraints 7: Out-degree balance. The out-degree (the number of people moving out) of each level
p node should equal the sum of the out-degrees of the level
nodes it contains.
3.4. Objective Function
3.4.1. Level p Objective Function
The level
p staff flow network mainly focuses on controlling the overstaffing or shortfall ratio of each type of node within a reasonable range from the organizational perspective to control the enterprise’s personnel structure to satisfy the relevant constraints. Therefore, the objective function of the optimization model of the level
p network is set to minimize the sum of the squares of the overstaffing or shortfall ratios of each node, as shown in Equation (13):
3.4.2. Level Objective Function
While considering the balance of the organization’s personnel structure, the development of individual employees is also taken into account, and a level
network optimization model is constructed from the perspective of personal development, which promotes the promotion and development of personnel under the premise of satisfying the relevant constraints and requirements so that the gap in the promotion rate of each level
node is reduced as much as possible. Therefore, the optimization objective of the second stage is set to minimize the variance of the promotion rate of the level
nodes, as shown in Equation (14).
4. Method
To address the issue of turnover in multi-level organizations more effectively, we propose an enhanced late acceptance hill climbing algorithm based on tabu and retrieval strategy (TR-LAHC) and introduce two novel neighborhood structures. This section initially presents the algorithm’s framework, then introduces its initialization strategy, and concludes with the proposal of the neighborhood structure and retrieval strategy.
4.1. Framework
The LAHC algorithm performs well in various problem-solving but still has some problems. For example, the algorithm generates new neighborhood solutions through operators during the optimization search, but these neighborhood solutions may be duplicated, causing the algorithm’s optimization to be less efficient. Besides that, in the final stage of the algorithm execution, as worse solutions will not be accepted anymore, the scoring function of the historical optimal solution set will be pretty close to each other, which will also make it difficult for the algorithm to jump out of the local optimum and reach a stagnant state. The stagnant state is one in which the results of the search for optimization within r generations are not improved. Therefore, this section proposes TR-LAHC to solve this problem, and its algorithm flowchart is shown in
Figure 2.
The pseudocode is illustrated in Algorithm 1:
| Algorithm 1: TR-LAHC |
 |
Lines 7–9 follow the tabu strategy of the tabu search algorithm, which can improve the algorithm’s optimization efficiency and enhance the capability of the LAHC algorithm to jump out of the local optimum. Note that when the number of solutions in the tabu list exceeds the length of the tabu list, the solutions in the list are updated according to the first-in-first-out principle (FIFO). Lines 10–17 incorporate a retrieval strategy that will backtrack the entire solution to the state where the last optimization search occurred for boosting when the algorithm reaches a state of stagnation, i.e., . More inferior solutions will likely be accepted, which can make the algorithm jump out of stagnation. The parameter r needs to be set in the specific context of the problem, generally r > late acceptance step l.
4.2. Initialization Strategy
The paper proposes an algorithm initialization strategy to generate an initial solution for the input of the local search algorithm.
4.2.1. Level p Initialization Strategy
Firstly, nodes that meet the promotion criteria are stochastically selected using Russian roulette. A random edge of the node is chosen, and one individual flows to the targeted node until all eligible nodes have had an outflow of one individual. If the number of eligible nodes is fewer than the number of individuals who entered, an overqualified node is then randomly selected and assigned one individual along an edge pointing towards a vacant node that satisfies the conditions. This process continues until all super-nodes capable of pointing to a vacant node have been depleted by one individual.
4.2.2. Level Initialization Strategy
The level optimization model takes as input the optimal solution of the level p optimization model, so the initial solution is the level p optimization model solution.
4.3. Neighborhood Structure
In this section, based on the decision matrix of the multi-level staff flow network optimization model, the neighborhood formed by a 3 × 3 decision matrix (i.e., a staff flow network optimization problem with three nodes) is used as an example to visualize the algorithmic neighborhood structure and the two operators designed in this section:
4.3.1. Move Operator
The Move operator can randomly change the value of a decision variable in the decision matrix, e.g., changing the value of the decision variable
from 1 to 3 in the decision matrix
X as shown in
Figure 3. In the multi-level staff flow network optimization model mentioned above, the actual meaning of this operator is that the number of people flowing from the first node to the second node (i.e., the number of flows is changed from 1 to 3) in a given level is changed. In this section, the operator is designed to be the most basic optimization operator, and any complex operator can be formed by combining multiple Move operators.
4.3.2. Swap Operator
The Swap operator can randomly swap the values of one or a series of decision variables in the decision matrix, which can be further categorized into three types at random, homotopy, and whole rows of swap operators, as shown in
Figure 4. In the multi-level staff flow network optimization model, the actual meaning of this operator is that the number of people moving on a particular two edges is exchanged. This operator is the same as the Move operator in its basic principles and can be regarded as a combined form of several Move operators.
4.4. Retrieval Strategy
Although the LAHC algorithm can effectively jump out of the local optimal solution by receiving the solution before the specified step length, it may still not be able to jump out of the local optimal solution if it exceeds this step length. Therefore, in this paper, the taboo strategy and retrieval strategy are added to the LAHC algorithm to improve the ability of the algorithm to jump out of the local optimal solution.
The retrieval strategy makes the algorithm backtrack after a certain number of generations r of stagnation to a state r generations ago, i.e., , which means that there will be worse solutions that may be accepted for the algorithm to jump out of the stagnation state—generally, the number of backtracking generations r > late acceptance step l.
5. Experiments
To verify the effectiveness of the multi-level staff flow network model, the multi-level organization staff flow optimization model, and the TR-LAHC algorithm, we designed a series of experiments and used five commonly used algorithms for comparison.
5.1. Setup
The experimental setup for this paper is Core i7-10510U 1.8 GHz, 16 GB RAM, Windows 10 operating system laptop, coding environment is Java 8, and all of the algorithms are run under the same system configuration.
Constraint threshold setting: The thresholds of constraints 1 to 4 in the optimization model can be adjusted according to the actual situation of the organization. To ensure the experiments are carried out successfully, the constraint thresholds are set as shown in
Table 3:
Experimental examples: To validate the multi-level staff flow network model, multi-level organization staff flow network optimization model, and TR-LAHC algorithm, comprehensively considering various situations in reality, this paper designed the experimental data as shown in
Table 4, according to the organizational size and the number of personnel within it. A total of 9 groups of examples with distinct characteristics were included.
The node and edge attributes for each level are shown in
Table 5 and
Table 6, respectively:
Algorithm comparison: In this section, algorithm comparison experiments are conducted to solve the above cases based on commonly used algorithms such as tabu search (TS); late acceptance hill climbing (LAHC); improved late acceptance hill climbing algorithm with tabu Strategy, T-LAHC; simulated annealing (SA); and genetic algorithm (GA).
Algorithm parameter settings: This experiment is divided into two stages. After the preliminary experimental comparison, the optimal parameters of each algorithm are selected within the two stages for the final performance comparison of algorithms. The parameter settings of the algorithms in each phase are listed as follows.
In the first stage, the number of iterations and late steps of TR-LAHC, T-LAHC and LAHC algorithms are 500,000 and 500, the size of tabu list at TR-LAHC and T-LAHC is 10, and the retrieval step of TR-LAHC algorithm is 1500; the iteration number of TS is 10,000, and the length of tabu list is 10; the iteration number of SA algorithm is 100,000, and the annealing type is equal variance; the GA algorithm has 500 evolutions, population size of 100, crossover probability of 0.8, and mutation probability of 0.01.
In the second stage, the number of iterations and late step of TR-LAHC, T-LAHC, and LAHC algorithms are 1,500,000 and 800, the size of tabu list of TR-LAHC and T-LAHC is 15, and the retrieval step of TR-LAHC algorithm is 1000; the number of iterations of TS algorithm is 50,000, and the length of tabu list is 15; the number of iterations of SA algorithm is 500,000, and the annealing type is equal variance; the GA algorithm has 600 generations, a population size of 100, a crossover probability of 0.8, and a mutation probability of 0.01.
Evaluation indicator: The performance of the algorithms is evaluated by running each algorithm case times. Evaluation indicators, including the best profit (Best), average profit (Mean), and standard deviation (Std.), are used to compare the results of each algorithm.
5.2. Result
After computation,
Table 7 shows the comparison results of each algorithm in level
p network optimization, where
Figure 5 shows the iteration progress in the horizontal coordinate and the corresponding profit in the vertical coordinate, and
Figure 6 shows the algorithm in the horizontal coordinate and profit in the vertical coordinate.
The above results indicate that the TR-LAHC algorithm exhibits the lowest termination objective function profit and achieves superior optimization outcomes, thereby enabling more effective optimization of the level p staff flow network compared to other algorithms.
In order to control the variables, the performance of several algorithms in level
network optimization will be compared using the results of level
p staff flow planning obtained by the best result TR-LAHC algorithm as an input in the comparison experiments of level
network optimization. After computations, the results are shown in
Table 8,
Figure 7 and
Figure 8, where
Figure 7 shows the iteration progress in horizontal coordinates and the corresponding profit in vertical coordinates, and
Figure 8 shows the algorithms in horizontal coordinates and the profit values in vertical coordinates.
The above results show that compared to other algorithms. The TR-LAHC algorithm has the lowest termination objective function value and the best optimization as opposed to the other algorithms in optimizing the level staff flow network.
Meanwhile, the experiment also validates the efficacy of the multi-level organizational human resource network optimization model constructed in this study. In level p, the reduction in the objective various sizes of multi-level organizations indicates a decrease in overstaffing or shortfall at level p nodes, effective filling of vacant positions, and a reduction in overstaffed positions. This enhances the overall macro-level structure of the organization and promotes more efficient functioning. At level , a decrease in the objective function signifies a significant improvement in promotion rates at level nodes, facilitating personnel promotion and development while meeting constraints and requirements.
The level p and decision variables and represent personnel mobility between the nodes, and the rate of overstaffing or shortfall of the optimization solution for level p is not higher than the original value, so in the application of the optimization solution, the organization can control the internal personnel mobility through the optimization results of the level bottom-up, and has achieved the optimization of human resources within the organization.
6. Discussion
This paper analyzes the characteristics of staff flow in multi-level organizations, constructs a multi-level staff flow network to describe the process of staff flow in multi-level organizations, and models the optimization problem of this network as a human resource network optimization model for multi-level organizations while setting the objective function from the perspective of the organization and personal development. In this paper, this planning problem is solved to control the flow of personnel in multi-level organizations to optimize the overall personnel structure of the organization. In the design of the solution method, we propose an improved late acceptance hill climbing based on tabu and retrieval strategy (TR-LAHC). Based on the above method, this paper solves the case of multi-level organization in different situations and compares it with other classical algorithms. The experimental results show that the TR-LAHC algorithm has an excellent solving effect and can effectively perform multi-level organization staff flow planning.
Current works have verified the validity of the multi-level organization human resource network optimization model, but there are various shortcomings and special situations in practical application. For example, (1) the organization’s existing personnel and their attributes may not always be able to match the expectations, (2) multiple objective functions and their influence on each other are often found in human resource planning, and (3) time also has an impact on personnel mobility in multi-level organizations. Therefore, in future research, more levels and objective functions will be considered, and multi-objective planning algorithms will be introduced to dynamically solve the multi-level organization personnel mobility problem by considering the movement of personnel in and out of the organization caused by changes in time.


 ,
, 


