Abstract
This study presents a novel methodology for automating the classification of pediatric ADHD using electroencephalogram (EEG) biomarkers through machine learning and deep learning techniques. The primary objective is to develop accurate EEG-based screening tools to aid clinical diagnosis and enable early intervention for ADHD. The proposed system utilizes a publicly available dataset consisting of raw EEG recordings from 61 individuals with ADHD and 60 control subjects during a visual attention task. The methodology involves meticulous preprocessing of raw EEG recordings to isolate brain signals and extract informative features, including time, frequency, and entropy signal characteristics. The feature selection techniques, including least absolute shrinkage and selection operator (LASSO) regularization and recursive elimination, were applied to identify relevant variables and enhance generalization. The obtained features are processed by employing various machine learning and deep learning algorithms, namely CatBoost, Random Forest Decision Trees, Convolutional Neural Networks (CNNs), and Long Short-Term Memory Networks (LSTMs). The empirical results of the proposed algorithms highlight the effectiveness of feature selection approaches in matching informative biomarkers with optimal model classes. The convolutional neural network model achieves superior testing accuracy of 97.75% using LASSO-regularized biomarkers, underscoring the strengths of deep learning and customized feature optimization. The proposed framework advances EEG analysis to uncover discriminative patterns, significantly contributing to the field of ADHD screening and diagnosis. The suggested methodology achieved high performance compared with different existing systems based on AI approaches for diagnosing ADHD.
Keywords:
artificial intelligence; machine learning; deep learning; electroencephalogram; hyperactivity disorder MSC:
68Q32
1. Introduction
Attention-deficit/hyperactivity disorder (ADHD) is one of the most common childhood psychiatric conditions, estimated to affect around 5% of children worldwide [1]. The core symptoms include inattention, hyperactivity, impulsivity, and emotional dysregulation, which impair daily functioning. Although standardized clinical evaluations are the gold standard for diagnosis, ADHD assessment remains challenging due to subjective biases and a lack of definitive biomarkers. Prior research has sought to augment behavioral assessments using neurophysiological features from electroencephalogram (EEG), functional magnetic resonance imaging (fMRI), and genetics [2]. In particular, advanced analytical techniques applied to non-invasive EEG measurements provide promise for objective ADHD diagnostics [3,4,5,6]. Raising Children Australian Parenting reported that during early childhood, the brains of children experience a significant period of rapid development. By the age of six, the cerebral development of individuals reaches around 90–95% of the size seen in adults. During the first stages of development, the early years play a vital role in shaping the brain. However, it is important to note that substantial restructuring is still required for the brain to attain the level of functionality seen in adult brains [7]. The human brain may be conceptualized as a complex and extensive network that efficiently regulates the whole body. The anatomical development of neural tissue in the brain undergoes changes from childhood to adolescence, which are accompanied by alterations in oscillatory patterns and brain imaging data. These changes can be measured using both EEG and fMRI, as demonstrated in studies conducted by Smit et al. [8,9] and Power et al. [10]. Furthermore, these measurement techniques can be used to compare patients with healthy individuals. The brain network of individuals diagnosed with ADHD exhibits several anomalies and divergences when compared to the brain network of neurotypical individuals. These developmental problems have been identified by fMRI assessments, as reported by Tang et al. [11]. Numerous EEG investigations have shown atypical amplitude patterns in the brain waves of individuals with ADHD [12,13,14]. Individuals diagnosed with ADHD exhibit distinct EEG patterns that indicate deviations in neuropsychological functioning when compared to neurotypical individuals. These differences can be effectively identified through the application of machine learning (ML) algorithms, which are recognized as a valuable approach for analyzing complex datasets [15,16,17]. EEG signals provide intrinsic benefits, such as universality, uniqueness, affordability, and accessibility, when compared to other biometric measures [18,19]. Consequently, EEG devices may be conveniently used in many settings, including educational and medical institutions.
Consequently, the use of artificial intelligence (AI) techniques has been proposed as a means to mechanize the procedure and they serve as a tool for aiding in the examination and identification of mental disorders. The aforementioned methodologies may be categorized into two distinct subfields within the domain of artificial intelligence, namely machine learning (ML) and deep learning (DL), with the latter being a subset of the former [20,21,22]. Classification is a prominent problem within the field of EEG and its application to mental diseases. This implies that an ML model utilizes diverse properties derived from EEG data as input and produces a prediction, such as the presence or absence of a mental disorder in a patient. Feature extraction (FE) was employed to obtain the input characteristics from the unprocessed EEG data. The ability to extract and choose a suitable set of features for a certain problem is a crucial factor, as it may determine the usability and effectiveness of an ML model. In other words, it may be argued that FE has significant importance, especially in the context of data analysis such as EEG.
The limitations of the current systems prevent their performance in classifying AHDA using the EGG dataset. This is evident from the findings of previous studies [23,24], which reported an accuracy of 93.91% and 91% using SVM and graphic neural networks based on the accuracy measures. Therefore, we have built an upgraded system aimed at boosting the accuracy of the existing method. The main contribution of this proposed research is drawn below:
- This study implemented a comprehensive ML and DL pipeline using EEG data to classify ADHD accurately from healthy brain function.
- Raw multichannel EEG recordings from 61 ADHD and 60 control children performing a visual attention task were utilized. The rigorous preprocessing, time-frequency feature extraction, feature selection, classifier optimization, and validation techniques are applied to enhance the classification algorithms.
- The ML and DL models have been developed to detect ADHD based on features obtained from the feature selection methods.
- We demonstrated the efficacy of combining EEG biomarkers and sophisticated classification algorithms in robust ADHD detection compared with different existing systems.
- The methodology and results establish guidelines and performance benchmarks to inform future research and the translation of these techniques to improve clinical practice.
2. Background of the Study
The examination of EEG characteristics associated with ADHD has attracted considerable attention, resulting in a substantial body of research [25,26,27,28,29,30,31,32,33,34,35,36,37]. The bulk of studies in this field primarily investigate frequency-domain indicators, which often include absolute and relative power estimates across different frequency bands or power ratios across various frequency bands [38,39,40,41,42,43,44]. Although these approaches are computationally efficient and visually interpretable, they lack the ability to evaluate the nonlinear characteristics of EEG brain dynamics. Researchers have used techniques derived from nonlinear dynamics and chaos theory to investigate the nonlinear characteristics of brain dynamics. The measurement of EEG coherence provides significant insights into the functional connectivity between different regions of the brain. These nonlinear measures capture unique facets of localized brain dynamics and the synchronization interplay between different brain regions. With applications spanning no-task resting states, perceptual processing, cognitive task execution, and various sleep stages, nonlinear time series evaluations of EEG and MEG have provided insights into the brain’s fluctuating dynamics [45]. Nevertheless, coherence is insufficient for defining nonlinear interdependencies, especially when it comes to nonstationary time series. Nonlinear synchronization techniques are used in lieu of conventional methods to facilitate the investigation of functional brain connectivity [25].
According to Stam et al. [39], distinct patterns of brain activity exhibit distinct chaotic dynamics. The dynamics under consideration may be described by nonlinear measures, such as entropy and Lyapunov exponents. Research has shown that the use of the approximation entropy metric is particularly advantageous in the characterization of short time series that are affected by noise. The aforementioned capability allows for the provision of a dependable evaluation of dynamical complexity that is not reliant on specific models and is grounded in information theory [36]. References [40,41] are provided. Numerous studies have shown that brain activity, as a highly intricate dynamic system, has a multifractal organization. Previous research has shown the efficacy of using fractal analysis of EEG time series as a viable approach for elucidating the neural dynamics associated with sleep [36]. A study conducted by Fetterhoff et al. [43] revealed that the multifractal firing patterns seen in hippocampal spike trains exhibited increased complexity during the performance of a working memory task by rats. However, these patterns undergo a significant decrease when rats suffer from memory impairment. Zorick et al. [41] showed that multifractal detrended fluctuation analysis has the potential to impede an individual’s ability to perceive changes in their state of consciousness.
Feature extraction is a fundamental technique in digital signal processing. It involves selecting an appropriate analysis domain, such as time, frequency, or space, then using mathematical functions to derive synthetic and highly informative values from the input signals. The feature extraction methodologies used in electroencephalographic (EEG) investigations focused on the diagnosis and treatment of ADHD in pediatric populations. The researchers were conducted at the executive function level in order to examine the effort involved in identifying neurocorrelates of a diverse range of illnesses, such as ADHD. In some cases, the characteristics that are retrieved in this manner may undergo further transformation and/or calibration in order to enhance the process of detection or classification [46,47,48].
The researchers have used several techniques for feature extraction in the analysis of EEG data. These techniques include statistical features and deep-learning-based features, which have been extensively utilized [49,50,51,52]. The ADHD may also be diagnosed using EEG data, hence necessitating the extraction of characteristics from these signals [53,54]. The linear and non-linear characteristics are extensively used for the purpose of diagnosing youngsters afflicted with ADHD [55], whereas a range of morphological, time domain, frequency, and non-linear properties were extracted from EEG signals in order to facilitate the diagnosis of ADHD in children. Alt1nkaynak et al. [56] used the utilization of morphological, non-linear, and wavelet characteristics as diagnostic tools for the identification of ADHD in children. In the present investigation, we have further derived temporal domain, morphological, and non-linear characteristics based on prior research [57]. Some researchers used alterations in power that measure by persuing the theta/beta ratio (TBR). This characteristic has been proposed in a number of studies [58,59,60,61,62]. However, TBR has limitations as a universal ADHD diagnostic marker. Elevated TBR is not evident in all ADHD patients, while non-ADHD individuals may also demonstrate heightened ratios [58,62]. Moreover, factors like fatigue or medication can confound TBR, underscoring the need to consider influencing variables. Nonetheless, within a holistic assessment, TBR remains a widely studied potential EEG biomarker warranting ongoing scientific attention.
Some researchers have used the feature selection approaches for the identification of putative characteristics associated with ADHD. The process of feature selection is important as it eliminates redundant features and improves the performance of machine learning (ML) and deep learning (DL) models. The feature selection methods are used to mitigate overfitting issues in the training/testing process. Within the existing body of literature, numerous feature selection techniques have been employed, like PCA [63,64] minimum redundancy maximum relevance (mRMR) [65], mutual information (MI) [66,67], t-test [56,57], support vector machine recursive elimination (SVM-RFE) [65], least absolute shrinkage and selection operator (LASSO) [57], and logistic regression (LR) [57]. Khoshnoud et al. [64] used PCA as a technique for reducing the dimensionality of the data. Through this process, they were able to select characteristics that had a high degree of correlation with one another.
The DL and ML methodologies have gained significant traction in several real applications, such as medical imaging [62] and time series analysis [49,68,69]. The ML techniques have been extensively used to differentiate ADHD from a control group of healthy individuals [56,57,63,65,70,71,72,73]. In a study by Muller et al. [44], a set of five classification models was used. These models consisted of logistic regression, support vector machine (SVM) with a linear kernel, SVM with a radial basis function kernel, random forest (RF), and XGBoost. The models demonstrated sensitivities ranging from 75–83% and specificities ranging from 71–77%. The variables used in this research included the conditions of closed eyes, open eyes, and visual continuous performance test signal power throughout various frequency ranges. Additionally, the study examined the amplitudes and latencies of event-related potentials (ERPs). One possible explanation for the suboptimal efficacy of identifying ADHD lies in the inadequate selection of features for the models. One of the prevailing EEG features often seen in individuals with ADHD is an elevation in power at low frequencies, namely in the delta and theta bands, as well as a reduction in power at high frequencies, particularly in the beta band. In the majority of ADHD detection studies, nonlinear characteristics were retrieved by the authors and then identified using common classifiers, such as SVM, multilayer perceptron, and KNN [74]. In this study, researchers conducted experiments using deep convolutional neural networks and DL networks to assess the diagnosis of ADHD in both adult and pediatric populations [75]. Table 1 summarizes systems-based ML and DL models for detecting ADHD.

Table 1.
Summary of existing systems-based ML and DL models for detecting ADHD.
By effectively implementing prompt intervention and precise diagnosis, it is feasible to modify neuronal connections and improve symptomatology. Nevertheless, due to the many characteristics of ADHD, as well as its coexisting conditions and the limited availability of diagnostic professionals universally, the identification of ADHD is often put off. Therefore, it is vital to take into account new methods to enhance the effectiveness of early detection, like the use of ML and DL models. The research gaps that have been found pertain to the performance of existing systems. In the present work, we have examined supplementary characteristics and have used a varied range of ML and DL models in order to enhance accuracy. Furthermore, it is important to find the appropriate feature extraction approaches for the outcomes.
3. Materials and Methods
This research proposes a novel methodology for automated classification of pediatric ADHD from EEG signals. The approach comprises a systematic pipeline with each phase carefully designed to contribute to a robust performance, as depicted in Figure 1. Initially, meticulous preprocessing of the raw EEG recordings is performed through filtering and artifact removal techniques. These are critical to isolating the neurophysiologically relevant signals from potential biochemical and environmental contaminants and establishing a firm foundation for subsequent analysis. Informative features are then strategically extracted from the preprocessed EEG data to enable a nuanced characterization of the brain dynamics. The set of time, frequency, entropy, and power signal features provide a comprehensive encapsulation of the salient neural properties. This phase transforms the data into an informative representation suitable for machine learning. The feature set is further refined through rigorous selection techniques to retain only the most diagnostically relevant variables. By eliminating redundant and uninformative features, the efficiency, generalizability, and interpretability of later processes can be enhanced. Subsequently, optimized models are developed that are tailored to effectively learn from the EEG feature space. Model hyperparameters and architectures are tuned to maximize classification performance on these specific neural data. Finally, rigorous benchmarking on unseen holdout test data provides unbiased insights into real-world effectiveness. Multifaceted metrics quantitatively validate the methodology’s strengths and limitations on this crucial diagnostic task. This strategic methodology holds substantial promise for enabling robust EEG-based ADHD classification. Each phase addresses a key aspect of the overall pipeline, working synergistically to unlock the full potential of data-driven analytics on these neural signals. Detailed empirical evaluations in this paper demonstrate the methodology’s capacity to instigate major advances in computational healthcare.
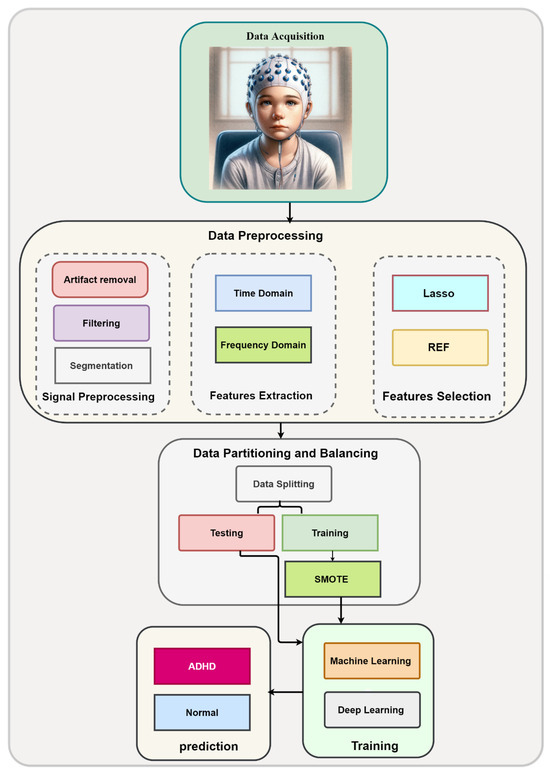
Figure 1.
An illustration of the comprehensive proposed approach for identifying ADHD.
3.1. Participant Recruitment and EEG Data Acquisition
The dataset consisted of EEG recordings from 61 children diagnosed with ADHD (48 males, 13 females; mean age 9.62 ± 1.75 years) and 60 controls (50 males, 10 females; mean age 9.85 ± 1.77 years), as represented in Figure 2.
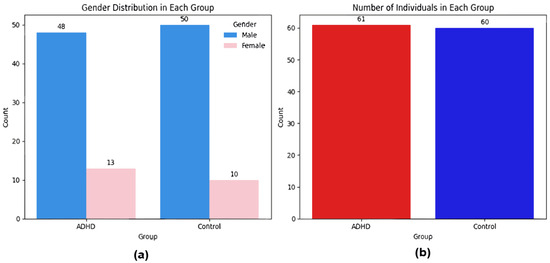
Figure 2.
Participant demographics and EEG dataset of children with ADHD and controls; (a) gender, (b) classes.
Nasrabadi, A.M. EEG Data for ADHD/Control Children 2020. Available online: https://ieee-dataport.org/open-access/eeg-data-adhd-control-children (accessed on 30 July 2023).
The participant cohort for this study comprised 61 children diagnosed with ADHD recruited through psychiatric referrals at Roozbeh Hospital in Tehran, Iran. Clinical evaluations were conducted by experienced child and adolescent psychiatrists to confirm DSM-IV diagnoses of ADHD based on established criteria (American Psychiatric Association [APA] [91,92]). Adherence to standardized DSM-IV guidelines ensured consistent and reliable ADHD assessment across all subjects. The control group consisted of 60 healthy children, with 50 males and 10 females, selected from two Tehran primary schools following psychiatric verification of no neurological disorders.
EEG signals were recorded using a 19-channel system (SD-C24) at a 128 Hz sampling rate with 16-bit analog-to-digital resolution [93]. During recording, participants engaged in a visual sustained attention task responding to a series of images. Each image contained between 5 to 16 randomly positioned age-appropriate animal cartoon characters. Per the experimental protocol, images were presented uninterrupted and immediately following responses to maintain engagement throughout the recording session [93]. The consequent variable-duration EEG recordings depended on individual response speeds. Since the trial length depended on the time taken by each child to count the animals and provide their response, the total trial duration varied across subjects. The minimum trial length was 50 s for one control subject, while the maximum length was 285 s for one subject with ADHD. No additional incentives or penalties were provided linked to performance [93].
This cohort and experimental design allowed the collection of multi-channel EEG data from a sample of well-characterized and matched ADHD and control subjects undertaking a clinically-relevant cognitive task known to elicit ADHD-related neural patterns.
The 19 active EEG electrodes were positioned on the scalp according to the internationally standardized 10–20 system [93]. This allowed reliable coverage of frontal (Fp1, Fp2, F7, F3, Fz, F4, and F8), central (C3, T3, C4, and T4), parietal (P3, Pz, and P4), temporal (T5 and T6), and occipital (O1 and O2) sites. Reference electrodes were placed on the left (A1) and right (A2) earlobes. Table 2 presents channels and their corresponding regions on the scalp, and Figure 3 illustrates the 10–20 electrode locations, which optimized the recording of brain dynamics across cortical regions relevant for EEG analysis.
Table 2.
A presentation of the channels and regions on the scalp.
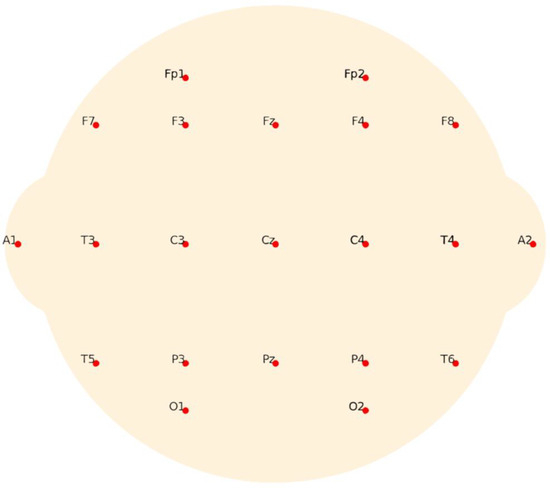
Figure 3.
An illustration of the 10–20 electrode locations.
Electrodes were positioned on the scalp per the 10–20 international standard, allowing reliable coverage of frontal, central, parietal, temporal, and occipital regions. Reference electrodes were placed on the left (A1) and right (A2) earlobes. Figure 3 illustrates the electrode locations that optimized the recording of brain dynamics relevant for EEG analysis.
3.2. Preprocessing of EEG Signals
The raw EEG signals required extensive preprocessing before analysis to isolate clinically relevant neural activity. The multi-stage preprocessing pipeline consisted of:
3.2.1. Digital Filtering
The continuous EEG time series was filtered to remove frequencies outside typical neural bands that represent noise:
- -
- Bandpass filter (0.5–63 Hz): Removes very low and very high frequency components outside the primary EEG range of interest. Attenuates unwanted noise outside this bandwidth.
- -
- Notch filter (49–51 Hz): Removes power line interference at 50 Hz specifically. This narrow stopband targets just the 50 Hz noise while preserving nearby EEG content.
- -
- Butterworth response: Used for both the bandpass and notch filters. Provides a maximally flat frequency response in the passband to avoid distortion of EEG frequencies.
- -
- 4th order filters: Higher order improves roll-off steepness of the filters. This allows sharper attenuation at cutoffs for the band pass and tighter rejection of 50 Hz in the notch filter.
- -
- Zero-phase filters: These are applied to the Butterworth filters to prevent phase distortion. This filtering approach processes the input data in both forward and reverse directions, eliminating phase shifts and ensuring the filter output is aligned to the input.
3.2.2. Frequency Band Separation
The filtered EEG signals were decomposed into conventional delta (0.5–4 Hz), theta (4–8 Hz), alpha (8–13 Hz), and beta (13–30 Hz) frequency bands using 4th-order Butterworth bandpass filters. This enabled examination of ADHD-related neural oscillations in each band.
The delta, theta, alpha, and beta bands cover the spectrum of normal neural oscillations observable in surface EEG recordings and have formed the focus of most ADHD neurophysiological research. Delta waves (0.5–4 Hz) are linked to deep sleep and unconsciousness. Theta waves (4–8 Hz) are associated with drowsiness and memory recall. Alpha waves (8–13 Hz) indicate wakeful relaxation. Beta waves (13–30 Hz) are linked to active concentration and problem-solving.
Critically, these four bands show robust differences in ADHD populations compared to controls. Elevated theta and reduced beta band power are considered diagnostic biomarkers of ADHD. The alpha fluctuations index impairs attentional processes in ADHD. Delta waves also show atypical activity in ADHD. In contrast, higher frequency gamma waves are more difficult to characterize in surface EEG and less utilized in ADHD research.
However, theta/beta ratio (TBR) has limitations as a universal ADHD diagnostic marker. Elevated TBR is not evident in all ADHD patients, while non-ADHD individuals may also demonstrate heightened ratios. Moreover, factors like fatigue or medication can confound TBR, underscoring the need to consider influencing variables. Nonetheless, within a holistic assessment, TBR remains a widely studied potential EEG biomarker warranting ongoing scientific attention.
3.2.3. Signal Segmentation
The continuous raw EEG signals recorded during the visual attention task ranged in duration from 50 to 285 s for each subject. To enable extraction of transient features from the continuous EEG recordings, it is standard practice to partition the time-series into fixed-duration segments. The selection of an appropriate window length involves balancing sufficient signal characterization against attaining adequate samples. In this work, the multi-channel EEG data were segmented into 2-second epochs to analyze localized waveform patterns. Furthermore, 50% overlap between windows was implemented, so each 2-second segment shared 1 s with the prior. This overlap enhances continuity between successive windows. The 2-second duration provides a reasonable compromise between encapsulating salient EEG phenomena while yielding sufficient samples from even the shortest recordings. This aligns with typical EEG analysis values. Specifically, a 2-second window balances capturing transient neural events against characterizing slower oscillatory dynamics. Overly short windows risk missing informative lower frequency patterns, while long windows can smooth valuable fast fluctuations. A 2-second window enables the differentiation of standard EEG bands while providing stable feature calculations. Many event-related potentials and EEG processes of interest manifest over a few seconds, making 2-second segmentation suitable for capturing their time course. Computationally, this window size is efficient and reduces boundary effects sometimes seen with narrow windows. The 2-second window with 50% overlap achieves an effective balance between transient and oscillatory data, frequency resolution, statistical stability, capturing EEG phenomena time courses, computational demands, and boundary effects.
3.3. Feature Extraction
This study extracted a set of 11 time-, frequency-, and information-theoretic features from each two-second epoch of the preprocessed EEG signals across each frequency band and electrode. The time-domain features [94] captured important statistics about the waveform amplitude and distribution in the time series. Specifically, the mean, variance, skewness, and kurtosis were calculated. The mean and variance provide information about signal energy and variability over time. Skewness indicates the asymmetry of the distribution, while kurtosis measures the heaviness of the tails. For frequency features [95], the Hjorth parameters of activity, mobility, and complexity were derived. The activity reflects the signal power, mobility represents the proportion of faster to slower frequencies, and complexity quantifies variability and change in the frequency domain. Shannon entropy and spectral entropy measured the unpredictability and information content of the signals, with higher values indicating more randomness. Power spectral density entropy assessed the flatness versus peak frequency of the power distribution. Additionally, the relative power in each frequency band was computed as the ratio of the absolute power in that specific band to the total power across the bands. This helps quantify the contribution of each EEG rhythm. In total, these 11 features were extracted for each of the 19 channels in the delta, theta, alpha, and beta bands, resulting in 836 feature variables for each two-second window. By concatenating the feature vectors, the high-dimensional EEG time series data were transformed into a consolidated set of informative features for input into the ML classifier.
The selection of features, encompassing statistical, spectral, entropic, and power-related attributes, was purposefully designed to capture the diverse time-domain, frequency-domain, and information-theoretical characteristics of the EEG data. The ultimate goal was to use these features to effectively differentiate between experimental conditions (ADHD vs. Control) using machine learning algorithms.
3.4. Feature Selection
After extracting a substantial feature set from the EEG data, two approaches were pursued for feature selection to derive an optimal diagnostic biomarker subset. The first technique applied a sequential wrapper-filter process. Recursive feature elimination (RFE) was utilized as the wrapper method for feature selection in this study. RFE operates by iteratively training a model, ranking features by importance, and pruning the least important features until the desired number remains. Specifically, a random forest (RF) model was employed within RFE to evaluate feature significance. The RF ensemble consisted of 100 decision trees, each trained on a subset of the data and features. Feature importance was determined based on the decrease in impurity (Gini criterion) conferred across trees. At each RFE iteration, the full set of 836 extracted features was used to train the RF model. The 10% least important features based on the ranking were then eliminated, and the process repeated until 95% of the original features were retained. This reduced feature subset was subsequently passed to principal component analysis (PCA) as the filter method for further dimensionality reduction. PCA transforms correlated features into a smaller set of orthogonal principal components that account for maximal variance. PCA was applied, retaining 95% of the explained variance, yielding the final feature set used for classification. The combination of RFE for initial feature pruning followed by PCA provided a robust data-driven approach for feature engineering. RFE removed irrelevant and redundant features, while PCA identified key patterns and reduced overfitting. This integration of wrapper and filter methods enabled optimal feature selection from the high-dimensional EEG biomarkers [96,97].
The second approach Involved employing least absolute shrinkage. Selection operator (LASSO) regularization is a technique that performs both features selection and regularization to enhance model generalization and interpretability. Unlike standard regression that minimizes the residual sum of squares, LASSO adds a penalty term to the loss function equal to the sum of the absolute values of the coefficients multiplied by a tuning parameter lambda. This penalizes model complexity and shrinks coefficients towards zero. As lambda increases, more coefficients are shrunk to exactly zero and eliminated from the model. This inherently performs embedded feature selection, removing uninformative variables. Only features with nonzero coefficients are retained, ideally identifying the most relevant biomarkers for the task. Therefore, LASSO serves a dual role—the L1 regularization helps prevent overfitting, while the coefficient shrinkage enforces parsimony by selecting a sparse feature subset.
We chose these approaches as the most effective methods for selecting the best features from the EEG data after the ADHD feature extraction. This feature selection process was vital in enhancing the accuracy and efficiency of our model, ensuring that we could derive a concise and highly informative set of biomarkers for ADHD classification.
3.5. Data Partitioning and Balancing
In the process of evaluating model performance, the consolidated dataset was systematically divided into separate training and testing subsets, utilizing an 80/20 stratified division. Specifically, 80% of the data was earmarked for model training, while the residual 20% was reserved for the test set to facilitate an unprejudiced assessment of the model. Upon examination, the original dataset revealed a class imbalance, with a disproportionate number of samples in the ADHD group relative to the control group. It is noteworthy that the duration of each trial was contingent on the time each child took to enumerate the animals and register their responses, resulting in variability in trial lengths. The shortest trial duration recorded was 50 s for a control subject, whereas the longest spanned 285 s for an ADHD participant. Furthermore, the dataset comprised 61 ADHD subjects and 60 controls. Given the observed asymmetry, it was imperative to rectify this bias to ensure rigorous model training. To ameliorate this, the Synthetic Minority Over-Sampling Technique (SMOTE) was judiciously applied to the underrepresented control class within the training data. The SMOTE algorithm operates by first identifying the k nearest neighbors for each minority class sample based on proximity within the feature space. Next, one of these k neighbors is randomly chosen, and a new synthetic sample is computed along the line segment joining the minority sample and its selected neighbor. This process is repeated until the minority class representation matches the desired prevalence.
This method generated synthetic samples, effectively equilibrating the representation of control and ADHD classes in the training subset. It is paramount to emphasize that the application of SMOTE was circumscribed solely to the training data, safeguarding against potential biases in the test data. The undisturbed test subset sustained the intrinsic class imbalance, a strategic decision made to gauge the model’s generalizability to real-world, imbalanced scenarios. This inherent imbalance also furnished an unvarnished evaluation of the model’s aptitude in handling the intrinsic challenges of the dataset. The judicious application of SMOTE to balance only the training dataset facilitated robust model tuning, while the unaltered test set ensured a candid evaluation of model performance on genuine imbalances. This meticulous approach mitigated biases, offering a transparent view of model efficacy and significantly enhancing the models’ performance.
3.6. Machine Learning Algorithms
The automatic detection and classification of ADHD versus healthy controls was performed by applying various ML and DL algorithms, including the decision tree model, AdaBoost model, gradient boosting model, extra trees model, RF model, LightGBM model, CatBoost model, KNeighbors model, multilayer perceptron (MLP) model, CNN-LSTM model, LSTM-transformer model, and CNN model, to EEG biomarker datasets.
This study implemented and evaluated a diverse set of ML algorithms for EEG-based ADHD classification, including both single models and ensemble techniques. Specifically, a single decision tree model was tested as a baseline nonlinear classifier that makes predictions by recursively partitioning the feature space based on optimal splits. For ensemble learning, the study utilized adaptive boosting (AdaBoost), which combines multiple weak learners in a sequential manner, focusing on misclassified instances. Gradient boosting was also used, which produced an additive ensemble model minimizing a loss function via gradient descent optimization.
In addition, extra trees and the RF ensemble method [95] were applied, both of which aggregate predictions across multiple randomized decision trees to improve generalization capability. LightGBM, a gradient boosting framework optimized for efficiency with high-dimensional data, and CatBoost, a boosting technique adept at handling categorical variables, were also implemented.
Finally, KNN, a simple yet effective algorithm that predicts proximity in feature space, was evaluated [96]. This diverse ensemble of single and ensemble tree-based models and distance-based techniques aimed to thoroughly evaluate a wide range of modern ML approaches for EEG-based ADHD classification. Table 3 shows the important parameters of the ML model for detecting ADHD.
Table 3.
Machine learning algorithm parameters.
3.7. Deep Learning Algorithms
The advanced DL models proposed for the classification of ADHD using EEG, including the MLP model, CNN-LSTM model, LSTM-transformer model, and CNN model, were applied to the EEG biomarker datasets.
3.7.1. Convolutional Neural Networks (CNNs) Model
A one-dimensional convolutional neural network (1D CNN) architecture was developed for EEG-based classification of ADHD in this study [97]. The tailored CNN model comprised multiple layers optimized for learning salient features and patterns from the EEG biomarkers to accurately discriminate ADHD cases. Specifically, the model contained two 1D convolutional layers with 128 and 64 filters, respectively, to capture distinctive spatial patterns along the temporal dimension within the extracted EEG features. The convolutional filters learned to recognize localized waveform motifs of diagnostic relevance from the raw biomarker time series. To mitigate overfitting, a dropout regularization layer (rate 0.5) and max pooling layer (pool size 2) were incorporated. The dropout randomly omitted units during training to prevent co-adaptation, while max pooling reduced feature map dimensionality by retaining only the most salient elements. The CNN model then passed the extracted features through fully connected layers, including a 1024-unit layer and a 128-unit layer, with rectified linear unit (ReLU) activation to introduce non-linearity. Finally, a softmax output layer provided binary classification probabilities for ADHD versus control. The model was compiled using categorical cross-entropy loss and the Adam optimizer. Performance was evaluated by classification accuracy on held-out data. Early stopping with patience for 10 epochs avoided overfitting during training. The CNN model architecture is shown in Figure 4, and the model parameters are shown in Table 4.
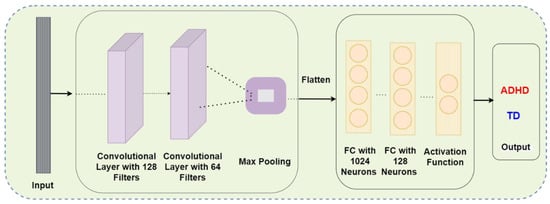
Figure 4.
Demonstrates the CNN model architecture.
Table 4.
Describes the CNN model parameters.
3.7.2. Convolutional Neural Network, Long Short-Term Memory (CNN-LSTM)
This hybrid CNN-LSTM architecture utilized the strengths of both CNNs for feature extraction and LSTM for sequence modeling. The model starts with a one-dimensional (1D) convolutional layer with 128 filters and a kernel size of 3. The Conv1D layer can identify localized patterns in sequential EEG data using the sliding window approach. ReLU activation introduces nonlinearity to the convolved features. A second Conv1D layer follows with 64 filters and a kernel size of 3 to extract higher-level representations of spatial patterns. Stacking convolutional layers allows for the learning of hierarchical features. MaxPooling1D downsamples the feature maps by 2, reducing computational requirements while retaining the most salient features. The model then utilizes an LSTM [98] recurrent layer with 100 memory units. LSTMs can learn long-range temporal relationships from sequential data, such as EEG. Furthermore, the feature maps are flattened into a 1D vector in preparation for fully connected layers. This condenses the data while preserving feature information. The final SoftMax output layer contained two nodes for binary classification into ADHD and control groups. The CNN-LSTM model architecture is shown in Figure 5, and the model parameters are shown in Table 5.
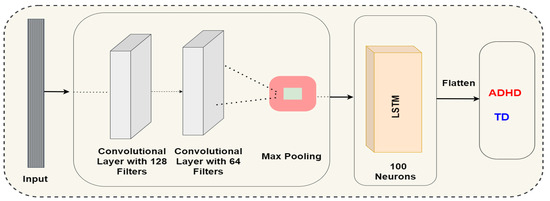
Figure 5.
Demonstrates the CNN-LSTM model architecture.
Table 5.
Describes the CNN-LSTM model parameters.
3.7.3. LSTM-Transformer Model
The developed neural architecture comprises a hybrid recurrent-transformer topology optimized for EEG-based ADHD classification. The model is structured into three key sections. The base of the network uses two sequential LSTM layers with 100 and 50 units to capture the temporal dynamics in the EEG input sequences. LSTM units [99] contain memory cells and gates that enable the learning of temporal dependencies and long-range sequential patterns. The paired LSTM layers provide a robust foundation for modeling temporal information in EEG biomarkers.
Following the recurrent layers, a transformer block is applied that employs multihead self-attention to identify informative components across the EEG biomarker sequence. Self-attention draws global dependencies between sequence elements [99]. The multihead mechanism runs parallel attention layers to focus on different parts of the sequence. This block has shown effectiveness in diverse sequence modeling tasks. Furthermore, the transformer contains feedforward layers with residual connections and layer normalization to stabilize activations. Residual connections propagate signals directly across network layers, while layer normalization rescales outputs for consistency. The output of the transformer is flattened into a 1D representation and passed to a final dense layer with Softmax activation to produce binary ADHD classification probabilities. The model is compiled with Adam optimization at a learning rate of 0.001 and categorical cross-entropy loss [100,101]. Early stopping halts training if validation loss shows no improvement for 10 epochs to prevent overfitting. The LSTM with multihead self-attention model architecture is shown in Figure 6, and the model parameters are shown in Table 6.
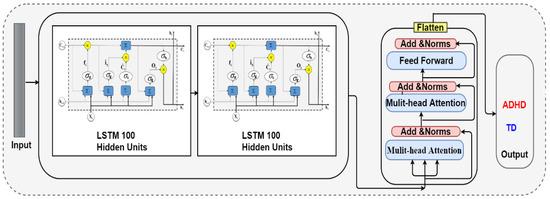
Figure 6.
Demonstrates the LSTM-Transformer Model with multihead self-attention model architecture.
Table 6.
Describes the LSTM-Transformer model parameters.
3.8. Multilayer Perceptron (MLP)
The perceptron is restricted to binary classification tasks using a simple linear predictor. The multilayer perceptron (MLP) provides a significantly more flexible architecture capable of modeling complex nonlinear relationships for both classification and regression problems. The MLP contains multiple layers of computational nodes, starting with an input layer to receive data, followed by one or more hidden layers, and ending with an output layer that produces the prediction. The addition of one or more hidden layers enables the network to learn sophisticated data representations and feature hierarchies directly from the inputs. The parameters of the MLP model for detecting ADHD are shown in Table 7.
Table 7.
MLP parameters.
4. Experimental Results
This study proposed a framework for developing and validating EEG-based classification models for ADHD diagnosis. The experimental framework includes critical processes of data preprocessing, class balancing, model implementation and evaluation, and detailed results analysis. In this section, we provide details about the experimental environment setup and the evaluation matrix that is used for ADHD diagnosis models.
4.1. Environmental Setup
The ML and DL models were implemented and tested using a laptop workstation equipped with an 8th generation Intel Core i7 CPU, 16 GB RAM, and a dedicated NVIDIA GeForce GTX GPU with 8 GB memory. The models leveraged the TensorFlow and Scikit-learn frameworks for efficient development and evaluation. This integration of cutting-edge software Python 3.9.16 and hardware provided an optimal environment for rapidly prototyping and validating EEG-based ADHD classifiers.
4.2. Evaluation Metrics
A robust evaluation of model competence necessitates employing a diverse array of performance metrics. Vital indicators, such as sensitivity, recall, F1-score, receiver operating characteristic (ROC) analysis, and confusion matrices, should be analyzed. No single metric reveals the full picture. Rather, utilizing multiple metrics to scrutinize different facets of performance allows for holistically gauging strengths, weaknesses, and overall efficacy from different lenses. A comprehensive, multifaceted evaluation is imperative for fully characterizing model capabilities.
High specificity signifies that the model rarely misclassifies controls as having ADHD. Along with sensitivity for the positive class, specificity thus provides crucial insights into performance for clinically important subgroups.
The ROC curve visualizes the tradeoff between true and false positives across thresholds, conveying deeper insights than accuracy alone. ROC analysis elucidates the balance of sensitivities and specificities at different operating points. The area under the curve (AUC) provides a singular metric of classification discrimination capabilities.
4.3. Results
4.3.1. Classification Results Based on the RFE-PCA
In this subsection, we present the performance of ML and DL models on the ADHD classification task using EEG biomarkers selected through the RFE and PCA methods. Table 8 summarizes the results of the ML and DL models, using the RFE-PCA feature selection methods. Several pertinent evaluation metrics are reported including testing accuracy, sensitivity, specificity, area under the curve (AUC) ROC curve, and F1 score.
Table 8.
Results of Ml algorithms with RFE-PCA method.
Among ML models, the KNN algorithm achieved the highest testing accuracy of 92.79%, indicating robust generalization. The ensemble methods, including random forest, LightGBM, and CatBoost, also exhibited excellent performance, with testing accuracy surpassing 84% for all models. This highlights the power of the KNN model for EEG classification.
The confusion matrix is a statistical summary of a binary classifier’s performance that includes the proportion of correct and incorrect classifications. It provides a numerical evaluation of the model’s class discrimination performance. To better understand the strengths and drawbacks of binary classification models, the confusion matrix emphasizes errors such as false positives and false negatives. Figure 7 and Figure 8 display the confusion metrics of the machine learning algorithm for detecting ADHA. It is observed that the KNN model has achieved high accuracy with less misclassification in 191 samples of data.
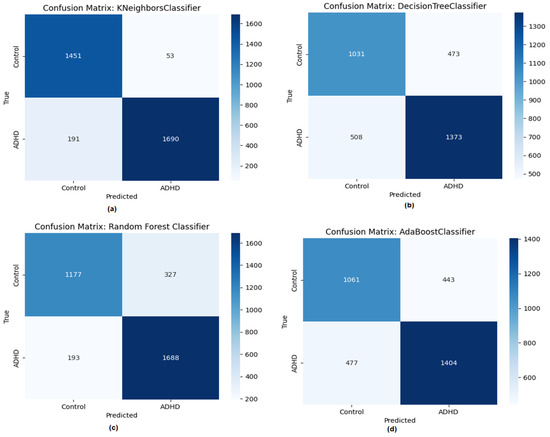
Figure 7.
Confusion matrix of machine leaning models with RFE-PCA, (a) KNN, (b) decision tree, (c) RF, (d) AdaBoost.
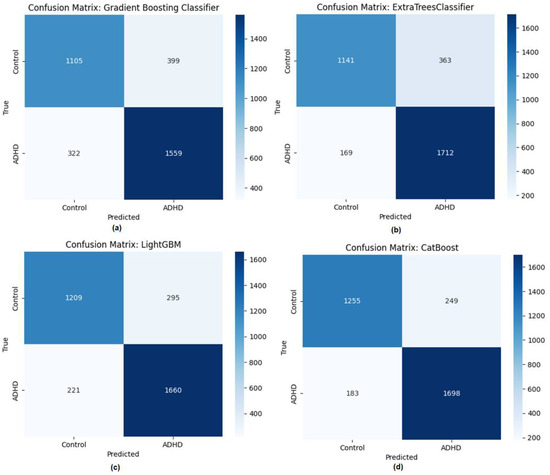
Figure 8.
Confusion matrix of machine leaning models with RFE-PCA, (a) Gradient Boosting, (b) Extra Trees, (c) LightGBM, (d) CatBoost.
The results of the DL models with RFE-PCA are presented in Table 9. Notably, the deep neural network architectures, namely the CNN and MLP models, attained the highest evaluations across all metrics—exceeding 94% testing accuracy and AUC, along with 95% F1 scores. This demonstrates the exceptional capacity of DL techniques to extract informative features from selected EEG biomarkers and achieve highly accurate ADHD screening. Figure 9 shows the confusion matrix of the proposed deep learning. The CNN and MLP models have shown less false positive and false negative; therefore, the MLP and CNN models have achieved high accuracy.
Table 9.
Results of DL algorithms with RFE-PCA method.
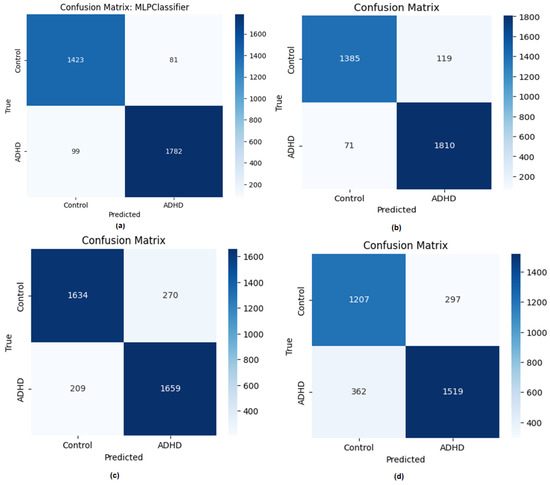
Figure 9.
Confusion matrix of DL models with RFE-PCA, (a) MLP, (b) CNN, (c) LSTM-Transformer, (d) CNN-LSTM.
Figure 10 illustrates the performance of deep learning in identifying ADHD. The validation accuracy of the CNN model ranged from 70% to 94%. In comparison, the validation accuracy of the LSTM model with transform and the CNN-LSTM model were almost the same, reaching 84%.
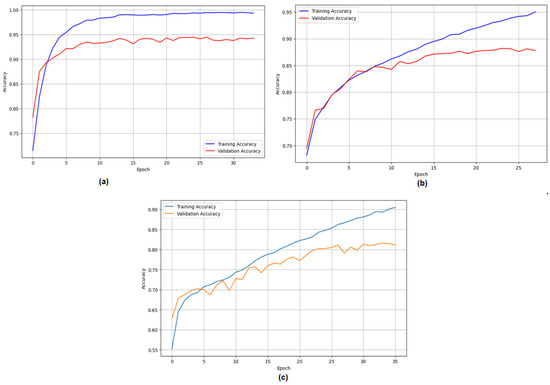
Figure 10.
Performance of DL with RFE-PCA, (a) CNN, (b) LSTM-Transformer, (c) CNN-LSTM.
Figure 11 displays the training and testing losses of the deep learning models implemented using Recursive Feature Elimination-Principal Component Analysis (RFE-PCA). The graphical representation reveals that the CNN model exhibited a gradual reduction in loss, reaching a value of 0.2. In contrast, the LSTM model with transform and the CNN-LSTM model had testing losses of 0.3 and 0.4, respectively. This serves as evidence that the CNN model has attained a commendable level of accuracy.
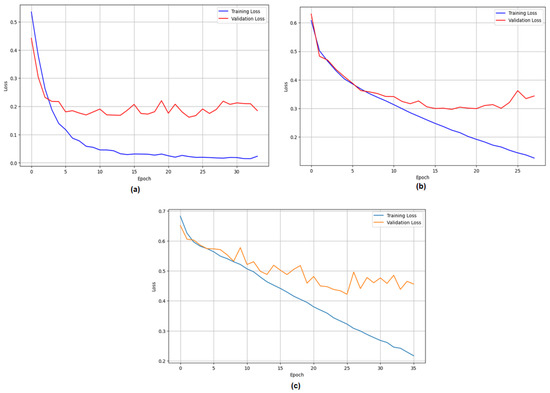
Figure 11.
Accuracy loss of DL with RFE-PCA, (a) CNN, (b) LSTM-Transformer, (c) CNN-LSTM.
4.3.2. Classification Results Based on the LASSO
The results demonstrated strong performance across both shallow learning and deep neural network models using the EEG biomarkers selected by LASSO regularization. Table 10 shows the results of the ML algorithms with the LASSO method. Among ensemble tree-based methods, RF, LightGBM, and Extra Trees attained testing accuracy exceeding 92%, while CatBoost showed robust generalization capabilities with 95.13 accuracy.
Table 10.
Results of Ml algorithms with LASSO method.
As shown in the aforementioned evaluation, a collection of performance measures may be used on the confusion matrix of a classification issue in order to evaluate machine learning (ML) and deep learning (DL) algorithms, or to make comparisons between the performances of various algorithms. The confusion matrices of machine learning models for identifying ADHD are shown in Figure 12 and Figure 13, respectively. In the matrix, the columns correspond to the anticipated class instances, while the rows correspond to the actual class occurrences. It is noted that the KNN method has achieved high accuracy.
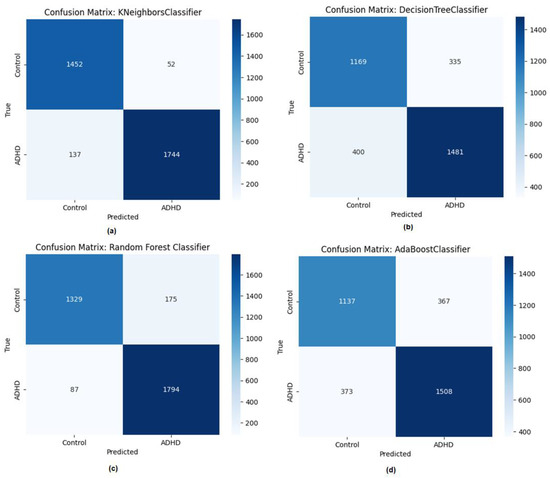
Figure 12.
Confusion matrix of machine leaning models with LASSO, (a) KNN, (b) decision tree, (c) RF, (d) AdaBoost.
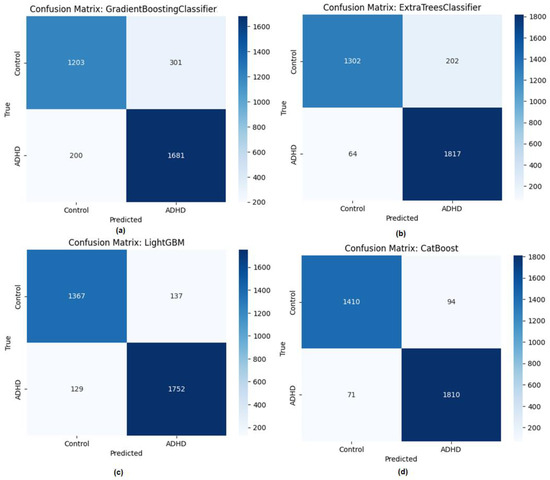
Figure 13.
Confusion matrix of machine leaning models with LASSO, (a) Gradient Boosting, (b) Extra Trees, (c) LightGBM, (d) CatBoost.
Table 11 shows the results of the DL model using LASSO method for detecting ADHD. The CNN models achieved the best evaluations, with over 97.75% testing accuracy, 100% AUC, 98.46% sensitivity, and 96.88% specificity. This highlights the exceptional ability of deep networks to extract discriminative features from LASSO-selected biomarkers for accurate ADHD identification.
Table 11.
Results of DL algorithms with LASSO method.
Comparing these LASSO results to the prior feature set, the DL approaches demonstrated consistent performance improvements using the LASSO-derived features. This suggests that the LASSO biomarkers provided more useful information for classification. Figure 14 shows the confusion matrix of DL learning models.
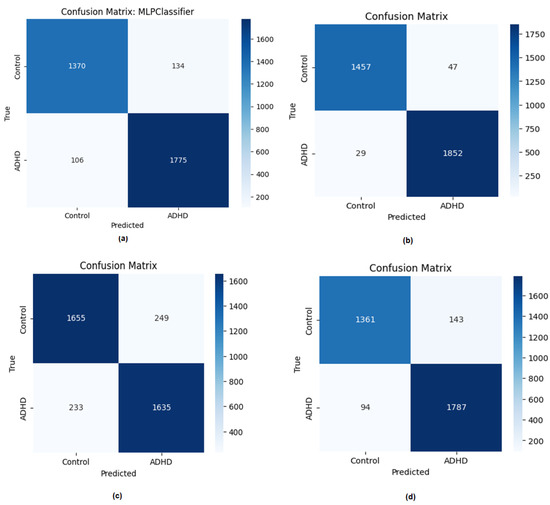
Figure 14.
Confusion matrix of machine leaning models with LASSO, (a) MLP, (b) CNN, (c) LSTM-Transformer, (d) CNN-LSTM LSTM.
Figure 15 provides a visual representation of the accuracy of the deep learning models. The percentage representing the accuracy of the CNN model is shown on the Y-axis, while the X-axis represents the epochs. During the process of validation, the CNN model demonstrated a notable improvement in efficiency, with an increase from an initial accuracy rate of 75% to a much higher rate of 97.75% during the subsequent testing phase. The LSTM-transform and CNN-LSTM models achieved a near 93% accuracy after 25 epochs.
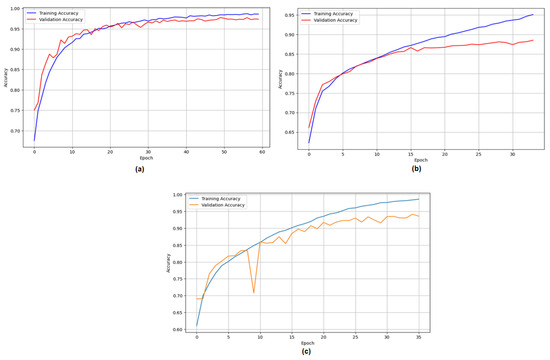
Figure 15.
Performance of DL with LASSO method, (a) CNN, (b) LSTM-Transformer, (c) CNN-LSTM.
We have used a categorical cross-entropy function for the purpose of evaluating the loss in accuracy of the deep learning models. Figure 16 illustrates the accuracy and loss metrics of deep learning models. During the experimental period consisting of 25 epochs, the validation losses showed a significant reduction, decreasing from an initial value of 0.5 to a final value of 0.1 using the CNN model. The validation loss of the LSTM-Transformer and CNN-LSTM models started at 0.7 and reached 0.3. It was observed that the CNN was showing less loss during the validation phase.
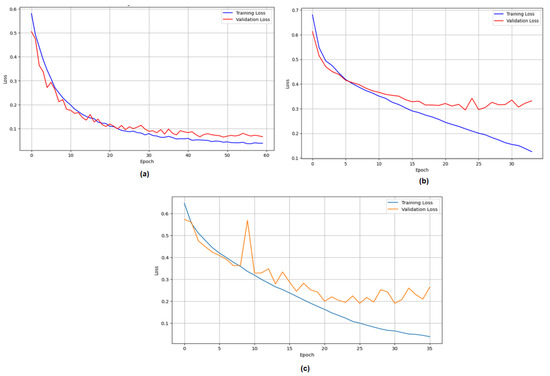
Figure 16.
Accuracy loss of DL with LASSO, (a) CNN, (b) LSTM-Transformer, (c) CNN-LSTM.
5. Discussion
ADHD is a neurodevelopmental issue that may potentially have detrimental effects on an individual’s sleep patterns, mood regulation, anxiety levels, and academic performance. Individuals diagnosed with ADHD may have enhanced facilitation in doing their routine tasks when promptly diagnosed and initiated on appropriate therapeutic interventions. ADHD may be diagnosed by neurologists via the analysis of abnormalities seen in the EEG data. EEG signals may exhibit complex, nonlinear, and nonstationary behavior. Differentiating subtle variations in EEG patterns between individuals with ADHD and those without ADHD may pose considerable difficulty.
The comparative classification results provide valuable insights into the utility of LASSO regularization versus RFE-PCA for EEG biomarker selection in ADHD detection models. The deep neural networks, including CNN architecture, demonstrated notable performance improvements on all metrics using the LASSO-derived feature set compared to the RFE-PCA. These consistent gains suggest that the LASSO biomarkers offered more useful information for DL-based ADHD classification, likely due to the selection of a sparse and diagnostically relevant feature subset. These comparative findings highlight the importance of tailored feature selection to match informative biomarkers with optimal model classes. Figure 17 displays the receiver operating characteristic (ROC) percentages for the most effective machine learning algorithms when using the recursive feature elimination-principal component analysis (RFE-PCA) and least absolute shrinkage and selection operator (LASSO) approaches. It is worth mentioning that the K-nearest neighbors (KNN) algorithm with RFE-PCA achieved a ROC of 98%, while the ROC of KNN with LASSO reached 99%.
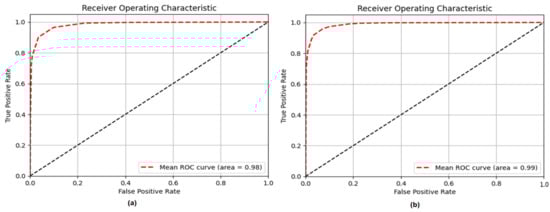
Figure 17.
ROC of KNN approach, (a) KNN with RFE-PCA, (b) KNN with LASSO methods.
Figure 18 illustrates the ROC of deep learning models using RFE PCA. The results indicate that the CNN model with RFE-PCA achieved a score of 99%, while the CNN-LSTM model achieved a score of 95%. Ultimately, the study examined the comparative effectiveness of the RFE-PCA approach in conjunction with CNN for the detection and diagnosis of ADHD in children.
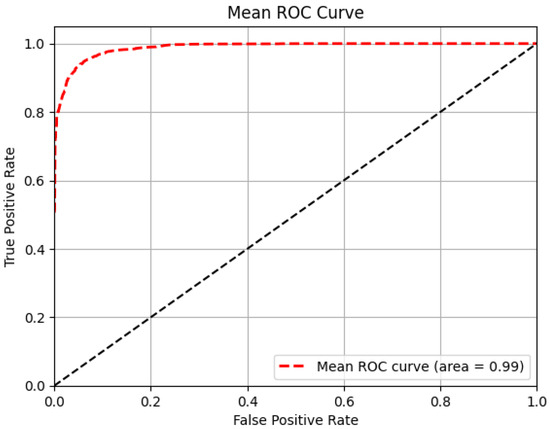
Figure 18.
ROC of CNN model with RFE-PCA method.
The ROC results of deep learning with the LASSO method are shown in Figure 19. The CNN model with RFE-PCA scored 100%, and the CNN-LSTM model scored 95%. The research compared RFE-PCA and CNN for ADHD detection and diagnosis in youngsters.
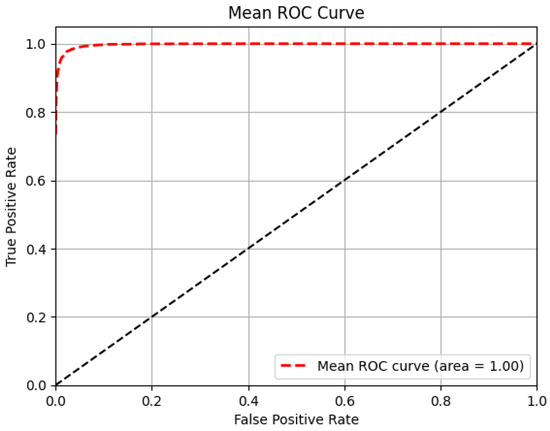
Figure 19.
ROC of CNN model with LASSO method.
Table 12 presents a comparison of the outcomes obtained from the ML and DL models in relation to several pre-existing systems. Benchmarking against prior EEG studies further validates the efficacy of the proposed pipeline. Alim et al. [79] achieved 93.2% accuracy using an analysis of variance and PCA features with a Gaussian SVM model. Ekhlasi et al. [80] obtained 91.2% accuracy with graph neural networks on theta and delta bands. By comparison, our CNN model attained 97.75% testing accuracy using LASSO-regularized biomarkers, showcasing the strengths of DL and tailored feature selection for unlocking discriminative information from complex neurophysiological data.
Table 12.
Comparison results of proposed ML and DL with existing models.
These results underscore the potential of our integrated framework, encompassing data preprocessing, class balancing, and custom feature selection techniques to extract maximally informative biomarkers from high-dimensional EEG for enhanced ADHD screening using deep networks.
The feature selection stage was critical for improving model performance by extracting key biomarkers from the extensive initial feature set. This process provided two main benefits—preventing overfitting and reducing complexity. By eliminating redundant, irrelevant, and noisy features, the models could focus on salient EEG variables that robustly distinguished ADHD from control patterns. Removing these uninformative features enabled better generalization and testing accuracy by retaining only meaningful biomarkers. Additionally, feature selection substantially decreased the dimensionality of the input space, lessening computational demands and training times. Simpler models with fewer features are also more interpretable, concentrating on core explanatory EEG markers.
In this work, RFE-PCA and LASSO regularization effectively refined the EEG features. The considerable performance gains after feature selection demonstrated the utility of these techniques for identifying concise yet highly informative feature subsets, enabling enhanced ADHD detection.
The comparative results also provided insights into matching feature selection approaches with machine learning algorithms. The deep networks showed notable improvements using LASSO-selected features versus RFE-PCA. Their consistent gains suggest the LASSO biomarkers offered more useful information for DL-based classification, likely due to identifying a sparse, diagnostically relevant feature subset. These findings highlight the importance of tailored feature selection to complement the strengths of different model classes. The LASSO features improved CNN 97%, displaying the value of an optimized feature selection approach.
6. Conclusions
In the context of this research, we delineate a novel computational architecture that ingeniously integrates ML and DL paradigms for the nuanced differentiation of ADHD profiles and normative developmental patterns in children, as discerned through meticulous EEG data analysis. This comprehensive infrastructure embraces a series of sophisticated processes, including data preprocessing, astute feature extraction, strategic feature selection, and advanced classification techniques.
The models conceived in this study stand as paragons of technological innovation, substantiating the transformative impact of refined ML pipelines in amplifying the precision of ADHD diagnostic mechanisms, thereby signaling a departure from traditional analytical methods. Leveraging the rich repository of the ADHD EEG dataset, our strategy unveils potent CNN, and MLP algorithms synergized with RFE-PCA for an optimized feature selection process, registering remarkable accuracy of 94.93% and 94.68. Moreover, our CatBoost and CNN models, orchestrated with Lasso methodologies, demonstrate a sterling accuracy metric, achieving 95.13 and 97.75, respectively.
These results profoundly underscore the quintessential role of feature optimization and meticulous data management in extracting clinically salient biomarkers from the complex labyrinth of EEG data arrays. Our tailored preprocessing, class equilibration, and feature selection techniques create a harmonized blend of RFE-PCA and Lasso methodologies, serving to foster a robust delineation between ADHD manifest patterns and standard neurological frameworks.
This study augments the burgeoning body of literature, emphasizing the promising synergy of EEG analytics and ML as vital adjuncts in facilitating nuanced clinical evaluations of ADHD. Our optimized models, envisioned as potent diagnostic allies, promise to confer reliable support for diagnostic trajectories, notably in delineating complex case scenarios, thus warranting further empirical validation across a broader spectrum of patient demographics. This trajectory potentially foretells the advent of earlier and more individualized intervention strategies, thereby enhancing the adaptive functioning and quality of life of individuals navigating the challenges of ADHD. In summation, our research initiative lays a seminal foundation for forthcoming translational ventures aimed at unlocking the maximal diagnostic potential of ML in tandem with neurophysiological data analytics in clinical arenas.
Author Contributions
Methodology, H.A., T.H.H.A. and Z.A.T.A.; Validation, H.A., T.H.H.A., Z.A.T.A. and A.A.A.; Formal analysis, H.A. and A.A.A.; Investigation, T.H.H.A.; Data curation, T.H.H.A.; Writing—original draft, Z.A.T.A.; Writing—review & editing, Z.A.T.A. and A.A.A.; Supervision, A.A.A. All authors have read and agreed to the published version of the manuscript.
Funding
The authors extend their appreciation to the King Salman center For Disability Research for funding this work through Research Group no KSRG-2023-097.
Data Availability Statement
https://ieee-dataport.org/open-access/eeg-data-adhd-control-children (accessed on 30 July 2023).
Conflicts of Interest
The authors declare no conflict of interest.
References
- Ekhlasi, A.; Nasrabadi, A.M.; Mohammadi, M.R. Direction of information flow between brain regions in ADHD and healthy children based on EEG by using directed phase transfer entropy. Cogn. Neurodynamics 2021, 15, 975–986. [Google Scholar] [CrossRef]
- Yen, C.; Lin, C.-L.; Chiang, M.-C. Exploring the Frontiers of Neuroimaging: A Review of Recent Advances in Understanding Brain Functioning and Disorders. Life 2023, 13, 1472. [Google Scholar] [CrossRef] [PubMed]
- Chiang, M.-C.; Yen, C.; Chen, H.-L. Does Age Matter? Using Neuroscience Approaches to Understand Consumers’ Behavior towards Purchasing the Sustainable Product Online. Sustainability 2022, 14, 11352. [Google Scholar]
- Yen, C.; Chiang, M.-C. Trust me, if you can: A study on the factors that influence consumers’ purchase intention triggered by chatbots based on brain image evidence and self-reported assessments. Behav. Inf. Technol. 2021, 40, 1177–1194. [Google Scholar] [CrossRef]
- Omejc, N.; Peskar, M.; Miladinovic, A.; Kavcic, V.; Dzeroski, S.; Marusic, U. On the Influence of Aging on Classification Performance in the Visual EEG Oddball Paradigm Using Statistical and Temporal Features. Life 2023, 13, 391. [Google Scholar] [CrossRef]
- Vilou, I.; Varka, A.; Parisis, D.; Afrantou, T.; Ioannidis, P. EEG-Neurofeedback as a Potential Therapeutic Approach for Cognitive Deficits in Patients with Dementia, Multiple Sclerosis, Stroke and Traumatic Brain Injury. Life 2023, 13, 365. [Google Scholar] [CrossRef]
- Available online: https://raisingchildren.net.au/pre-teens/development/understanding-your-pre-teen/brain-development-teens#:~:text=Adolescence%20is%20a%20time%20of,time%2C%20other%20connections%20are%20strengthened (accessed on 21 September 2023).
- Smit, D.J.; de Geus, E.J.; Boersma, M.; Boomsma, D.I.; Stam, C.J. Life-span development of brain network integration assessed with phase lag index connectivity and minimum spanning tree graphs. Brain Connect. 2016, 6, 312–325. [Google Scholar] [CrossRef]
- Smit, D.J.; Boersma, M.; Schnack, H.G.; Micheloyannis, S.; Boomsma, D.I.; Hulshoff Pol, H.E.; Stam, C.J.; de Geus, E.J. The brain matures with stronger functional connectivity and decreased randomness of its network. PLoS ONE 2012, 7, e36896. [Google Scholar] [CrossRef] [PubMed]
- Power, J.D.; Fair, D.A.; Schlaggar, B.L.; Petersen, S.E. The development of human functional brain networks. Neuron 2010, 67, 735–748. [Google Scholar] [CrossRef]
- Tang, C.; Wei, Y.; Zhao, J.; Nie, J. Different developmental pattern of brain activities in ADHD: A study of resting-state fMRI. Dev. Neurosci. 2018, 40, 246–257. [Google Scholar] [CrossRef]
- Ghaderi, A.H.; Nazari, M.A.; Shahrokhi, H.; Darooneh, A.H. Functional brain connectivity differences between different ADHD presentations: Impaired functional segregation in ADHD-combined presentation but not in ADHD-inattentive presentation. Basic. Clin. Neurosci. 2017, 8, 267. [Google Scholar] [CrossRef]
- Kamida, A.; Shimabayashi, K.; Oguri, M.; Takamori, T.; Ueda, N.; Koyanagi, Y.; Sannomiya, N.; Nagira, H.; Ikunishi, S.; Hattori, Y.; et al. EEG power spectrum analysis in children with ADHD. Yonago Acta Med. 2016, 59, 169. [Google Scholar]
- Li, W.; Zhou, T.; Zou, L.; Lu, J.; Liu, H.; Wang, S. Identification of attention deficit/hyperactivity disorder in children using multiple ERP features. Curr. Bioinform. 2018, 13, 501–507. [Google Scholar] [CrossRef]
- Alkahtani, H.; Ahmed, Z.A.T.; Aldhyani, T.H.H.; Jadhav, M.E.; Alqarni, A.A. Deep Learning Algorithms for Behavioral Analysis in Diagnosing Neurodevelopmental Disorders. Mathematics 2023, 11, 4208. [Google Scholar] [CrossRef]
- Jamali, A.A.; Ferdousi, R.; Razzaghi, S.; Li, J.; Safdari, R.; Ebrahimie, E. DrugMiner: Comparative analysis of machine learning algorithms for prediction of potential druggable proteins. Drug Discov. Today 2016, 21, 718–724. [Google Scholar] [CrossRef] [PubMed]
- Sethu, N.; Vyas, R. Overview of machine learning methods in ADHD prediction. In Advances in Bioengineering; Springer: Berlin/Heidelberg, Germany, 2020; pp. 51–71. [Google Scholar]
- Chuang, J.; Nguyen, H.; Wang, C.; Johnson, B. (Eds.) I think, therefore i am: Usability and security of authentication using brainwaves. In Proceedings of the International Conference on Financial Cryptography and Data Security, Okinawa, Japan, 1–5 April 2013; Springer: Berlin/Heidelberg, Germany, 2013. [Google Scholar]
- Sohankar, J.; Sadeghi, K.; Banerjee, A.; Gupta, S.K. (Eds.) E-bias: A pervasive eeg-based identification and authentication system. In Proceedings of the 11th ACM Symposium on QoS and Security for Wireless and Mobile Networks, Cancun, Mexico, 2–6 November 2015; ACM: New York, NY, USA, 2015. [Google Scholar]
- Karekla, M.; Demosthenous, G.; Georgiou, C.; Konstantinou, P.; Trigiorgi, A.; Koushiou, M.; Panayiotou, G.; Gloster, A.T. Machine learning advances the classification and prediction of responding from psychophysiological reactions. J. Context. Behav. Sci. 2022, 26, 36–43. [Google Scholar] [CrossRef]
- Monge, J.; Gómez, C.; Poza, J.; Fernández, A.; Quintero, J.; Hornero, R. MEG analysis of neural dynamics in attention-deficit/hyperactivity disorder with fuzzy entropy. Med. Eng. Phys. 2015, 37, 416–423. [Google Scholar] [CrossRef]
- Moghaddari, M.; Lighvan, M.Z.; Danishvar, S. Diagnose ADHD disorder in children using convolutional neural network based on continuous mental task EEG. Comput. Methods Programs Biomed. 2020, 197, 105738. [Google Scholar] [CrossRef] [PubMed]
- Alim, A.; Imtiaz, M.H. Automatic Identification of Children with ADHD from EEG Brain Waves. Signals 2023, 4, 193–205. [Google Scholar] [CrossRef]
- Ekhlasi, A.; Nasrabadi, A.M.; Mohammadi, M. Analysis of EEG brain connectivity of children with ADHD using graph theory and directional information transfer. Biomed. Tech. 2022, 68, 133–146. [Google Scholar] [CrossRef]
- Ahmadlou, M.; Adeli, H. Wavelet-synchronization methodology: A new approach for EEG-based diagnosis of ADHD. Clin. EEG Neurosci. 2010, 41, 1–10. [Google Scholar] [CrossRef] [PubMed]
- Ahmadlou, M.; Adeli, H. Fuzzy synchronization likelihood with application to attention-deficit/hyperactivity disorder. Clin. EEG Neurosci. 2011, 42, 6–13. [Google Scholar] [CrossRef] [PubMed]
- Ahmadlou, M.; Adeli, H. Functional community analysis of brain: A new approach for EEG-based investigation of the brain pathology. Neuroimage 2011, 58, 401–408. [Google Scholar] [CrossRef] [PubMed]
- Adámek, V.; Valeš, F. Graph theoretical analysis of organization of functional brain networks in ADHD. Clin. EEG Neurosci. 2012, 43, 5–13. [Google Scholar]
- Park, C.; Rouzi, M.D.; Atique, M.M.U.; Finco, M.G.; Mishra, R.K.; Barba-Villalobos, G.; Crossman, E.; Amushie, C.; Nguyen, J.; Calarge, C.; et al. Machine Learning-Based Aggression Detection in Children with ADHD Using Sensor-Based Physical Activity Monitoring. Sensors 2023, 23, 4949. [Google Scholar] [CrossRef] [PubMed]
- Barry, R.J.; Clarke, A.R.; Mccarthy, R.; Selikowitz, M. EEG coherence in attention-deficit/hyperactivity disorder: A comparative study of two DSM-IV types. Clin. Neurophysiol. 2002, 113, 579–585. [Google Scholar] [CrossRef]
- Ghassemi, F.; Hassan Moradi, M.; Tehrani-Doost, M.; Abootalebi, V. Using non-linear features of EEG for ADHD/normal participants’ classification. Procedia-Soc. Behav. Sci. 2012, 32, 148–152. [Google Scholar] [CrossRef]
- Lazzaro, I.; Gordon, E.; Whitmont, S.; Meares, R.; Clarke, S. The modulation of late component event related potentials by pre-stimulus EEG theta activity in ADHD. Int. J. Neurosci. 2001, 107, 247–264. [Google Scholar] [CrossRef] [PubMed]
- Lazzaro, I.; Gordon, E.; Whitmont, S.; Plahn, M.; Li, W.; Clarke, S.; Dosen, A.; Meares, R. Quantified EEG activity in adolescent attention deficit hyperactivity disorder. Clin. Electroencephalogr. 1998, 29, 37–42. [Google Scholar] [CrossRef]
- Lubar, J.F. Discourse on the development of EEG diagnostics and biofeedback for attention-deficit/hyperactivity disorders. Biofeedback Self-Regul. 1991, 16, 201–205. [Google Scholar] [CrossRef]
- Mann, C.A.; Lubar, J.F.; Zimmerman, A.W.; Miller, C.A.; Muenchen, R.A. Quantitative analysis of EEG in boys with attention-deficit-hyperactivity disorder: Controlled study with clinical implications. Pediatr. Neurol. 1992, 8, 30–36. [Google Scholar] [CrossRef]
- Sohn, H.; Kim, I.; Lee, W.; Peterson, B.S.; Hong, H.; Chae, J.H.; Hong, S.; Jeong, J. Linear and non-linear EEG analysis of adolescents with attentiondeficit/ hyperactivity disorder during a cognitive task. Clin. Neurophysiol. Off. J. Int. Fed. Clin. Neurophysiol. 2010, 121, 1863–1870. [Google Scholar] [CrossRef]
- Wartwood, J.N.; Swartwood, M.O.; Lubar, J.F.; Timmermann, D.L. EEG differences in ADHD-combined type during baseline and cognitive tasks. Pediatr. Neurol. 2003, 28, 199–204. [Google Scholar] [CrossRef]
- Tcheslavski, G.V.; Beex, A.A. Phase synchrony and coherence analyses of EEG as tools to discriminate between children with and without attention deficit disorder. Biomed. Signal Process. Control. 2006, 1, 151–161. [Google Scholar] [CrossRef]
- Stam, C.J. Nonlinear dynamical analysis of EEG and MEG: Review of an emerging field. Clin. Neurophysiol. 2005, 116, 2266–2301. [Google Scholar] [CrossRef] [PubMed]
- Dutta, S.; Ghosh, D.; Samanta, S.; Dey, S. Multifractal parameters as an indication of different physiological and pathological states of the human brain. Phys. A Stat. Mech. Its Appl. 2014, 396, 155–163. [Google Scholar] [CrossRef]
- Zorick, T.; Mandelkern, M.A. Multifractal Detrended Fluctuation Analysis of Human EEG: Preliminary Investigation and Comparison with the Wavelet Transform Modulus Maxima Technique. PLoS ONE 2013, 8, e68360. [Google Scholar] [CrossRef] [PubMed]
- Weiss, B.; Clemens, Z.; Bódizs, R.; Vágó, Z.; Halász, P. Spatiotemporal analysis of monofractal and multifractal properties of the human sleep EEG. J. Neurosci. Methods 2009, 185, 116–124. [Google Scholar] [CrossRef]
- Fetterhoff, D.; Kraft, R.A.; Sandler, R.A.; Ioan, O.; Sexton, C.A.; Marmarelis, V.Z.; Hampson, R.E.; Deadwyler, S.A. Distinguishing cognitive state with multifractal complexity of hippocampal interspike interval sequences. Front. Syst. Neurosci. 2015, 9, 130. [Google Scholar] [CrossRef]
- Müller, A.; Vetsch, S.; Pershin, I.; Candrian, G.; Baschera, G.-M.; Kropotov, J.D.; Kasper, J.; Rehim, H.A.; Eich, D. EEG/ERP-based biomarker/neuroalgorithms in adults with ADHD: Development, reliability, and application in clinical practice. World J. Biol. Psychiatry 2020, 21, 172–182. [Google Scholar] [CrossRef]
- Barry, R.J.; Clarke, A.R.; Johnstone, S.J. A review of electrophysiology in attention-deficit/hyperactivity disorder: I. Qualitative and quantitative electroencephalography. Clin. Neurophysiol. 2003, 114, 171–183. [Google Scholar] [CrossRef] [PubMed]
- Zhang, R.; Xu, L.; Yu, Z.; Shi, Y.; Mu, C.; Xu, M. Deep-irtarget: An automatic target detector in infrared imagery using dual-domain feature extraction and allocation. IEEE Trans. Multimed. 2021, 24, 1735–1749. [Google Scholar] [CrossRef]
- Zhang, R.; Yang, S.; Zhang, Q.; Xu, L.; He, Y.; Zhang, F. Graph-based few-shot learning with transformed feature propagation and optimal class allocation. Neurocomputing 2022, 470, 247–256. [Google Scholar] [CrossRef]
- Sato, J.R.; Hoexter, M.Q.; Fujita, A.; Rohde, L.A. Evaluation of pattern recognition and feature extraction methods in ADHD prediction. Front. Syst. Neurosci. 2012, 6, 68. [Google Scholar] [CrossRef]
- Xiao, Z.; Xu, X.; Xing, H.; Luo, S.; Dai, P.; Zhan, D. RTFN: A robust temporal feature network for time series classification. Inf. Sci. 2021, 571, 65–86. [Google Scholar] [CrossRef]
- Ahire, N.; Awale, R.N.; Wagh, A. Electroencephalogram (EEG) based prediction of attention deficit hyperactivity disorder (ADHD) using machine learning. Appl. Neuropsychol. Adult 2023. [Google Scholar] [CrossRef]
- Fawaz, H.I.; Forestier, G.; Weber, J.; Idoumghar, L.; Müller, P.-A. Deep learning for time series classification: A review. Data Min. Knowl. Discov. 2019, 33, 917–963. [Google Scholar] [CrossRef]
- Hosseini, M.-P.; Hosseini, A.; Ahi, K. A review on machine learning for EEG signal processing in bioengineering. IEEE Rev. Biomed. Eng. 2021, 14, 204–218. [Google Scholar] [CrossRef]
- Tor, H.T.; Ooi, C.P.; Lim-Ashworth, N.S.; Wei, J.K.E.; Jahmunah, V.; Oh, S.L.; Acharya, U.R.; Fung, D.S.S. Automated detection of conduct disorder and attention deficit hyperactivity disorder using decomposition and nonlinear techniques with EEG signals. Comput. Methods Programs Biomed. 2021, 200, 105941–105954. [Google Scholar] [CrossRef]
- Joy, R.C.; George, S.T.; Rajan, A.A.; Subathra, M.S.P. Detection of ADHD from EEG signals using different entropy measures and ANN. Clin. EEG Neurosci. 2022, 53, 12–23. [Google Scholar]
- Khaleghi, A.; Birgani, P.M.; Fooladi, M.F.; Mohammadi, M.R. Applicable features of electroencephalogram for ADHD diagnosis. Res. Biomed. Eng. 2020, 36, 1–11. [Google Scholar] [CrossRef]
- Altinkaynak, M.; Dolu, N.; Guven, A.; Pektas, F.; Demirci, E.; Izzetoglu, M. Diagnosis of attention deficit hyperactivity disorder with combined time and frequency features. Biocybernetics Biomed. Eng. 2020, 40, 927–937. [Google Scholar] [CrossRef]
- Maniruzzaman, M.; Shin, J.; Hasan, M.A.M.; Yasumura, A. Efficient feature selection and machine learning based ADHD detection using EEG signal. Comput. Mater. Continua 2022, 72, 5179–5195. [Google Scholar] [CrossRef]
- Shen, J.; Zhang, X.; Huang, X.; Wu, M.; Gao, J.; Lu, D.; Ding, Z.; Hu, B. An optimal channel selection for EEG-based depression detection via kernel-target alignment. IEEE J. Biomed. Health Informat. 2021, 25, 2545–2556. [Google Scholar] [CrossRef] [PubMed]
- Zhang, Y.; Wang, K.; Wei, Y.; Guo, X.; Wen, J.; Luo, Y. Minimal EEG channel selection for depression detection with connectivity features during sleep. Comput. Biol. Med. 2022, 147, 105690. [Google Scholar] [CrossRef] [PubMed]
- Available online: https://sapienlabs.org/mentalog/adhd-and-the-theta-beta-ratio/ (accessed on 22 September 2023).
- Alchalabi, A.E.; Shirmohammadi, S.; Eddin, A.N.; Elsharnouby, M. FOCUS: Detecting ADHD patients by an EEG-based serious game. IEEE Trans. Instrum. Meas. 2018, 67, 1512–1520. [Google Scholar] [CrossRef]
- Alkahtani, H.; Aldhyani, T.H.H.; Alzahrani, M.Y. Deep Learning Algorithms to Identify Autism Spectrum Disorder in Children-Based Facial Landmarks. Appl. Sci. 2023, 13, 4855. [Google Scholar] [CrossRef]
- Chow, J.C.; Ouyang, C.-S.; Chiang, C.-T.; Yang, R.-C.; Wu, R.-C.; Wu, H.-C.; Lin, L.-C. Novel method using Hjorth mobility analysis for diagnosing attention-deficit hyperactivity disorder in girls. Brain Develop. 2019, 41, 334–340. [Google Scholar] [CrossRef]
- Khoshnoud, S.; Nazari, M.A.; Shamsi, M. Functional brain dynamic analysis of ADHD and control children using nonlinear dynamical features of EEG signals. J. Integr. Neurosci. 2018, 17, 17–30. [Google Scholar] [CrossRef]
- Chen, H.; Chen, W.; Song, Y.; Sun, L.; Li, X. EEG characteristics of children with attention-deficit/hyperactivity disorder. Neuroscience 2019, 406, 444–456. [Google Scholar] [CrossRef]
- Abibullaev, B.; An, J. Decision support algorithm for diagnosis of ADHD using electroencephalograms. J. Med. Syst. 2012, 36, 2675–2688. [Google Scholar] [CrossRef]
- Xing, H.; Xiao, Z.; Zhan, D.; Luo, S.; Dai, P.; Li, K. SelfMatch: Robust semisupervised time-series classification with self-distillation. Int. J. Intell. Syst. 2022, 37, 8583–8610. [Google Scholar] [CrossRef]
- Zhang, X.; Ma, R.; Li, M.; Li, X.; Yang, Z.; Yan, R.; Chen, X. Feature enhancement based on regular sparse model for planetary gearbox fault diagnosis. IEEE Trans. Instrum. Meas. 2022, 71, 3514316. [Google Scholar] [CrossRef]
- Xiao, Z.; Zhang, H.; Tong, H.; Xu, X. An efficient temporal network with dual self-distillation for electroencephalography signal classification. In Proceedings of the IEEE International Conference on Bioinformatics and Biomedicine (BIBM), Las Vegas, NV, USA, 6–8 December 2022. [Google Scholar]
- Parashar, A.; Kalra, N.; Singh, J.; Goyal, R.K. Machine learning based framework for classification of children with ADHD and healthy controls. Intell. Autom. Soft Comput. 2021, 28, 669–682. [Google Scholar] [CrossRef]
- Chen, H.; Song, Y.; Li, X. A deep learning framework for identifying children with ADHD using an EEG-based brain network. Neurocomputing 2019, 356, 83–96. [Google Scholar] [CrossRef]
- Ekhlasi, A.; Nasrabadi, A.M.; Mohammadi, M. Classification of the children with ADHD and healthy children based on the directed phase transfer entropy of EEG signals. Front. Biomed. Technol. 2021, 8, 115–122. [Google Scholar] [CrossRef]
- Mohammadi, M.R.; Khaleghi, A.; Nasrabadi, A.M.; Rafieivand, S.; Begol, M.; Zarafshan, H. EEG classification of ADHD and normal children using non-linear features and neural network. Biomed. Eng. Lett. 2016, 6, 66–73. [Google Scholar] [CrossRef]
- Helgadóttir, H.; Gudmundsson, O.; Baldursson, G.; Magnússon, P.; Blin, N.; Brynjólfsdóttir, B.; Emilsdóttir, Á.; Gudmundsdóttir, G.B.; Lorange, M.; Newman, P.K.; et al. Electroencephalography as a clinical tool for diagnosing and monitoring attention deficit hyperactivity disorder: A cross-sectional study. BMJ Open 2015, 5, e005500. [Google Scholar] [CrossRef]
- Ghasemi, E.; Ebrahimi, M.; Ebrahimie, E. Machine learning models effectively distinguish attention-deficit/hyperactivity disorder using event-related potentials. Cogn. Neurodynamics 2022, 16, 1335–1349. [Google Scholar] [CrossRef]
- Kim, S.; Lee, H.-K.; Lee, K. Can the MMPI Predict Adult ADHD? An Approach Using Machine Learning Methods. Diagnostics 2021, 11, 976. [Google Scholar] [CrossRef]
- Slobodin, O.; Yahav, I.; Berger, I. A Machine-Based Prediction Model of ADHD Using CPT Data. Front. Hum. Neurosci. 2020, 14, 976. [Google Scholar] [CrossRef] [PubMed]
- Das, W.; Khanna, S. A Robust Machine Learning Based Framework for the Automated Detection of ADHD Using Pupillometric Biomarkers and Time Series Analysis. Sci. Rep. 2021, 11, 16370. [Google Scholar] [CrossRef] [PubMed]
- Liu, L.; Feng, X.; Li, H.; Li, S.C.; Qian, Q.; Wang, Y. Deep learning model reveals potential risk genes for ADHD, especially Ephrin receptor gene EPHA5. Brief. Bioinform. 2021, 22, bbab207. [Google Scholar] [CrossRef] [PubMed]
- Kautzky, A.; Vanicek, T.; Philippe, C.; Kranz, G.S.; Wadsak, W.; Mitterhauser, M.; Hartmann, A.; Hahn, A.; Hacker, M.; Rujescu, D.; et al. Machine learning classification of ADHD and HC by multimodal serotonergic data. Transl. Psychiatry 2020, 10, 104. [Google Scholar] [CrossRef]
- Yoo, J.H.; Kim, J.I.; Kim, B.-N.; Jeong, B. Exploring characteristic features of attention-deficit/hyperactivity disorder: Findings from multi-modal MRI and candidate genetic data. Brain Imaging Behav. 2020, 14, 2132–2147. [Google Scholar] [CrossRef]
- Koh, J.; Ooi, C.P.; Lim-Ashworth, N.S.; Vicnesh, J.; Tor, H.T.; Lih, O.S.; Tan, R.-S.; Acharya, U.; Fung, D.S.S. Automated classification of attention deficit hyperactivity disorder and conduct disorder using entropy features with ECG signals. Comput. Biol. Med. 2022, 140, 105120. [Google Scholar] [CrossRef]
- Duda, M.; Haber, N.; Daniels, J.; Wall, D.P. Crowdsourced validation of a machinelearning classification system for autism and ADHD. Transl. Psychiatry 2017, 7, e1133. [Google Scholar] [CrossRef]
- Heller, M.D.; Roots, K.; Srivastava, S.; Schumann, J.; Srivastava, J.; Hale, T.S. AMachine Learning-Based Analysis of Game Data for Attention Deficit Hyperactivity Disorder Assessment. Games Health J. 2013, 2, 291–298. [Google Scholar] [CrossRef]
- Zou, L.; Zheng, J.; Miao, C.; Mckeown, M.J.; Wang, Z.J. 3D CNN Based Automatic Diagnosis of Attention Deficit Hyperactivity Disorder Using Functional and Structural MRI. IEEE Access 2017, 5, 23626–23636. [Google Scholar] [CrossRef]
- Zhao, K.; Duka, B.; Xie, H.; Oathes, D.J.; Calhoun, V.; Zhang, Y. A dynamic graph convolutional neural network framework reveals new insights into connectome dysfunctions in ADHD. Neuroimage 2022, 246, 118774. [Google Scholar] [CrossRef]
- Colby, J.B.; Rudie, J.D.; Brown, J.A.; Douglas, P.K.; Cohen, M.S.; Shehzad, Z. Insights into multimodal imaging classification of ADHD. Front. Syst. Neurosci. 2012, 6, 59. [Google Scholar] [CrossRef] [PubMed]
- Anderson, A.; Douglas, P.K.; Kerr, W.T.; Haynes, V.S.; Yuille, A.L.; Xie, J.; Wu, Y.N.; Brown, J.A.; Cohen, M.S. Non-negative matrix factorization of multimodal MRI, fMRI and phenotypic data reveals differential changes in default mode subnetworks in ADHD. Neuroimage 2014, 102, 207–219. [Google Scholar] [CrossRef] [PubMed]
- Qureshi, M.N.I.; Min, B.; Jo, H.J.; Lee, B. Multiclass Classification for the Differential Diagnosis on the ADHD Subtypes Using Recursive Feature Elimination and Hierarchical Extreme Learning Machine: Structural MRI Study. PLoS ONE 2016, 11, e0160697. [Google Scholar] [CrossRef] [PubMed]
- Miao, B.; Zhang, L.L.; Guan, J.L.; Meng, Q.F.; Zhang, Y.L. Classification of ADHD Individuals and Neurotypicals Using Reliable RELIEF: A Resting-State Study. IEEE Access 2019, 7, 62163–62171. [Google Scholar] [CrossRef]
- Srinivasan, V.; Eswaran, C.; Sriraam, A.N. Artificial neural network based epileptic detection using time-domain and frequency-domain features. J. Med. Syst. 2005, 29, 647–660. [Google Scholar] [CrossRef]
- Iscan, Z.; Dokur, Z.; Demiralp, T. Classification of electroencephalogram signals with combined time and frequency features. Expert Syst. Appl. 2011, 38, 10499–10505. [Google Scholar] [CrossRef]
- Darst, B.F.; Malecki, K.C.; Engelman, C.D. Using recursive feature elimination in random forest to account for correlated variables in high dimensional data. BMC Genet 2018, 19, 65. [Google Scholar] [CrossRef]
- Jollife, I.T.; Cadima, J. Principal component analysis: A review and recent developments. Philos. Trans. R. Soc. A Math. Phys. Eng. Sci. 2016, 374, 20150202. [Google Scholar] [CrossRef]
- Dietterich, T.G. Ensemble methods in machine learning. In Multiple Classifier Systems; Lecture Notes in Computer Science (including subseries Lecture Notes in Artificial Intelligence and Lecture Notes in Bioinformatics), LNCS; Springer: Berlin/Heidelberg, Germany, 2000; Volume 1857, pp. 1–15. [Google Scholar] [CrossRef]
- Peterson, L.E. K-nearest neighbor. Scholarpedia 2009, 4, 1883. [Google Scholar] [CrossRef]
- O’Shea, K.; Nash, R. An introduction to convolutional neural networks. arXiv 2015, arXiv:1511.08458. [Google Scholar]
- Hochreiter, K.S.; Schmidhuber, J. Long short-term memory. Neural Comput. 1997, 9, 1735–1780. [Google Scholar] [CrossRef] [PubMed]
- Shaw, P.; Uszkoreit, J.; Vaswani, A. Self-Attention with Relative Position Representations. In Proceedings of the 2018 Conference of the North American Chapter of the Association for Computational Linguistics: Human Language Technologies, NAACL-HLT, New Orleans, LA, USA, 1–6 June 2018; Volume 2, pp. 464–468. [Google Scholar] [CrossRef]
- He, K.; Zhang, X.; Ren, S.; Sun, J. Identity mappings in deep residual networks. In Computer Vision—ECCV 2016 Lecture; Notes in Computer Science (including subseries Lecture Notes in Artificial Intelligence and Lecture Notes in Bioinformatics), LNCS; Springer: Berlin/Heidelberg, Germany, 2016; Volume 9908, pp. 630–645. [Google Scholar]
- Kingma, D.P.; Ba, J.L. Adam: A Method for Stochastic Optimization. In Proceedings of the 3rd International Conference on Learning Representations, ICLR 2015—Conference Track Proceedings, San Diego, CA, USA, 7–9 May 2015; December 2014. Available online: https://arxiv.org/abs/1412.6980v9 (accessed on 19 September 2023).
Disclaimer/Publisher’s Note: The statements, opinions and data contained in all publications are solely those of the individual author(s) and contributor(s) and not of MDPI and/or the editor(s). MDPI and/or the editor(s) disclaim responsibility for any injury to people or property resulting from any ideas, methods, instructions or products referred to in the content. |
© 2023 by the authors. Licensee MDPI, Basel, Switzerland. This article is an open access article distributed under the terms and conditions of the Creative Commons Attribution (CC BY) license (https://creativecommons.org/licenses/by/4.0/).