Abstract
In an unstable economic climate, all market participants want to know is when is the timing to overcome a recession, and what measures and means to use for economic recovery. In this regard, the process through which the Eurozone economy has gained momentum since the summer of 2022 has been a volatile one. This was reflected in a sharp rise in the price level, followed by a sharp rise in the ECB interest rates. The purpose of this paper is to provide short-term forecasts of the main parameters of monetary and fiscal policy by the euro area monetary authorities, based on a model developed by the authors. The distinctive feature of the presented and proposed model lies in the particularly careful selection of the parameter values based on actual statistical data. The statistics used for the proposed model cover the period from 2015 to December 2022. The simulation results show that the European Central Bank (ECB) needs to maintain a policy of high interest rates for a period of 12 to 14 months, which will help to bring inflation down to 2–3 percent in the future and move to a stage and phase of sustainable economic growth.
Keywords:
inflation; interest rate; Kagan demand function; Lucas supply equation; mathematical model; unstable economics MSC:
00A72; 91B02; 91B62
1. Introduction
Periods of economic downturns, high volatility in major commodities and assets, and rising consumer prices are of particular interest to economists, as they hide causal relationships that reveal the nature of the instability of economic processes. Over the past twenty-five years, the world has experienced several such recessions, the causes of which were of a different nature. If the Asian crisis of 1998 affected mainly the countries of Southeast Asia, then the crisis of 2008–2009 already had a global character, affecting primarily the developed economies, primarily the North American and Western European countries. The COVID-19 pandemic, due to its scale and rapid spread, practically paralyzed the entire global economy in 2020, but this shock was overcome relatively quickly. A possible economic growth recovery model for emerging economics for the period after the COVID-19 pandemic was proposed in the work by Akaev et al. [1]. The events around Ukraine that followed after February 2022 led the EU countries to the highest inflation in its history, and it is obvious that its curbing will take more than one year. In conditions of unstable development, the key questions that all market participants want answers to are the timing of overcoming such a recession and the tools that will be used to restore the economy. Although economic practices have already developed traditional and non-traditional mechanisms for resolving crisis situations, the causes of recessions themselves can be of a different nature. Some of the reasons for unstable economic processes are of a microeconomic nature, with firms and entrepreneurs accumulating bad debts or making erroneous investments in a competitive environment. Therefore, it is probably not a coincidence that the strategy of companies to accumulate debt as a means of increasing capital for business operations is increasingly attracting attention from researchers [2]. Another area of research at the enterprise and company level is predictive insolvency/bankruptcy modeling. In this case, the overall prosperity and financial stability of a firm is assessed by establishing critical and key financial ratios, as well as other characteristics of the enterprise and the economic and national environment in which it operates [3]. New technological opportunities that are not equally available to companies operating in developed and emerging markets can also be a hidden cause of crises, as in the case of the dot-com bubble and various cryptocurrencies [4], or they can offer new hope for development, as in the case of new financial technology (Fintech) [5].
In the study by Evgenidis et al. [6], the yield spread (the difference between the yield of long-term and short-term treasury securities) is proposed to be one of the effective predictors of the future state of an economy, which has proven to be particularly successful in predicting such variables as production growth and inflation, yet with the caveat that, in countries with well-developed stock markets, stock prices may be a better leading indicator of economic activity than return dispersion. A Granger causality test was applied in the studies by Molnár et al. [7,8] to determine whether stock indexes might help to predict GDP declines in the V4 countries. There are also descriptions in the literature of targeted models to test the effectiveness of different policy scenarios to address the problem of high public debt-to-GDP ratios, such as the macro-econometric model of the Greek economy [9].
This paper proposes a mathematical model that describes the process of economic dynamics under conditions of high inflation and unstable development. The authors are aware that no universal models describing such processes can be found, but the proposed model can be considered as one of the possible approaches to describe the process of unstable economic development and possible measures that can be adopted to change the economic situation.
The structure of this paper is the following: After the literature review on unstable economic development, inflation, economic crisis, and economic measures, the proposed mathematical model is presented, justified by simulations and forecasts. The results are summarized in Section 4.
2. Literature Review
With a certain degree of conditionality, publications that are devoted to the problems of unstable economic development can be divided into two large groups. The first group of publications deals with various aspects of the relationship between inflation and economic growth. Some authors have pointed to the absence of a rigidly determined relationship between growth and inflation, when economic growth is possible both with and without inflation [10]. Other authors were more categorical, stating that inflation does not contribute to economic growth [11]. Price stability as a good condition for economic growth is postulated by a third group of researchers [12]. Some researchers are convinced that even low or moderate inflation rates have a temporary negative impact on growth rates, leading to a significant and permanent reduction in per capita income: a decrease in inflation by even one percentage point leads to an increase in per capita income by 0.5–2% [13]. Empirical evidence for cases of high inflation has led some researchers to conclude that, during crises with high inflation, economic growth falls sharply, but then quickly recovers after inflation falls [14]. Cointegration models, used to estimate inflation and GDP growth in four countries (Bangladesh, India, Pakistan, and Sri Lanka), showed a long-term positive relationship between GDP growth and inflation; namely, moderate inflation fuels growth, but faster economic growth fuels inflation [15]. A vector autoregressive analysis was used by Ito and Sato [16] to study the end-to-end impact of exchange rate changes on domestic prices in East Asian countries. In particular, it is shown that inflation did not rise sharply after the Asian currency crisis of 1997–1998 in most of the crisis-affected countries, with the exception of Indonesia, where high inflation followed a very large nominal depreciation of the rupiah. Interesting empirical facts about Hong Kong’s economy deserve attention, when its economy went from a period of high inflation in the early 1990s to a stage of high deflation after the Asian financial crisis, which led to a 65% drop in residential property prices, a reduction in income, and a severe budget deficit [17]. The use of a dynamic panel threshold model to estimate inflation values for long-term economic growth based on data for 124 countries showed that, for industrialized countries, inflation should not exceed 2%, and for non-industrialized countries, an inflation rate of 17% is associated with lower economic growth rates [18]. The use of the same model for countries with tight inflation targeting showed that inflation at 4.18% is the threshold above which it negatively affects economic growth [19]. Thus, we can state that there is a consensus on the need for inflation targeting, the threshold values of which may be different for developed and developing economies.
The second group of publications is related to the problems of unstable development, rising inflation, and regulatory measures that could be useful to overcome economic downturns. Here, we should especially note the financial crisis of 2008–2009, which required significant fiscal injections, packages of non-standard financial measures from both governments and regulators, to overcome it. A detailed analysis of the measures taken and their impact on the stabilization of the economic situation was undertaken by Chen et al. [20]. These measures, which made it possible to overcome this systemic crisis, have become an integral part of the monetary policy of many central banks. The ECB, for example, actively uses such non-standard tools as a negative interest rate, direct control, asset purchase programs, and targeted long-term refinancing operations for banks [21]. Nevertheless, the problem of forecasting inflation remains one of the key issues when considering scenarios of unstable development. To improve the accuracy of estimating the monthly inflation rate, it is proposed, for example, to use Seasonal Autoregressive Integrated Moving Average (SARIMA) models, when recursive ex post forecasts are calculated for a very unstable period [22]. One of the tools for managing the processes of credit expansion and GDP reduction in an unstable economy, based on the theory of financial instability by Minsky [23], is a mathematical model for predicting a cyclical recession in the US economy, which was proposed in Akaev and Sadovnichiy [24]. This model made it possible to achieve a fairly high accuracy in forecasting US GDP growth in 2022 (forecast—2.3%, actual—2.1%). But this model failed to predict the market stress that came in March 2023 as a result of the failure of two large banks and the political impasse over the increase in the public debt limit [25]. Mathematical macrodynamic models that contribute to the theoretical analysis of financial instability and macroeconomic stabilization policies are proposed by Asada [26]. The economic interpretation of the analytical results of the modeling is compelling and insightful, which explains both the “lost twenty years” of the Japanese economy, which are characterized by a deflationary depression, and the new macroeconomic policy of Japan called “Abenomics”, initiated in 2013. New approaches to assessing the relationship between inflation, inflationary instability, and nominal uncertainty in the Bulgarian economy are proposed by Tsvetkov and Georgieva [27]. In the Russian segment of this research, we note works in which short-term mathematical models of economic dynamics are proposed in conditions of high inflation (from 10% to 30% per year) and unstable development to predict inflation rates and economic growth (recession) for Russia for the period from 2015 to 2018 [28,29]. These models did not take into account changes in the exchange rate of the national currency due to changes in commodity prices, which is typical for developing countries. For this reason, another mathematical model was developed, which refined the medium-term economic dynamics in the context of stagflation, taking into account the volatility of the ruble exchange rate due to the volatility of oil prices, and was used to forecast the economic development of Russia for the period up to 2020 [30]. The events of the past year, when inflation soared in the Eurozone, have stimulated research that can explain the causal relationships of this phenomenon. As noted in one of them, high inflation was the result of a combination of negative supply shocks and positive demand shocks, which were exacerbated by rising energy prices, and the war in the Ukraine, when firms passed the shock from new costs to consumers, raising prices and maintaining their margins [31]. In another study, the spike in inflation seen in the euro area since early 2021 is attributed to supply disruptions due to bottlenecks following the pandemic and the energy crisis, which, with tight monetary policy, could lead to a recession in the euro area economy [32]. The dynamics of inflation, as noted elsewhere, will depend on the dynamics of energy and food prices, which explain about two-thirds of the current surge, and the economic costs of the war in Ukraine create additional risks of stagflation in the Eurozone if the ECB does not move to a policy of tightening credit conditions [33]. As the latest decisions of the ECB show, the interest rate on the main refinancing operations, and the interest rates on the marginal lending facility and the deposit facility, were increased to 4.00%, 4.25%, and 3.50%, respectively, with effect from 21 June 2023 [34]. According to IMF staff, inflation in European countries is more sensitive to internal recession and external price pressure, especially world commodity prices, which explains the underestimation of the inflation surge in 2021–2022 on traditional inflation models [35]. Since the events that took place after February 2022 not only affected inflation rates in the Eurozone, but also introduced an element of significant turbulence into the processes of macroeconomic dynamics in the Russian economy, the authors of this paper made some changes to the previously proposed economic and mathematical models that describe the dynamics of the development rates of economy and forecast inflation rates, which was reflected in the work by Sadovnichiy et al. [36]. Despite the fact that the economies of Russia and the Eurozone are difficult to compare due to many striking differences, primarily institutional ones, the authors took the liberty of testing the proposed model on Eurozone data in order to assess its potential suitability for assessing unstable economic processes within large economic associations, which for us is the Eurozone.
3. Mathematical Model
In constructing the proposed model, the authors departed from the fact that it is necessary to separate the two variables of interest to us: economic growth (recession) and inflation rates.
To construct the model of economic growth (recession), the Lucas supply equation was used [37] (p. 296), which describes the divergence in output caused by an unexpected deviation in the price level in the absence of a supply shock. In constructing the expected inflation rates, the following points were considered [37] (pp. 514, 516):
- The main factor that increases the inflation rate is the growth in the money supply;
- The key role is played by the equilibrium state of the money market;
- The nominal interest rate is determined through the real interest rate and the expected inflation rate (Fisher identity).
The classical Kagan money demand function [38] and its modifications according to the Bruno–Fisher model, which includes GDP dynamics and emission financing of the state budget deficit [39], were also considered. The Bruno–Fisher model does not provide a simple explicit solution, which requires analysis using numerical methods. The model describes well the case of hyperinflation, but, like the Kagan model, it does not provide satisfactory results for the case of high inflation and unstable development. To overcome this shortcoming, a power function was proposed in [29] to describe the money demand function. Using this function and the main assumptions of the Kagan and Bruno–Fisher models, two economic and mathematical models were constructed and obtained in the works of Akaev et al. [28,29,30] and Sadovnichiy [36]:
- Model of the dynamics of economic growth (recession):
- Model of forecasting inflation rates:where α, ρ, and κ are constant coefficients; is the monetary base growth rate; M is the monetary base; shows the GDP growth rates; is the equilibrium potential level of the GDP growth rates in the medium term; Y is the GDP volume; d is the state budget deficit (in shares of GDP); r is the real interest rate; and π is inflation.
Let us use Formulas (1) and (2) to forecast the macroeconomic indicators of the Eurozone. The statistical basis for all calculations was the data published in the quarterly editions of the ECB Bulletin for the period from 2015 to 2022 [40]. The parameters α, ρ, κ, and will be calculated on the basis of actual quarterly statistical data for the period from 2015 to 2022.
To find the numerical values of ρ and , we use the equation obtained by Akaev et al. [28,29].
where is the expected inflation.
Since, in the retrospective zone , then, using the idea of the least squares method for real statistical data, we obtain an extreme problem for finding the desired parameters, ρ and :
In order to calculate , first, on the basis of quarterly statistics, a cubic approximation was obtained, , which has a high correlation with the actual values of inflation (the correlation coefficient is 0.93). Hence, and , where T = 1st quarter of 2015.
Figure 1 shows the quarterly dynamics of inflation in the Eurozone between March 2015 and March 2023 [40].
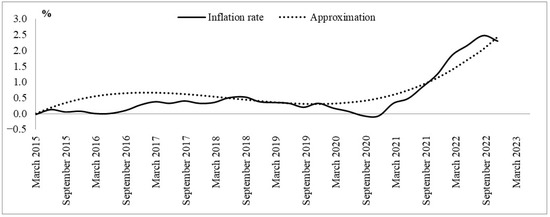
Figure 1.
Quarterly dynamics of inflation in the Eurozone between March 2015 and March 2023 (developed by authors based on [40]).
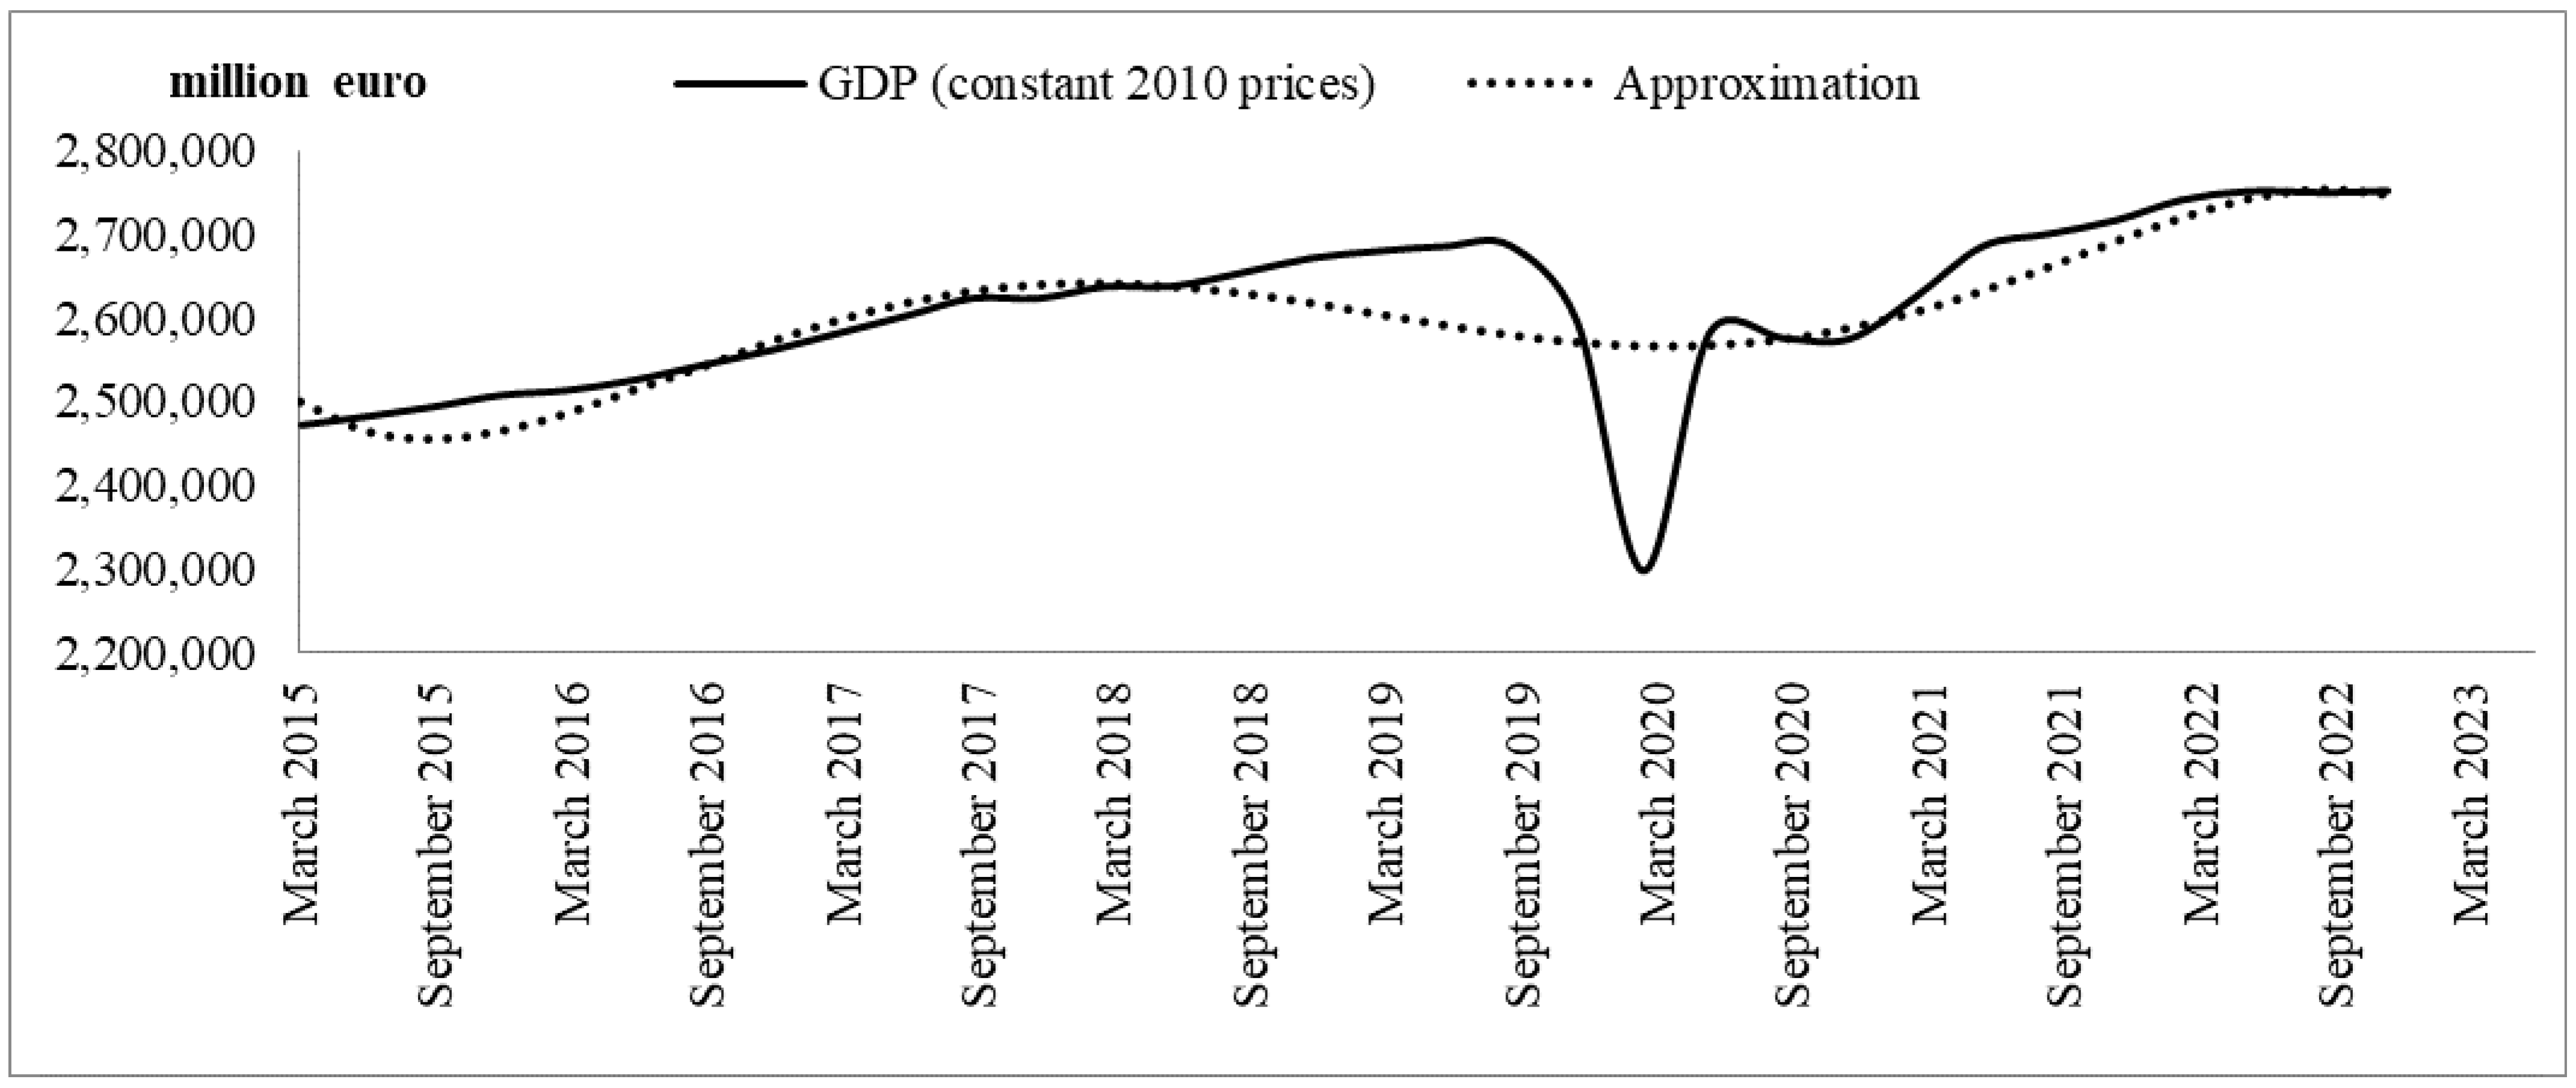
Since , based on quarterly GDP statistics, an approximating line was obtained, , which has a high correlation with actual GDP values (the correlation coefficient is 0.8). Hence, , and .
Figure 2 shows the quarterly Eurozone GDP dynamics in 2010 prices between March 2015 and March 2023 [40].
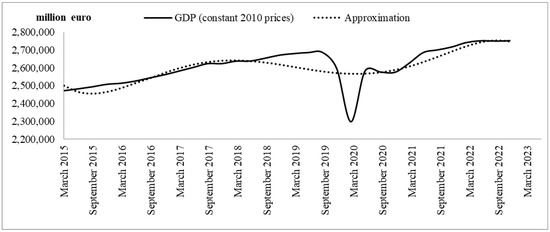
Figure 2.
Quarterly Eurozone GDP dynamics (in 2010 prices) between March 2015 and March 2023 (developed by authors based on [40]).
Having solved the extreme problem (4) based on the actual quarterly statistical data for the period from 2015 to 2022, we have
Since the equilibrium level of quarterly GDP growth rates turned out to be 0.22% (), the annual equilibrium level of the GDP growth rates is 0.89% (, and it is quite low (this is partly due to the coronavirus pandemic), which is not enough for the effective development of the European economy. It can be seen from formula (1) that, for GDP growth, it is necessary to increase the monetary base, as well as to reduce the interest rate and the state budget deficit. These measures will increase the purchasing power of the population and consumer demand, allow enterprises to actively lend, and facilitate the inflow of investments into the economy. At the same time, due to formula (2), inflation will decrease.
To find the numerical values of α and κ, we use the equation obtained by Akaev et al. [28,29].
Taking the logarithm of this equation, we obtain
Hence, as a result of differentiation, we have
Since, in the retrospective zone, and , then, using the idea of the least squares method for real statistical data, we obtain an extremal problem for finding the required parameter, α, for
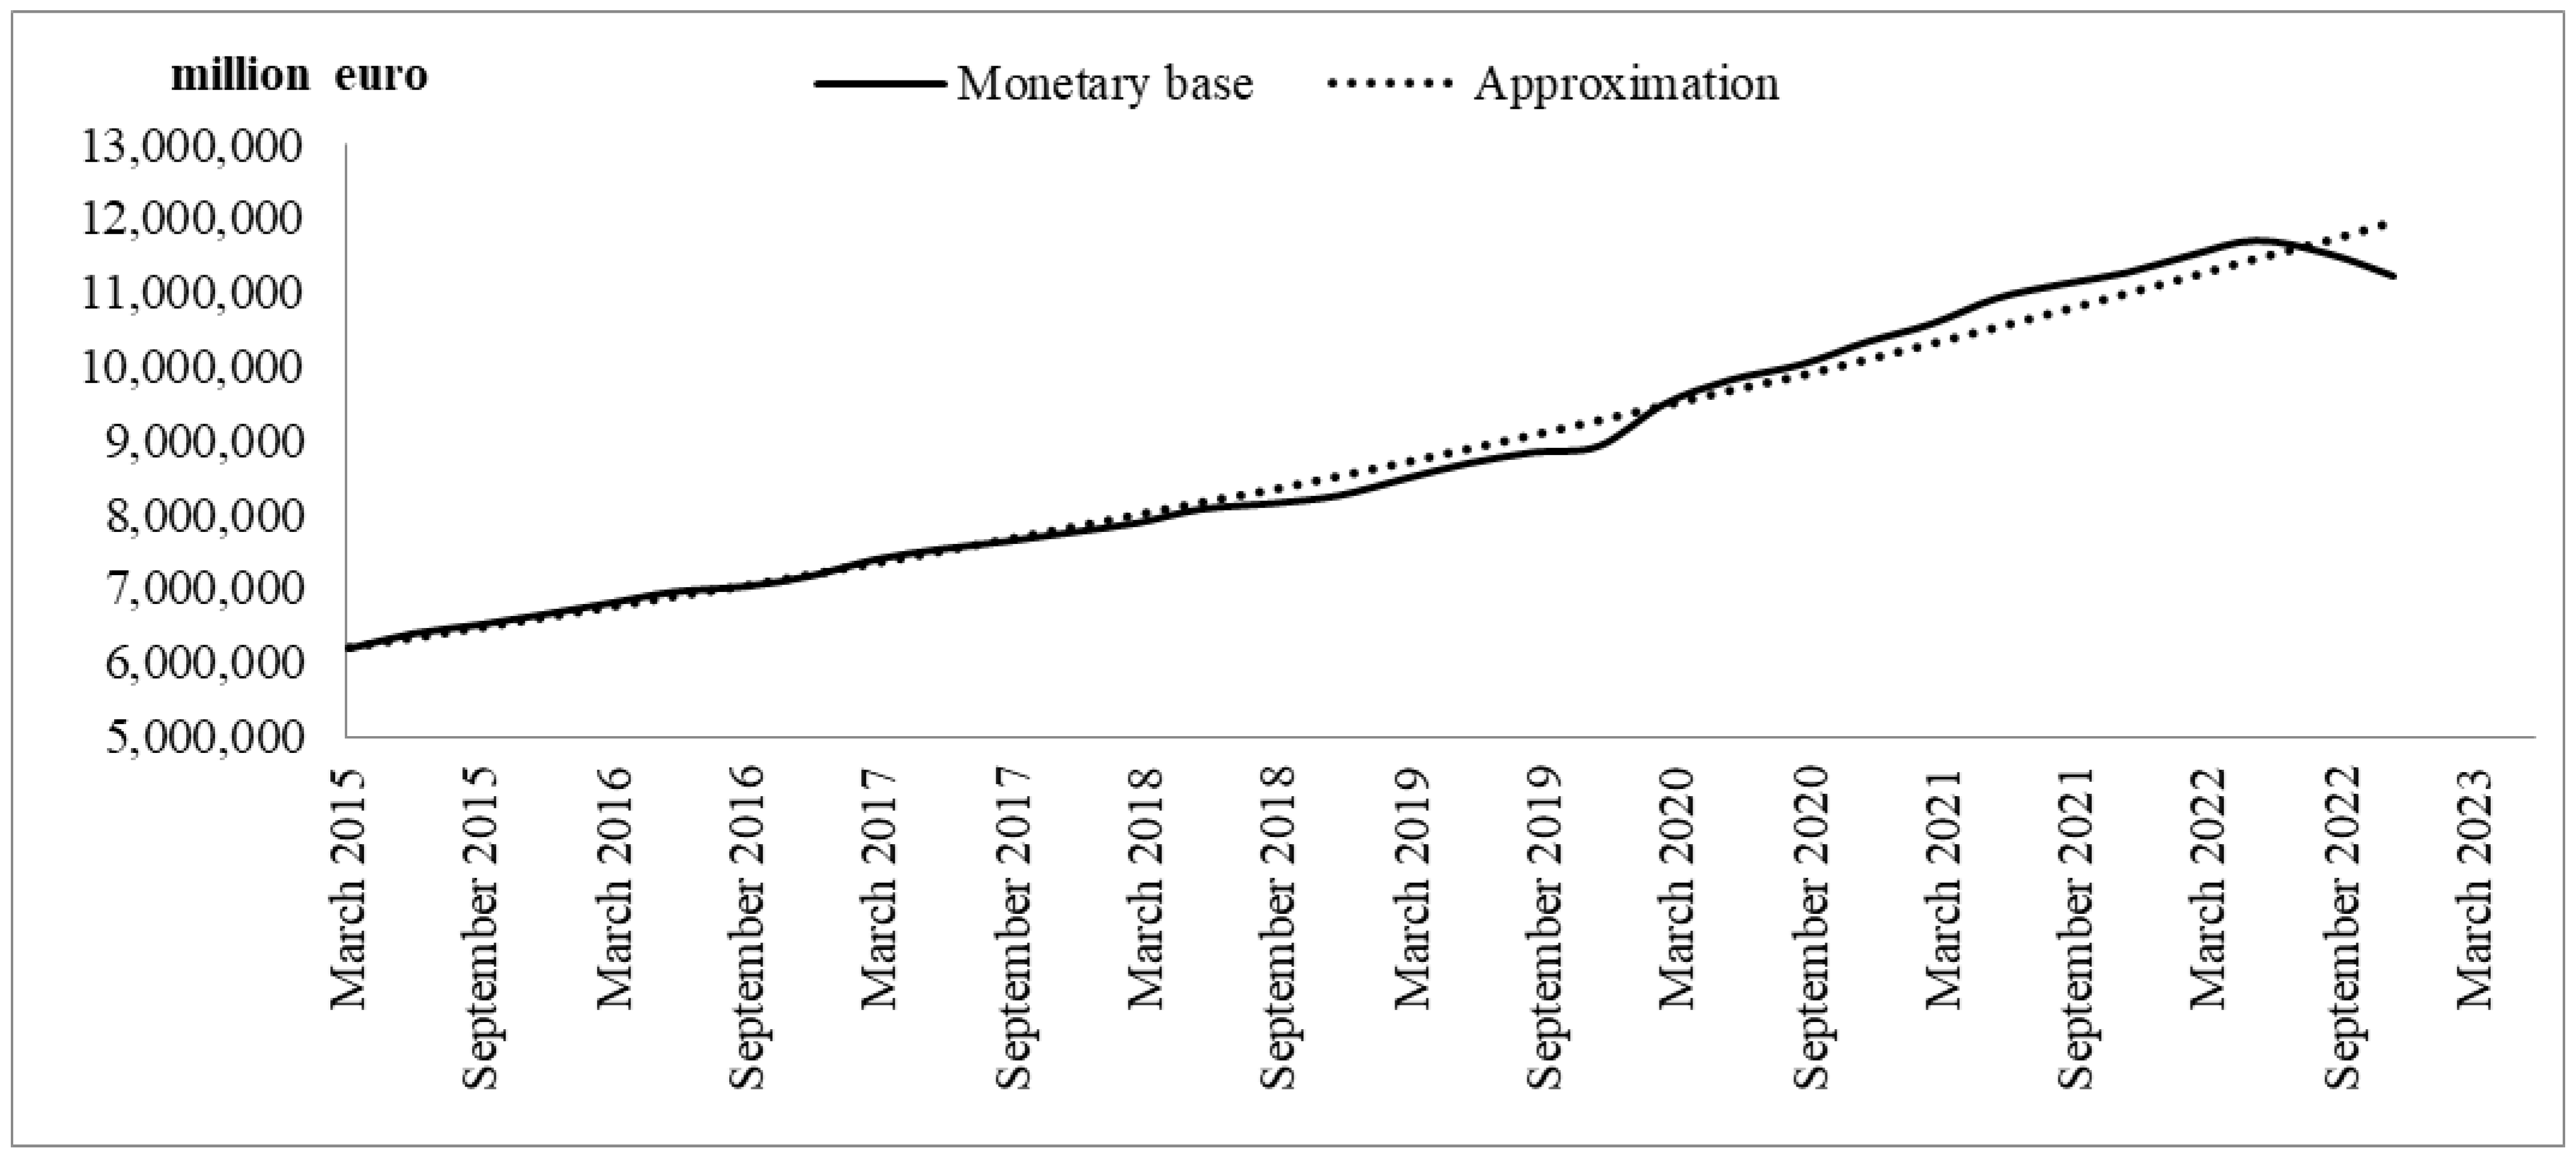
In order to describe the dynamics of the money supply, based on quarterly statistical data, we used an exponential approximation, , for which the correlation coefficient with the actual values of the money supply was 0.99. Hence, and . Then, to model the dynamics of the monetary base, we have and .
Figure 3 shows the quarterly dynamics of the monetary base in the Eurozone between March 2015 and March 2023 [40].
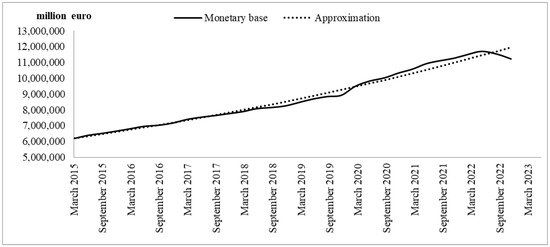
Figure 3.
Quarterly dynamics of the monetary base in the Eurozone between March 2015 and March 2023 (developed by authors based on [40]).
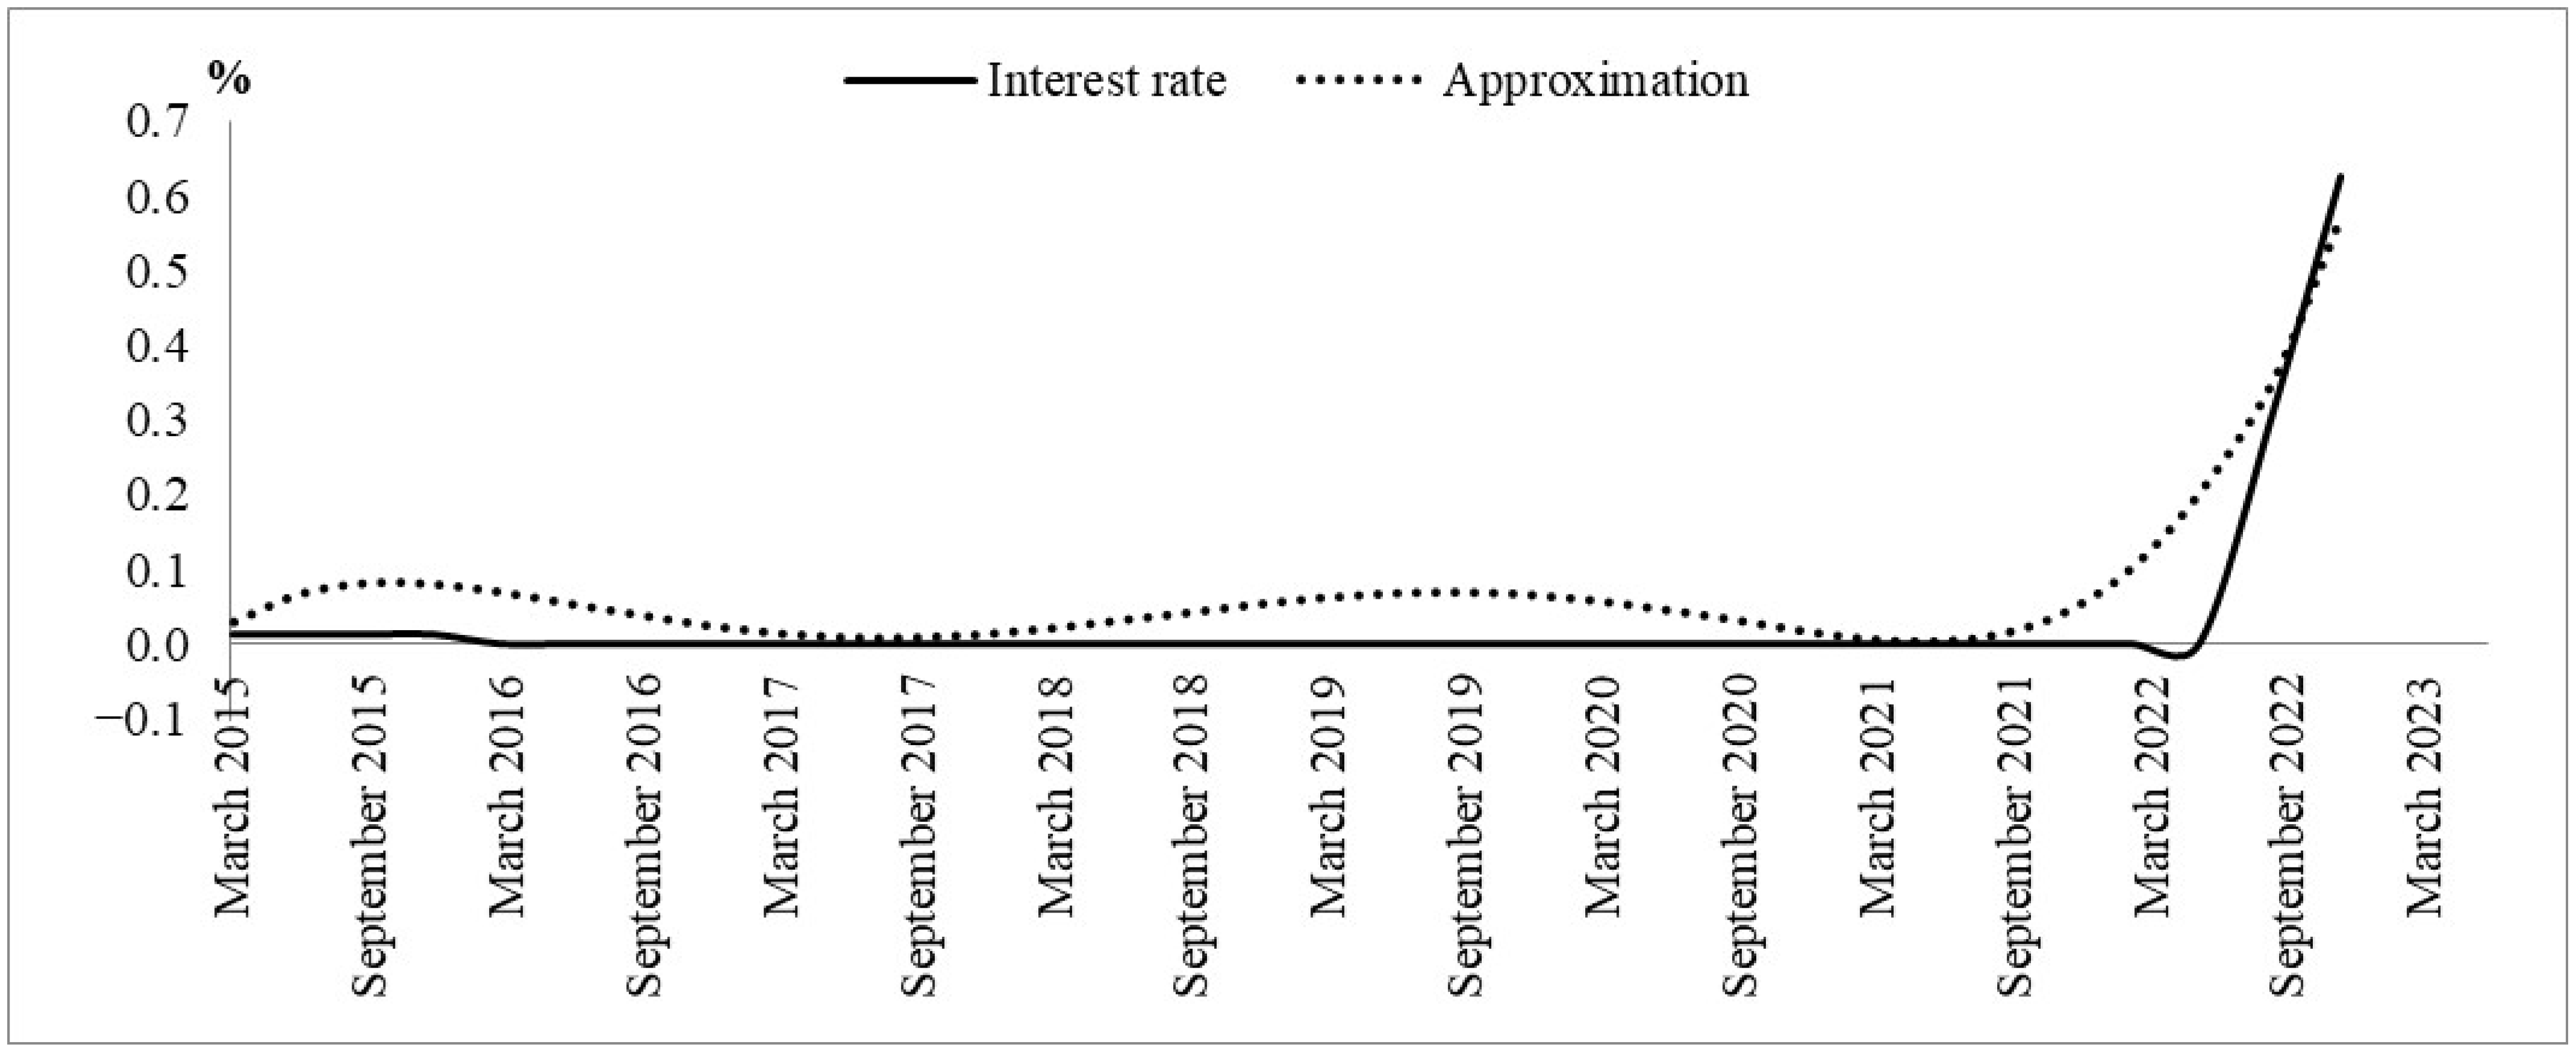
For the interest rate, based on quarterly statistical data, an approximating line was found,, for which the correlation coefficient with the actual values of the key rate was 0.94. Hence
Figure 4 shows the quarterly dynamics of the interest rate on the Eurozone between March 2015 and March 2023 [40].
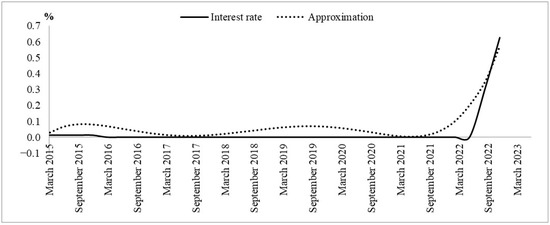
Figure 4.
Quarterly dynamics of the interest rate in the Eurozone between March 2015 and March 2023 (developed by authors based on [40]).
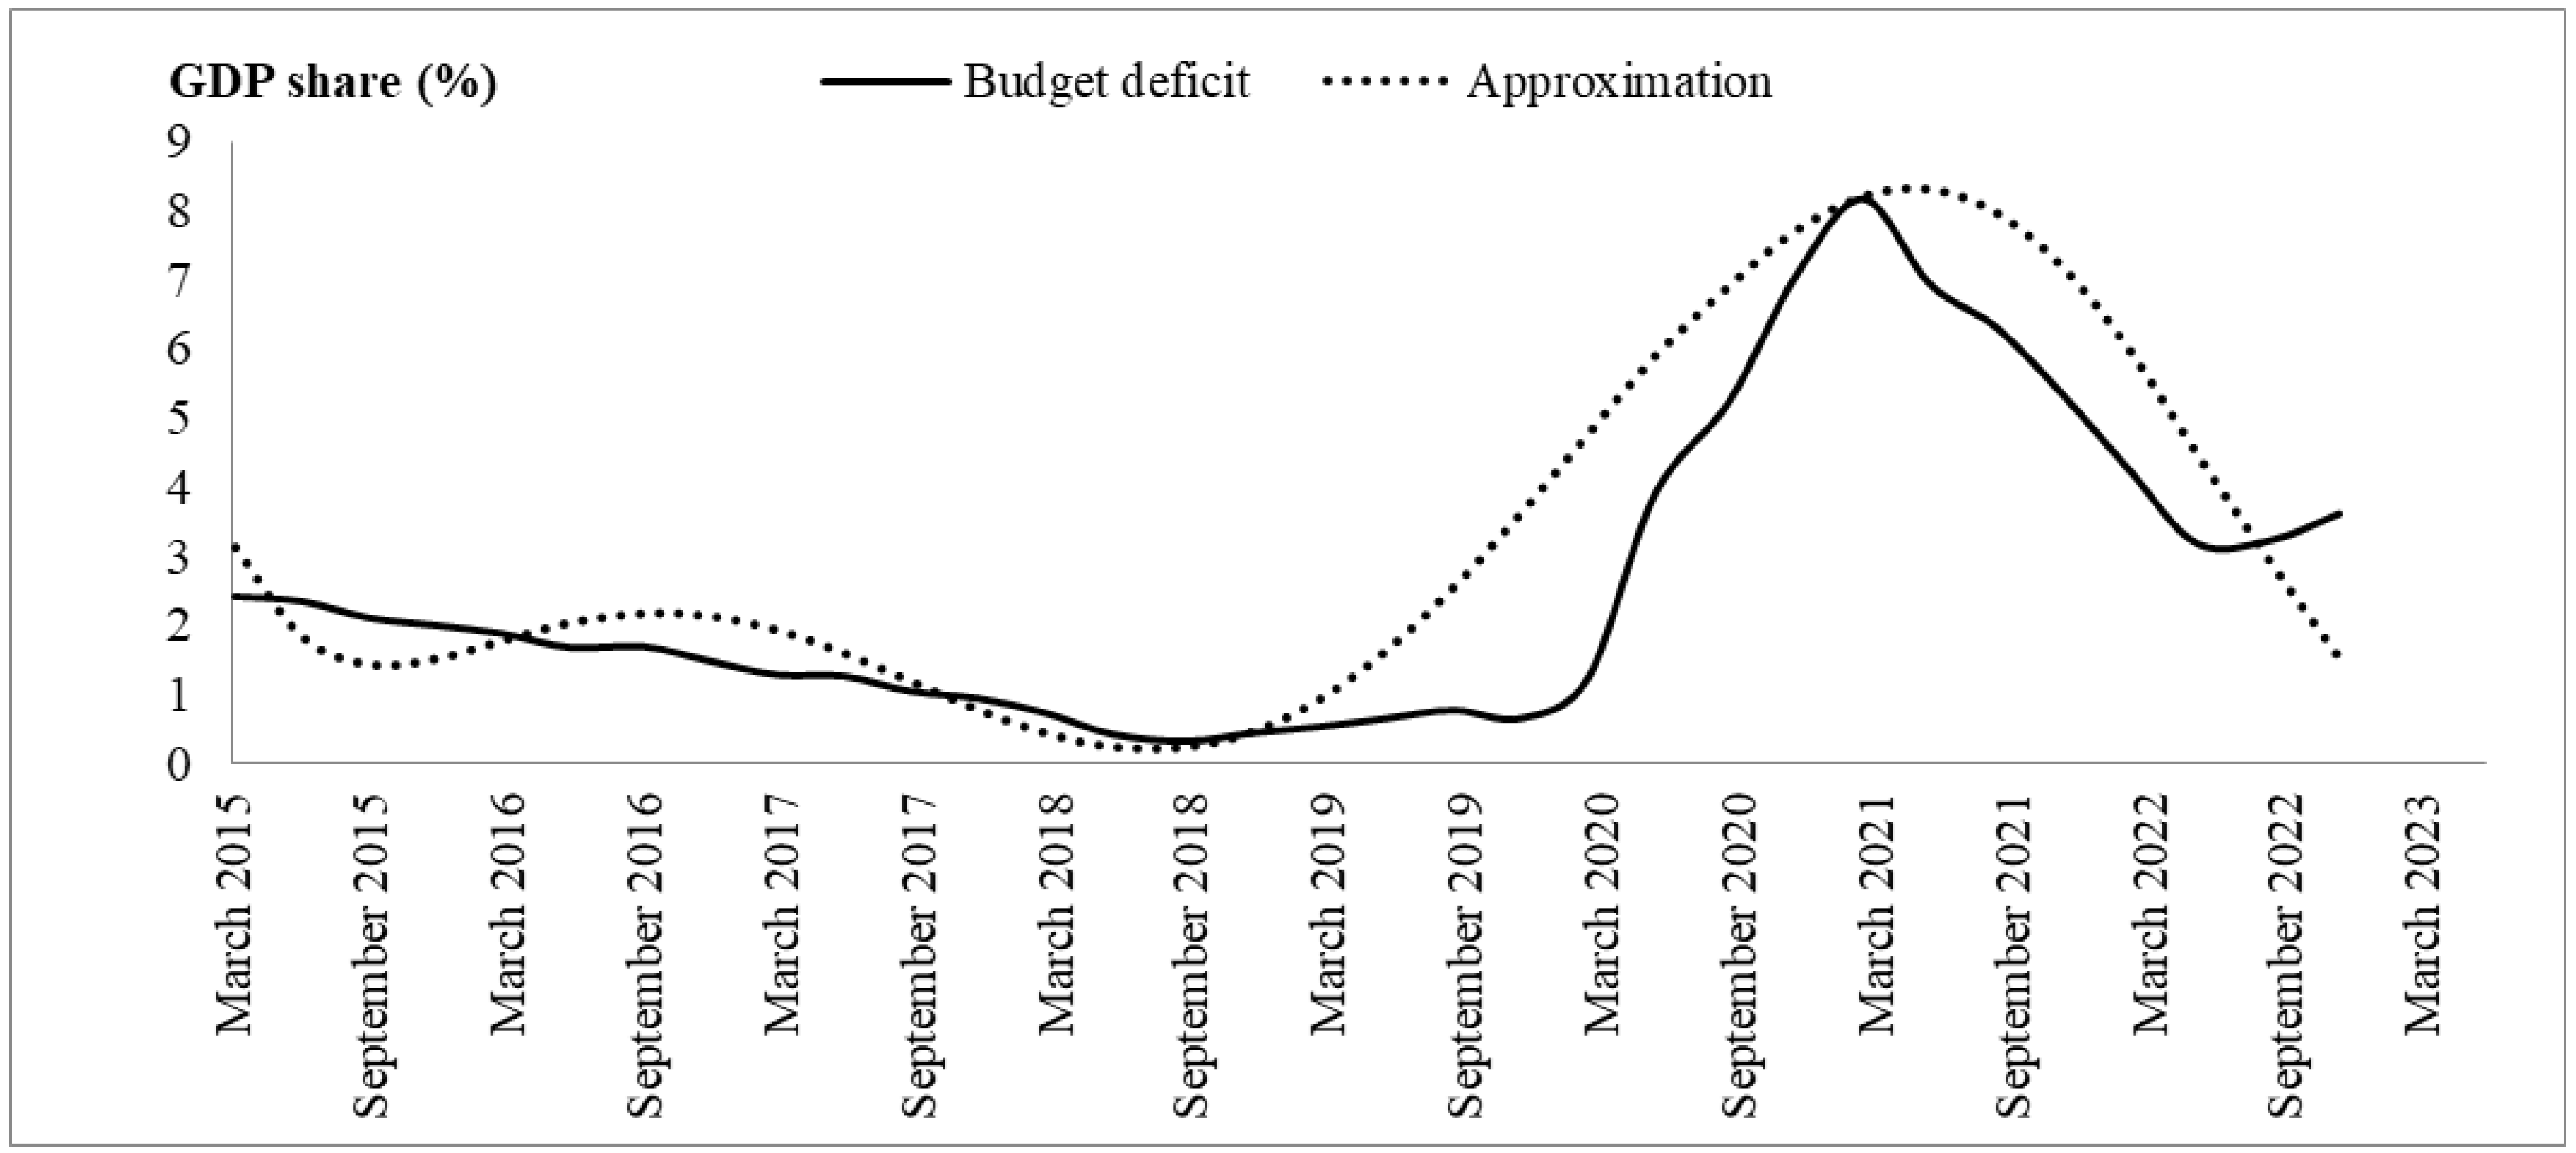
For the budget deficit of the Eurozone, based on quarterly statistical data, an approximating line was obtained, , for which the correlation coefficient with the actual values of the budget deficit was 0.9. Hence, .
Figure 5 presents the quarterly dynamics of the Eurozone budget deficit between March 2015 and March 2023 [40].
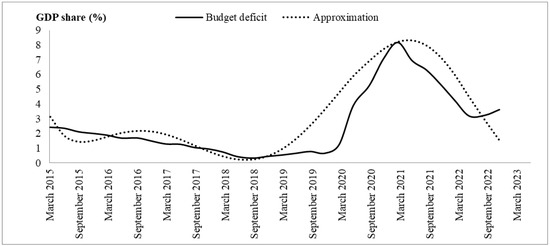
Figure 5.
Quarterly dynamics of the Eurozone budget deficit between March 2015 and March 2023 (developed by authors based on [40]).
Having solved the extreme problem (8) based on the actual statistical data for the period from 2015 to 2022, we obtain the value
α = 0.0797
According to formula (5) and using the concept of the least squares method for real statistical data, we obtain an extreme problem for finding the required parameter, k:
Solving this extreme problem based on actual statistical data from European Economic Bulletins [40] for the period from 2015 to 2022, we have the value
κ = 152.97
According to expert forecasts [41], the following macroeconomic indicators are expected in the Eurozone for 2023–2024 (Table 1):

Table 1.
Expected macroeconomics indicators in the Eurozone for 2023–2024 (Source: [41]).
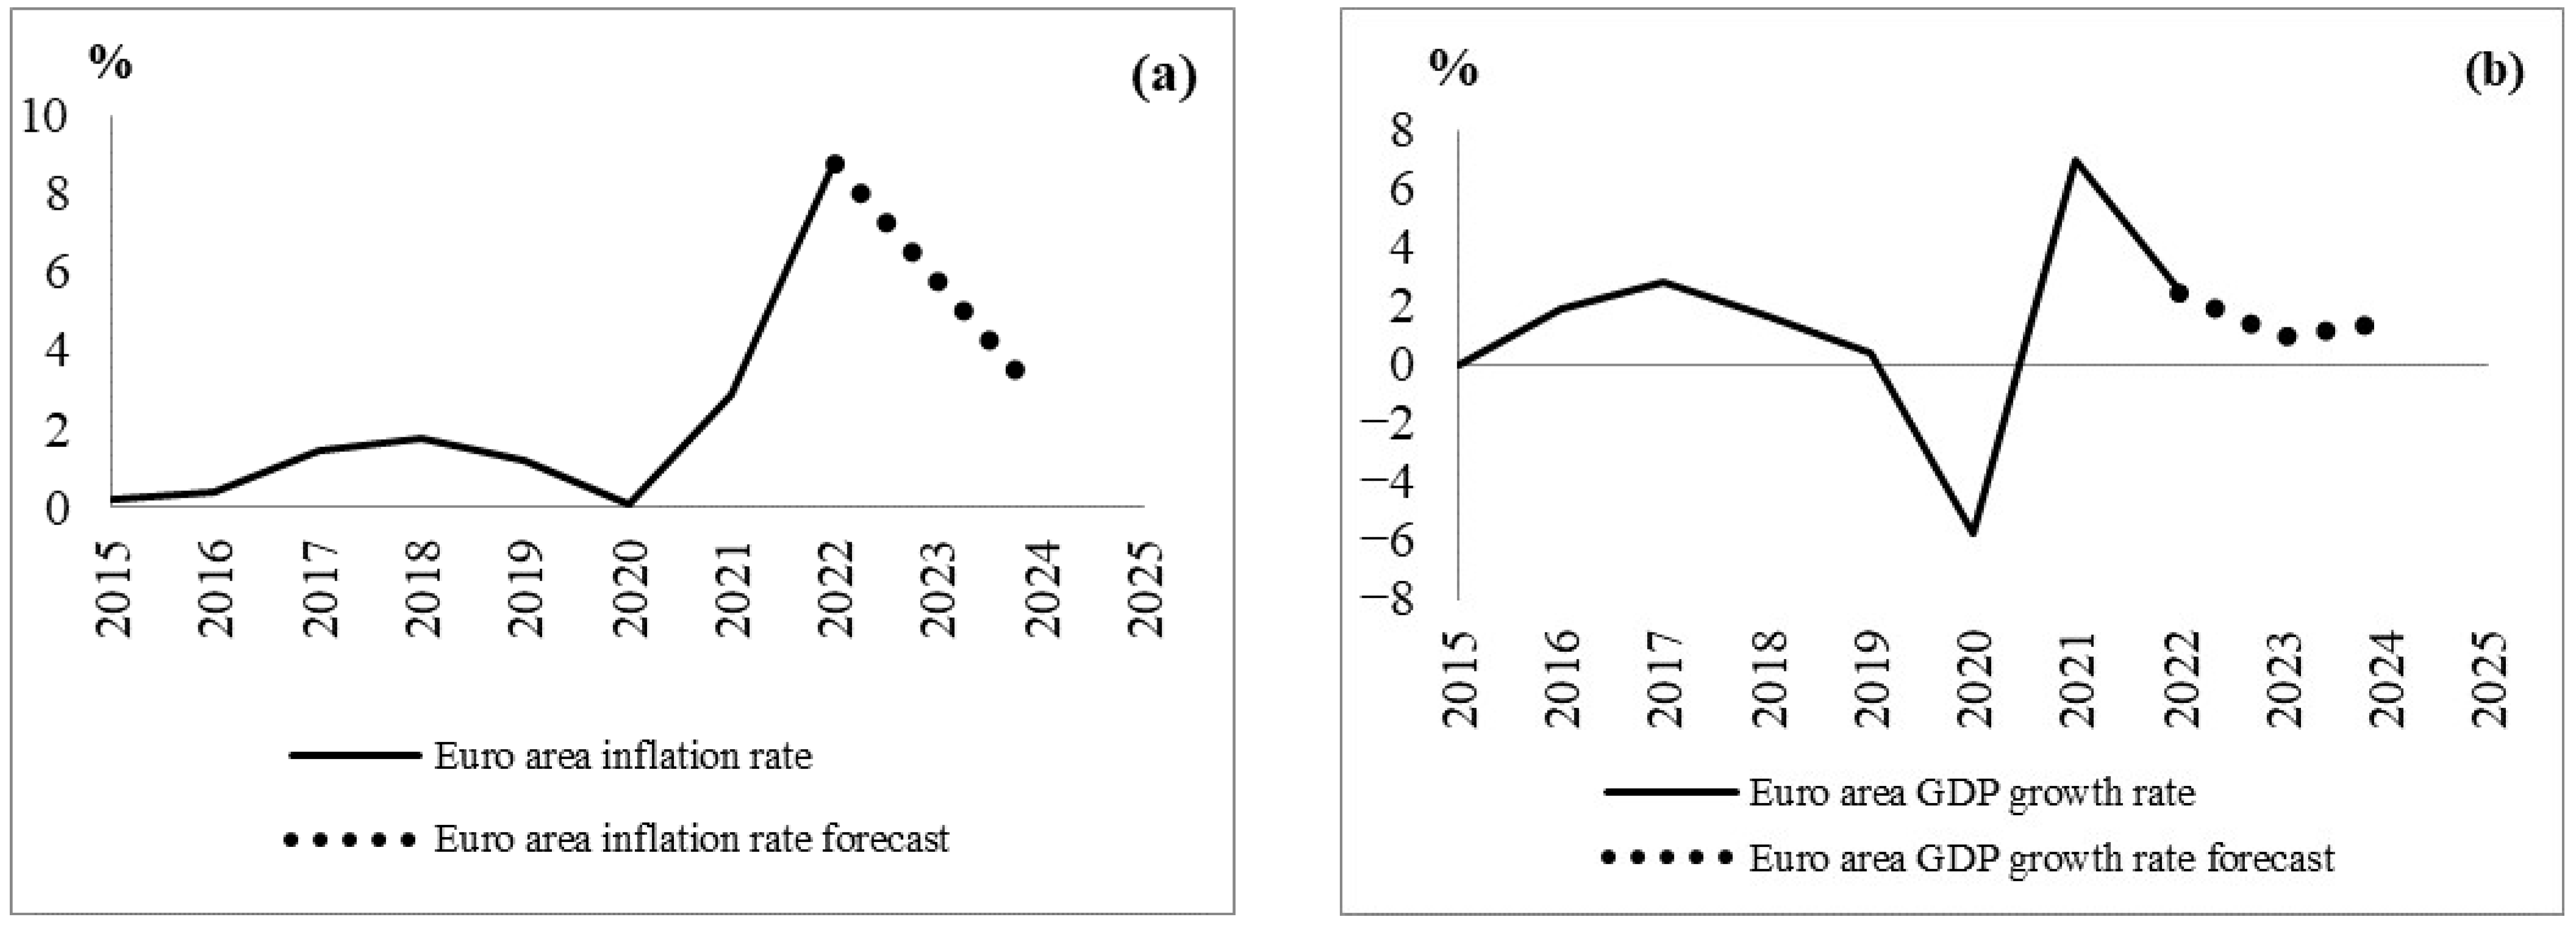
Using Formulas (1) and (2), we can simulate medium-term forecasts for inflation and GDP growth for the Eurozone (Figure 6).
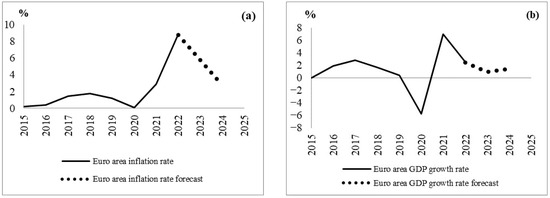
Figure 6.
Forecasts for the Eurozone on (a) inflation and (b) GDP growth. Source: [41] (developed by authors).
As can be seen from Formulas (1) and (2), the dynamics of these macroeconomic indicators depend on the monetary base, interest rate, and budget deficit. The interest rate, money supply, and budget deficit are the main tools for monetary authorities to influence economic processes. Obviously, lowering the key rate is beneficial both for industry, which needs cheap long-term loans, and for the population, which is interested in cheap mortgage and consumer loans. The growth of the monetary base makes it possible to increase the purchasing power of the population, which increases purchasing demand, enables enterprises to actively take out loans, and promotes the influx of domestic investment into the economy. Reducing the budget deficit improves financial stability and promotes economic development.
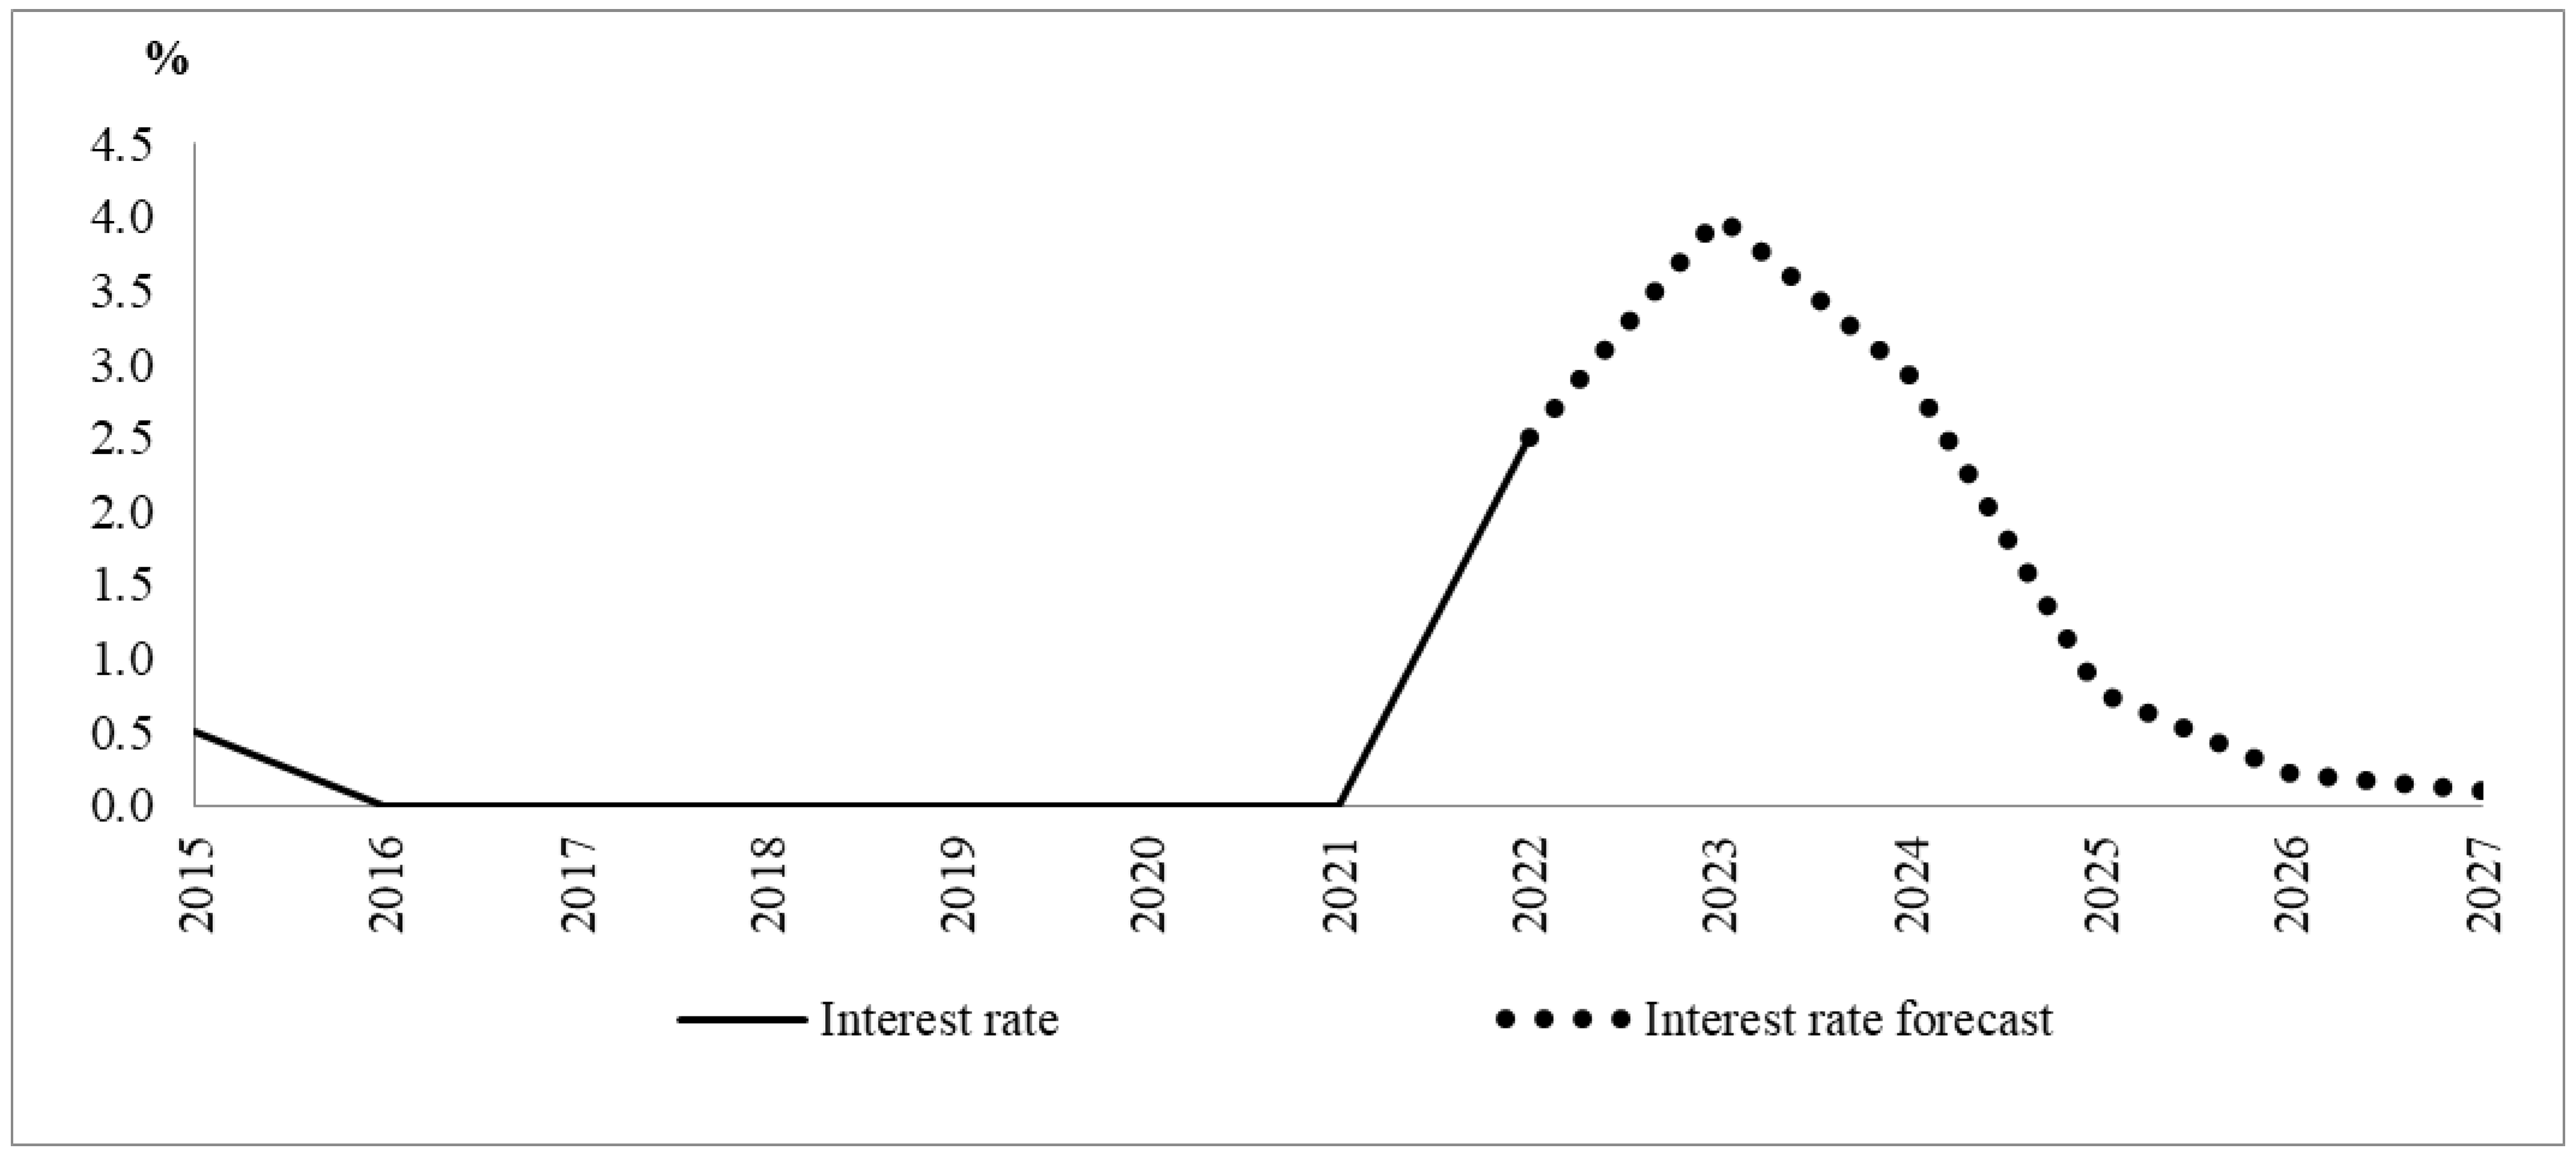
According to statistics for the period from 2015 to 2022, the average quarterly interest rate is 0.12% per annum, and in the fourth quarter of 2022, the interest rate was 2.5% per annum [40]. High inflation risks due to a significant increase in geopolitical instability are forcing the interest rate to be increased. It is reasonable to assume that, in the medium term, the monetary authorities will strive to return the interest rate to the pre-crisis level in order to normalize the economy. In this regard, let us consider a scenario of a short-term increase in the interest rate followed by its reduction to the average statistical level. This scenario is formed using the following formula:
where is the 1st quarter of 2023, is the 4th quarter of 2027. For the average annual interest rate, the actual and scenario values are presented in Figure 7.
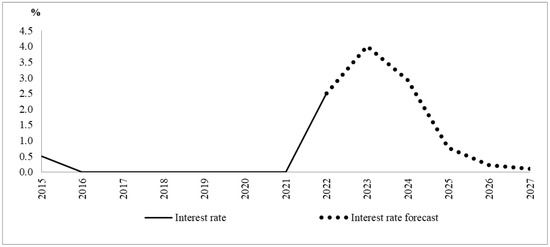
Figure 7.
Actual and simulated interest rates (developed by authors based on [41]).
Assuming an exponential law for the growth rate of the money supply, , by virtue of the formula , we obtain a scenario for the growth of the monetary base:
where a = 0.00012, b = 0.016, is the monetary base at the beginning of the 1st quarter of 2023, and where is the 1st quarter of 2023.
According to the statistics for the period from 2015 to 2022, the average quarterly budget deficit in the Eurozone was 2.59% of GDP, and in the fourth quarter of 2022, the budget deficit equaled 3.61% of GDP. This level of deficit is quite acceptable for economic development. The current geopolitical situation requires Eurozone countries to increase military, industrial, and social spending. In this regard, the budget deficit in the Eurozone most probably cannot decrease in the coming years. In this regard, choosing a scenario of a permanent deficit at the level of 3% of GDP is quite appropriate.
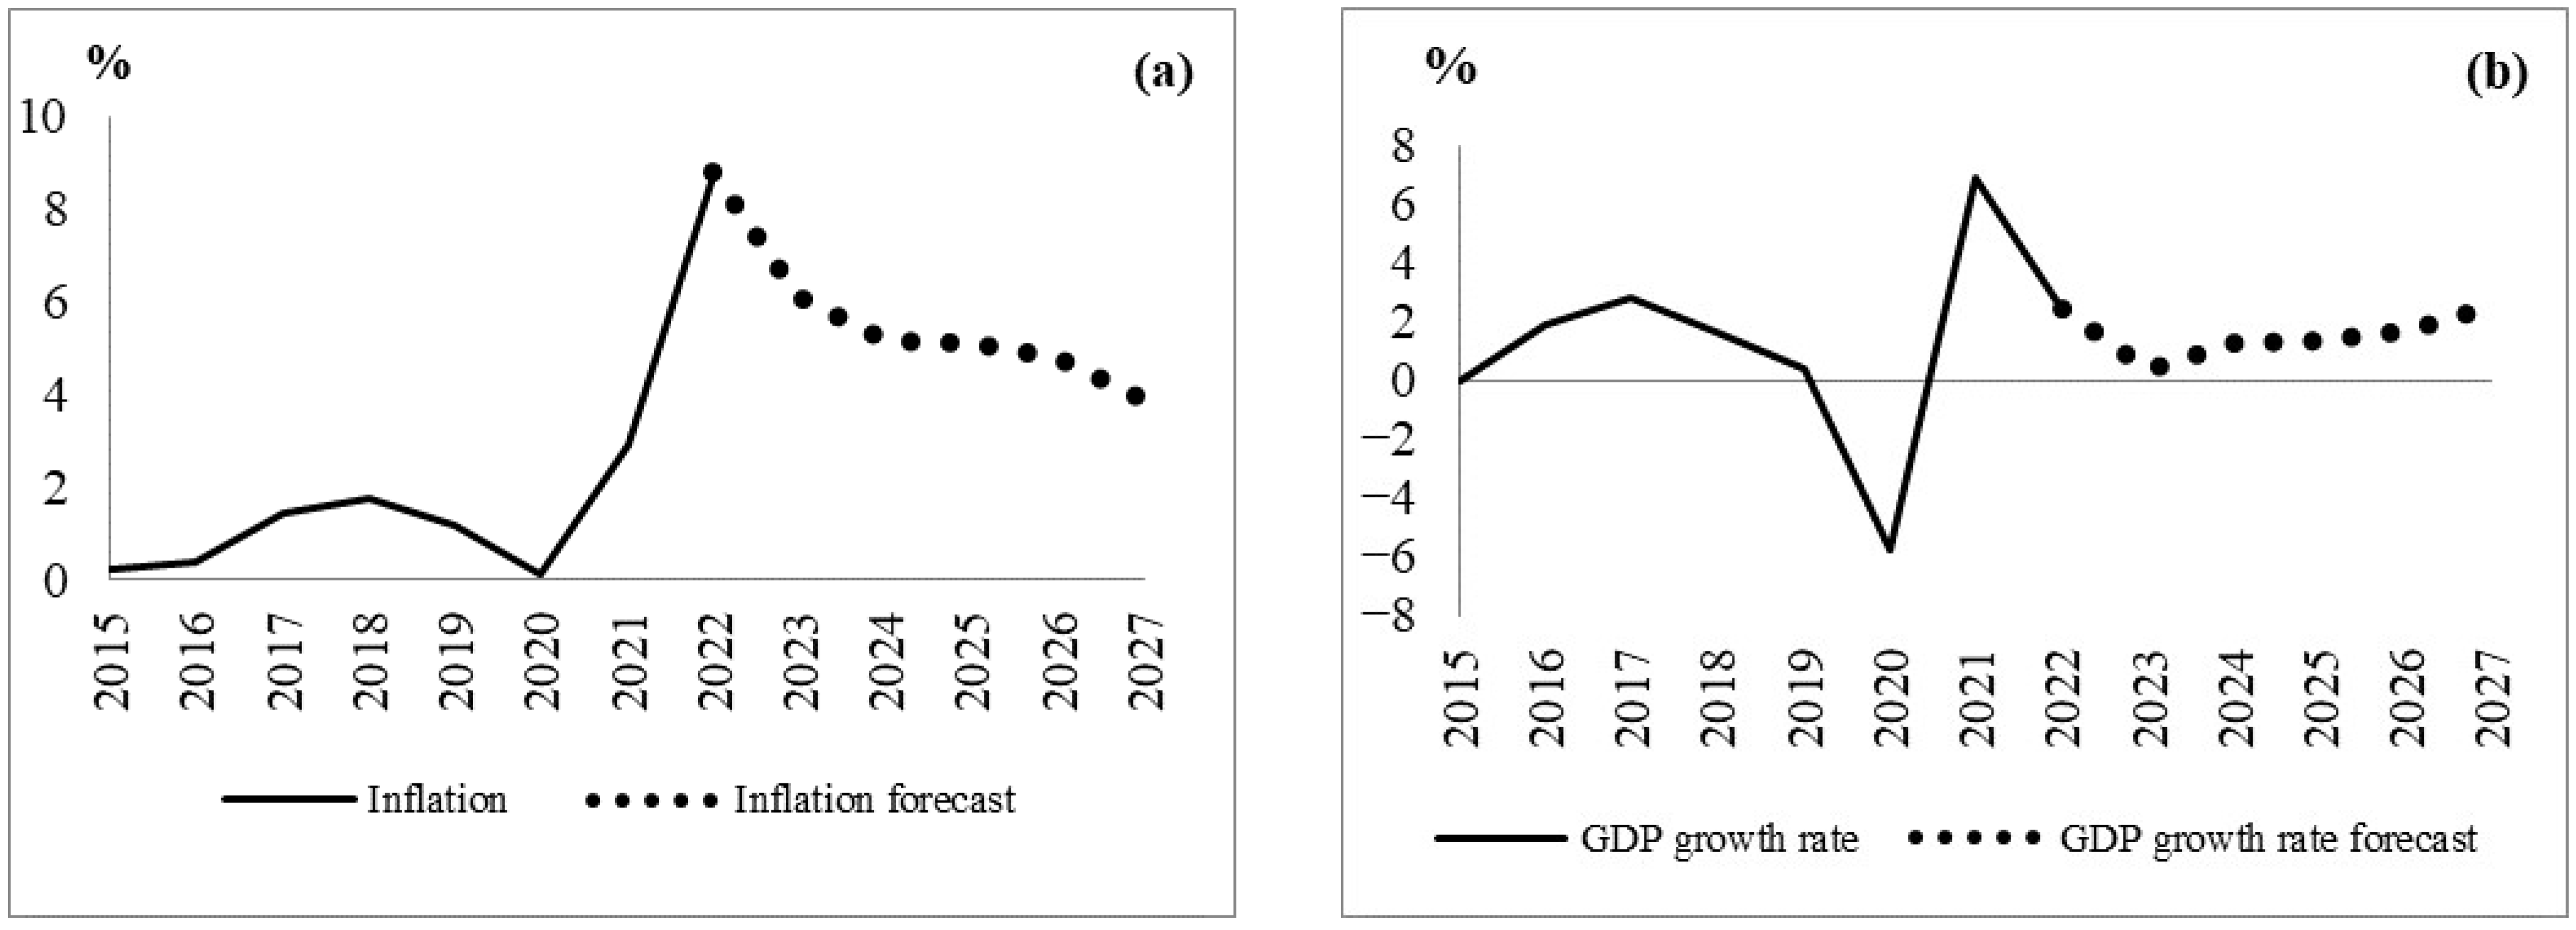
For the considered scenario, the results of the forecast simulation of the dynamics of the inflation and economic (growth/recession) rates, obtained using Formulas (1) and (2), are shown in Figure 8.

Figure 8.
Simulated growth (decline) rates in the Eurozone for (a) inflation and (b) GDP. (Developed by authors based on [41].)
Table 2 shows the results of the scenario modeling.
Table 2.
Main indicators for scenario modeling for the period of 2023–2027 (developed by authors).
According to official statistics, for the period of 2015–2022 in the Eurozone, the average annual inflation was 2.09%, and the average annual GDP growth was 1.49% [40]. It is obvious that the sharp rise in energy prices will contribute to inflationary pressure in the coming years.
The modeled processes show that economic growth and a reduction in inflation in the short term requires aggressive ECB policies. This assumes a significant increase in the interest rate over a horizon of 12–14 months, followed by a decrease in 2025. The scenario obtained as a result of modeling low growth rates of the money supply indicates the saturation of the Eurozone financial system with cash, which was due to the pumping of the money supply during the COVID-19 pandemic (money supply growth was 13.4% in 2020 and 10.6% in 2021) [40].
4. Conclusions
The models proposed in this paper make it possible to predict and analyze the economic consequences of various scenarios in the monetary and budgetary policies of monetary authorities, but require the careful selection of parameters based on actual statistical data.
In the context of high inflation rates in the Eurozone, the ECB is forced to switch to a policy of increasing the interest rate. In this regard, in the current agenda, there are two key questions, namely (1) how long this trend can continue and (2) whether such a monetary policy will solve the problem of inflation before an economic recession could become Europe’s new reality.
It is unlikely that anyone will take it upon themselves to give precise answers, first of all, because there is a complex interweaving of various factors. Obviously, one of the reasons for high inflation is the rise in prices for available energy resources [32]. These prices are not under the control of the ECB and depend on many geopolitical factors. Disruptions in the supply chain are another reason for rising prices, for example, for food [35]. The politically motivated decisions of individual countries, such as Germany’s refusal of nuclear energy and Russian gas, also contribute to inflation. Economic and military support for Ukraine also diverts resources that could be directed towards structural reforms of the Eurozone economy. Furthermore, of course, high interest rates do not stimulate investment growth, which suggests that the ECB is not inclined to support the growth of supply in the market [42]. The latest data on the German economy show that the number of corporate bankruptcies in July 2023 was 23.8% higher than in the same month in 2022, and that the number of bankruptcies has been steadily increasing since August 2022. In France, business failures rose by 35% in the second quarter of this year compared with the same period last year, leaving 55,000 jobs at risk [43]. These economic facts indicate that the threat of economic recession is real.
The originality of this study lies not only in the proposed model itself, which provides a mathematical solution that is better adapted to the conditions of high inflation and non-stationary processes, but also in its most complete description of the current situation in the Eurozone. The Eurozone is still in a period of economic turbulence, mainly due to major geopolitical tensions between countries and regions. In this regard, the main causes are exogenous in nature. In such situations, it is the actions of regulators that are key to maintain macroeconomic and economic balance. The key factor in such cases is the time factor. We assumed that the period of turbulence would last 12–14 months, after which the Eurozone economy would return to a steady state. If this does not happen, then beyond this time horizon, there are two possible scenarios: (a) the ECB will increase the rate of growth of the money supply in order to increase the rate of economic growth, yet such a strategy cannot be a long-term one; (b) if the ECB rejects such a strategy, an economic recession is quite possible, which is indirectly confirmed by the above data on some negative trends in the German and French private business sectors.
In the presented model, we assume that the period of geopolitical turbulence will end on a horizon of 12–14 months. If this is so, the Eurozone will avoid a recession and return to pre-crisis levels within 2–3 years. If the period of geopolitical strife lasts for years, then Europe and the world as a whole will face difficult times.
Author Contributions
Conceptualization: A.A. and A.S.; investigation: A.A.; methodology: A.A. and A.S.; data curation: A.S. and T.D.; writing—original draft: A.Z.; software: A.Z.; visualization: A.Z.; formal analysis: T.D.; project administration: A.T.; supervision: A.T.; writing—review & editing: A.T. All authors have read and agreed to the published version of the manuscript.
Funding
The research was supported by the Ministry of Science and Higher Education of the Russian Federation (Grant Agreement No. 075-15-2022-1136, dated 1 July 2022).
Data Availability Statement
Publicly available datasets were analyzed in this study. This data can be found here: https://www.ecb.europa.eu/pub/economic-bulletin/html/all_releases.en.html, accessed on 13 September 2023; https://economy-finance.ec.europa.eu/system/files/2023-05/SF_2023_Statistical%20Annex.pdf, accessed on 13 September 2023.
Conflicts of Interest
The authors declare no conflict of interest. The funders had no role in the design of the study; in the collection, analyses, or interpretation of data; in the writing of the manuscript; or in the decision to publish the results.
References
- Akaev, A.; Zvyagintsev, A.I.; Sarygulov, A.; Devezas, T.; Tick, A.; Ichkitidze, A. Growth Recovery and COVID-19 Pandemic Model: Comparative Analysis for Selected Emerging Economies. Mathematics 2022, 10, 3654. [Google Scholar] [CrossRef]
- Gajdosikova, D.; Lăzăroiu, G.; Valaskova, K. How Particular Firm-Specific Features Influence Corporate Debt Level: A Case Study of Slovak Enterprises. Axioms 2023, 12, 183. [Google Scholar] [CrossRef]
- Kliestik, T.; Valaskova, K.; Lazaroiu, G.; Kovacova, M.; Vrbka, J. Remaining Financially Healthy and Competitive: The Role of Financial Predictors. J. Compet. 2020, 12, 74–92. [Google Scholar] [CrossRef]
- Oranburg, S.C. A History of Financial Technology and Regulation: From American Incorporation to Cryptocurrency and Crowdfunding, 1st ed.; Cambridge University Press: Cambridge, UK, 2022. [Google Scholar] [CrossRef]
- Barbu, C.M.; Florea, D.L.; Dabija, D.C.; Barbu, M.C.R. Customer Experience in Fintech. J. Theor. Appl. Electron. Commer. Res. 2021, 16, 1415–1433. [Google Scholar] [CrossRef]
- Evgenidis, A.; Papadamou, S.; Siriopoulos, C. The yield spread’s ability to forecast economic activity: What have we learned after 30 years of studies? J. Bus. Res. 2020, 106, 221–232. [Google Scholar] [CrossRef]
- Molnár, A.; Csiszárik-Kocsir, Á. Forecasting Economic Growth with the Hungarian Composite Stock Market Index—A Granger Causality Test. Acta Polytech. Hung. 2022, 19, 205–227. [Google Scholar] [CrossRef]
- Molnár, A.; Csiszárik-Kocsir, Á. Forecasting Economic Growth with V4 Countries’ Composite Stock Market Indexes—A Granger Causality Test. Acta Polytech. Hung. 2023, 20, 135–154. [Google Scholar] [CrossRef]
- Asteriou, D.; Lalountas, D.A.; Siriopoulos, C. A Small Macro-Econometric Model for Greece: Implications about the Sustainability of the Greek External Debt. SSRN J. 2011, 1–33. [Google Scholar] [CrossRef]
- Friedman, M. Money and Economic Development; Lexington Books: Toronto, ON, Canada, 1973. [Google Scholar]
- Fischer, S. The role of macroeconomic factors in growth. J. Monet. Econ. 1993, 32, 485–512. [Google Scholar] [CrossRef]
- Barro, R.J. Inflation and Growth. Fed. Reserve Bank St. Louis Rev. 1996, 78, 153–169. [Google Scholar] [CrossRef]
- Andres, J.; Hernando, I. Does Inflation Harm Economic Growth? Evidence for the OECD. In The Costs and Effects of Price Stability; Feldstein, M., Ed.; Working Paper 6062; The University of Chicago Press: Chicago, IL, USA, 1999; pp. 315–341. [Google Scholar] [CrossRef]
- Bruno, M.; Easterly, W. Inflation crises and long-run growth. J. Monet. Econ. 1998, 41, 3–26. [Google Scholar] [CrossRef]
- Mallik, G.; Chowdhury, A. Inflation and Economic Growth: Evidence from Four South Asian Countries. Asia-Pac. Dev. J. 2001, 8, 123–135. [Google Scholar]
- Ito, T.; Sato, K. Exchange Rate Changes and Inflation in Post-Crisis Asian Economies: Vector Autoregression Analysis of the Exchange Rate Pass-Through. J. Money Credit. Bank. 2008, 40, 1407–1438. [Google Scholar] [CrossRef]
- Chiu, P. From Inflation to Deflation: A Novel Experience for Hong Kong: To speed up its economic recovery, the Special Administrative Region is betting on a more intense economic integration with mainland China. China Perspect. 2003, 6, 1–16. [Google Scholar] [CrossRef]
- Kremer, S.; Bick, A.; Nautz, D. Inflation and growth: New evidence from a dynamic panel threshold analysis. Empir. Econ. 2013, 44, 861–878. [Google Scholar] [CrossRef]
- Ekinci, R.; Tüzün, O.; Ceylan, F. The relationship between inflation and economic growth: Experiences of some inflation targeting countries. Financ. Stud. 2020, 24, 6–20. [Google Scholar]
- Chen, W.; Mrkaic, M.; Nabar, M. The Global Economic Recovery 10 Years after the 2008 Financial Crisis; IMF Working Papers; Working Paper No. 2019/083; IMF: Washington, DC, USA, 2019. [Google Scholar]
- Lane, P.R. Low Inflation: Macroeconomic Risks and the Monetary Policy Stance. Presented at the Financial Markets Workshop of the Economic Council (Finanzmarktklausur des Wirtschaftsrats der CDU), Berlin, Germany, 11 February 2020; Available online: https://www.ecb.europa.eu/press/key/date/2020/html/ecb.sp200211_2~eae18c54ff.en.html (accessed on 12 July 2023).
- Arlt, J.; Arltova, M. Forecasting of the Annual Inflation Rate in the Unstable Economic Conditions. WSEAS Trans. Bus. Econ. 2016, 12, 410–415. [Google Scholar] [CrossRef]
- Minsky, H.P. The Financial Instability Hypothesis; Working Papers No. 74; Levy Economics Institute: Annandale-On-Hudson, NY, USA, 1992. [Google Scholar]
- Akaev, A.A.; Sadovnichiy, V.A. Forecasting a Cyclical Downturn (Recession) in the US Economy Using a Mathematical Model of Hyman Minsky’s Theory of Financial Instability. Dokl. Math. 2020, 102, 422–426. [Google Scholar] [CrossRef]
- ECLAC. United States Economic Outlook: 2022 Year-in-Review and Early 2023 Developments; LC/WAS/TS.2023/2; Economic Commission for Latin America and the Caribbean: Santiago, Chile, 2022. [Google Scholar]
- Asada, T. Mathematical Modeling of Financial Instability and Macroeconomic Stabilization Policies. In Nonlinear Economic Dynamics and Financial Modelling; Dieci, R., He, X.Z., Hommes, C., Eds.; Discussion Paper No. 219; Springer: Cham, Switzerland, 2014; pp. 41–63. [Google Scholar]
- Tsvetkov, T.; Georgieva, S. Inflation, Inflation Instability and Nominal Uncertainty in Bulgarian Economy. Econ. Stud. 2022, 8, 41–64. [Google Scholar]
- Akaev, A.A.; Ziyadullaev, N.S.; Sarygulov, A.I.; Sokolov, V.N. Medium-term forecast of the dynamics of the development of the Russian economy. Stud. Russ. Econ. Dev. 2016, 27, 510–517. [Google Scholar] [CrossRef]
- Akaev, A.A.; Sarygulov, A.I.; Sokolov, V.N. Mathematical models of economic dynamics in the context of high inflation and unstable development. Dokl. Math. 2015, 92, 757–760. [Google Scholar] [CrossRef]
- Akaev, A.A.; Ziyadullaev, N.S.; Sarygulov, A.I.; Sokolov, V.N. A predictive model of economic dynamics during stagflation taking into account the volatility of the national currency. Stud. Russ. Econ. Dev. 2017, 28, 266–270. [Google Scholar] [CrossRef]
- Ascari, G.; Bonomolo, P.; Hoeberichts, M.; Trezzi, R. The Euro Area Great Inflation Surge. SUERF–The European Money and Finance Forum Policy Brief No. 548. 2023. Available online: https://www.dnb.nl/media/ijjmy42c/dnb-analysis-the-euro-area-great-inflation-surge.pdf (accessed on 13 September 2023).
- Benigno, P.; Canofari, P.; Bartolomeo, G.D.; Messori, M. Inflation Dynamics and Monetary Policy in the Euro Area; Monetary Dialogue Papers; European Parliament: Strasbourg, France, 2023; pp. 1–33. [Google Scholar]
- Jobst, A.; Krizan, P.; Utermöhl, K. Eurozone Inflation: How Bad Can It Get in 2022? 2022. Available online: https://www.allianz-trade.com/content/dam/onemarketing/aztrade/allianz-trade_com/en_gl/erd/publications/the-watch/2022_05_03EZ_inflation_AZT.pdf (accessed on 20 August 2023).
- ECB. Economic, financial and monetary developments. Econ. Bull. 2023, 4, 1–144. Available online: https://www.ecb.europa.eu/pub/economic-bulletin/html/eb202304.en.html (accessed on 20 June 2023).
- Baba, C.; Duval, R.; Lan, T.; Topalova, P. The Inflation Surge in Europe; IMF Working Paper; Working Paper No. 2023/030; IMF: Washington, DC, USA, 2023; pp. 1–22. [Google Scholar]
- Sadovnichiy, V.A.; Akaev, A.A.; Zvyagintsev, A.I.; Sarygulov, A.I. Refined Mathematical Model of Economic Dynamics under High Inflation and Unstable Development. Dokl. Math. 2023, 107, 105–108. [Google Scholar] [CrossRef]
- Romer, R. Advanced Macroeconomics, 4th ed.; The McGraw-Hill Series in Economics; McGraw-Hill/Irwin: New York, NY, USA, 2012. [Google Scholar]
- Cagan, P. The Monetary Dynamics of Hyperinflation. In Studies in the Quantity Theory of Money; Friedman, M., Ed.; The University of Chicago Press: Chicago, IL, USA, 1956; pp. 22–117. [Google Scholar]
- Bruno, M.; Fischer, S. Seigniorage, Operating Rules and The High Inflation Trap. Q. J. Econ. 1990, 105, 353–374. [Google Scholar] [CrossRef]
- ECB. Economic Bulletin. September 2023. Available online: https://www.ecb.europa.eu/pub/economic-bulletin/html/all_releases.en.html (accessed on 28 July 2023).
- European Commission. Statistical Annex, European Economic Forecast, Spring 2023, European Commission, Statistical Annex. 2023. Available online: https://economy-finance.ec.europa.eu/system/files/2023-05/SF_2023_Statistical%20Annex.pdf (accessed on 25 June 2023).
- Schnabel, I. The Risks of Stubborn Inflation, Speech by Isabel Schnabel, Member of the Executive Board of the ECB, at the Euro50 Group Conference on “New Challenges for the Economic and Monetary Union in the Post-Crisis Environment”, Luxemburg, 19 June 2023. Available online: https://www.ecb.europa.eu/press/key/date/2023/html/ecb.sp230619_1~2c0bdf2422.en.html (accessed on 24 June 2023).
- Noyan, O. Insolvencies on the Rise in Germany Amid Economic Downturn. Available online: https://www.euractiv.com/section/economy-jobs/news/insolvencies-on-the-rise-in-germany-amid-economic-downturn/ (accessed on 13 July 2023).

Disclaimer/Publisher’s Note: The statements, opinions and data contained in all publications are solely those of the individual author(s) and contributor(s) and not of MDPI and/or the editor(s). MDPI and/or the editor(s) disclaim responsibility for any injury to people or property resulting from any ideas, methods, instructions or products referred to in the content. |
© 2023 by the authors. Licensee MDPI, Basel, Switzerland. This article is an open access article distributed under the terms and conditions of the Creative Commons Attribution (CC BY) license (https://creativecommons.org/licenses/by/4.0/).