Article

Reliability and Service Life Analysis of Airbag Systems

1
School of Management, Zhengzhou University, Zhengzhou 450001, China
2
Laboratory of Science and Technology on Integrated Logistics Support, College of Intelligence Science and Technology, National University of Defense Technology, Changsha 410073, China
*
Author to whom correspondence should be addressed.
Mathematics 2023, 11(2), 434; https://doi.org/10.3390/math11020434
Submission received: 19 October 2022 / Revised: 27 December 2022 / Accepted: 12 January 2023 / Published: 13 January 2023
(This article belongs to the Section Engineering Mathematics)

Abstract

:
Airbag systems are important to a car’s safety protection system. To further improve the reliability of the system, this paper analyzes the failure mechanism of automotive airbag systems and establishes a dynamic fault tree model. The dynamic fault tree model is transformed into a continuous-time Bayesian network by introducing a unit step function and an impulse function, from which the failure probability of the system is calculated. Finally, the system reliability and average life are calculated and analyzed and compared with the sequential binary decision diagram method. The results show that the method can obtain more accurate system reliability and effectively identify the weak parts of the automotive airbag system, to a certain extent compensating for the lack of computational complexity of dynamic Bayesian networks in solving system reliability problems with continuous failure processes.

1. Introduction

An airbag is a protective device used in conjunction with seat belts to aid passenger safety [1]. It is often used as a last resort in collisions and consists mainly of airbag bags, sensors, inflators, and igniters. The sensor receives an impact signal and ignites the gas generator, generating a large quantity of gas, which is filtered and cooled into the airbag, causing it to break through the liner and rapidly deploy in a very short time, creating an elastic air cushion in front of the driver or occupant. Airbags can leak and contract in time to absorb impact energy, thus effectively protecting the human head and chest. They save the driver and passengers from injury or reduce the degree of injury suffered. The quality of car airbags is directly related to the safety of the driver and passengers. However, in actual traffic accidents, airbags sometimes fail to open, causing serious injuries and huge losses to the driver and passengers [2]. Therefore, it becomes a very important project to improve the reliability of the individual devices and systems in the automotive airbag system.
One of the common analysis methods used in reliability analysis is fault tree analysis, which is widely used in fault diagnosis and safety performance studies of components or systems [3]. The fault tree method has been used in the reliability assessment and design of systems due to its clear cause–effect relationships, ease of use, and combination of qualitative and quantitative aspects. However, it should also be noted that the traditional fault tree analysis method also has its limitations. While it can effectively handle systems with static logical characteristics, it is not ideal for systems characterized by dynamic properties such as temporality, redundancy, and correlation [4,5,6].
Especially in engineering applications, many meta-components or systems are not simply static, but often have characteristics such as uncertainty, dynamics, and continuity [7,8,9]. Static fault trees cannot model the reliability of dynamic systems. Therefore, dynamic fault tree analysis has been developed. Dugan proposed the concept of dynamic fault trees in 1990, adding dynamic logic gates such as priority AND gates, cold spare gates, and cascading priority AND gates on top of static logic gates, forming the Dugan dynamic fault tree analysis method [10]. Scholars at home and abroad have focused on the quantitative analysis of Dugan dynamic fault trees [11] and dynamic logic gate expansion [12]. In terms of quantitative analysis of algorithms, the main methods are Markov chain analysis, Bayesian network analysis, Monte Carlo analysis, and sequential binary decision diagrams [13,14,15]. Among them, Boudali et al. [16] introduced the dynamic fault tree analysis method based on the Markov chain. However, when the system is relatively complex, this method will lead to the exponential increase in the computation amount with the increase in the state, so it also has some shortcomings. Walker and Papadopoulos [17] extended the logical basis of fault trees to enhance the ability of dynamic fault trees to express temporal correlations. Fault tree analysis is also widely used in various fields. Pang et al. [18] analyzed and diagnosed the electromagnet manufacturing process based on fuzzy fault trees and evidence theory. Yang et al. [19] used models such as fault trees to analyze the spread, identification, and causes of capital-raising frauds. Zhang et al. [20] used a fault tree model to analyze the collision risk factors of ship collisions, which can effectively guide rescue efforts.
As can be seen from the above analysis, both static and dynamic fault trees make some assumptions about the fault state of the system. These include the assumption that the event has only two states, “normal” and “fault”, without considering the existence of other intermediate states [21]. As a result, there is a problem of inaccurate description of the system state and unclear identification of the system failure mode [22], and any errors can lead to large-scale economic losses [23,24]. In this case, therefore, the failure mechanism of the system and the logical relationships between events are usually described with the help of probabilities, but the probabilistic model cannot be described by relying solely on the logic gates in the fault tree. To make up for the shortcomings of fault trees in this area, the American scientist Judea Pearl introduced the concept of Bayesian networks in 1988. This concept has quickly become a hot topic of research and is widely used in various fields because it combines the well-established theories of probability theory and graph theory [25]. Bayesian networks are probability-based directed acyclic graphs with which complex inference problems can be handled [26], which have important applications in both fault diagnosis and reliability analysis. After analyzing the relationship between fault trees and Bayesian networks, complex uncertainty problems can be well handled with the help of Bayesian networks, which represent the interrelationships between nodes using conditional probability tables. It allows a two-way inference analysis: both forward calculation of the reliability of the system and backward diagnosis of the influence of one or some components on the system [27,28]. Bobbio et al. [25] found a way to transform the traditional static fault tree model into a static Bayesian network. For static Bayesian networks, the nodes do not contain dynamic logical relationships with each other. Therefore, static Bayesian networks cannot analyze the system reliability problems of continuous systems at arbitrary times. In order to fully consider the timing of each event occurring in the system, the dynamic Bayesian network is formed on the basis of the static Bayesian network. Dynamic Bayesian networks take into account the conditional independence of variables, and the number of parameters in the conditional probability table is much lower than the number of states in the Markov model, so the solution complexity of the Bayesian network model is low. These advantages of Bayesian network models have led to their increasing application in system reliability modeling and evaluation [29,30].
The fault tree model is quickly constructed through fault analysis and then converted directly into a Bayesian network model, which reduces the modeling process. The excellent bidirectional inference computational capability of Bayesian networks can be applied for multistate reliability analysis of complex systems, which can complement the shortcomings of fault tree analysis in multistate analysis and complex system applications. Therefore, this paper takes an automotive airbag system as a background and draws on the nature of Bayesian networks. It is discussed how the dynamic fault tree model can be transformed into a continuous Bayesian network. The reliability of the automotive airbag system at any time is derived where the probability distribution obeyed by the failure process of the system events can be obtained.
The rest of this paper is organized as follows. Section 2 briefly describes the components of an automotive airbag system and presents an example of fault analysis of the system with dynamic fault tree modeling. Section 3 transforms the dynamic fault tree model of the automotive airbag system into a continuous Bayesian network model with the help of the unit step function and impulse function, and analyzes the reliability and expected life of the automotive airbag system. The sequential binary decision diagram method is also used to compare with the method proposed in this paper. Section 4 concludes the paper. The research framework of this paper is shown in Figure 1.

2. Dynamic Fault Tree of Automotive Airbag System

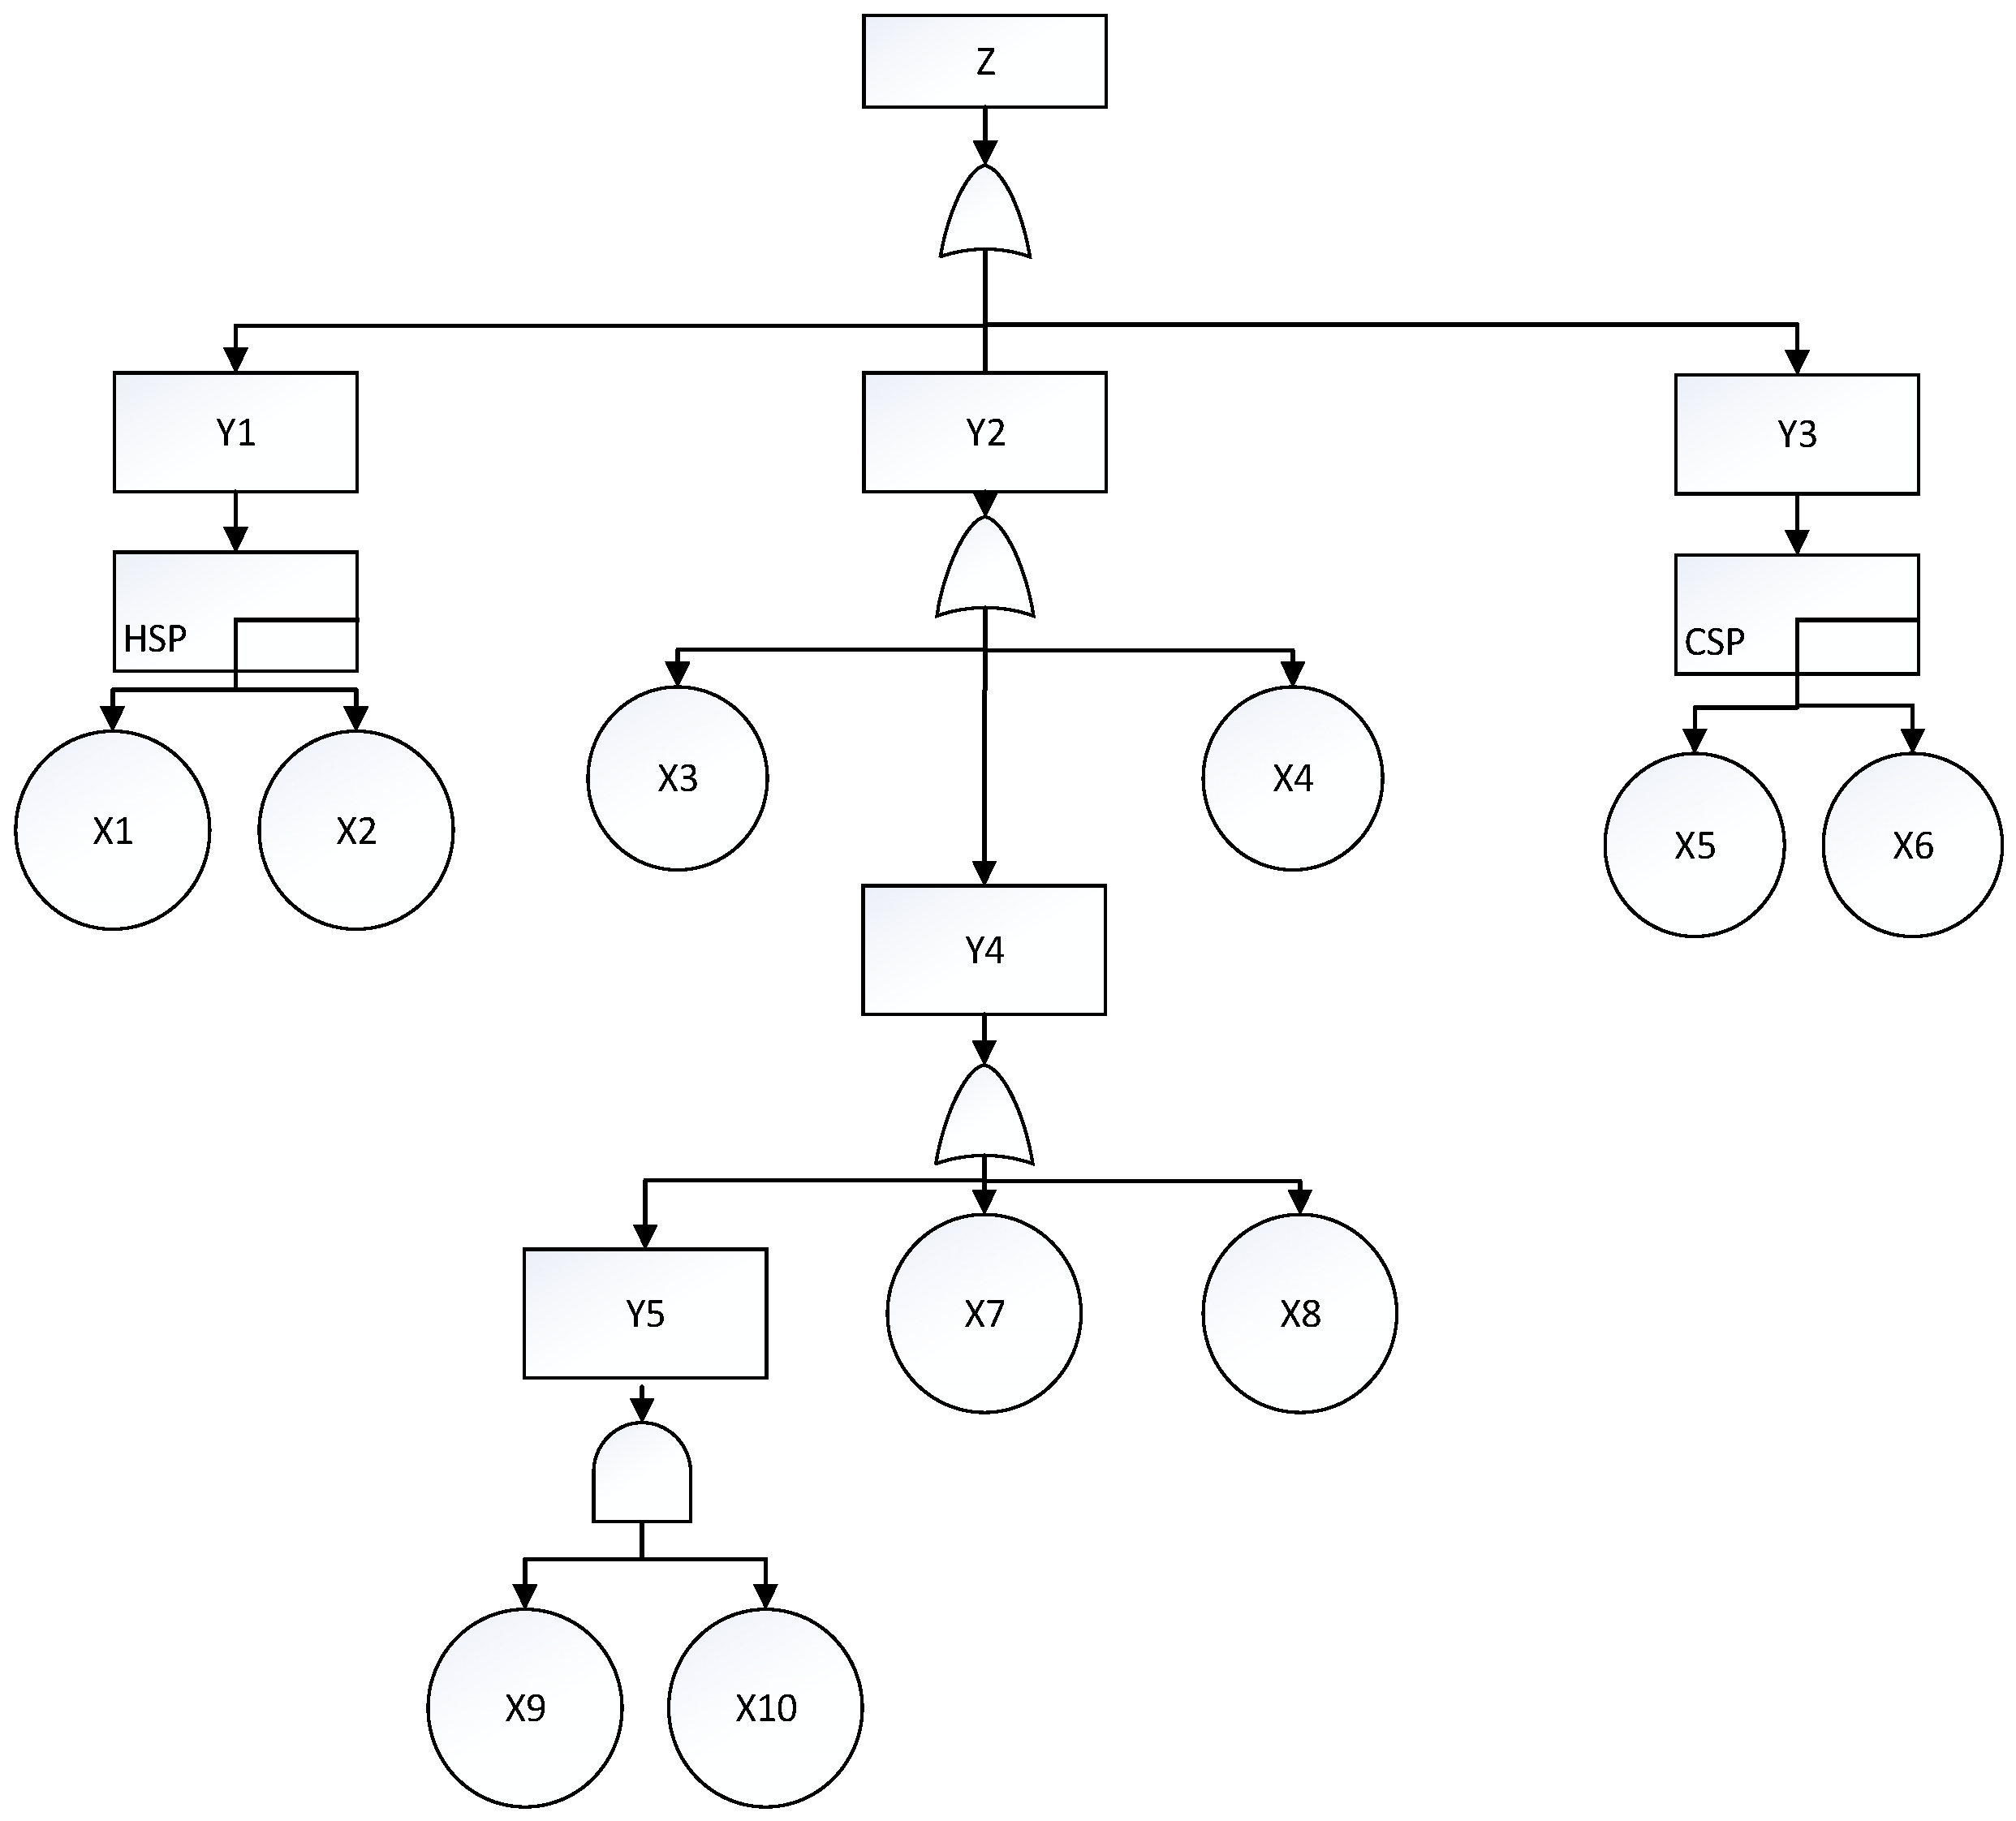
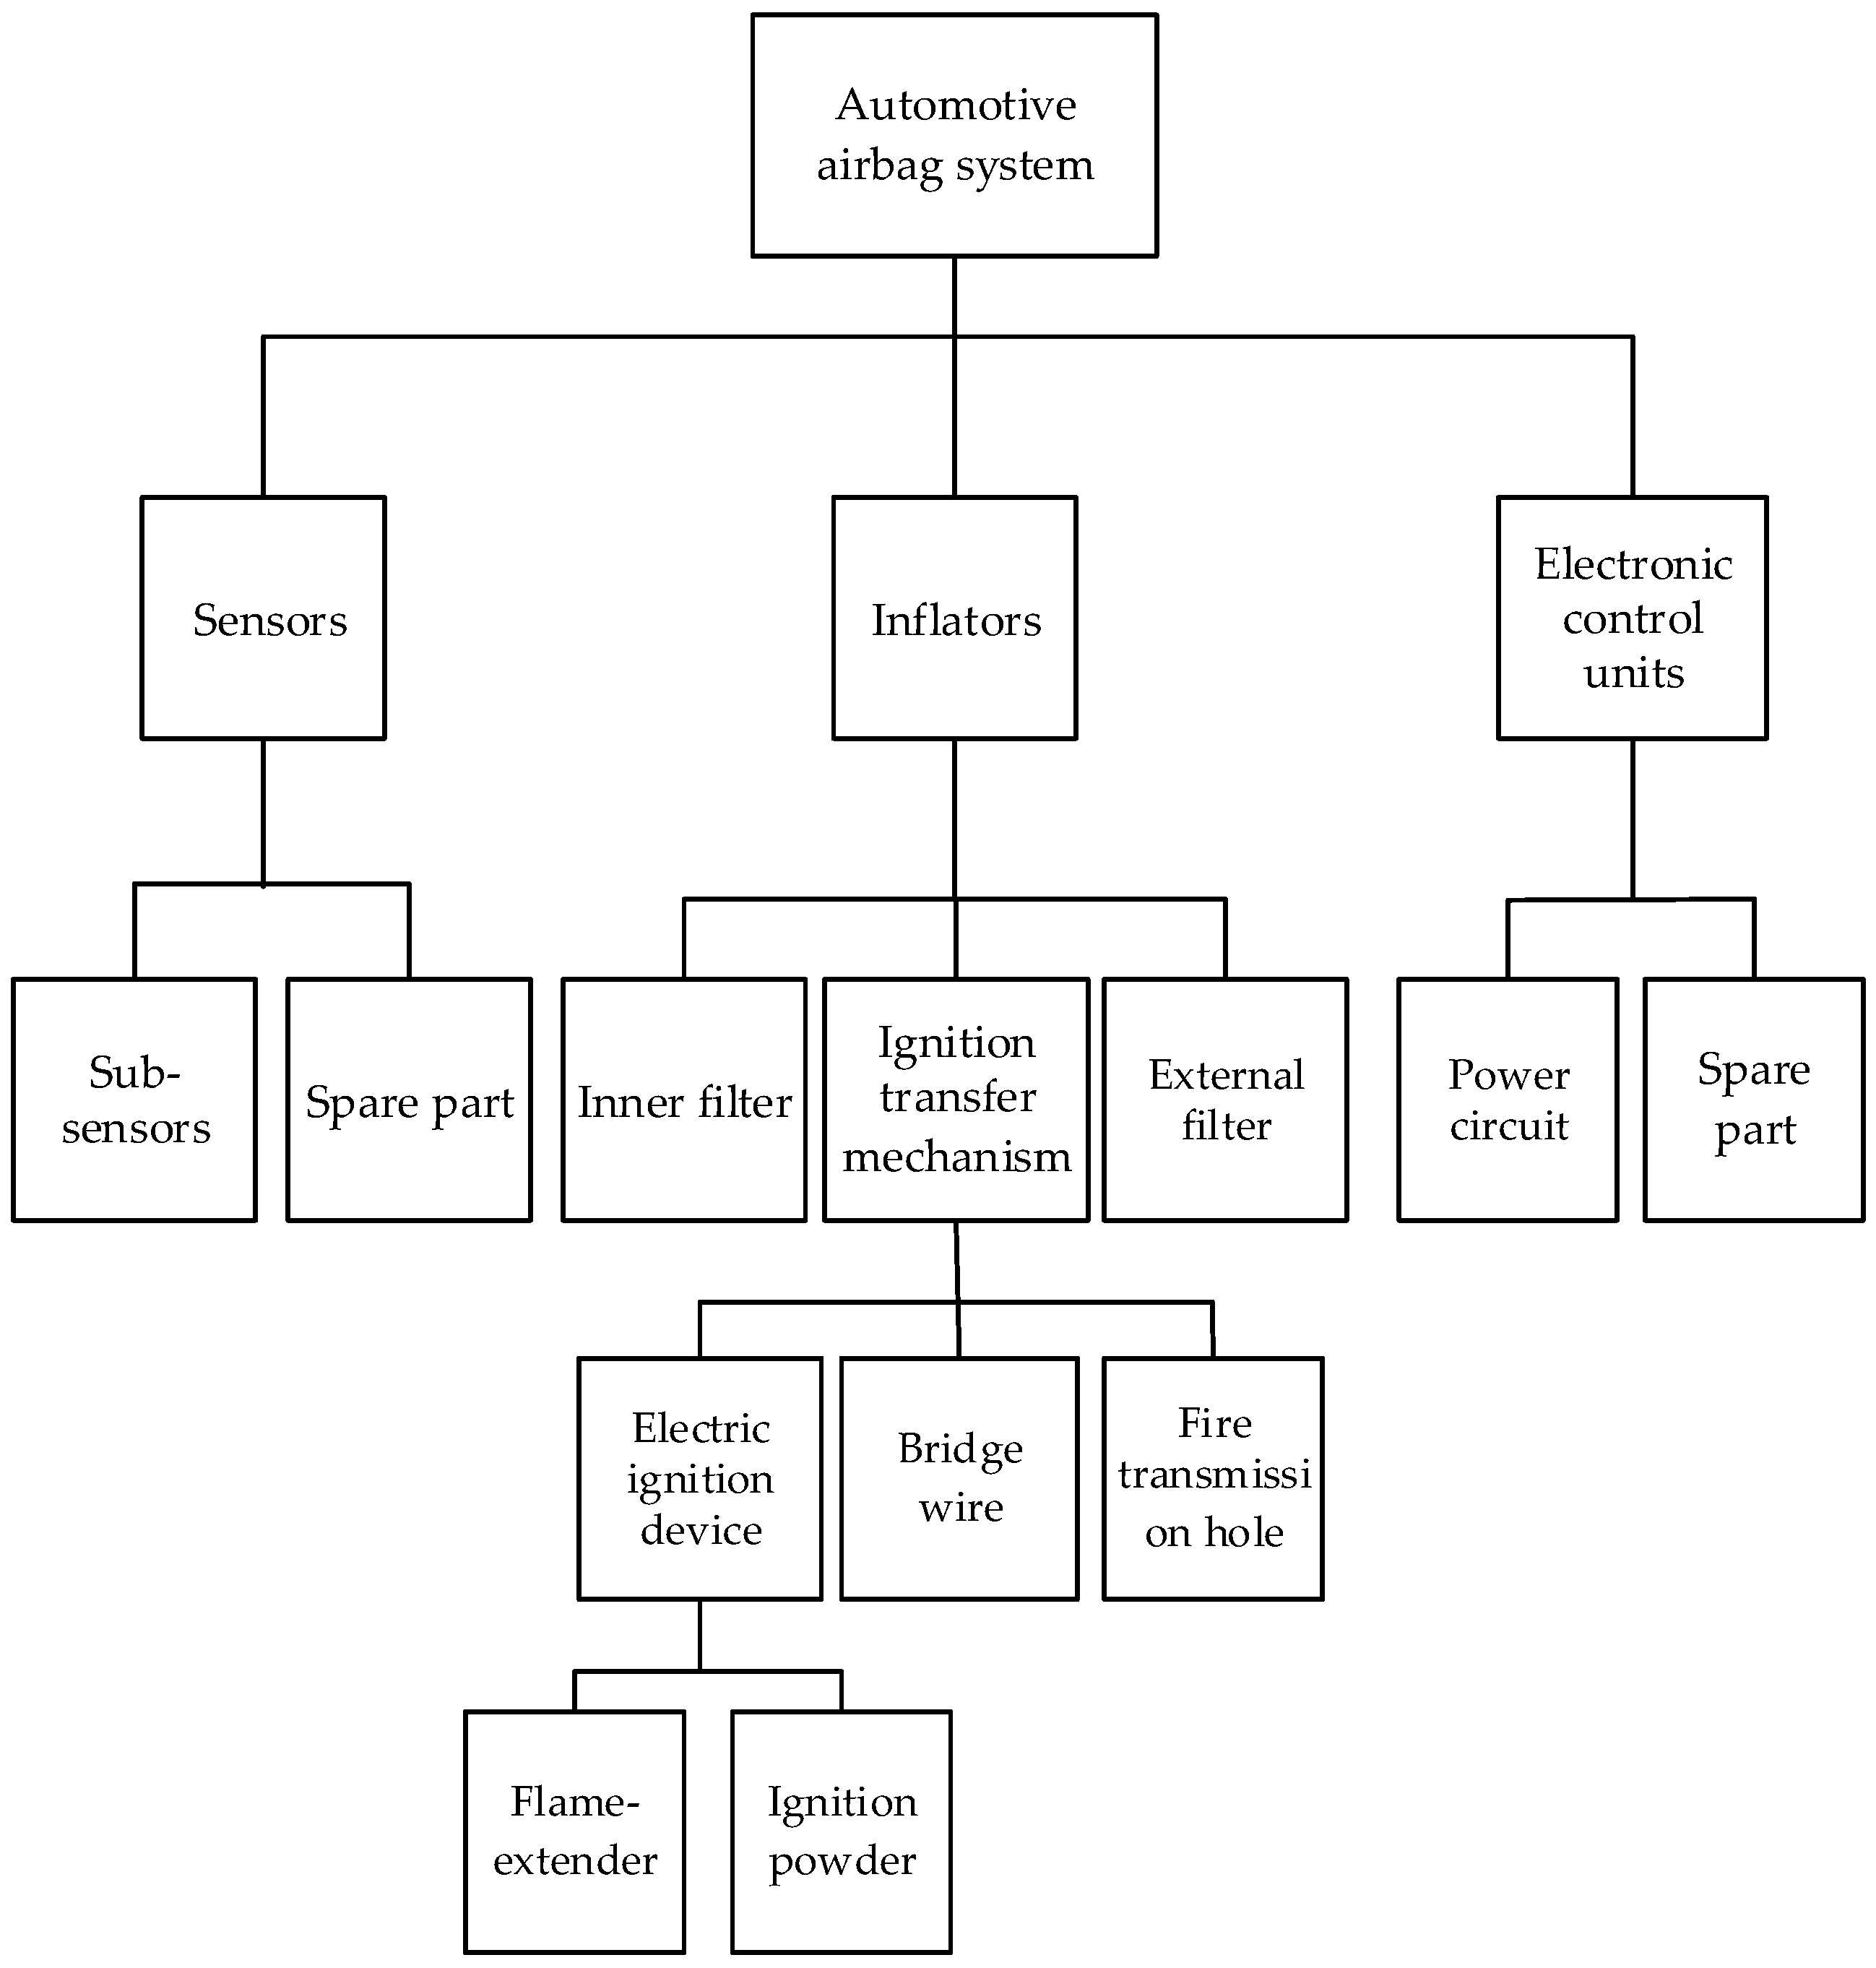
In this paper, the airbag system failure is identified as the top event of the fault tree Z. The automotive airbag system mainly consists of sensors, inflators, and electronic control units. Failure of any one of these three subsystems can lead to airbag system failure. A redundant configuration is used, as the sensors and electronic control unit are key components of the airbag system. The sensor subsystem block has a hot standby sensor and the electronic control unit subsystem has a cold standby power circuit. For the inflator subsystem, there are three parts: the inner filter, the outer filter, and the ignition transfer mechanism. The ignition transfer mechanism consists of a bridge wire, an electric ignition device, and a flame transfer hole. The electric ignition apparatus consists of two parts: the spreading charge and the ignition charge. Therefore, the failure mechanism of the system is analyzed. The dynamic fault tree model of the system is shown in Figure 2.
The structure of the automobile airbag system is shown in Figure 3. The meaning of each symbol in the fault tree model is shown in Table 1. Then, according to the analysis of the failure process of the automotive airbag system, the distribution and failure rate obeyed by each component in the system during the failure process can be obtained as follows.
Based on the above analysis, we can obtain the automotive airbag system’s dynamic fault tree model and failure rate distribution. Further derivation of the method for converting the dynamic fault tree of an automotive airbag system into a Bayesian network will be presented in the subsequent sections.

3. Reliability and Life Analysis

Based on the dynamic fault tree model of automotive airbags proposed in the previous chapter, the reliability and lifetime will be analyzed in this chapter.

3.1. Reliability and Life Analysis Based on Bayesian Network

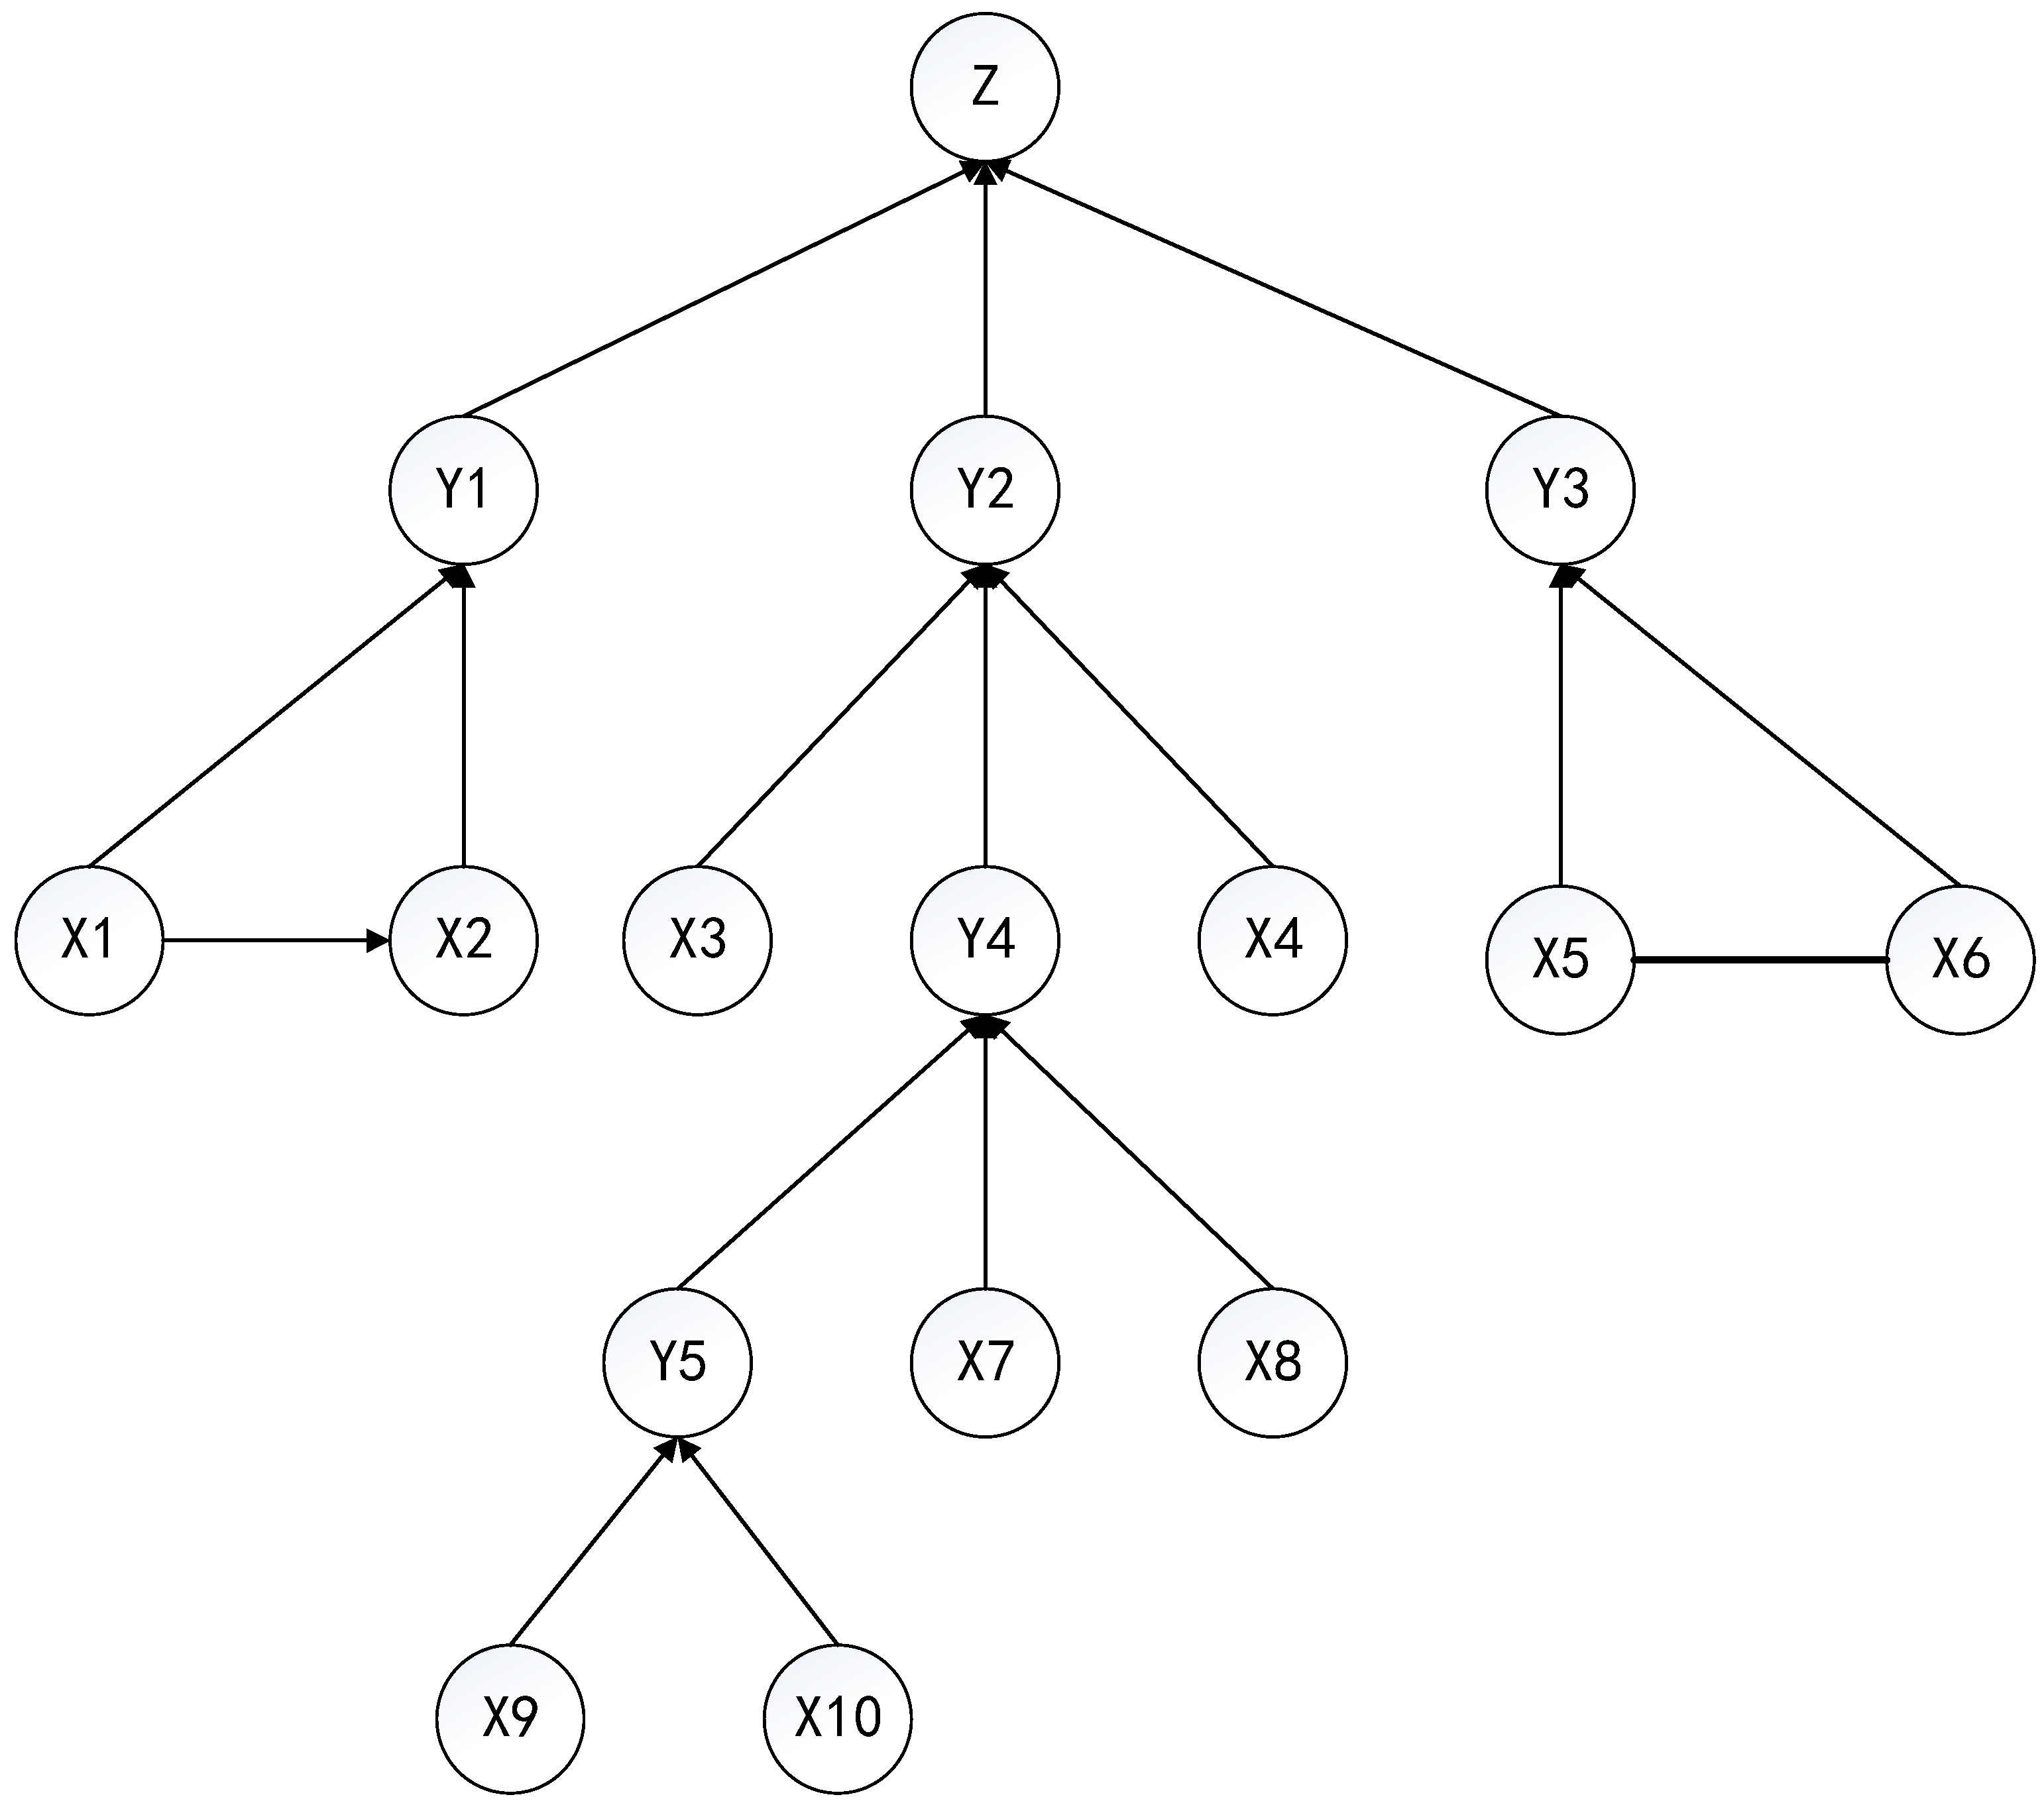
The dynamic fault tree model for each part of the automotive airbag system is next transformed in parts into an equivalent continuous Bayesian network model. The dynamic fault tree model of the overall automotive airbag system will be further transformed in the following. A Bayesian network topology equivalent to it is obtained, as shown in Figure 4.
According to the structural characteristics of the airbag system, based on Table 1, the failure processes of all the bottom events obey the exponential distribution. The probability density function of the exponential distribution can be obtained according to the content of the probability theory, as shown in Equation (1); x is the time variable of the component, and the distribution function of the exponential distribution is shown in Equation (2)
f ( x ) = { λ e λ x x > 0 0 x 0
F ( x ) = {   1 e λ x x 0 0 x < 0 .
(1) The failure processes of the dynamic logic AND gate event X9 and event X10 obey exponential distribution, and the failure rates of the events are λ9, and λ10, respectively. Based on the above analysis of the transformation of the dynamic logic AND gate and the nature of exponential distribution, it can be obtained that the marginal probability density function of the failure of lower level event Y5 is
f Y 5 ( y ) = d [ F X 9 ( y ) F X 10 ( y ) ] d y = λ 9 e λ 9 y + λ 10 e λ 10 y ( λ 9 + λ 10 ) e ( λ 9 + λ 10 ) y .
The probability distribution function for the failure of the lower-level event Y5 is
F Y 5 ( t ) = F X 9 ( t ) F X 10 ( t ) = 1 e λ 9 t e λ 10 t + e ( λ 9 + λ 10 ) t .
(2) The failure processes of the dynamic logic OR gate event Y5, event X7, and event X8 all obey exponential distribution. The probability distribution function of the failure of event Y5 has been found, and the failure rates of event X7 and event X8 are λ7 and λ8, respectively. According to the construction method of the upper-level event as two, the dynamic OR gate structure of this layer is transformed into a two-layer virtual dynamic OR gate structure. That is, event X7 and event X8 constitute event W1.
The marginal probability density function for the failure of the lower-level event W1 is
f W 1 ( y ) = f X 7 ( y ) + f X 8 ( y ) d [ F X 7 ( y ) F X 8 ( y ) ] d y .
The probability distribution function for the failure of the lower-level event W1 is
F W 1 ( t ) = F X 7 ( t ) + F X 8 ( t ) F X 7 ( t ) F X 8 ( t ) = 1 e ( λ 7 + λ 8 ) t .
The marginal probability density function for the failure of the lower-level event Y4 is
f Y 4 ( z ) = f Y 5 ( z ) + f W 1 ( z ) d [ F Y 5 ( z ) F W 1 ( z ) ] d z .
The probability distribution function for the failure of the lower-level event Y4 is
F Y 4 ( w ) = F Y 5 ( w ) + F W 1 ( w ) F Y 5 ( w ) F W 1 ( w ) .
(3) The failure processes of dynamic logic OR gate event Y4, event X3, and event X4 all obey exponential distribution. The probability distribution function of the failure of event Y4 has been found, and the failure rates of event X3 and event X4 are λ3 and λ4, respectively. According to the construction method of the upper-level event as two, the dynamic OR gate structure of this layer is transformed into a two-layer virtual dynamic OR gate structure. That is, event X3 and event X4 constitute event W2.
The marginal probability density function for the failure of the lower-level event W2 is
f W 2 ( y ) = f X 3 ( y ) + f X 4 ( y ) d [ F X 3 ( y ) F X 4 ( y ) ] d y .
The probability distribution function for the failure of the lower-level event W2 is
F W 2 ( t ) = F X 3 ( t ) + F X 4 ( t ) F X 3 ( t ) F X 4 ( t ) = 1 e ( λ 3 + λ 4 ) t .
The marginal probability density function for the failure of the lower-level event Y2 is
f Y 2 ( z ) = f Y 4 ( z ) + f W 2 ( z ) d [ F Y 4 ( z ) F W 2 ( z ) ] d z .
The probability distribution function for the failure of the lower-level event Y2 is
F Y 2 ( w ) = F Y 4 ( w ) + F W 2 ( w ) F Y 4 ( w ) F W 2 ( w )
(4) The failure processes of dynamic logic hot standby gate events X1 and event X2 obey exponential distribution, and the failure rate of event X1 and event X2 is λ1 and λ2, respectively, and λ1 = λ2, based on the above analysis of the transformation of the dynamic logic hot standby gate and the nature of the exponential distribution. The marginal probability density function for the failure of the upper-level event Y1 can be obtained as
f Y 1 ( y ) = d [ F X 1 ( y ) F X 2 ( y ) ] d y = 2 λ 1 e λ 1 y 2 λ 1 e 2 λ 1 y .
The probability distribution function for the failure of the lower-level event Y1 is
F Y 1 ( t ) = F X 1 ( t ) F X 2 ( t ) = 1 2 e λ 1 t + e 2 λ 1 t .
(5) The failure process of the dynamic logic cold-ready gate event X5 obeys an exponential distribution with a failure rate of λ5. The independent failure process of event X6 also obeys an exponential distribution with a failure rate of λ6 and λ5 = λ6, based on the above analysis of the transformation of the dynamic logic cold-ready gate and the nature of the exponential distribution. The marginal probability density function for the failure of the upper-level event Y3 can be obtained:
f Y 3 ( y ) = 0 0 v ( x 6 x 5 ) ζ ( y x 6 ) v ( x 6 x 5 ) λ 6 e λ 6 ( x 6 x 5 ) λ 5 e λ 5 x 5 d x 5 d x 6 = λ 5 λ 5 0 0 [ v ( x 6 x 5 ) ] 2 ζ ( y x 6 ) e λ 5 x 6 d x 5 d x 6 = λ 5 λ 5 0 [ v ( y x 5 ) ] 2 e λ 5 y d x 5
From the properties of the unit step function, the following equation can be obtained:
[ v ( y x 5 ) ] 2 = { 1 y > x 5 1 4 y = x 5 0 y < x 5 .
Because the marginal probability density function for finding the failure of event Y3 is a Riemann integral over its probability density function, it follows from the nature of the Riemann integral that changing the value of a point does not affect the result of the integration. Therefore, when y = x5, one can make [v(y − x5)]2 = 1.
Then the value of the above equation is
f Y 3 ( y ) = λ 5 λ 5 0 [ v ( y x 5 ) ] 2 e λ 5 y d x 5 = λ 5 λ 5 e λ 5 y 0 y 1 d x 5 = λ 5 λ 5 y e λ 5 y
The probability distribution function for the failure of the upper-level event Y3 is
F Y 3 ( t ) = 0 t f Y 3 ( y ) d y = 0 t λ 5 λ 5 y e λ 5 y d y = 1 e λ 5 y λ 5 t e λ 5 y .
(6) For an OR gate structure consisting of event Y1 and event Y2, from the above analysis of the transformation of dynamic logic OR gates, the probability distribution function for the failure of event W is calculated using Matlab and yields the following result:
F W ( t ) = F Y 1 ( t ) + F Y 3 ( t ) F Y 1 ( t ) F Y 3 ( t ) .
Similarly, the probability distribution function for the failure of event Z is calculated as
F Z ( t ) = F Y 2 ( t ) + F W ( t ) F Y 2 ( t ) F W ( t ) .
Reliability is the ability of a device to perform a specified function under specified conditions and within a specified time. The probability measure of reliability is called dependability. It represents the probability that a component, product, or system will perform a specified function under specified conditions and within a specified time. For the automotive airbag system described above, assuming that the specified time is t and the life of the system is Z, the reliability is expressed as the probability that Z > t.
R Z ( t ) = P ( Z > t ) .
The probability of failure characterizes the probability that a component, product, or system will lose a specified function under specified conditions and within a specified time. For the above automotive airbag system, assuming a specified time of t and a system life of Z, the probability of failure of the system is
F Z ( t ) = P ( Z t ) = 1 R Z ( t ) .
From the above analysis, the reliability and probability of failure of an automotive airbag system can be obtained. Substituting the values of the failure rate for each basic event into the above equation, and making t = 1000 h, t = 5000 h, t = 10,000 h, t = 15,000 h, t = 20,000 h, and t = 25,000 h, respectively, we obtain Table 2.
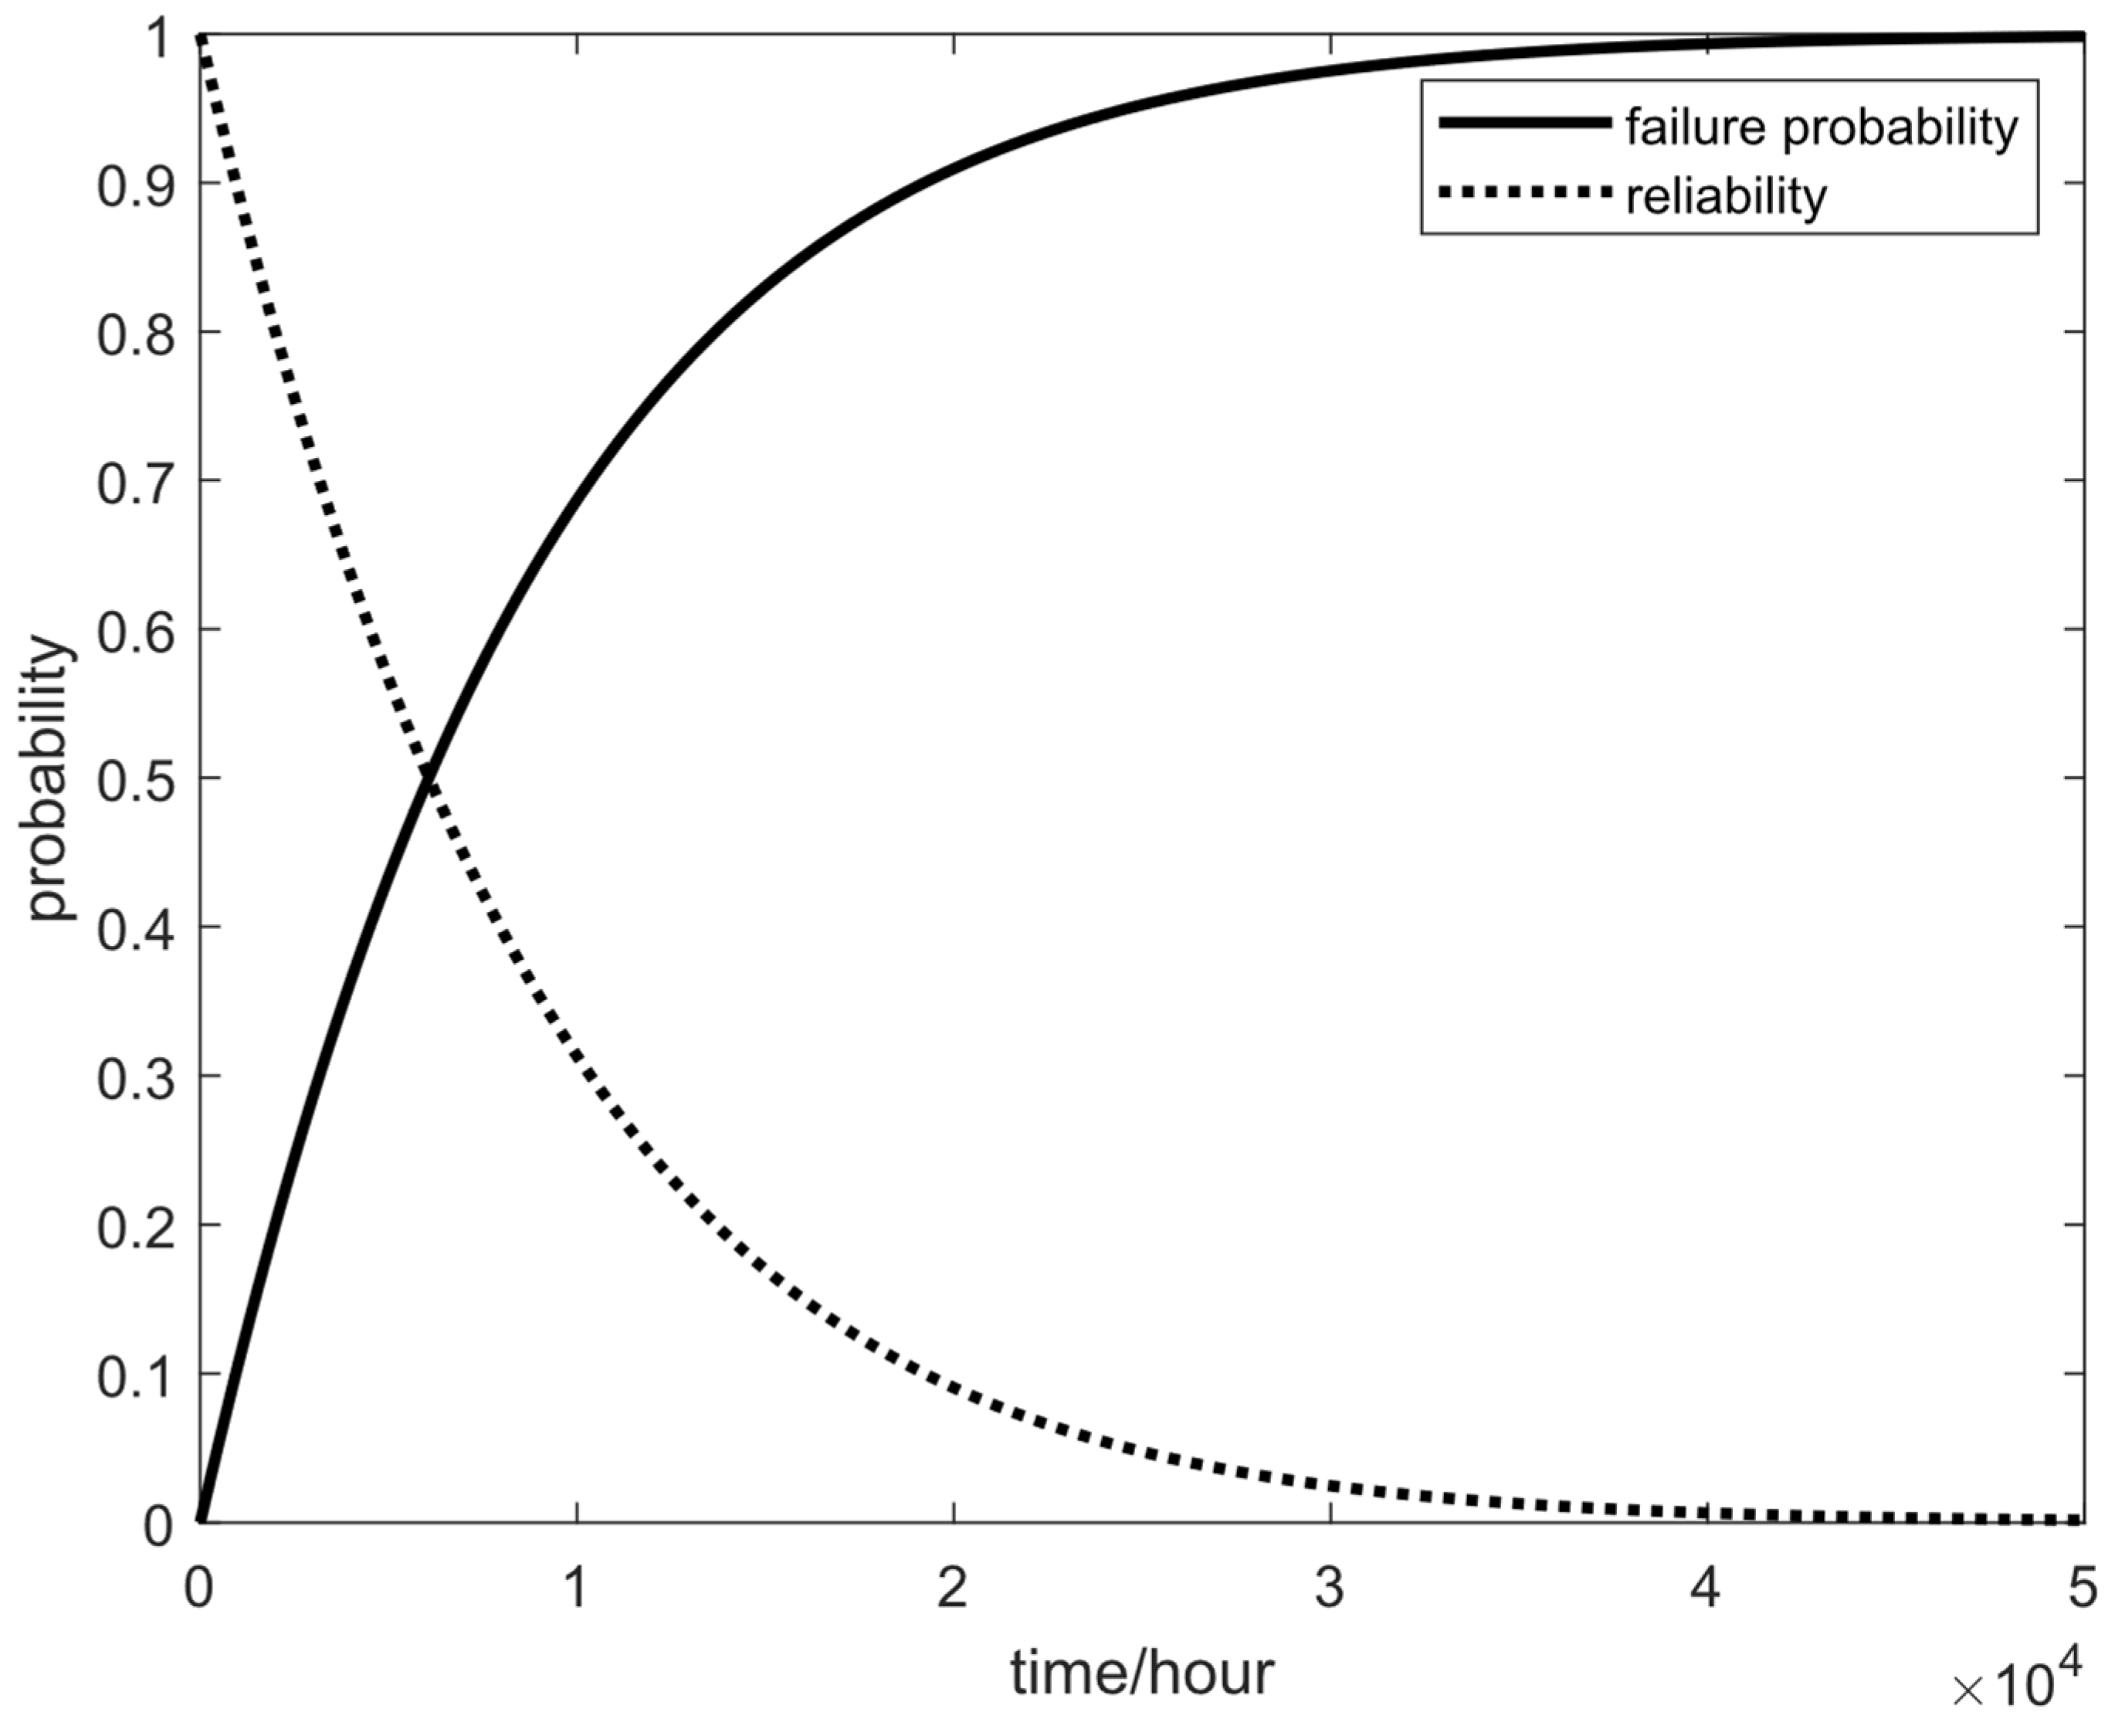
At 1000 h, the probability that the system can complete the specified function under certain conditions is 0.8946; at 10,000 h, the probability that the system can complete the specified function under certain conditions is 0.3132. From Table 2, we can see that after 10,000 h, the reliability of the system is very low and cannot meet the needs for the safe operation of the system at all.
The reliability and probability of failure of the airbag system of the car with time are shown in Figure 5. When the airbag system operates at 40,000 h, the reliability of the system is close to 0, and the system must be repaired or replaced at this time.
Once the reliability of an automotive airbag system has been obtained, the average life of the system can be predicted based on the resulting reliability. The average life can be obtained from the integration of the reliability of the system R Z (t) over (0, ∞). The average life of the system is approximately 8410 h. The average life is a guide for the replacement of equipment and the evaluation of the safety performance of the system.
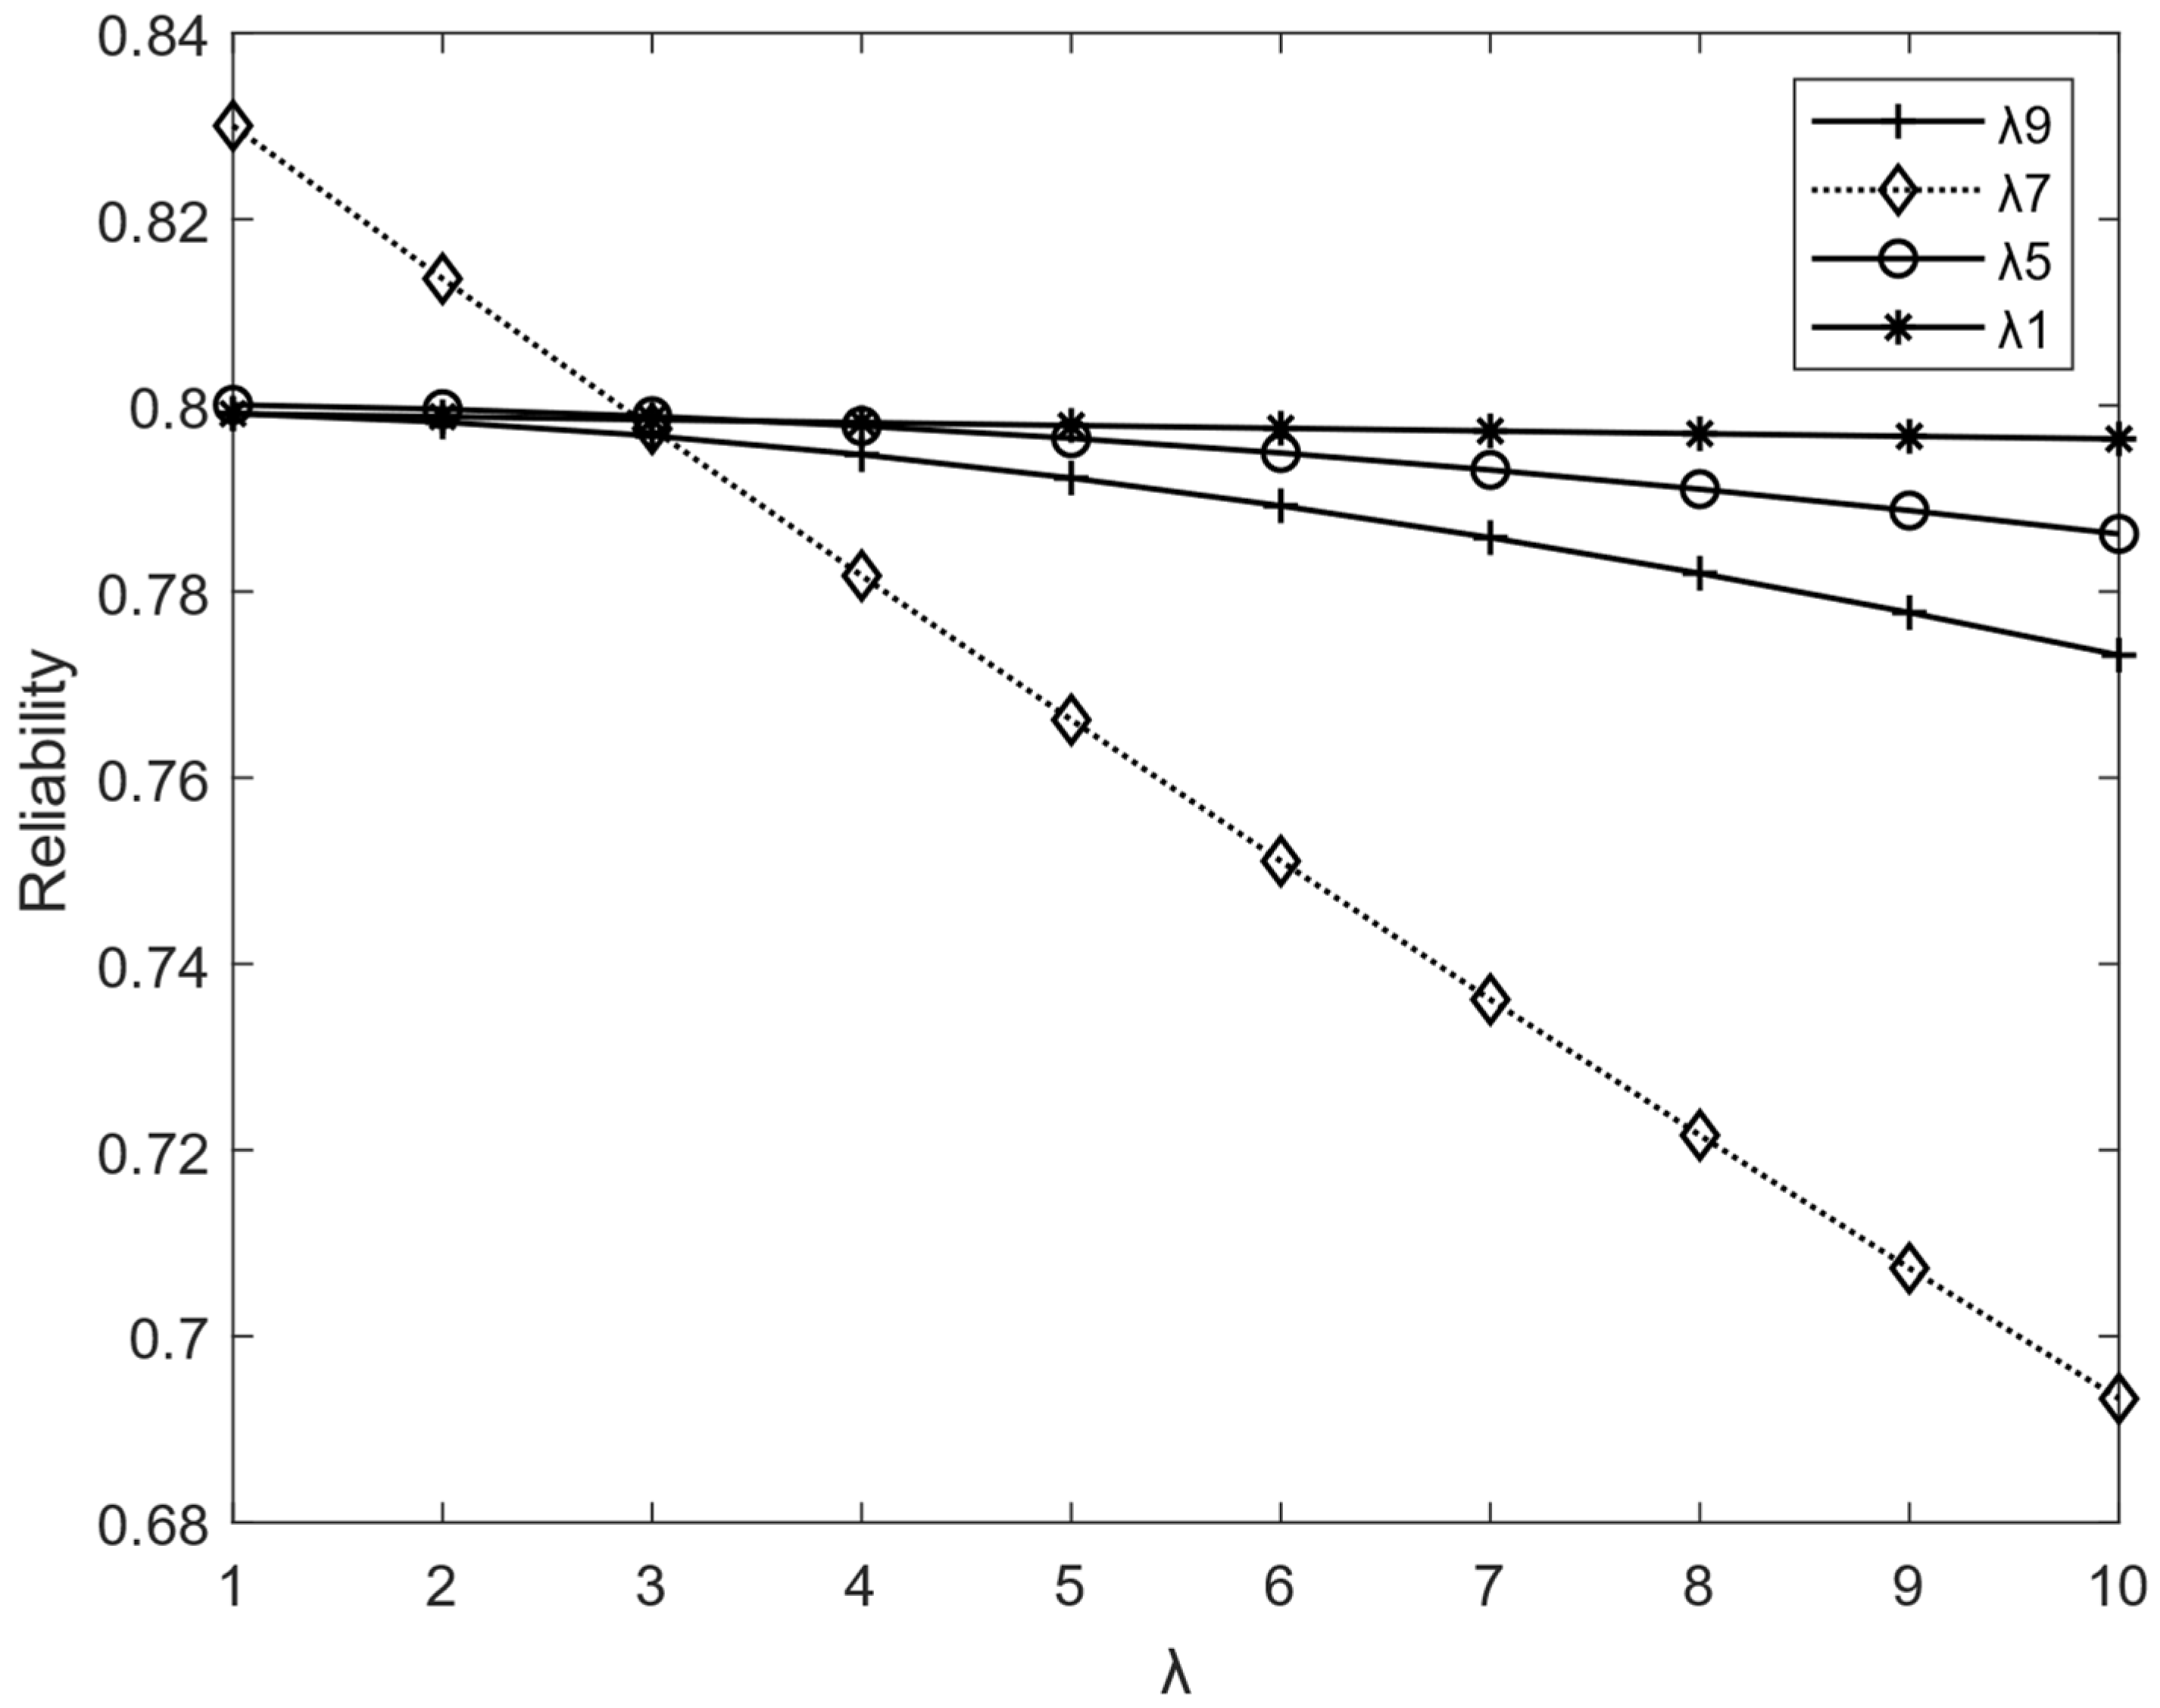
By considering the reliability R Z ( t ) of the automotive airbag system as a function of λ1, λ5, λ7, and λ9, the trend of the reliability with the parameters at any moment can be found. When t = 2000 h, the system reliability R Z ( t ) can be obtained as a function of a single parameter, as shown in Figure 6. According to Figure 4, we can know the trend of reliability with parameters at any moment: the reliability of the system is negatively related to each parameter and decreases with the increase in the failure rate of each component, and components with a significant trend of change have a greater impact on system reliability.

3.2. Reliability Analysis Based on Sequential Binary Decision Diagrams

Sequential binary decision diagrams can also be used to analyze dynamic fault trees containing various logical gates such as priority and standby gates [15]. In order to verify the effectiveness and accuracy of the method in this paper, the method is compared with the sequential binary decision diagram method. In a dynamic fault tree, the failure sequence relationship of logic gate input events has a significant impact on system failure, so the relational notation will be used to describe the timing relationship of the basic events. For example, A → B means that event A occurs before event B. A~B means that events A and B occur simultaneously. The following is a brief description of the spare parts gate timing logic used in dynamic fault trees.
(1).
Cold Standby Gates
The cold standby gates are regarded as having no consumption before entering the working state, so the failure rate is 0, and the reserve events must be selected to fail sequentially according to the sequence, whose algebraic description is A → B.
(2).
Hot Standby Gates
The backup events of hot standby gates have the same probability of failure during the reserve and active states. When the coverage of the standby structure is not considered, the hot standby gate is equivalent to a parallel structure.
Convert the dynamic fault tree in Figure 2 to the sequential binary decision diagram in Figure 7.
Analyzing the sequential binary decision diagram in Figure 7, 21 failure paths of system disjunction can be obtained, and the specific paths are shown in Table 3.
The life of the components in the cold standby gate are X5 and X6, and they are independent of each other, so the life of the cold standby gate is
X X 5 X 6 = X 5 + X 6
The failure rate of the cold standby gate (X5 → X6) is
F X 5 X 6 ( t ) = F 5 ( t ) * F 6 ( t )
The probability of occurrence of failure of each path is Oi (i = 1, 2,…, 21), where Oi denotes the probability of failure of path i. Therefore, the reliability function of the system is
R ( t ) = 1 ( O 1 + + O 21 )
Using Matlab to calculate the system failure probability and reliability in the time range 0–8000, the obtained variation curves are essentially the same as those transformed into dynamic Bayesian networks using dynamic fault trees.
System failure probability calculation under two methods is shown in Table 4 by selecting different task times.
The results of the two methods are compared to demonstrate the accuracy of the transformation of dynamic fault trees into dynamic Bayesian network methods. Moreover, compared with the method in this paper, for dynamic fault trees containing spare parts, the sequential decision diagram method is affected by the transformation method and suffers from problems such as node redundancy and excessive size, thus reducing the effectiveness of dynamic fault tree qualitative analysis. In contrast, the dynamic Bayesian network-based method can provide a general fault tree transformation method with high computational efficiency and save computing time, which is more suitable for complex dynamic fault tree analysis with more spare parts.

4. Conclusions

In this paper, a dynamic fault tree model of the automotive airbag system is established. Secondly, the discussion in this paper focuses on constructing continuous Bayesian networks with the help of unit step functions and impulsive functions, and an in-depth analysis of the transformation of dynamic logic with AND/OR gates is carried out. The results prove that the transformation of the dynamic fault tree model into a continuous-time Bayesian network model is feasible and can reduce the problem of the dynamic Bayesian network model being too computationally intensive when dealing with complex systems. Finally, after transforming the dynamic fault tree model of an automotive airbag into a Bayesian network, the reliability parameters of the system are analyzed and calculated. When each component of the system has a continuous failure process, the model construction method proposed in this paper can be used, and the reliability of the system at any moment can be further derived. Comparison with the sequential binary decision method shows that the method proposed in this paper can provide a scientific basis for the reasonable maintenance of airbag systems.
In future research, we will consider a maintenance policy that meets optimal replacement times and minimizes expected replacement costs based on system reliability.

Author Contributions

Conceptualization, H.D. and J.S.; methodology, H.D.; software, J.S.; validation, Y.-a.Z.; formal analysis, J.S.; investigation, H.D.; resources, Y.-a.Z.; data curation, J.S.; writing—original draft preparation, J.S.; writing—review and editing, H.D. and Y.-a.Z.; supervision, Y.-a.Z.; funding acquisition, H.D. All authors have read and agreed to the published version of the manuscript.

Funding

This research was funded by the Key Science and Technology Program of Henan Province (No. 222102520019), the Program for Science & Technology Innovation Talents in Universities of Henan Province (No. 22HASTIT022), the Program for young backbone teachers in Universities of Henan Province (No. 2021GGJS007).

Institutional Review Board Statement

Not applicable.

Informed Consent Statement

Not applicable.

Data Availability Statement

The authors confirm that the data supporting the findings of this study are available within the article.

Conflicts of Interest

The authors declare no conflict of interest.

References

  1. Shaout, A.; Mallon, C.A. Automotive airbag technology past, present and future. Int. J. Comput. Appl. Technol. 2000, 13, 159–171. [Google Scholar] [CrossRef]
  2. Yun, Y.-W.; Choi, J.-S.; Park, G.-J. Optimization of an automobile curtain airbag using the design of experiments. Proc. Inst. Mech. Eng. Part D J. Automob. Eng. 2014, 228, 370–380. [Google Scholar] [CrossRef]
  3. Lee, W.S.; Grosh, D.L.; Tillman, F.A.; Lie, C.H. Fault Tree Analysis, Methods, and Applications-A Review. IEEE Trans. Reliab. 1985, 34, 194–203. [Google Scholar] [CrossRef]
  4. Wang, Z.L. Current status and prospects of reliability systems engineering in China. Front. Eng. Manag. 2021, 8, 492–502. [Google Scholar] [CrossRef]
  5. Zuo, M.J. System reliability and system resilience. Front. Eng. Manag. 2021, 8, 615–619. [Google Scholar] [CrossRef]
  6. Si, S.B.; Zhao, J.B.; Cai, Z.Q.; Dui, H.Y. Recent advances in system reliability optimization driven by importance measures. Front. Eng. Manag. 2020, 7, 335–358. [Google Scholar] [CrossRef]
  7. Sinnamon, R.M.; Andrews, J.D. New approaches to evaluating fault trees. Reliab. Eng. Syst. Saf. 1997, 58, 89–96. [Google Scholar] [CrossRef]
  8. Dui, H.Y.; Tian, T.Z.; Zhao, J.B.; Wu, S.M. Comparing with the joint importance under consideration of consecutive-k-out-of-n system structure changes. Reliab. Eng. Syst. Saf. 2022, 219, 108255. [Google Scholar] [CrossRef]
  9. Dui, H.Y.; Wu, S.M.; Zhao, J.B. Some extensions of the component maintenance priority. Reliab. Eng. Syst. Saf. 2021, 214, 107729. [Google Scholar] [CrossRef]
  10. Zhou, C.C.; Chang, Q.; Zhao, H.D.; Ji, M.Y.; Shi, Z.K. Fault tree analysis with interval uncertainty: A case study of the aircraft flap mechanism. IEEE Trans. Reliab. 2021, 70, 944–956. [Google Scholar] [CrossRef]
  11. Wang, B.; Wu, D.D.; Mo, Y.C.; Chen, Z.Y. Dynamic fault tree analysis based on multiple-valued decision diagrams. Comput. Sci. 2016, 43, 70–73. [Google Scholar]
  12. Kabir, S. An overview of fault tree analysis and its application in model based dependability analysis. Expert Syst. Appl. 2017, 77, 114–135. [Google Scholar] [CrossRef] [Green Version]
  13. Yevkin, O. An efficient approximate Markov chain method in dynamic fault tree analysis. Qual. Reliab. Eng. Int. 2016, 32, 1509–1520. [Google Scholar] [CrossRef]
  14. Antoine Rauzy, A.; Blériot-Fabre, C. Towards a sound semantics for dynamic fault trees. Reliab. Eng. Syst. Saf. 2015, 142, 184–191. [Google Scholar] [CrossRef] [Green Version]
  15. Xing, L.D.; Tannous, O.; Dugan, J.B. Reliability analysis of nonrepairable cold-standby systems using sequential binary decision diagram. IEEE Trans. Syst. Man Cybern.-Part A Syst. Hum. 2012, 43, 715–726. [Google Scholar] [CrossRef]
  16. Boudali, H.; Crouzen, P.; Stoelinga, M. A rigorous, compositional, and extensible framework for dynamic fault tree analysis. IEEE Trans. Dependable Secur. Comput. 2010, 7, 128–143. [Google Scholar] [CrossRef]
  17. Walker, M.; Papadopoulos, Y. Qualitative temporal analysis: Towards a full implementation of the fault tree handbook. Control Eng. Pract. 2009, 17, 1115–1125. [Google Scholar] [CrossRef]
  18. Pang, J.H.; Dai, J.K.; Li, Y. An Intelligent Fault Analysis and Diagnosis System for Electromagnet Manufacturing Process Based on Fuzzy Fault Tree and Evidence Theory. Mathematics 2022, 10, 1437. [Google Scholar] [CrossRef]
  19. Yang, S.; Su, K.J.; Wang, B.; Xu, Z.T. A Coupled Mathematical Model of the Dissemination Route of Short-Term Fund-Raising Fraud. Mathematics 2022, 10, 1709. [Google Scholar] [CrossRef]
  20. Zhang, M.Y.; Zhang, D.; Goerlandt, F.; Yan, X.P.; Kujala, P. Use of HFACS and fault tree model for collision risk factors analysis of icebreaker assistance in ice-covered waters. Saf. Sci. 2019, 111, 128–143. [Google Scholar] [CrossRef]
  21. Dui, H.Y.; Xu, Z.; Chen, L.W.; Xing, L.D.; Liu, B. Data-Driven Maintenance Priority and Resilience Evaluation of Performance Loss in a Main Coolant System. Mathematics 2022, 10, 563. [Google Scholar] [CrossRef]
  22. Amin, M.T.; Imtiaz, S.; Khan, F. Process system fault detection and diagnosis using a hybrid technique. Chem. Eng. Sci. 2018, 189, 191–211. [Google Scholar] [CrossRef]
  23. Bai, G.H.; Wang, H.; Zheng, X.Q.; Dui, H.Y.; Xie, M. Improved resilience measure for component recovery priority in power grids. Front. Eng. Manag. 2021, 8, 545–556. [Google Scholar] [CrossRef]
  24. Dui, H.Y.; Zheng, X.Q.; Wu, S.M. Resilience analysis of maritime transportation systems based on importance measures. Reliab. Eng. Syst. Saf. 2021, 209, 107461. [Google Scholar] [CrossRef]
  25. Bobbio, A.; Portinale, L.; Minichino, M.; Ciancamerla, E. Improving the analysis of dependable systems by mapping fault trees into Bayesian networks. Reliab. Eng. Syst. Saf. 2001, 71, 249–260. [Google Scholar] [CrossRef]
  26. Wei, J.; Xie, W.; Nie, Y. An algorithm based on loop-cutting contribution function for loop cutset problem in Bayesian network. Mathematics 2021, 9, 462. [Google Scholar] [CrossRef]
  27. Zhao, X.F.; Cai, J.J.; Mizutani, S.; Nakagawa, T. Preventive replacement policies with time of operations, mission durations, minimal repairs and maintenance triggering approaches. J. Manuf. Syst. 2021, 61, 819–829. [Google Scholar] [CrossRef]
  28. Zhao, X.F.; Li, B.T.; Mizutani, S.; Nakagawa, T. A revisit of age-based replacement models with exponential failure distributions. IEEE Trans. Reliab. 2021, 71, 3111682. [Google Scholar] [CrossRef]
  29. Cai, B.P.; Liu, Z.K.; Zhang, Y.W.; Fan, Q.; Yu, S.L. Dynamic Bayesian Networks Based Performance Evaluation of Subsea Blowout Preventers in Presence of Imperfect Repair. Expert Syst. Appl. 2013, 40, 7544–7554. [Google Scholar] [CrossRef]
  30. Wang, C.; Liu, Y.P.; Hou, W.; Yu, C.; Wang, G.R.; Zheng, Y.Y. Reliability and Availability Modeling of Subsea Autonomous High Integrity Pressure Protection System with Partial Stroke Test by Dynamic Bayesian. J. Risk Reliab. 2021, 235, 268–281. [Google Scholar] [CrossRef]
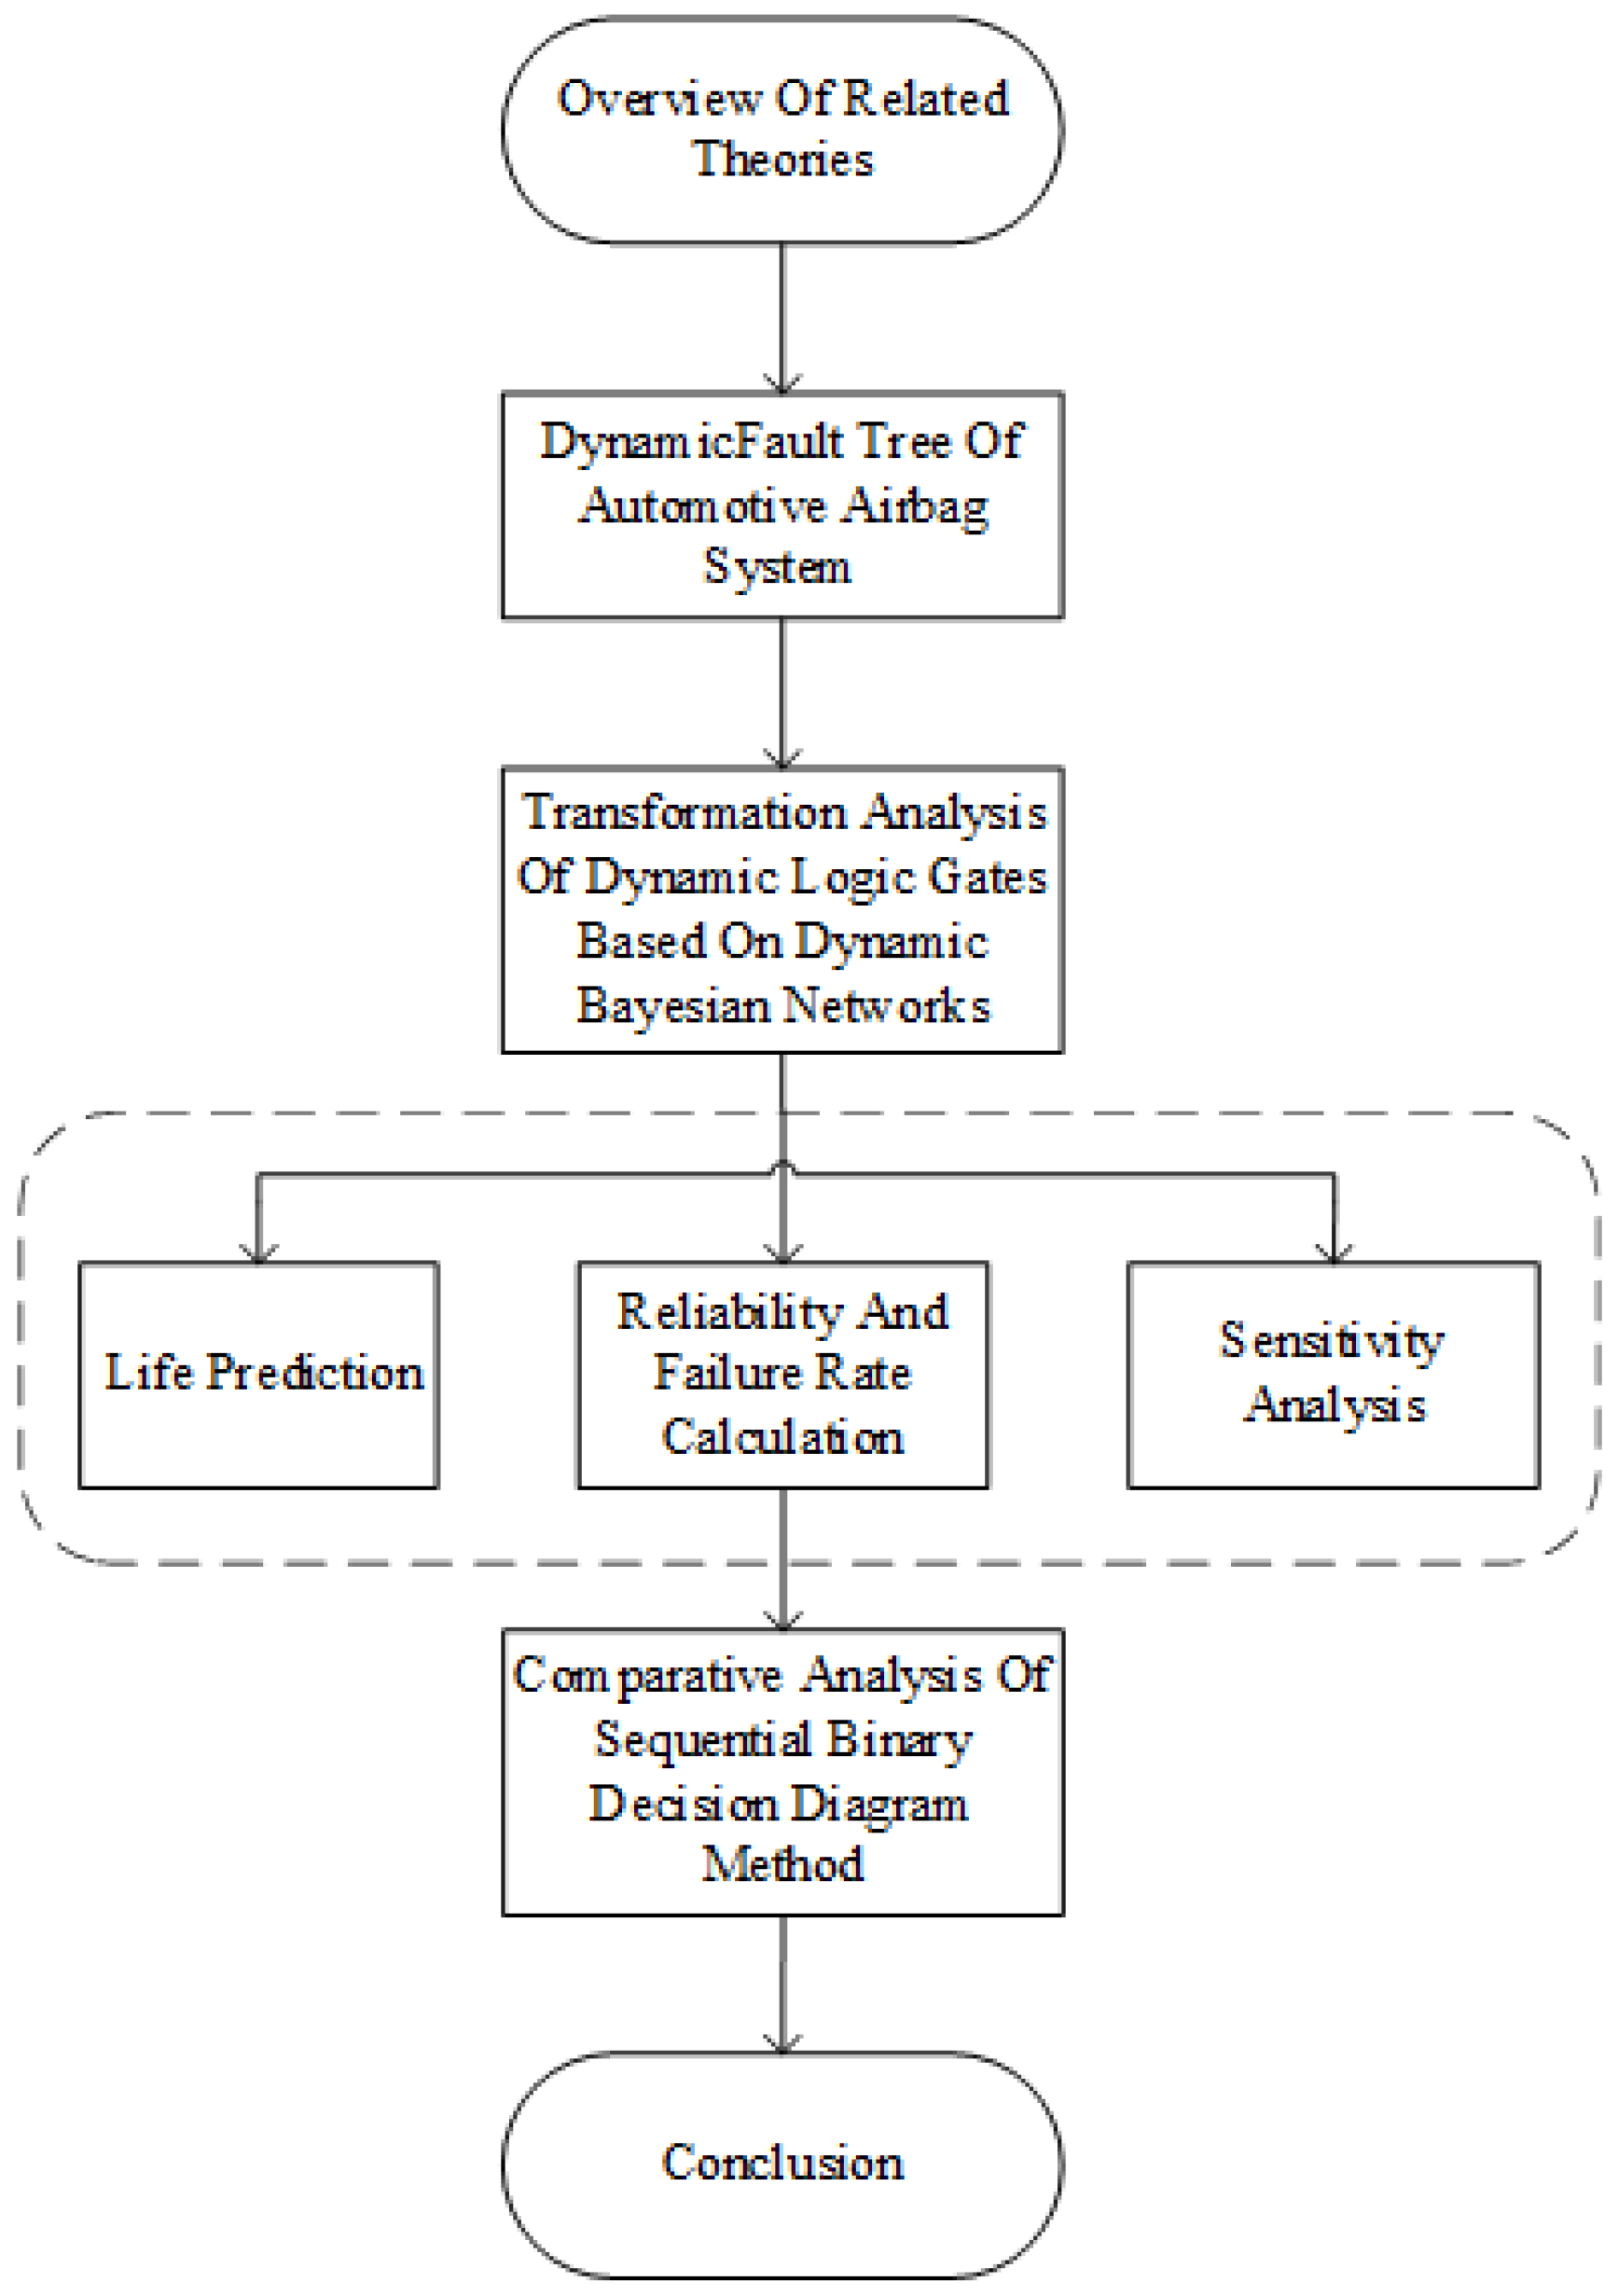
Figure 1. Structure of the article.
Mathematics 11 00434 g001
Figure 2. Dynamic fault tree of automotive airbag system.
Mathematics 11 00434 g002
Figure 3. System structure of automotive airbag system.
Mathematics 11 00434 g003
Figure 4. Equivalent Bayesian network model for automotive airbag systems.
Mathematics 11 00434 g004
Figure 5. Reliability change for automotive airbag systems.
Mathematics 11 00434 g005
Figure 6. Service life changes with reliability.
Mathematics 11 00434 g006
Figure 7. The binary decision diagram of automobile airbag system.
Mathematics 11 00434 g007
Table 1. Table of symbol meanings and their failure distribution in dynamic fault trees.
SymbolsMeaningDistribution FunctionsFailure Rate
ZAirbag system failure
Y1Sensor failure
Y2Gas generator failure
Y3Electronic control unit failure
Y4Failure of ignition transfer
Y5Failure of electric ignition device
X1Sensor 1 failureIndex distributionλ1 = 1.06 × 10−5
X2Sensor 2 failureIndex distributionλ2 = 1.06 × 10−5
X3Internal filter failureIndex distributionλ3 = 1.5 × 10−5
X4External filter failureIndex distributionλ4 = 2.9 × 10−5
X5Power circuit failureIndex distributionλ5 = 2.7 × 10−5
X6Backup power circuit failureIndex distributionλ6 = 2.7 × 10−5
X7Bridge wire failureIndex distributionλ7 = 2.9 × 10−5
X8Fire transmission hole failureIndex distributionλ8 = 3.8 × 10−5
X9Flame extender failureIndex distributionλ9 = 1.06 × 10−5
X10Ignition powder failureIndex distributionλ10 = 1.06 × 10⁻⁵
Table 2. Probability of failure and reliability of automotive airbag systems.
T (h)1000500010,00015,00020,00025,000
FZ(t)0.10540.43360.68680.83020.90950.9524
RZ(t)0.89460.56640.31320.16980.09050.0476
Table 3. Failure paths of automotive airbag systems.
No.Failure PathsNo.Failure Paths
1 X 1 ¯ · X 2 ¯ 12 X 1 · X 3 · X 9 · X 7 · X 8 ¯
2 X 1 · X 3 ¯ 13 X 1 · X 3 · X 9 ¯ · X 10 · X 7 · X 8 ¯
3 X 1 ¯ · X 2 · X 3 ¯ 14 X 1 ¯ · X 2 · X 3 · X 9 · X 7  
X 8 · X 4 ¯
4 X 1 ¯ · X 2 · X 3 · X 9 ¯ · X 10 ¯ 15 X 1 ¯ · X 2 · X 3 · X 9 ¯ · X 10  
X 7 · X 8 · X 4 ¯
5 X 1 · X 3 · X 9 ¯ · X 10 ¯ 16 X 1 · X 3 · X 9 · X 7 · X 8 · X 4 ¯
6 X 1 ¯ · X 2 · X 3 · X 9 · X 7 ¯ 17 X 1 · X 3 · X 9 ¯ · X 10 · X 7 · X 8 · X 4 ¯
7 X 1 ¯ · X 2 · X 3 · X 9 ¯ · X 10 · X 7 ¯ 18 X 1 ¯ · X 2 · X 3 · X 9   ·   X 7  
X 8 · X 4 · ( X 5 X 6 )
8 X 1 · X 3 · X 9 · X 7 ¯ 19 X 1 ¯ · X 2 · X 3 · X 9 ¯ · X 10   ·   X 7  
X 8 · X 4 · ( X 5 X 6 )
9 X 1 · X 3 · X 9 ¯ · X 10 · X 7 ¯ 20 X 1 · X 3 · X 9 · X 7 · X 8  
X 4 · ( X 5 X 6 )
10 X 1 ¯ · X 2 · X 3 · X 9 · X 7 · X 8 ¯ 21 X 1 · X 3 · X 9 ¯ · X 10 · X 7 · X 8
11 X 1 ¯ · X 2 · X 3 · X 9 ¯ · X 10   · X 7 · X 8 ¯ X 4 · ( X 5 X 6 )
Table 4. Failure probability of automotive airbag systems under two methods.
t1000500010,00015,00020,00025,000
BN0.10540.43360.68680.83020.90950.9524
BDD0.10570.43800.69510.83890.91670.9576
Error analysis0.28%1.01%1.2%1.04%0.79%0.54%
Disclaimer/Publisher’s Note: The statements, opinions and data contained in all publications are solely those of the individual author(s) and contributor(s) and not of MDPI and/or the editor(s). MDPI and/or the editor(s) disclaim responsibility for any injury to people or property resulting from any ideas, methods, instructions or products referred to in the content.