Article

Modeling of Project Portfolio Risk Evolution and Response under the Influence of Interactions

School of Economics and Management, Chang’an University, Xi’an 710064, China
*
Author to whom correspondence should be addressed.
Mathematics 2023, 11(19), 4091; https://doi.org/10.3390/math11194091
Submission received: 5 August 2023 / Revised: 14 September 2023 / Accepted: 25 September 2023 / Published: 27 September 2023

Abstract

:
Due to dynamic changes in both internal and external environments, the risk evolution of the project portfolio (PP) becomes extremely complicated, thereby increasing the difficulties of effective risk response. In particular, the real-time influence of risk interactions on the evolution of project portfolio risk (PPR) often goes unnoticed. Meanwhile, risk contagiousness is completely ignored in risk response. To tackle this challenge, this study proposes a PPR evolution and response (PPRER) model by improving the Barrat–Barthelemy–Vespignani (BBV) model and by introducing the evolutionary dynamics method into the PPR response research. The feasibility and applicability of the proposed model are verified through a numerical illustration. Computational results demonstrate that the proposed model can simulate the evolution process of PPRs under the influence of their interactions and give a snapshot of the real-time interactive relationship between PPRs. Based on the obtained results, decision-makers can take effective risk responses by identifying critical strategy intrusion nodes at any time in the evolution process.

1. Introduction

There has been increased awareness of the importance of a project portfolio (PP) to achieve enterprises’ objectives in a multi-project environment [1]. PP was defined by the Project Management Institute [2] as a collection of components, including projects, programs, and other work, to meet strategic business objectives. Various factors and interdependences among the different components make the PP very complicated [3]. The complexities in PP’s long-term operations lead to numerous risks. Project portfolio risk (PPR) is a complex system [4] because PPR is not equal to the sum of the individual project risks [5]. Additional risks can be caused due to the correlation property of the PP and the interactions between projects in the PP. The interactions between PPRs will affect their connection probability [6,7], thus increasing or decreasing their value and changing their evolution. Hatefi [8] believes that the complex interaction between different risks intensifies the uncertainty and complexity of risk events, which in turn increases the difficulty of PP management. Furthermore, the types of PPRs and the interaction relationships between them will change dynamically along with the PP implementation. Specifically, different types of PPRs may arise at different times during the PP implementation, and the interactions between different types of PPRs are diverse [9]. However, existing studies appear to focus on assessing PPRs from a static perspective [10,11], ignoring the dynamic changes of PPRs themselves and their interactions with time. Thus, how to help managers achieve dynamic monitoring and management of PPRs remains a challenge.
Risk evolution is a tool that can capture the dynamic characteristics of risks and improve the scientificity of decision-making in risk management [12]. The existing research on risk evolution mainly focused on a single project [13,14,15,16], whereas the exploration among projects in the PP is very limited. These studies regarded the projects as risk carriers and assigned different risk attributes to them. Then, they explored the evolution of PPRs by analyzing the evolution process of these different projects with different interactive relationships [17,18]. However, they did not directly explore the evolution process of the PPRs, which cannot obtain the real-time changes of risk contagion and risk value. What’s more, they ignored the interactive relationships between PPRs. Therefore, simulating the evolution process of PPRs dynamically with time by analyzing their interactions in this process is a research gap that needs to be addressed.
Either the static assessment or the dynamic evolution exploration of PPRs, the ultimate purpose is to take risk response measures. Risk response can directly influence the reduction of risk exposure, whereas if it is not properly performed, the effect of risk identification and risk assessment will be diminished [19,20]. Existing studies only proposed critical risk response strategies based on static assessment results [21,22], which is unsuitable for dynamic risk networks due to the PPR network structure and the constant change of the importance of risks at different times. In addition, risk contagiousness is likely to cause chain failure between projects and affect the stability of the system [23]. Due to the contagious character of risks, PPR response measures are also contagious, which has been neglected in the existing research. It is obvious that enterprises are in dire need of a method that can respond at any time to critical PPRs, considering the contagiousness of response measures.
It is recognized that real-world scenarios or case studies where lack of consideration for addressing risk interactions and contagiousness would lead to unfavorable outcomes. This study attempts to fill the above research gaps in PPRs evolution and response by answering the following research questions:
  • RQ1: How can the evolution process of PPRs under the influence of interactions be explored?
  • RQ2: How can dynamic responses to PPRs be achieved?
To address these questions, this study aims to propose a model that can not only simulate the evolution process of PPRs and give a snapshot of the interactive relationship between PPRs at any time but also take risk response by identifying critical strategy intrusion nodes at any time in the evolution process. To this end, this study resorts to a classic network evolution model in complex networks named BBV that was introduced by Barrat Alain, Barthelemy Marc, and Vespignani Alessandro in 2004. The model is capable of indicating the complex evolution process of networks by establishing the mechanism for the addition of new nodes and the associated edges. Specifically, this study first improves the BBV model by redefining the attachment principles, adjusting the weight evolution process, and adding the network stability principle. Then, the improved model is employed to achieve the PPRs evolution function. Next, the PPRs response function is developed through the evolutionary dynamics model. Combining the above steps, the risk evolution and response (PPRER) model is constructed. Finally, using the proposed PPRER model, the evolution process of PPRs in real-time is simulated, and the critical risk strategy intrusion nodes are identified to achieve dynamic responses to PPRs.
The contributions of this study to the literature are threefold. First, this study fills the research gap on “how PPR evolves in a complex interaction environment”. Second, the applications of the evolutionary dynamics method are extended to project risk management research. Third, a new model that can help enterprises simulate the evolution of PPRs and deal with them dynamically is proposed.
The outline of this study is as follows. In Section 1, a PPRER model is constructed. In Section 2, a numerical example is employed to demonstrate the applicability of the proposed model. In Section 3, the theoretical and practical implications of this study are discussed. The conclusions are presented in Section 4.

2. Literature Review

PPs are exposed to plenty of risks over the long term due to the uncertainty and dynamism in the market environment where they are situated and the complexity arising from the multitude of internal components within them [24]. Furthermore, on account of the close interdependence of projects concerning objectives and returns, there is a tightly woven network of interactive relationships [3]. These complex interactions among projects in a PP cause additional risks that are different from those associated with individual projects. These risks could alter the frequency of PPR incidents and affect PPs’ losses [4]. This has increased the demand for effective PPR management mechanisms [6]. Previous research has predominantly focused on the interaction of project risks [7,8], making it challenging to provide guidance for scientific decision-making in PPR management and control. Recognizing this, some scholars have conducted related studies on PPR interactions. Yang et al. [25] constructed a dual-layer network model titled “Project Portfolio-Risk” and proposed a quantitative analysis method for PPR based on the random walk algorithm, allowing the assessment and ranking of PPRs. Guan et al. [5], utilizing Bayesian network structural learning algorithms, developed an effective tool for assessing the degree of risk reduction. Similarly, taking into account the influence of PPR interaction relationships, Bai et al. [10] established a Bayesian network model based on risk interactions, facilitating the effective evaluation and analysis of critical PPRs. All of the above studies consider the interaction between PPRs. However, they assess PPRs from a static rather than a dynamic perspective.
Evolution, as a dynamic assessment tool, plays a crucial role in understanding the trends in risks and improving decision efficiency [12]. Based on the principles of risk evolution, Biffl et al. [13] introduced a risk assessment model for software and systems engineering projects. Taking into account the impact of uncertainty in project management on risk evolution [15], Wang et al. [14] selected typical failure evolution processes and constructed a dynamic simulation model for risk evolution based on system dynamics. Wang et al. [16] established a social risk evolution model based on society burning theory to quantitatively depict the risk dynamic evolutionary process. In order to research the evolution process of social risk of large hydraulic project construction, Guo et al. [17] established a social risk evolution model based on society burning theory to quantitatively depict the risk dynamic evolutionary process. Zhao et al. [18] incorporated the interaction relationship into the portfolio risk study and analyzed the complexity and evolution of the portfolio interaction risk network. The aforementioned studies have explored risk evolution from multiple perspectives but ignored the interactions between PPRs.
Risk response is particularly important for PPR management in both dynamic and static environments. Zhang et al. [19] constructed an optimization model for selecting risk response strategies considering the expected risk loss, risk interdependence, and its two directions. Fan et al. [20] proposed a pragmatic method for generating project risk response strategies based on case-based reasoning. Mican et al. [21] focused on the development of a method for project portfolio risk assessment that considers both risk factor interdependencies and their impacts on the strategic objectives as a network. However, the above studies failed to consider PPR assessment in a dynamic environment.
In addition, contagion between risks also has impacts on the results of the PPR assessment. Li et al. [23] analyzed the contagiousness of corruption risks in construction projects in groups by building a risk contagion analysis model. However, this article only considered the impact of risk contagion regarding project risk assessment, ignoring the important role of risk contagion in PPR assessment. To our knowledge, considering risk contagion as a feature in the field of PPR is still a research gap.
A comparison of the existing works with this study is summarized in Table 1.

3. Project Portfolio Risk Evolution and Response Model

In this section, this study proposes a PPRER model to dynamically simulate the evolution of PPRs, as well as explore the complex interactive relationships between the PPRs to deal with PPRs in real-time. To be specific, by improving the BBV model, the PPRs evolution function of the PPRER model is constructed for the first time. Next, the evolution dynamics model is adapted to identify critical risk strategy intrusion nodes to construct the PPRs response function of the PPRER model. The model construction framework is shown in Figure 1.

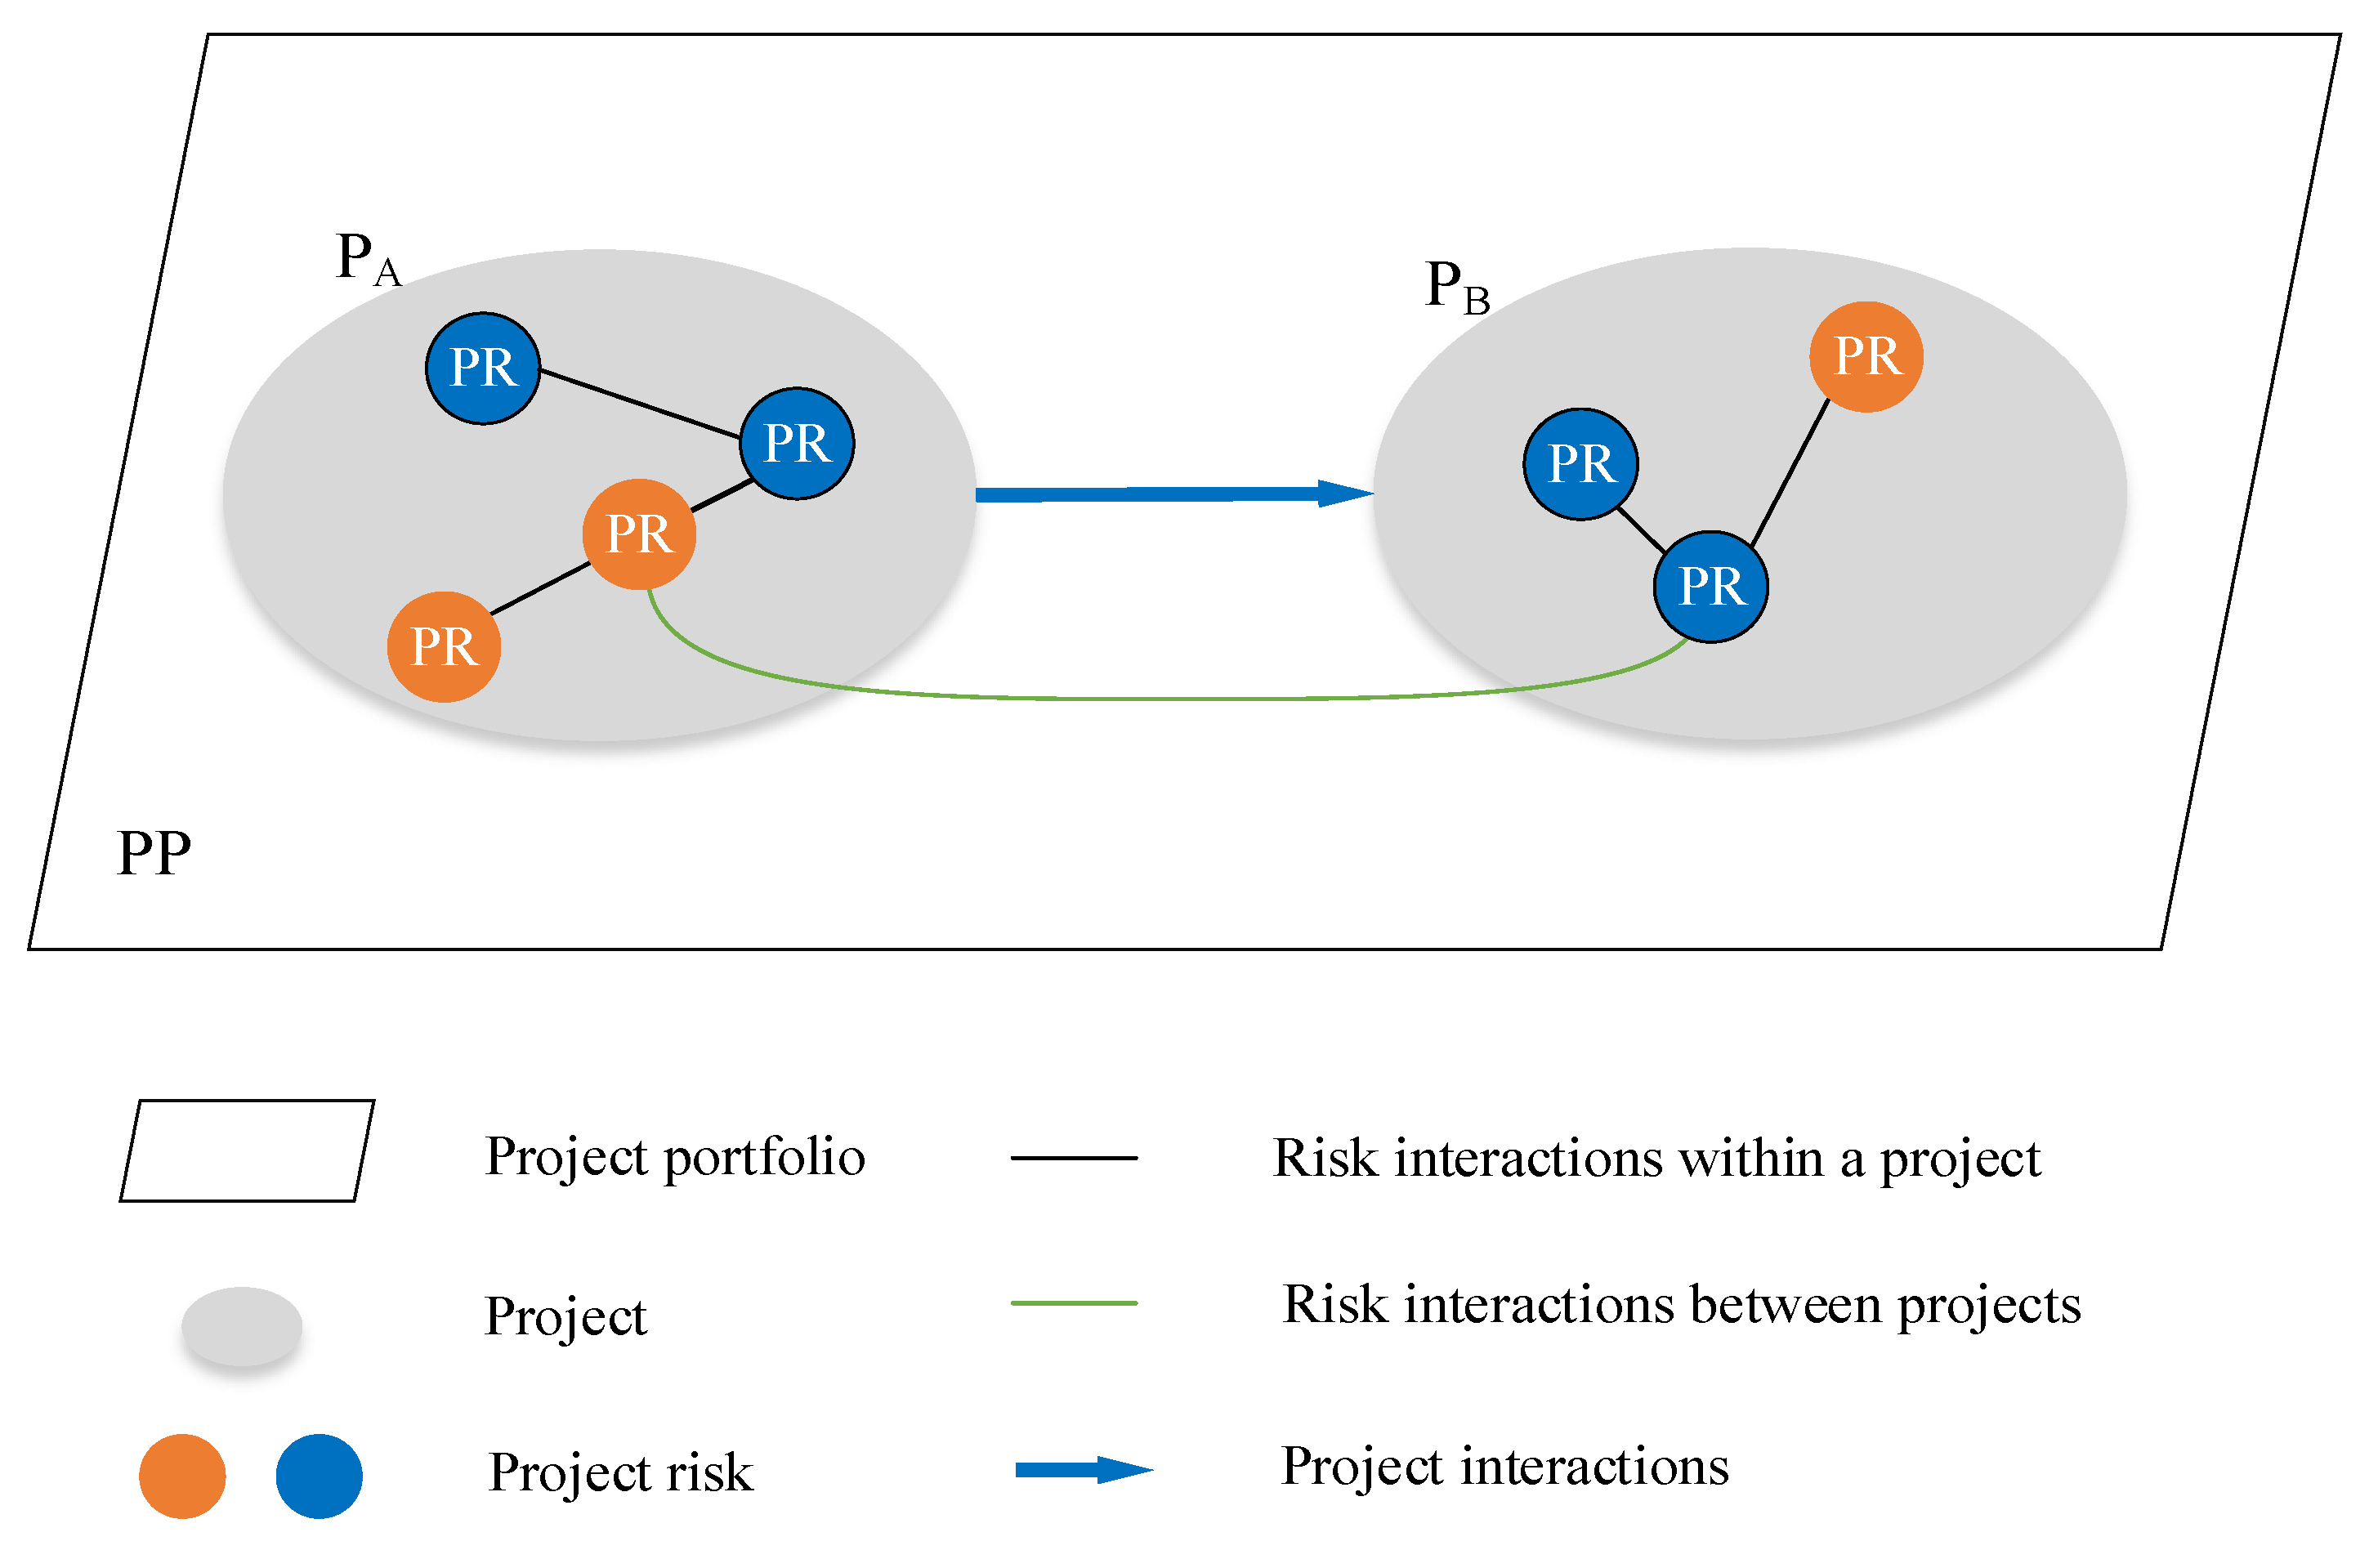
3.1. Construction of PPRs Evolution Function

A network is a common way of dissecting complex relationships between individuals. Some scholars have introduced complex networks to analyze risks in project risk management, such as risk propagation [22,26,27,28] and risk evolution [29,30]. The PPR evolution network (PPREN) is essentially an interactive network driven by project interactions [17]. As different kinds of risks with different interactive relationships can influence the combined effect of risks [31], the differences in these interactive relationships should be fully considered when constructing PPREN. In this study, the PPREN will be modeled as a graph G (V, E), where V = {1, 2, …, n} represents the set of nodes (i.e., risks in the PPREN), and E = e i j | i , j V represents the set of edges (i.e., the interactive relationships between risks), respectively.
According to the existing studies on project risk evolution, the project risk network follows power-law distribution [32]. Analogically, PPREN has the same characteristic. Specifically, in the initial stage, networks are characterized by a small number of PPRs with fewer interactions. As the network develops, one or more core risk groups may form due to the risk growth and preferential attachment of PPRs. Additionally, considering that the interaction degree among risks is different and the changes in network weights due to the contagiousness of risks, the PPREN can be treated as a network with varying weights. Specifically, the PPRs will establish (or remove) a connection with the original PPRs, resulting in the weight changes of other PPRs associated with them. BBV model is characterized by varying weights and scale-free that are consistent with the evolution characteristics of PPRs. This motivates the construction of the PPREN on its basis [33].
  • Step 1: Initialization
The initial PPREN consists of a small number ( N 0 ) of vertices connected by links with the assigned weight W 0 .
  • Step 2: Definition of attachment principles
Different node attachment modes within a network result in varying connection strengths, which will affect the PPR evolution process and the change of PPR value in the PPREN. To better simulate the evolution process, it is necessary to understand the PPR evolution mechanism, which is defined as the attachment principle in this study. In the original BBV model, the connection probability between the newly added node and the original nodes in the network is obtained according to the strength of preferential attachment mechanisms. Whereas, in the evolution of actual PPRs, the interaction between PPRs will be caused by the contagiousness and variability of PPRs themselves and the interactions between projects in the PP. Thus, this study modifies the node connection mechanism in the original BBV model, i.e., the newly added risks will be first attached to those with interactive relationships between them and then to the high-strength risk nodes.
The interaction strengths between different types of risks are different. The main sources of PPRs consist of three aspects: the basic risks of individual projects within a portfolio, the interactions between projects within a PP, and the correlation property of the PP [2,17]. Therefore, the PPRs are divided into three parts: individual project risks (PRs), project interactive risks (PIRs) within a PP, and project portfolio-level risks (PPLRs) to define the attachment principles in this study.
An abbreviation legend aiming to help illustrate these abbreviations is presented in Appendix A.
(1) 
Definition of the attachment principles of PRs
The interactions between PRs include those within a project and between different projects. The former is caused by the contagiousness and variability of risks, while the latter is caused by the interactions between projects within the PP. For example, project A (PA) may be delayed due to a lack of available resources (caused by the infectious nature of the risk). This delay may affect the progress of project B (PB), whose proper implementation must depend on the resources generated by project A. This means that there is an interaction between PA and PB.
The existing studies have mainly focused on the determination of the PR interactions within a project (interested readers are referred to [34,35,36] for details), but the PR interaction caused by project interaction is ignored. On the other hand, PR interaction assessment varies greatly according to experts’ heterogeneity and subjectivity. It is necessary to derive consistent rules for PR interactions to explore the attachment principles of PRs.
Research on risk interaction showed that risks in the same cluster are more likely to generate interactive relationships [37,38]. Therefore, the first attachment principle of PPREN is defined as:
  • P1: If the newly added risks are PRs, they will first be attached to those in the same cluster and then to the different clusters with a certain probability.
Namely, in a network with an initial size N 0 , a new PR node i, connecting to the existing node j, jN ( N N 0 ) with different weight W i j will be implanted each time. The probability P i p r s that the new node i is connected to node j is defined as (Figure 2):
Figure 2. PR interactions within or between projects (source: own elaboration).
Mathematics 11 04091 g002
P i p r s = K i j S j l A S l ,
K i j    = 1 ,        W h e n   n o d e   i   a n d   n o d e   j   a r e   f r o m   t h e   s a m e   r i s k   c l u s t e r 0 , 1 , W h e n   n o d e   i   a n d   n o d e   j   a r e   f r o m   t h e   d i f f e r e n t   r i s k   c l u s t e r s
where S j indicates the strength of node j, whose value equals the sum of weights between node j and its symbiotic partners. K i j represents the interaction coefficient between nodes in the PRs network. K i j = 1 means that there exists an interaction between nodes in the PPREN, in which node l, lA is in the same cluster as node j. When K i j 0 , 1 , there may be an interaction between nodes in the PRs network, in which node l, lA is in the different clusters from node j in the PPREN. Considering that the concept of PRs in this article refers to risk within and between projects, we make the following assumptions. Note that P i p r s > 0 when the PR interactions exist within projects or between projects; otherwise, P j p r s = 0.
(2) 
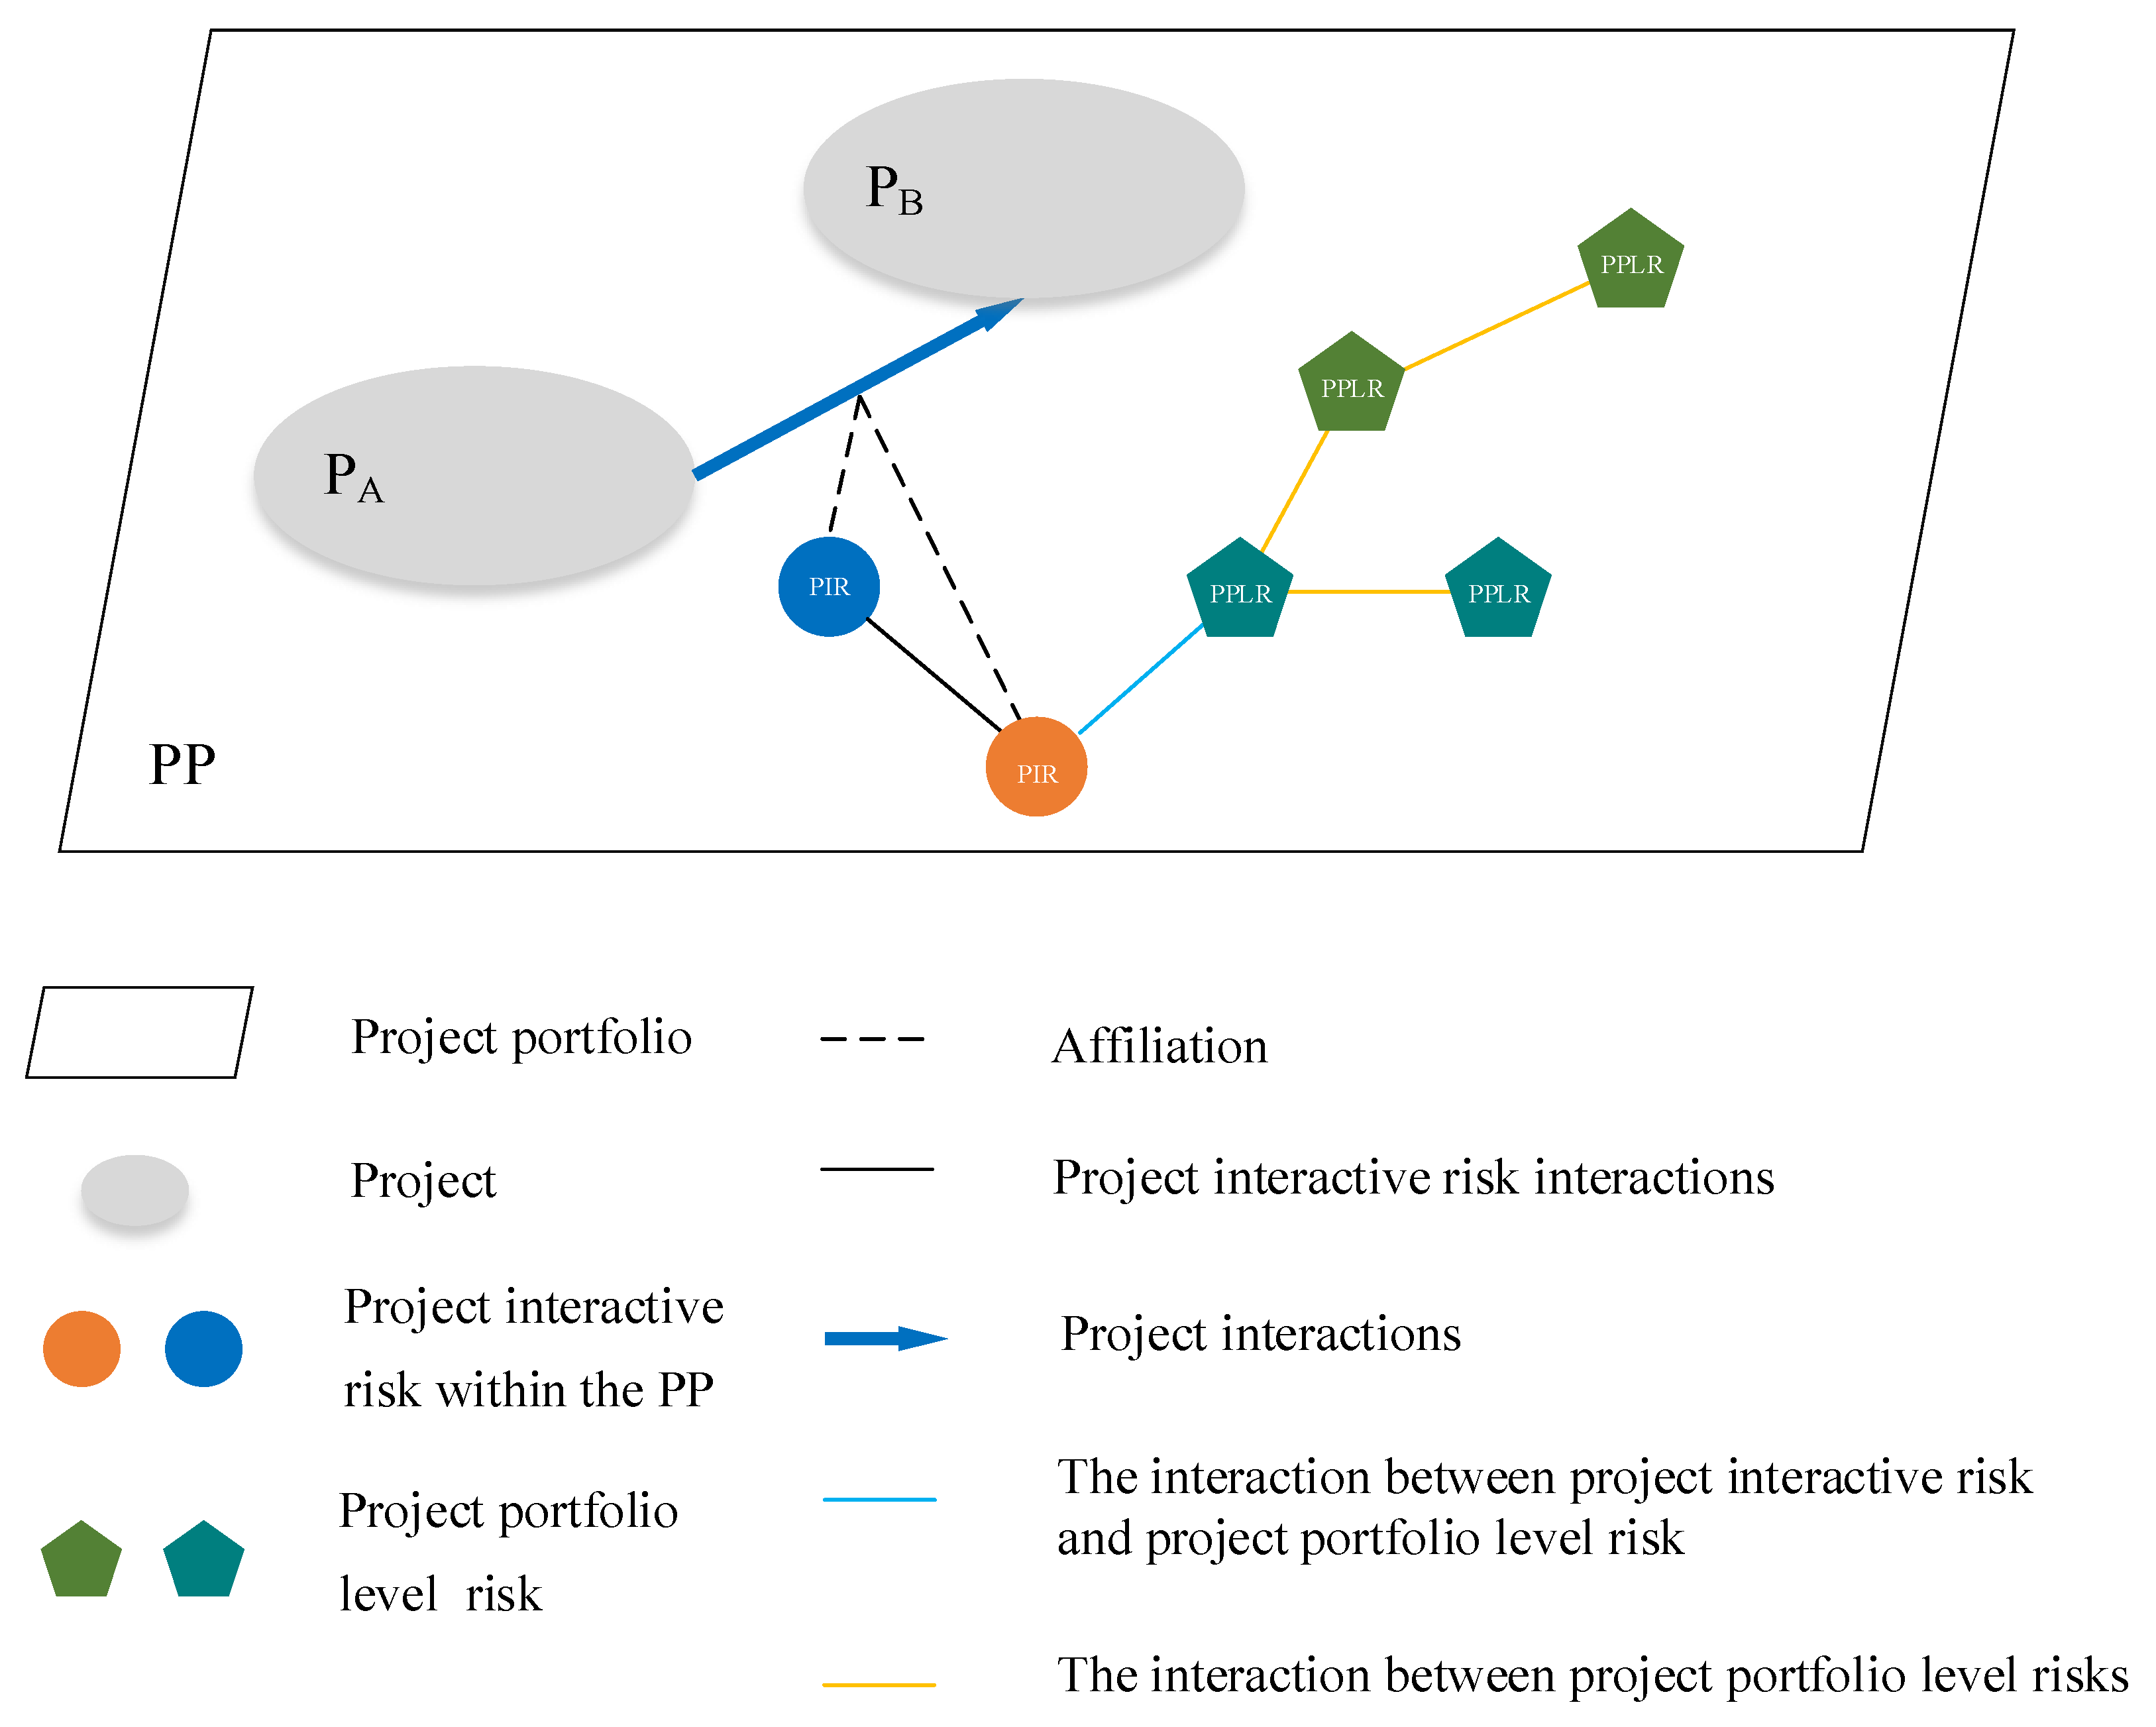
Definition of attachment principles of PIRs
The PIRs are those triggered by the negative implications of interaction effects between projects within a PP [39]. Specifically, the interactions between projects can be divided into three aspects: resources [40,41,42], technology [41,42], and value [43,44,45]. The positive interaction effect between projects creates project synergies that contribute to the success of the portfolio and, otherwise, create PIRs. For example, if projects are interrelated because of shared technologies, risks may arise from the lack of these technologies. Then, competition of these projects for the limited shared technologies may raise risks of conflicts among stakeholders or management processes. Currently, many studies focus on the positive effects of project interactions [45], but the negative effects are neglected and should be paid more attention to. Similar to PRs, PIRs arising from the same sources (resources interaction, technology interaction, and value interaction between projects) are more likely to have interaction effects. For instance, the lack of shared resources makes the competition between projects tougher, which leads to a greater occurrence likelihood of risks of conflicts among stakeholders.
Therefore, the second attachment principle of PPREN is defined as (Figure 3):
  • P2: If the newly added risks are PIRs, they will first be attached to those of the same source, and then to the different sources with a certain probability.
Namely, a new PIRs node i, connecting to the existing node j, jN ( N N 0 ) with the different weight W i j will be implanted each time. The probability P i p i r s that the new node will be connected to node j is defined as:
P i p i r s = K i j S j l B S l
K i j = 1 ,      n o d e   i   a n d   n o d e   j   a r e   f r o m   the   same   risk   source 0 , 1   , n o d e   i   a n d   n o d e   j   a r e   f r o m   the   different   risk   source  
where K i j indicates the interaction coefficient between nodes of the PIRs network. K i j = 1 means that there must be an interaction between PIRs in the PPREN, in which node l, lB is in the same source as node j. When K i j 0 , 1 , in which node l, lB is in the different source as node j. There are three sources of PIRs according to the above description in this study.
It should be noted that the interactions between PRs and PIRs are not included in this study. There is no direct interaction between them as PIRs arise from interactive activities among multiple projects, and PRs arise from the activities within a single project. For example, the PIR states that unreasonable resource allocation between projects is more likely to be affected by an unreasonable resource allocation plan or inadequate management capability than by risks within a project, such as a resource shortage or schedule delay.
(3) 
Definition of attachment principles of PPLRs
PPLRs refer to uncertain events or conditions that fail to meet the success criteria of a certain PP for the achievement of its objectives [46]. Specifically, they involve the risks that arise from the property of the PP and those that arise in the process of managing the PP [17]. Both of them are identified by exploring the negative implications for PP’s success and objectives by regarding the PP as a whole. Two kinds of risks are likely to interact with a PPLR, i.e., other PPLRs and PIRs. For example, lack of sharing or transparency in information that will increase the risk probability of choosing projects that are not aligned with the strategic objectives of the organization is one of the interactions between PPLRs. Meanwhile, the lack of transparency in information that will affect the PIR of misallocation of resources is one of the interactions between PPLR and PIR (Figure 4).
Note that PRs are identified from the single project perspective by isolating the relationship between projects, while PPLRs are identified from a holistic perspective that integrates multiple projects. Although PRs may lead to a slight increase in the probability of PPLRs, the impact is tiny. For example, the schedule deviation of a single project does not necessarily lead to the delay of the overall schedule of the portfolio. Therefore, the interactions between PRs and PPLRs are not included in this study.
The current research about PPLRs is limited, which makes it difficult to derive consistent interaction rules between them. Therefore, the attachment principles of PPLRs are defined according to the study results of Foroogh et al. [46]. In the PPRER model, PPLRs and PIRs are presented in Table 2 and Table 3, respectively. The interactions between PPLRs and the interactions between PPLRs and PIRs are presented in Table 4 and Table 5, respectively. Note that the information in Table 2, Table 3, Table 4 and Table 5 is common to any project portfolio.
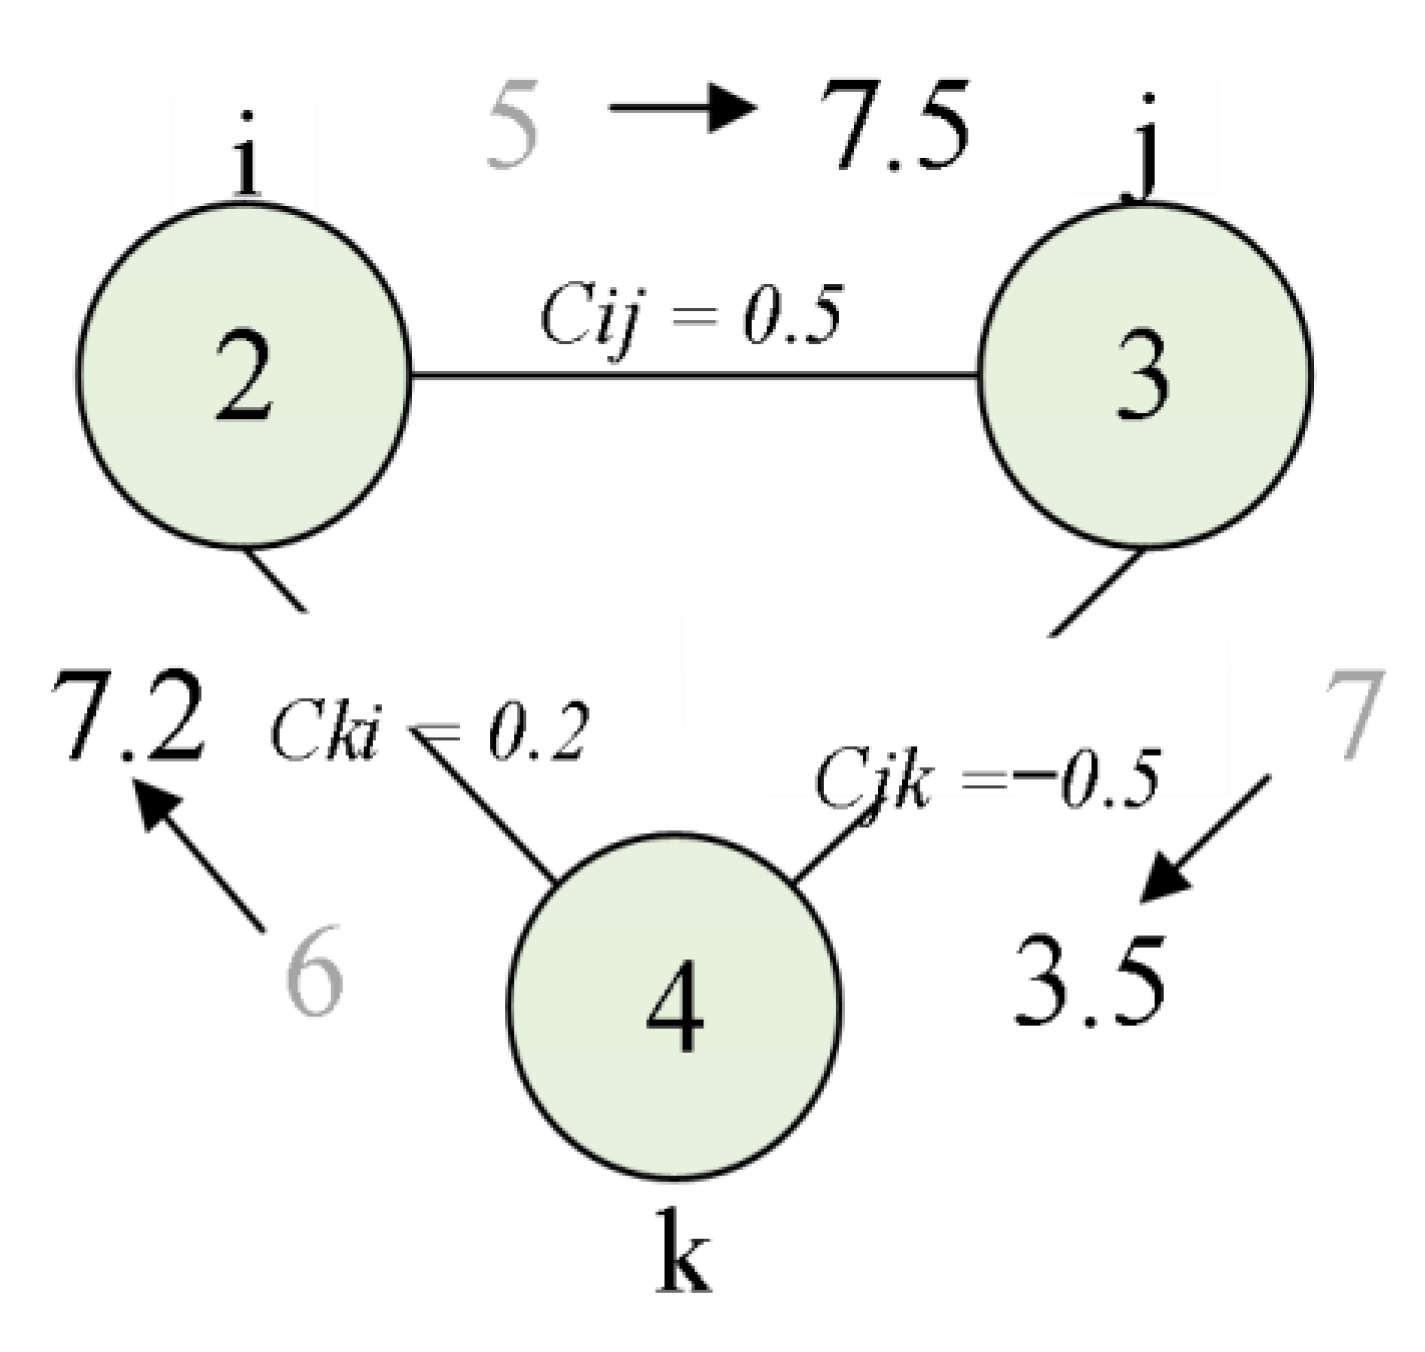
  • Step 3: Weight evolution
In the PPREN, the new node establishes connections with the first m existing nodes that have the highest connection probability. After the new node i is connected to node j, the strength of node j will increase W i j . Meanwhile, due to the influence of the new node, the strength of node j also has an additional increment δ, which will be proportionally distributed to the original symbiotic partner kV(j), where V(j) is the neighbor set of node j. The strength change is shown below:
W j k W j k + W j k
W j k = δ W j k S j
S j S j + W i j + δ
W i j = 1 + C i j × E i + E j × P i j
where C i j is the risk interaction coefficient, which indicates the promoting or inhibiting effect of the new node i on node j in PPREN, and 1 < C i j < 1   C i j 0 . E j indicates the risk value of node j to PP. P i j indicates the interaction probability between node j and the new node i. For example, if the risk value of node i, j, and k to a PP is 2, 3, and 4, respectively, then the sum of the risk value of node i and node j to the PP is 5. If C i j = 0.5, P i j = 1, the risk value combining node i with node j to the PP is 7.5 according to Equation (8). Similarly, other values are shown in Figure 5.
Different risks exist at different stages of the whole life cycle of projects or portfolios, some of which only occur at a specific stage. For example, the priority of the project is unreasonable and only occurs in the PP’s planning stage. In addition, the project that is finished or is eliminated from the portfolio will affect the projects that have interactions with it by making part of them disappear. Therefore, this study sets up the following exit conditions for risks:
(1)
The risk will exit from the PP when the stage of the life cycle of projects or PP changes. Managers should set the alternative nodes of each stage based on the schedule of PP.
(2)
When a project is finished or is eliminated from the portfolio, the PIRs arose by it, and its interactive projects will therewith exit from the PP.
When a node e exits from the PPERN, the strength between it and node j will decrease W e j . Meanwhile, a decreased value (σ) is then added to the traditional BBV model. The change of strength and the corresponding alteration in the weights of node kV(j) edges are shown as follows, where V(j) represents the neighbors set of node j:
W j k W j k W j k
W j k = σ W j k S j W e j
S j S j W e j σ
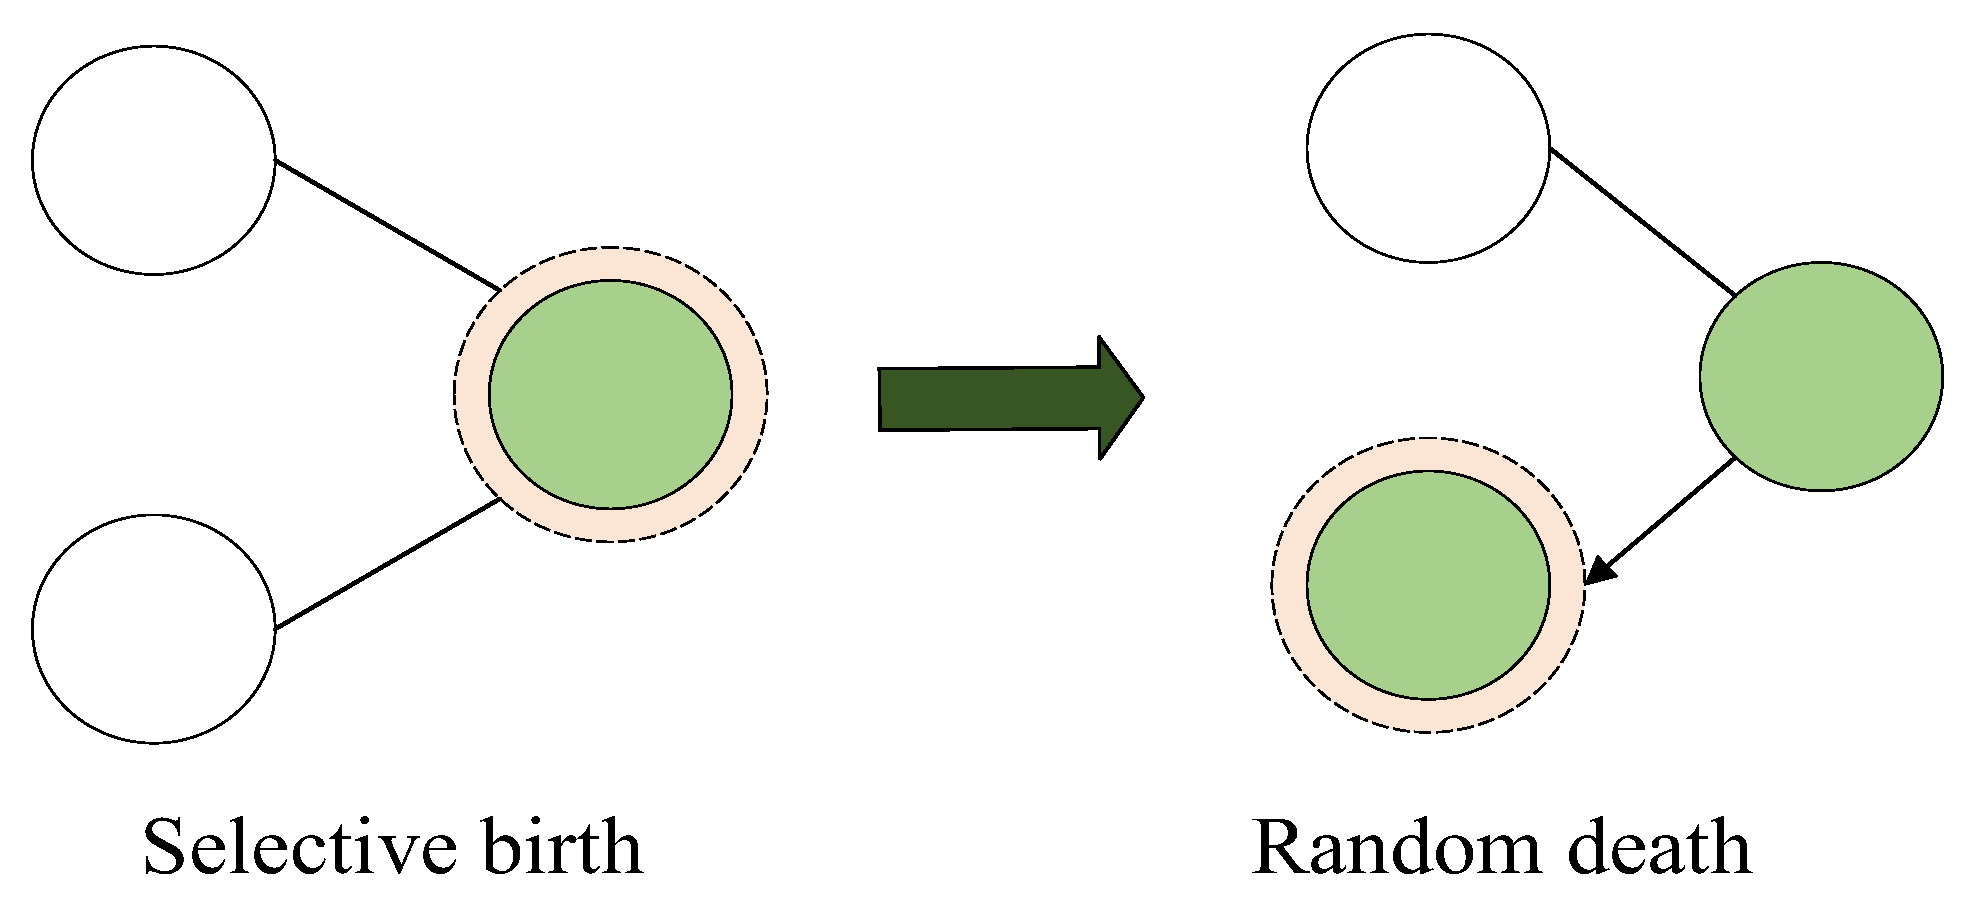
  • Step 4: Definition of stability principles
In a PP, risks do not increase indefinitely but are projected to settle to a value or a range to ensure the PP’s success. Therefore, this study introduces a risk threshold (α) to define the stability rules of the traditional BBV mode.
E t = t = 1 n W i j t + t = 1 n E n t α
where E n is the PPR value of isolated nodes.

3.2. Construction of PPRs Response Function

Through Section 3.1, the snapshot of the PPREN topology can be simulated in real-time. On this basis, it is necessary to take risk responses at different moments to intervene in the evolution of the PPREN. However, for a network with a large number of risks and complex interactions, it is impossible to adopt a targeted strategy for each node to control all the individual behaviors. A commonly used method in the existing research is to identify critical risks and then adjust the countermeasures to gradually influence the spread of other risks in the network.
In the process of the dynamic evolution of the complex networks, each individual will update its state according to the state of its neighboring nodes. For example, by adopting strategies for the identified critical risks, their neighboring nodes will also be infected by these strategies with different probabilities. This study utilizes the evolutionary dynamics method to classify the node status updates into two categories: the birth-death process and the death-life process. The former refers to selecting a node in the network with a probability proportional to the connection weight and then copying its strategy to the neighboring nodes randomly (as shown in Figure 6). The latter is to randomly select a node to be replaced and then copy to itself the strategy selected from the neighboring nodes of the replaced node with a probability proportional to the connection weight (as shown in Figure 7). These two states often simultaneously exist in the process of network evolution. Therefore, this section aims to identify critical strategy intrusion nodes under different state update rules via a dynamic evolution model to spread risk response strategies as fast as possible.
The identification of critical strategy intrusion nodes is essential to calculate the fixed probability of each node in the PPREN in the process of state updating. As the links between nodes in the PPREN have weights, the fixed probability of each node corresponds to the i-th element of the stable distribution of the random matrix MBD and MDB in the process of birth-death and death-life. The calculation of MBD and MDB are as follows:
M B D = m i j n × n m i j = w j i n w o u t j ,      when   i   j 1 1 n k = 1 ,   k i n w k i w o u t k , when   i = j
M D B = m i j n × n m i j = w j i n w i n i ,      when   j   i n 1 n + w i i n w i n i , when   j = i

4. Application of the PPRER Model

4.1. Problem Statement

In this section, a project portfolio that consists of projects A, B, and C of a construction company in China is studied as an example. There are dependency relationships between projects A and B and competition relationships between projects B and C.
HD Project Management Consulting Co., Ltd. is the only master authorized unit in China certified by the International Project Manager Professional (IPMP) of the International Project Management Association. The experts in the company include four senior consultants, three project managers, and three senior engineers who are IPMP level A certificate holders. They are responsible for managing a complex portfolio of the organization and have worked in or studied project portfolios for over ten years. In recent years, the managers in this company have found that the interaction between risks greatly affects project portfolio risk evolution and response, increasing the difficulty of managing PP. Therefore, this study chooses this company to validate the applicability of the proposed PPRER model.
According to the preliminary parameter tune experiments, and combined with the actual situation of the company’s PP implementation, this study sets the parameters as follows: the size of PPRs N = 50, the initial size of network N0 = 5, m = 3, the interaction coefficient between nodes in the PRs network K i j = 0.5, the interaction coefficient between nodes of the PIRs network K i j = 0.6, the additional increment δ = 0.5, the decreased value σ = 0.5, risk threshold α = 300, and the simulation time of the PPREN topology is set to 5. To simplify the computational complexity, this study sets C i j = 0.5, w o u t = w i n , and regards that PRs from the same stage belong to the same cluster.

4.2. Computational Results

This study interviewed ten experts to assess the impact and probability of the PRs, PIRs, and PPLRs, as well as judge the arisen stages of these risks. Note that these experts are selected from the HD Project Management Consulting Co., Ltd. To facilitate the calculation, this study divided the impact and probability into three levels (low, medium, and high), and the nodes of impact are denoted as 1, 3, and 5; the nodes of probability are denoted as 0.2, 0.5, and 0.8. The risk value was obtained by averaging the results of 10 sets of evaluations and multiplying the average impact with the probability of each PPR. Table 6, Table 7 and Table 8 present the obtained risk values of PRs, PPLRs, and PIRs, respectively.
The risk evolution process is shown in Figure 8, in which the horizontal axis represents time t, and the vertical axis E(t) represents the amount of risk the portfolio has at a given time. It can be seen that when t = 17, the maximum risk value reaches 193.4 in the first stage, and some risks exit. When t = 18, new risks are added, which indicates that the stage replacement has taken place during this period. Similarly, at t = 38 and t = 39, there is a stage replacement, and the maximum risk value reaches 300.2 in the whole life cycle of PP. Therefore, managers should attach great importance to risk response when change happens. In addition, the risk growth rate in the second stage is faster than that in the first stage, indicating that risk contagion is more likely to occur in the second stage. Therefore, managers should focus on the key nodes that play a hub role in the network. When t = 1, t = 3, t = 27, and t = 28, the value of E(t) changes very little and tends to be stable. This implies that the isolated nodes that do not interact with the existing nodes exist in the PPREN, which has little impact on the evolution of PPREN.
Figure 9 shows the simulation topology of PPREN when t = 5, in which the risk nodes and the value of their interactions are illustrated. In Figure 9, there are two peaks and a large difference in the interaction between the isolated points and the surrounding nodes, which also indicates the above explanation of the stable trend of the risk evolution value. According to this topology, the MBD and MDB in the process of birth-death and the death-life can be calculated, and the results are shown in Table 9 and Table 10, respectively, according to which nodes 24 and 4 are identified as the critical risks.

5. Discussion

Motivated by the need for enterprises that dynamically manage risks in a complex environment, this research proposed a model to understand better how PPRs evolve under the influence of interactions and how to dynamically evaluate and respond to PPRs. Specifically, this study initially constructed the evolution function of the PPRER model by improving the BBV model to explore the evolution process of PPRs as well as dynamically evaluate their strength. Next, it constructed the response function of the PPRER model via the evolutionary dynamics of complex networks. Finally, the applicability of the proposed PPRER model was validated by simulating a specific PP with different parameters given by experts.

5.1. Implications for Research

This study makes a conceptual step towards the understanding of the PPR evolution process under interaction effects among them, and it is among the first studies that develop a theoretical model in the PP area. The previous studies focused on exploring the evolution characteristics of PIR with different interactive relationships. More specifically, they regarded the project as the carrier of PIRs and assigned different risk attributes to them. Then, they explored the PIR evolution mechanism by comparing different interaction effects between projects [17,18]. However, the PRs and PPLRs are ignored, and the question of “how PPR evolves in a complex interaction environment” has not been solved. This study fills these research gaps and contributes to the literature by developing a model that formulates PPR evolution principles according to the interactions between projects and those between PPRs and taking risk interaction effects into account in the formula for calculating risk strength. Future research may build on the model proposed in this study to develop a deeper understanding of PPR evolution with the influence of interactions.
Second, the study extends the research on applications of the evolutionary dynamics model for risk management. Most of the research on risk response is carried out in the static network, and response measures are proposed by identifying the critical risks in the network at a certain moment. The deficiency is that it ignores the contagiousness of risks. When the response strategy is applied to a critical risk node, it will not only affect the node itself but will spread to the neighboring nodes due to risk contagion. The evolutionary dynamics model is an effective approach to exploring the dynamic evolution behavior of nodes and establishing decision mechanisms on complex networks. It has been widely used in information science [47,48,49], biological evolution [50,51], and supply chain management [52,53]. Unfortunately, little study on project management has applied this model. The evolutionary dynamics model was used to identify the critical strategy intrusion nodes under the two-state update rules so as to realize the PPRs response in their evolution process in real-time. This study can provide an insightful basis for future work to explore more applications of the evolutionary dynamics model in project management, such as exploring the cascading failure phenomenon in project portfolio and risk propagation among multiple projects.

5.2. Implications for Practice

The results of this study can help enterprises manage PPRs dynamically. Before an enterprise implements the PP, simulating the change of PPRs over time in advance plays a vital role in preventing significant risk accidents and promoting the success of PP. Using the model proposed in this study, enterprises can understand the risk changes of PP in the process of implementation in advance, which is conducive to the optimization of the enterprise management process and the selection of the project portfolio. More specifically, according to the changing trend of the pre-measured PPRs, the enterprise can find the critical moments, for example, when the risk value is high, and identify the key risks at that moment. Then, the enterprise can prevent them according to the types of these risks by adjusting the resource allocation mechanism and optimizing the organizational structure. Meanwhile, enterprises can select PPs by comparing the risk value of different PPs. In particular, different from the previous PP selection literature in which projects with low-risk values are selected to group together, the model of this study adopts non-fixed risk values, which is more practical. Enterprises can select PPs according to the dynamic risk values to meet their own development needs. For example, for the same PPR value, enterprises can choose projects with low risk in the early stage and high risk in the late stage or those with moderate risk in both the early and late stages. As a practical example, in order to successfully organize the 31st World University Games held in Chengdu, China, in 2023 (which will be referred to as Chengdu World University Games hereafter), a number of projects such as site selection, infrastructure development, epidemic prevention and control, conference services, etc. can be built into a special “Chengdu World University Games Project Portfolio”. Controlling project risks is the key to the success of the PP based on the results of this study. For example, the model can be used to analyze the risk evolution and response of the PP considering the interaction of various risks so as to control the possible risk events and provide theoretical support for the smooth implementation of the Chengdu World University Games.
The proposed model can make it more scientific for managers to make risk response decisions in complex environments. In the implementation of PP, managers can assess the risk value in real-time to make selective risk response decisions by leveraging the proposed model. More specifically, managers can adopt different response strategies according to the level of PPR value, combined with their risk attitude and the enterprise’s current operation status. For example, when the assessed value of risk is relatively low, and an enterprise holds the attitude of risk preference, then it can choose the strategy of risk self-retention, that is, to hedge the risk with money.

6. Conclusions

To effectively evaluate and respond to risks in a complex and dynamic PP environment, enterprises need to employ an approach that can not only realize the dynamic evolution of complex risk systems but also deal with the PPRs in real-time. This study proposed a PPRER model by improving the BBV model and by combining the evolutionary dynamics model. Through the proposed model, the results of PPR strength evolution in PP implementation can be obtained, and the critical risk strategy intrusion nodes at any time in the evolution process can be identified. Further, a numerical example was given to illustrate the feasibility and applicability of the proposed model. The proposed model can help enterprises better manage PPRs.
This work has three interrelated limitations, indicating the future research avenue. First, an evolutionary dynamics model is used in this study to identify the critical strategy intrusion nodes under the two-state update rule, which enables real-time response of PPRs during their evolution. Future research could focus on what impacts can be brought to the PP after identifying the critical strategy intrusion nodes, e.g., making replacements, protection, etc. Second, the reason that limited studies have been conducted on the interactions between PPRs is that the attachment mechanism of PPRs, especially for PIRs and PPLRs, is defined according to the limited existing literature. To overcome this limitation, there is a need for further investigation into quantifying the mechanism of interaction between PPRs, which is an interesting and unexplored area. Last but not least, there were no design models for different strategies, nor were there simulations for the evolution of risks after the implementation of response strategies. Future research can improve this model by taking into account the impact of different strategies on critical PPRs identification. Furthermore, the impact of response strategy implementation on PPR evolution is also worth being explored in future work.

Author Contributions

Conceptualization, Y.Z. and L.B.; methodology, Y.Z., L.B. and J.L.; software, J.L.; validation, J.L., X.X. and C.W.; formal analysis, Y.Z. and L.B.; data curation, J.L. and X.X.; writing—original draft preparation, J.L.; writing—review and editing, Y.Z., L.B. and C.W.; supervision, Y.Z. and L.B.; project administration, Y.Z. and L.B.; funding acquisition, Y.Z. and L.B. All authors have read and agreed to the published version of the manuscript.

Funding

This work was funded by the Youth Innovation Team of Shaanxi Universities; National Natural Science Foundation of China [grant number 72002018, 72201040]; Ministry of Education Humanities and Social Sciences Fund [grant number 17XJC630001]; Innovation Capacity Support Plan of Shaanxi Province [grant number 2020KJXX-054]; Major projects of Shaanxi Social Science Federation [grant number 2020Z361]; Social Science Planning Fund of Xi’an [grant number JG207]; Soft Science Foundation of Xi’an [grant number 2019111813RKX002SF006-5]; and the Fundamental Research Funds for the Central Universities [grant numbers 300102238620, 300102230613].

Data Availability Statement

The data presented in this study are available on request from the corresponding author.

Acknowledgments

We wish to thank five anonymous reviewers who helped us to improve a former version of the paper.

Conflicts of Interest

The authors declare no conflict of interest regarding the publication of this paper.

Appendix A

Table A1. Abbreviation legend of the concept.
AbbreviationFull Name
PPProject Portfolio
PPRProject Portfolio Risk
PPRERProject Portfolio Risk Evolution and Response
PPRENProject Portfolio Risk Evolution Network
PRProject Risk
PIRProject Interactive Risk
PPLRProject Portfolio-Level Risk

References

  1. Dixit, V.; Tiwari, M.K. Project portfolio selection and scheduling optimization based on risk measure: A conditional value at risk approach. Ann. Oper. Res. 2020, 285, 9–33. [Google Scholar] [CrossRef]
  2. PMI. A Guide to the Project Management Body of Knowledge; Project Management Institute: Newtown Square, PA, USA, 2021. [Google Scholar]
  3. Bai, L.; Han, X.; Zhang, Y.; Xie, X. Optimal Project Portfolio Selection Considering Cascading Failure among Projects. IEEE Trans. Eng. Manag. 2023. [Google Scholar] [CrossRef]
  4. Bai, L.; An, Y.; Sun, Y. Measurement of Project Portfolio Benefits with a GA-BP Neural Network Group. IEEE Trans. Eng. Manag. 2023, 1–13. [Google Scholar] [CrossRef]
  5. Guan, D.; Guo, P.; Hipel, K.W.; Fang, L. Risk reduction in a project portfolio. J. Syst. Sci. Syst. Eng. 2017, 26, 3–22. [Google Scholar] [CrossRef]
  6. Guan, L.; Abbasi, A.; Ryan, M.J. Analyzing green building project risk interdependencies using interpretive structural modeling. J. Clean. Prod. 2020, 256, 120372. [Google Scholar] [CrossRef]
  7. Wang, L.; Sun, T.; Qian, C.; Goh, M.; Mishra, V.K. Applying social network analysis to genetic algorithm in optimizing project risk response decisions. Inf. Sci. 2020, 512, 1024–1042. [Google Scholar] [CrossRef]
  8. Hatefi, S.M.; Tamosaitiene, J. An Integrated Fuzzy DEMATEL-Fuzzy ANP Model for Evaluating Construction Projects by Considering Interrelation-ships among Risk Factors. J. Civ. Eng. Manag. 2019, 25, 114–131. [Google Scholar] [CrossRef]
  9. Bai, L.; Song, C.; Zhou, X.; Tian, Y.; Wei, L. Assessing project portfolio risk via an enhanced GA-BPNN combined with PCA. EAAI. 2023, 126, 106779. [Google Scholar] [CrossRef]
  10. Bai, L.; Zhang, K.; Shi, H.; An, M.; Han, X. Project portfolio resource risk assessment considering project interdependency by the fuzzy Bayesian network. Complexity 2020, 2020, 5410978. [Google Scholar] [CrossRef]
  11. Sharifighazvini, M.R.; Ghezavati, V.R.; Raissi, S.; Makui, A. Integration of a new MCDM approach based on the DEA, FANP with MONLP for efficiency-risk assessment to optimize project portfolio by branch and bound: A real case-study. Econ. Comput. Econ. Cybern. Stud. Res. 2018, 52, 261–278. [Google Scholar] [CrossRef]
  12. Jiang, X.; Wu, Y.; Xu, P.; Zhang, W. SD model study on risk evolution in construction of project group. China Saf. Sci. J. 2015, 25, 155–161. [Google Scholar]
  13. Biffl, S.; Berardinelli, L.; Maetzler, E.; Wimmer, M.; Lueder, A.; Schmidt, N. Model-based risk assessment in multi-disciplinary systems engineering. In Proceedings of the 41st Euromicro Conference on Software Engineering and Advanced Applications, Funchal, Portugal, 26–28 August 2015. [Google Scholar]
  14. Wang, F.; Zhou, N.; He, Y.; Li, H. Dynamic simulation research on operation safety of main canal of South-to-North water transfer based on risk input. IOP Conf. Ser. Earth Environ. Sci. 2021, 643, 012142. [Google Scholar] [CrossRef]
  15. Sundararajan, S.K.; Tseng, C.L. Managing project performance risks under uncertainty: Using a dynamic capital structure approach in infrastructure project financing. J. Constr. Eng. Manag. 2017, 143, 04017046. [Google Scholar] [CrossRef]
  16. Wang, B.; Huang, D.; Li, H.; Zhang, C.; Zheng, Q. Research on social risk evolution and control of the large hydraulic project construction based on society burning theory. In Proceedings of the Computer and Computing Technologies in Agriculture VIII: 8th IFIP WG 5.14 International Conference, Beijing, China, 16–19 September 2014. [Google Scholar]
  17. Guo, N.; Guo, P. Evolution Mechanism of project portfolio risk based on Lotka-Voherra model. In Proceedings of the IEEE International Conference on Systems, Man, and Cybernetics, Budapest, Hungary, 9–12 October 2016. [Google Scholar]
  18. Zhao, J.; Guo, P.; Wang, J. Research of network clustering and co-evolution of project portfolio interactive risk. Comput. Eng. Appl. 2018, 54, 198–205. [Google Scholar]
  19. Zhang, Y. Selecting risk response strategies considering project risk interdependence. Int. J. Proj. Manag. 2016, 34, 819–830. [Google Scholar] [CrossRef]
  20. Fan, Z.; Li, Y.; Zhang, Y. Generating project risk response strategies based on CBR: A case study. Expert Syst. Appl. 2015, 42, 2870–2883. [Google Scholar] [CrossRef]
  21. Camilo, M.; Gabriela, F.; Madalena, A. A method for project portfolio risk assessment considering risk interdependencies-a network perspective. Procedia Comput. Sci. 2022, 196, 948–955. [Google Scholar]
  22. Ghasem, M.; Fatemeh, A. Project Portfolio Risk Response Selection Using Bayesian Belief Networks. Iran. J. Manag. Stud. 2020, 13, 197–219. [Google Scholar]
  23. Li, Q.; Wei, J.; Liu, F. Construction and application of engineering project group risk contagion network based on complex system. J. Railw. Eng. Soc. 2022, 19, 2757–2765. [Google Scholar]
  24. Patanakul, P. How to Achieve Effectiveness in Project Portfolio Management. IEEE Trans. Eng. Manag. 2022, 69, 987–999. [Google Scholar] [CrossRef]
  25. Yang, Q.; Zou, X.; Li, Z. Analyzing the project portfolio risk based on the complex network and random walk method. Syst. Eng. Theory Pract. 2020, 40, 1832–1843. [Google Scholar]
  26. Cheng, Y.; Yuan, J.; Zhu, L.; Li, W. Risk propagation model and simulation of schedule change in construction projects: A complex network approach. Complexity 2020, 2020, 8854609. [Google Scholar] [CrossRef]
  27. Zhu, J.; Cheng, Y.; Zhang, Y. Risk propagation mechanism research based on SITR model of complex supply networks. Int. J. Inf. Syst. Supply Chain Manag. (IJISSCM) 2021, 14, 18–38. [Google Scholar] [CrossRef]
  28. Li, T.; Chen, H.; Yuan, J.; Qian, J.; Siyal, A.W. Quality risk propagation of complex product collaborative manufacturing supply chain network based on CN and SoV. Discrete Dyn. Nat. Soc. 2020, 2020, 8889903. [Google Scholar] [CrossRef]
  29. Meng, X.; Chen, G.; Zhu, H. Complex network analysis on risk evolution of submarine pipeline leakage. J. Saf. Sci. Technol. 2017, 13, 26–31. [Google Scholar]
  30. Zhou, C.; Kong, T.; Jiang, S.; Chen, S.; Zhou, Y.; Ding, L. Quantifying the evolution of settlement risk for surrounding environments in underground construction via complex network analysis. Tunn. Undergr. Space Technol. 2020, 103, 103490. [Google Scholar] [CrossRef]
  31. Guan, L.; Abbasi, A.; Ryan, M.J. A simulation-based risk interdependency network model for project risk assessment. Decis. Support Syst. 2021, 148, 113602. [Google Scholar] [CrossRef]
  32. Sun, Y.; Tian, Y. Research on key risks of prefabricated building supply chain based on complex network theory. Constr. Econ. 2020, 41, 79–83. [Google Scholar]
  33. Barrat, A.; Barthelemy, M.; Vespignani, A. Weighted evolving networks: Coupling topology and weight dynamics. Phys. Rev. Lett. 2004, 92, 228701. [Google Scholar] [CrossRef]
  34. Tavakolan, M.; Etemadinia, H. Fuzzy Weighted Interpretive Structural Modeling: Improved Method for Identification of Risk Interactions in Construction Projects. J. Constr. Eng. Manag. 2017, 143, 0001395. [Google Scholar] [CrossRef]
  35. Shen, L. Project risk management in Hong Kong. Int. J. Proj. Manag. 1997, 15, 101–105. [Google Scholar] [CrossRef]
  36. Yang, R.J.; Zou, P.X.W. Stakeholder-associated risks and their interactions in complex green building projects: A social network model. Build. Environ. 2014, 73, 208–222. [Google Scholar] [CrossRef]
  37. Marle, F.; Vidal, L.; Bocquet, J. Interactions-based risk clustering methodologies and algorithms for complex project management. Int. J. Prod. Econ. 2013, 142, 225–234. [Google Scholar] [CrossRef]
  38. Vidal, L.A.; Marie, F.; Bocquet, J.C. Interactions-based clustering to assist project risk management. In Proceedings of the 17th International Conference on Engineering Design, Palo Alto, CA, USA, 24–27 August 2009. [Google Scholar]
  39. PMI. A Guide to the Project Management Body of Knowledge; Project Management Institute: Newtown Square, PA, USA, 2008. [Google Scholar]
  40. Killen, C.P.; Kjaer, C. Understanding project interdependencies: The role of visual representation, culture and process. Int. J. Proj. Manag. 2012, 30, 554–566. [Google Scholar] [CrossRef]
  41. Bhattacharyya, R.; Kumar, P.; Kar, S. Fuzzy R&D portfolio selection of interdependent projects. Comput. Math. Appl. 2011, 62, 3857–3870. [Google Scholar]
  42. Verma, D.; Sinha, K.K. Toward a theory of project interdependencies in high tech R&D environments. J. Oper. Manag. 2020, 20, 451–468. [Google Scholar]
  43. Schmidt, R.L. A model for R&D project selection with combined benefit, outcome and resource interactions. IEEE Trans. Eng. Manag. 1993, 40, 403–410. [Google Scholar]
  44. Wagner, S.M.; Eggert, A.; Lindemann, E. Creating and appropriating value in collaborative relationships. J. Bus. Res. 2010, 63, 840–848. [Google Scholar] [CrossRef]
  45. Wei, H.; Niu, C.; Xia, B.; Dou, Y.; Hu, X. A refined selection method for project portfolio optimization considering project interactions. Expert Syst. Appl. 2020, 142, 112952. [Google Scholar] [CrossRef]
  46. Foroogh, G.; Mohammad, S.; Vahidreza, Y.; Reza, F.; Jolanta, T. Project portfolio risk identification and analysis, considering project risk interactions and using Bayesian networks. Sustainability 2018, 10, 1609. [Google Scholar] [CrossRef]
  47. Lazov, I. A methodology for information and capacity analysis of broadband wireless access systems. Telecommun. Syst. 2016, 63, 127–139. [Google Scholar] [CrossRef]
  48. Lazov, I. Information analysis of queueing systems. Int. J. Gen. Syst. 2017, 46, 616–639. [Google Scholar] [CrossRef]
  49. Nicolis, S.C. Information flow and information production in a population system. Phys. Rev. E 2011, 84, 011110. [Google Scholar] [CrossRef] [PubMed]
  50. Franz, M.; Schuelke, O.; Ostner, J. Rapid evolution of cooperation in group-living animals. BMC Evol. Biol. 2013, 13, 235. [Google Scholar] [CrossRef]
  51. Mitrophanov, A.Y.; Borodovsky, M. Convergence rate estimation for the TKF91 model of biological sequence length evolution. Math. Biosci. 2007, 209, 470–485. [Google Scholar] [CrossRef]
  52. Bai, L.; Fralix, B.; Liu, L.; Shang, W. Inter-departure times in base-stock inventory-queues. Queueing Syst. 2004, 47, 345–361. [Google Scholar] [CrossRef]
  53. Xin, M. Analysis on quality control in food supply chain based on dynamics evolutionary game model. In Proceedings of the 2010 International Conference on Optoelectronics and Image Processing, Haikou, China, 11–12 November 2010. [Google Scholar]
Figure 1. Framework of the PPRER model construction (source: own elaboration).
Mathematics 11 04091 g001
Figure 3. The interaction between PIRs (source: own elaboration).
Mathematics 11 04091 g003
Figure 4. The PPLR interactions with PPLR and PIR (source: own elaboration).
Mathematics 11 04091 g004
Figure 5. An example of calculating the interaction risk value between risk nodes (source: own elaboration).
Mathematics 11 04091 g005
Figure 6. The birth-death process (source: own elaboration).
Mathematics 11 04091 g006
Figure 7. The death-life process (source: own elaboration).
Mathematics 11 04091 g007
Figure 8. PPRs evolution process of life cycle (source: own elaboration).
Mathematics 11 04091 g008
Figure 9. The topology of PPREN when t = 5 (source: own elaboration).
Mathematics 11 04091 g009
Table 1. Comparison with existing works (source: own elaboration).
ReferenceProject
Portfolio Context
Interaction ConsiderationRisk Evolution ConsiderationRisk Response
Consideration
Risk
Contagion
Consideration
[3]
[4]
[5]
[6]
[7]
[8]
[11]
[12]
[13]
[14]
[15]
[16]
[17]
[18]
[19]
[20]
[22]
This study
Table 2. Project portfolio-level risks (source: partially extracted from [46]).
Risk-IDProject Portfolio-Level Risks
PPLR1Choosing projects that are not aligned with strategic
objectives of the organization.
PPLR2Lack of sharing or transparency in information.
PPLR3Insufficient portfolio risk management.
PPLR4Portfolio manager’s incompetency.
PPLR5Portfolio’s imbalance in terms of high-risk projects versus low-risk ones.
PPLR6Political, social or legislative changes that lead to changing the organizational strategy, and project’s objectives lack of alignment
with the new strategy.
PPLR7Top manager’s interference in governance review board’s decisions.
PPLR8Choosing too many projects for the available resources.
PPLR9Inaccuracy and lack of quality in information.
PPLR10Portfolio’s imbalance between long-term projects and short-term ones.
PPLR11Governance review board’s incompetency.
PPLR12Frequent changes in roles, responsibilities and organizational structure.
PPLR13Lack of clarity in stakeholders’ roles and the intensity of their engagement.
PPLR14Governance review board’s reluctance to kill poor projects during their implementation, when they are no longer aligned with business strategy.
PPLR15Governance review board’s reluctance to kill or suspend projects when their required resources are no longer available.
PPLR16Portfolio’s imbalance across various markets.
PPLR17Portfolio’s imbalance in terms of project types.
Table 3. Project portfolio interactive risks.
Arising fromRisk-IDProject Portfolio Interactive Risks
Resource interaction [46]PIR1Lack of or delay in shared resources supply.
PIR2Error in resource allocation.
PIR3Conflicts between project managers.
Technical interactionPIR4Lack of shared technology.
PIR5Information vulnerability.
PIR6Conflicts between project technicians.
Value interaction [46]
interaction
PIR7Losing the potential value.
Table 4. Interaction matrix between PPLRs (source: reproduced from [46]).
Risk-IDPPLR1PPLR2PPLR3PPLR4PPLR5PPLR6PPLR7PPLR8PPLR9PPLR10PPLR11PPLR12PPLR13PPLR14PPLR15PPLR16PPLR17
PPLR101000110110001000
PPLR210001001001000010
PPLR300011000000000000
PPLR400100000000010000
PPLR501100010110000000
PPLR610000000000000000
PPLR710001001001000001
PPLR801000010110000100
PPLR910001001001000010
PPLR1010001001001000011
PPLR1101000010110000000
PPLR1200000000000000000
PPLR1300010000000000000
PPLR141 0000000000000000
PPLR1500000001000000000
PPLR1601000000110000001
PPLR1700000010010000010
Table 5. Interaction matrix between PPLRs and PIRs (source: own elaboration).
Risk-IDPPLR1PPLR2PPLR3PPLR4PPLR5PPLR6PPLR7PPLR8PPLR9PPLR10PPLR11PPLR12PPLR13PPLR14PPLR15PPLR16PPLR17
PIR100110000000000000
PIR201110001100000001
PIR301110000110000001
PIR401010000100000000
PIR501100000000000000
PIR601000000001010000
PIR710000000000001001
1 indicates that there are interactions between PPLRs and PIRs, and 0 otherwise.
Table 6. Risk values of PRs (source: own elaboration).
Risk IDProject RisksRisk Value
1Variations by the client1.7
2Project funding problems2.2
3Incomplete or inaccurate cost estimate0.8
4Design variations1
5Inadequate program scheduling2.5
6Bureaucracy of government1.9
7Excessive procedures of government approvals0.8
8Suppliers’ incompetency to delivery materials on time1.8
9Delayed project schedule1.9
10Contractors’ poor management ability1.8
11Inadequate site information1.5
12Price inflation of construction materials1
13Unavailability of sufficient professionals and managers2.5
14Poor competency of labor1.2
15Low management competency of subcontractors2.1
16Prosecution due to unlawful disposal of construction waste1.3
17No safety insurance for employees1.5
18Inadequate safety measures or unsafe operations2.5
19No insurance for major equipment1.5
20Lack of readily available utilities on site0.9
21Contractor’s difficulty in reimbursement0.6
Table 7. Risk values of PPLRs (source: own elaboration).
Risk-IDProject Portfolio-Level RisksRisk Value
22Choosing projects that are not aligned with strategic
objectives of the organization
1
23Lack of sharing or transparency in information2.1
24Insufficient portfolio risk management3
25Portfolio manager’s incompetency1.8
26Portfolio’s imbalance in terms of high-risk projects versus low-risk ones1.8
27Political, social or legislative changes that leads to changes in organizational strategy, and project’s objectives lack of alignment with the new strategy1.3
28Top manager’s interference in governance review
board’s decisions
0.9
29Choosing too many projects to share the available resources0.3
30Inaccuracy and lack of quality in information2.2
31Portfolio’s imbalance between long-term projects and short-term ones1.8
32Governance review board’s incompetency1.5
33Frequent changes in roles, responsibilities and
organizational structure
1.3
34Lack of clarity in stakeholders’ roles and the intensity
of their engagement
1.3
35Governance review board’s reluctance to kill poor projects during their implementation, when they are no longer aligned with business strategy1.7
36Governance review board’s reluctance to kill or suspend projects when their required resources are no longer available1.7
37Portfolio’s imbalance across various markets2.1
38Portfolio’s imbalance in terms of project types1.2
Table 8. Risk values of PIRs (source: own elaboration).
Risk-IDProject Interactive RisksRisk Value
39Lack of or delay in the supply of shared resources.1
40Error in resource allocation.3.5
41Conflicts between project managers.1.5
42Lack of shared technology1.5
43Information vulnerability1
44Conflicts between project technicians1.5
45Potential value loss.1
Table 9. The birth-death process matrix (source: own elaboration).
MBD=
0.912800.02540.02510.03670000
00.950500.02130.02820000
0.038000.833500.046200.042300.0401
0.04610.072800.7769000.052500.0517
0.02700.03840.022700.91190000
000001.0000000
000.03510.0354000.910200.0194
00000001.00000
000.02800.0293000.016300.9264
Table 10. The death-life process matrix (source: own elaboration).
MDB=
0.888900.03800.04610.02700000
00.888900.07280.03840000
0.025400.888900.022700.035100.0280
0.02510.021300.8889000.035400.0293
0.03670.02820.046200.88890000
000000000
000.04230.0525000.888900.0163
000000000
000.04010.0517000.019400.8889
Disclaimer/Publisher’s Note: The statements, opinions and data contained in all publications are solely those of the individual author(s) and contributor(s) and not of MDPI and/or the editor(s). MDPI and/or the editor(s) disclaim responsibility for any injury to people or property resulting from any ideas, methods, instructions or products referred to in the content.

