Article

Effects of NMDA Receptor Hypofunction on Inhibitory Control in a Two-Layer Neural Circuit Model

School of Statistics and Mathematics, Guangdong University of Finance and Economics, Guangzhou 510320, China
*
Author to whom correspondence should be addressed.
Mathematics 2023, 11(19), 4063; https://doi.org/10.3390/math11194063
Submission received: 31 August 2023 / Revised: 20 September 2023 / Accepted: 22 September 2023 / Published: 25 September 2023
(This article belongs to the Special Issue Mathematical and Computational Neuroscience)

Abstract

:
Inhibitory control plays an important role in controlling behaviors, and its impairment is a characteristic feature of schizophrenia. Such inhibitory control has been examined through the the stop-signal task, wherein participants are asked to suppress a planned movement when a stop signal appears. In this research, we constructed a two-layer spiking neural circuit model to study how N-methyl-D-aspartate receptor (NMDAR) hypofunction, a potential pathological mechanism in schizophrenia, impacts the inhibitory control ability in the stop-signal task. To find the possible NMDAR hypofunction effects in schizophrenia, all NMDA-mediated synapses in the model were set to be NMDAR hypofunction at different levels. Our findings revealed that the performances of the stop-signal task were close to the experimental results in schizophrenia when NMDAR hypofunction was present in the neurons of two populations that controlled the “go” process and the “stop” process of the stop-signal task, implying that the execution and inhibition of behaviors were both impaired in schizophrenia. Under a certain degree of NMDAR hypofunction, the circuit model is able to replicate the stop-signal task performances observed in individuals with schizophrenia. In addition, we have observed a predictable outcome indicating that NMDAR hypofunction can lower the saccadic threshold in the stop-signal task. These results provide a mechanical explanation for the impairment of inhibitory control in schizophrenia.

1. Introduction

Inhibitory control, a crucial component of executive function in cognition, refers to the capacity to suppress thoughts and actions [1,2]. Impairment of inhibitory control is a common symptom observed in individuals with schizophrenia [3,4]. At the behavioral level, the stop-signal task is typically employed to assess inhibitory control, involving the suppression of saccadic movements in response to a later stop signal [5,6]. Experimental studies have revealed that individuals diagnosed with schizophrenia require more time to inhibit saccadic movements during the stop-signal task, indicating a deficiency in inhibitory control ability [7]. At the synaptic level, it is postulated that N-methyl-D-aspartate receptor (NMDAR) hypofunction plays a pivotal role in the pathophysiology of schizophrenia [8,9,10]. NMDAR antagonists can induce cognitive symptoms of schizophrenia in both humans and other species [11,12,13], while mutations in NMDAR subunit genes have been associated with schizophrenia-like disorders [14,15,16]. These findings provide substantial evidence in support of the NMDAR hypofunction hypothesis. However, our comprehensive understanding of how NMDAR hypofunction impacts inhibitory control in schizophrenia remains limited.
Theoretical models provide valuable insights into the computational mechanisms across different levels. The classical race model proposed that the saccade movement inhibition resulted from a race between two interactive processes: a “go” process and a “stop” process [17,18]. The saccade can be inhibited only when the “stop” process finishes before the “go” process. Based on this race hypothesis, a spiking neural network model with detailed synaptic connections is developed [19]. The model shows that a moderate proportion of AMPA and NMDA synaptic currents between neuronal populations can reproduce the neural activities and behavioral performances in the stop-signal task. Neuronal activities and synaptic mechanisms form the attractor dynamics to control the inhibitory behaviors. This attractor dynamics describes that a system naturally evolves toward stable states or patterns of behavior known as attractors, which has been reported in numerous cognitive models [20,21,22,23,24,25]. It is considered to be a fundamental computational mechanism of different cognitive functions, including inhibitory control. Additionally, computational models are employed to investigate the impact of NMDAR hypofunction on the network dynamics in some cognitive functions, because it is convenient to observe the behavioral changes by perturbing the synaptic connections of the models [26,27,28]. The NMDAR hypofunction gives rise to less excitatory synaptic inputs to the neurons so that the neurons fire more slowly [29]. While this slow effect could appear in both excitatory neurons and inhibitory neurons, the excitation–inhibition balance of the functional network is disrupted. Recent research has reported that the variation of the excitation–inhibition balance is related to the deficit of cognitive functions such as working memory and decision-making [29,30,31].
In this work, we constructed a two-layer spiking neural circuit model to adapt to the stop-signal task. The combination between the synaptic variations and the task behavioral performances could provide an across-level understanding of the effects of the NMDAR hypofunction on the inhibitory control of schizophrenia.

2. Materials and Methods
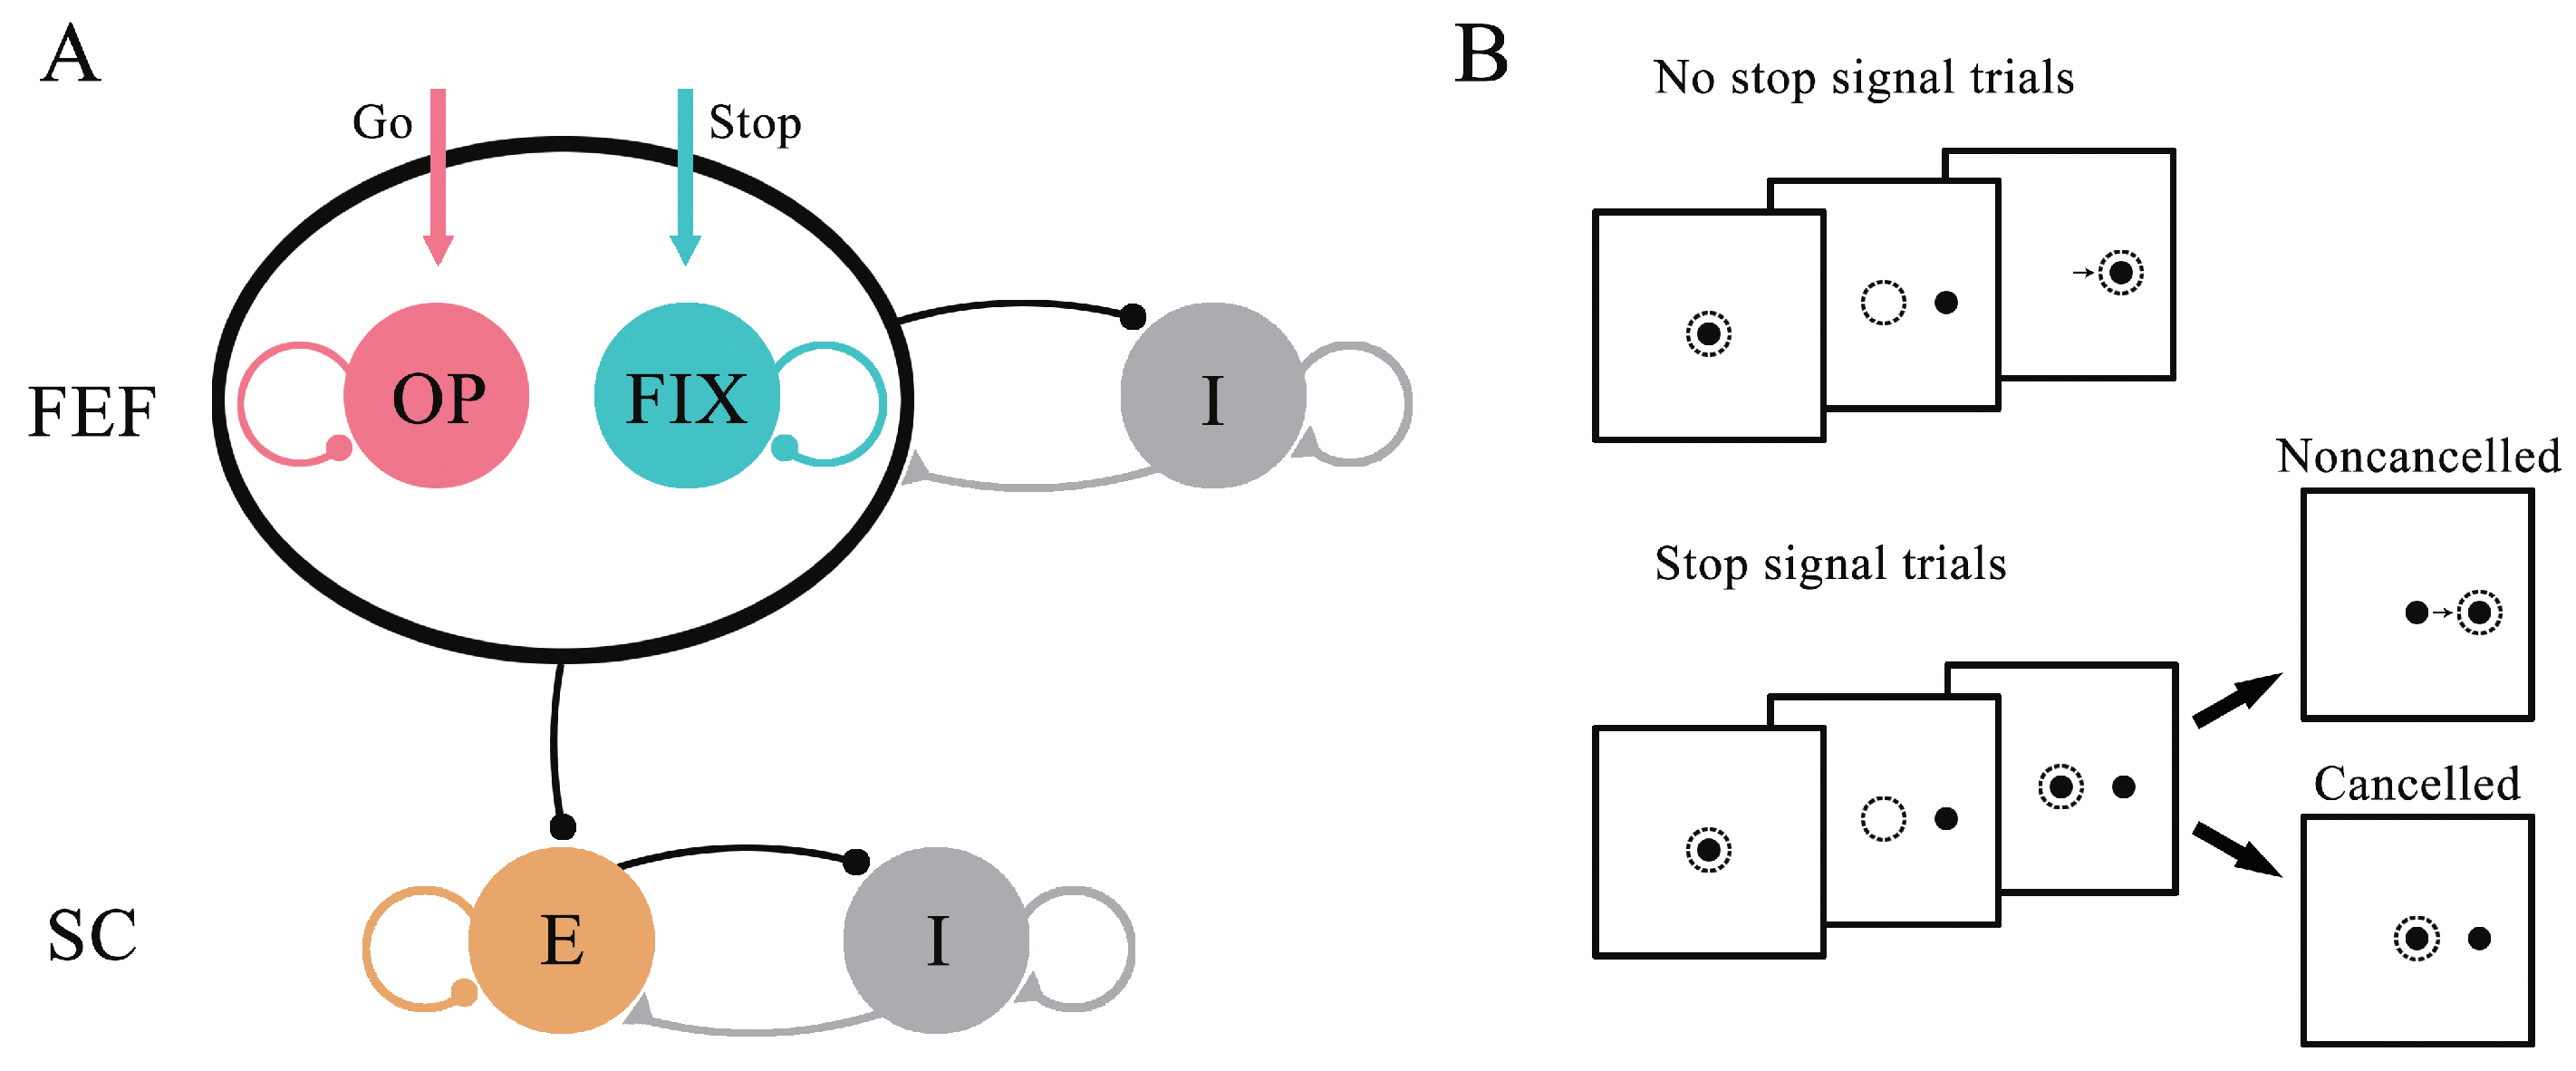
2.1. Network Model

It has been reported that saccade movements are most directly governed by processes occurring within the frontal eye fields (FEF) and the superior colliculus (SC) [4,32]. The connectivity and neuronal activities of FEF and SC are enough to explain response inhibition and execution [33]. Thus, we constructed a two-layer neural circuit model to simulate the stop-signal task. The network architecture is illustrated in Figure 1A. The first layer represents the FEF circuit which consists of three populations: an excitatory orientation-preferred neuron population (OP), an excitatory fixation neuron population (FIX), and an inhibitory interneuron population (FEFI). We assume that OP neurons and FIX neurons process the orientation-related go signal and the stop signal in the stop-signal task, respectively. The OP neurons and the FIX neurons inhibit each other through FEFI, forming a competition of the “go” process and the “stop” process in the stop-signal task. The second layer consists of an excitatory neuron population (SCE) and an inhibitory interneuron population (SCI), simulating the saccade movement activity of the SC. The number of neurons in OP, FIX, FEFI, SCE, and SCI are 240, 240, 120, 200, and 100, respectively. The connections of all synapses are all-to-all connectivity.
The neuron is modeled as the leaky integrate-and-fire model. The dynamics of membrane potential V obeys the equation:
τ m d V d t = V I s y n + I n o i s e + I e x t ,
where τ m is the membrane time constant, τ m = 20 ms in excitatory neurons and τ m = 10 ms in inhibitory neurons [34]. The spiking threshold is −50 mV, and the reset value is −55 mV. The absolute refractory periods of excitatory and inhibitory neurons are 2 ms and 1 ms, respectively.
I s y n refers to the total synaptic current of the neurons, which includes four kinds of synaptic currents [35,36]:
I s y n = I A M P A + I N M D A + I G A B A + I A M P A e x t ,
where synaptic currents I A M P A ,   I N M D A ,   a n d   I G A B A are mediated by AMPA receptors, NMDA receptors, and GABA receptors, respectively. I A M P A e x t mimics the background synaptic input from other cortical areas. Except I N M D A , these synaptic currents obey:
(3) I k = g k s k ( V V e , i ) (4) d s k d t = s k τ k + j δ ( t t j ) ,
where k can be AMPA, GABA, or AMPAext, g k is the maximal synaptic conductance, s k gives the activation variable of the synapse. Excitatory reversal potentials V e and inhibitory reversal potentials V i are 0 mV and −70 mV, respectively. The time constants of synapse give τ A M P A = 2 ms, τ G A B A = 10 ms and τ A M P A e x t = 2 ms. δ ( x ) is the Dirac delta function, which is a generalized function defined as:
(5) δ ( x ) = 0 , ( x 0 ) (6) + δ ( x ) d x = 1 .
t j is the time of the jth presynaptic spike. In I A M P A e x t , uncorrelated Poisson spike trains with a constant spike rate are used to be the presynaptic spike source.
In addition, NMDA-mediated synaptic current I N M D A is described by:
(7) I N M D A = g N M D A ( 1 P h ) B ( V ) s N M D A ( V V e ) (8) B ( V ) = 1 1 + [ m g 2 + ] e x p ( 0.062 V ) / 3.57 (9) d s N M D A d t = s N M D A τ N M D A + α N M D A x ( 1 s N M D A ) (10) d x d t = x τ x + j δ ( t t j ) ,
where g N M D A gives the maximal synaptic conductance, B ( V ) denotes a function of the voltage dependent magnesium block, [ m g 2 + ] = 1.0 mM. Time constant τ N M D A and τ x are 100 ms and 2 ms, α N M D A = 0.5 controls the saturation properties of NMDAR channels. In this current, we set P h to describe the hypofunction rate of the NMDA receptor in population h, and index h could be OP, FIX, FEFI, SCE, or SCI.
For fitting the experimental data in stop-signal task, we apply a noise current I n o i s e to the neurons in OP, FIX, and FEFI, which follows an Ornstein–Uhlenbeck process [37,38]:
τ n d I n o i s e d t = I n o i s e + σ n τ m η ( t ) ,
where time constant τ n = 20 ms, σ n = 0.05 pA in OP, and FIX and σ n = 0.02 pA in FEFI. η ( t ) is a white noise with zero mean and unit standard deviation.
I e x t denotes the external input, it could be the “go” signal to the OP population or the “stop” signal to the FIX population which depends on the requirements of cognitive tasks. I e x t obeys the same equation as I A M P A e x t . The spike rates of the “go” signal and the “stop” signal are 500 Hz and 540 Hz, respectively. We consider a latency of the external input between the onset of the target and the actual input to FEF. The latency of the go signal is set to be 12 ms. The latency of the stop signal is determined to be 65 ms [17,19].

2.2. Cognitive Tasks

The stop-signal task includes two kinds of trial: no stop-signal trial and stop-signal trial.
In the no stop-signal trial (NSS) (upper panel of Figure 1B), the FIX population receives a fixation input until the onset of the visual target, representing that it is fixating on the central spot. Then, the central spot vanishes, and the visual target appears, attracting the subject to saccade to this target. Once the SC population outputs a saccade signal, the visual input is off. We assume that the saccade signal will produce a feedback inhibitory signal to the OP neurons in the network, making them no longer integrate the orientation-preferred signal from the target. A correct trial requires that the model produces a saccade movement to the orientation of the visual target.
The stop-signal trial is initially the same as the no stop-signal trial. However, after the onset of the visual target, the fixation spot will reappear after a stop signal delay (SSD), serving as a stop signal to inhibit a saccade movement to the target (lower panel of Figure 1B). The successful trial and the failed trial of inhibiting the saccade are labeled as “cancelled stop-signal trial” and “noncancelled stop-signal trial” (NC). According to the experimental paradigm [7], the SSD is set to 149 ms.
The simulations are performed in Python by using the exponential Euler algorithm with an integration time step of 0.1 ms (decreasing the time step to 0.01 ms does not affect the results).

3. Results

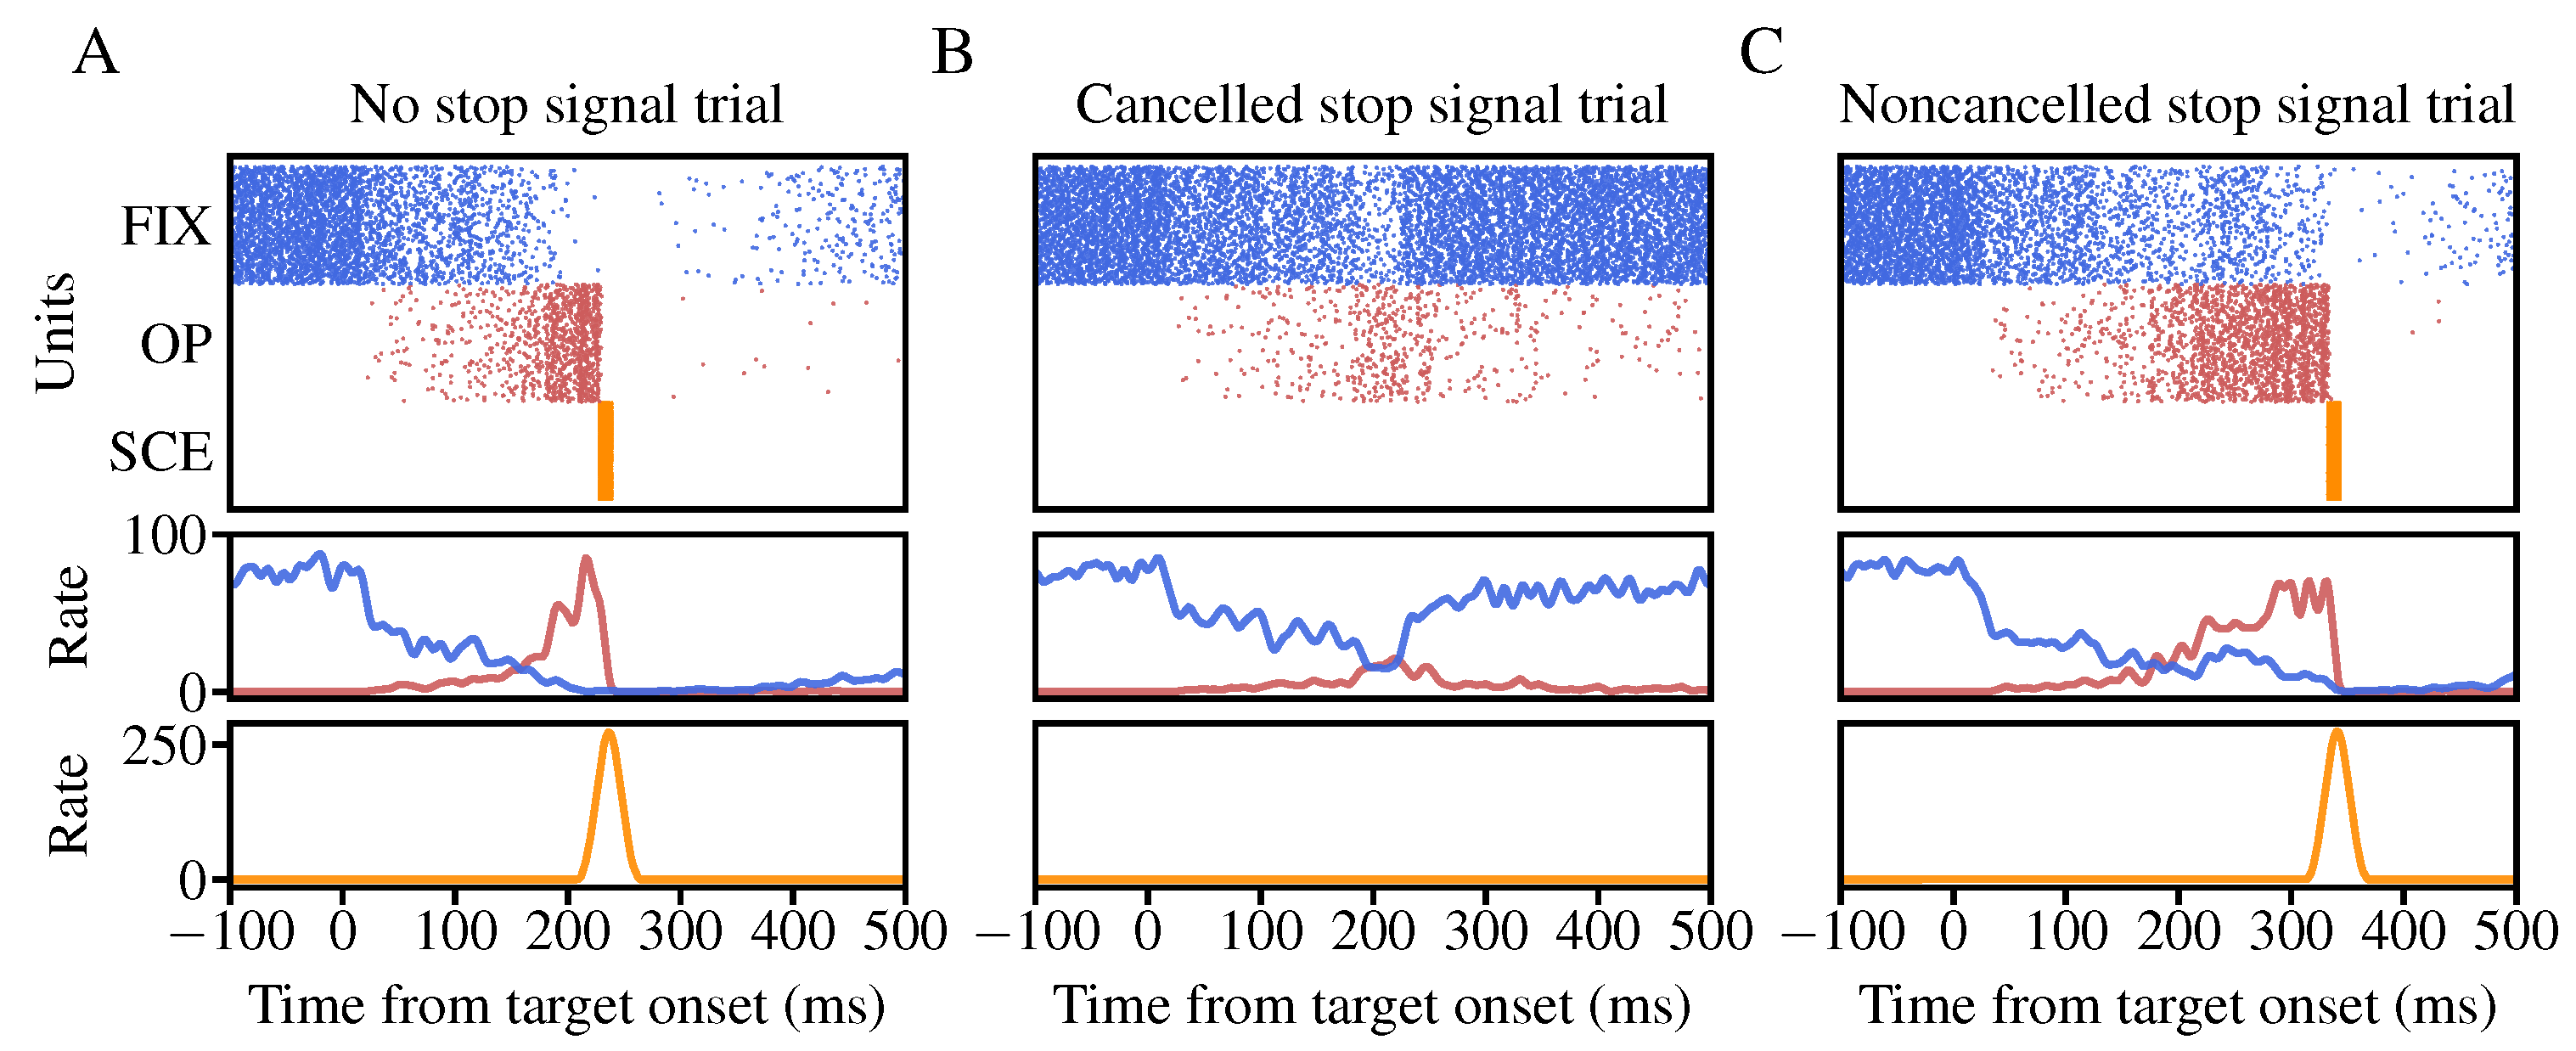
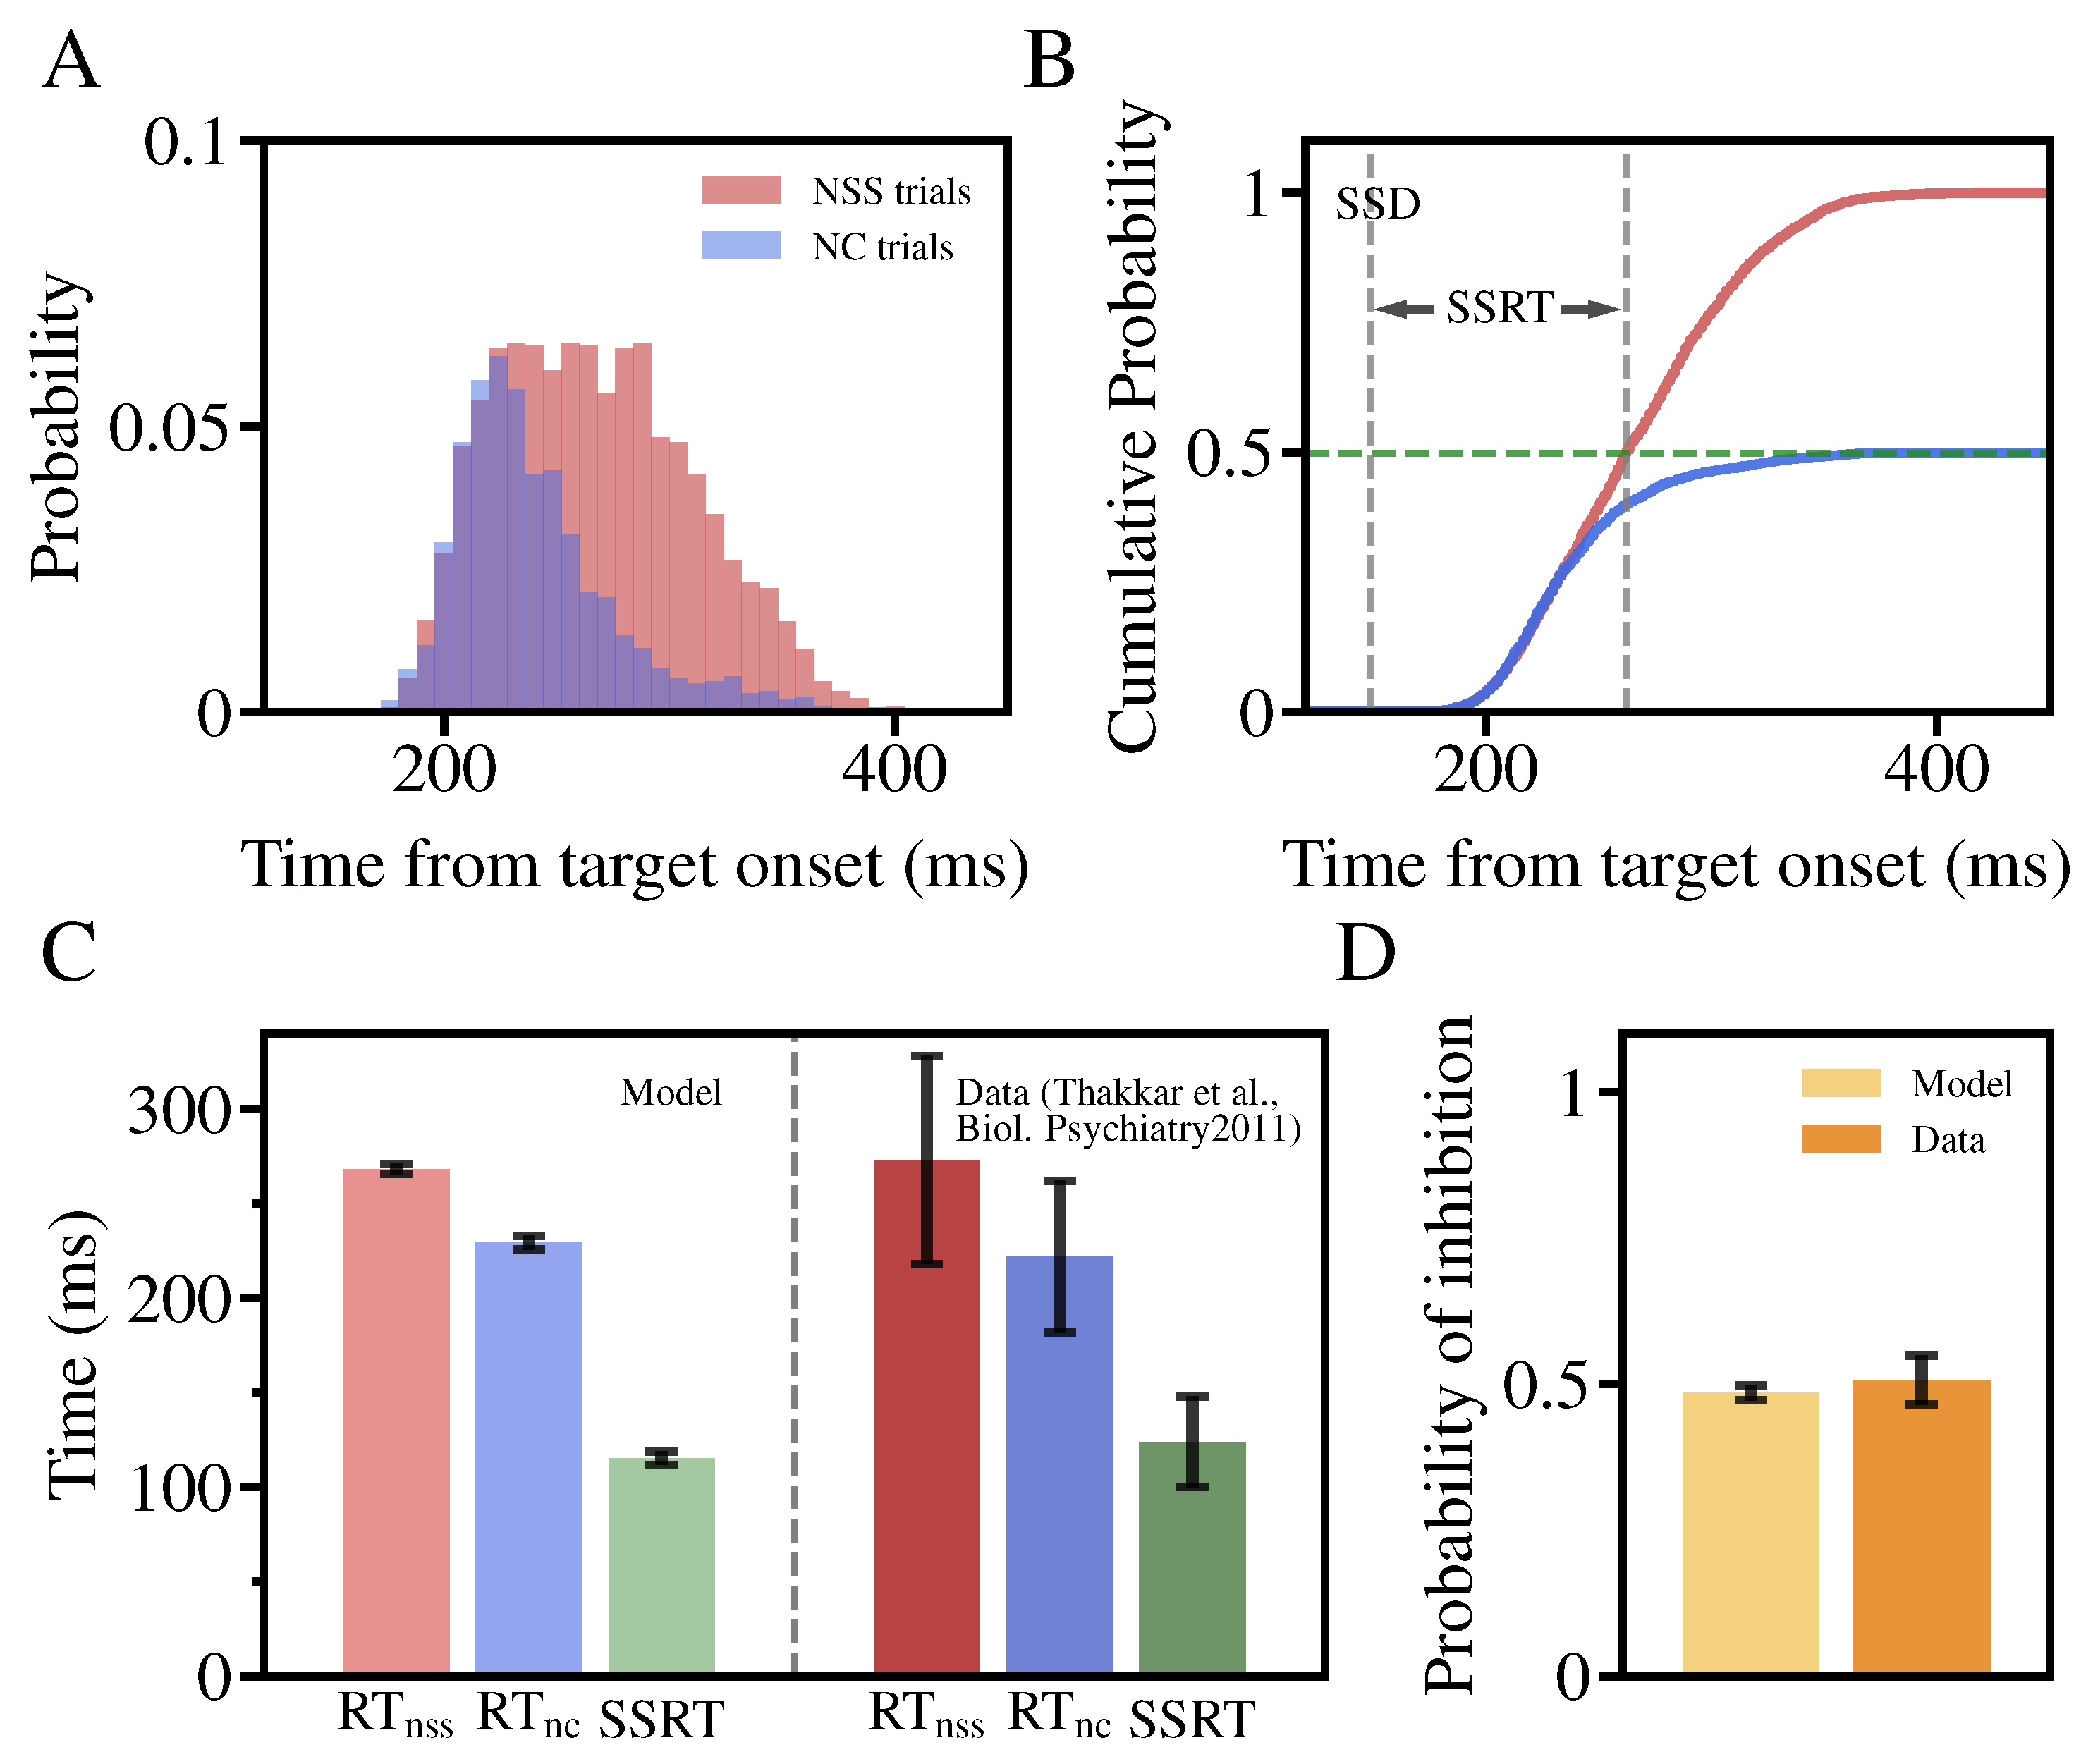
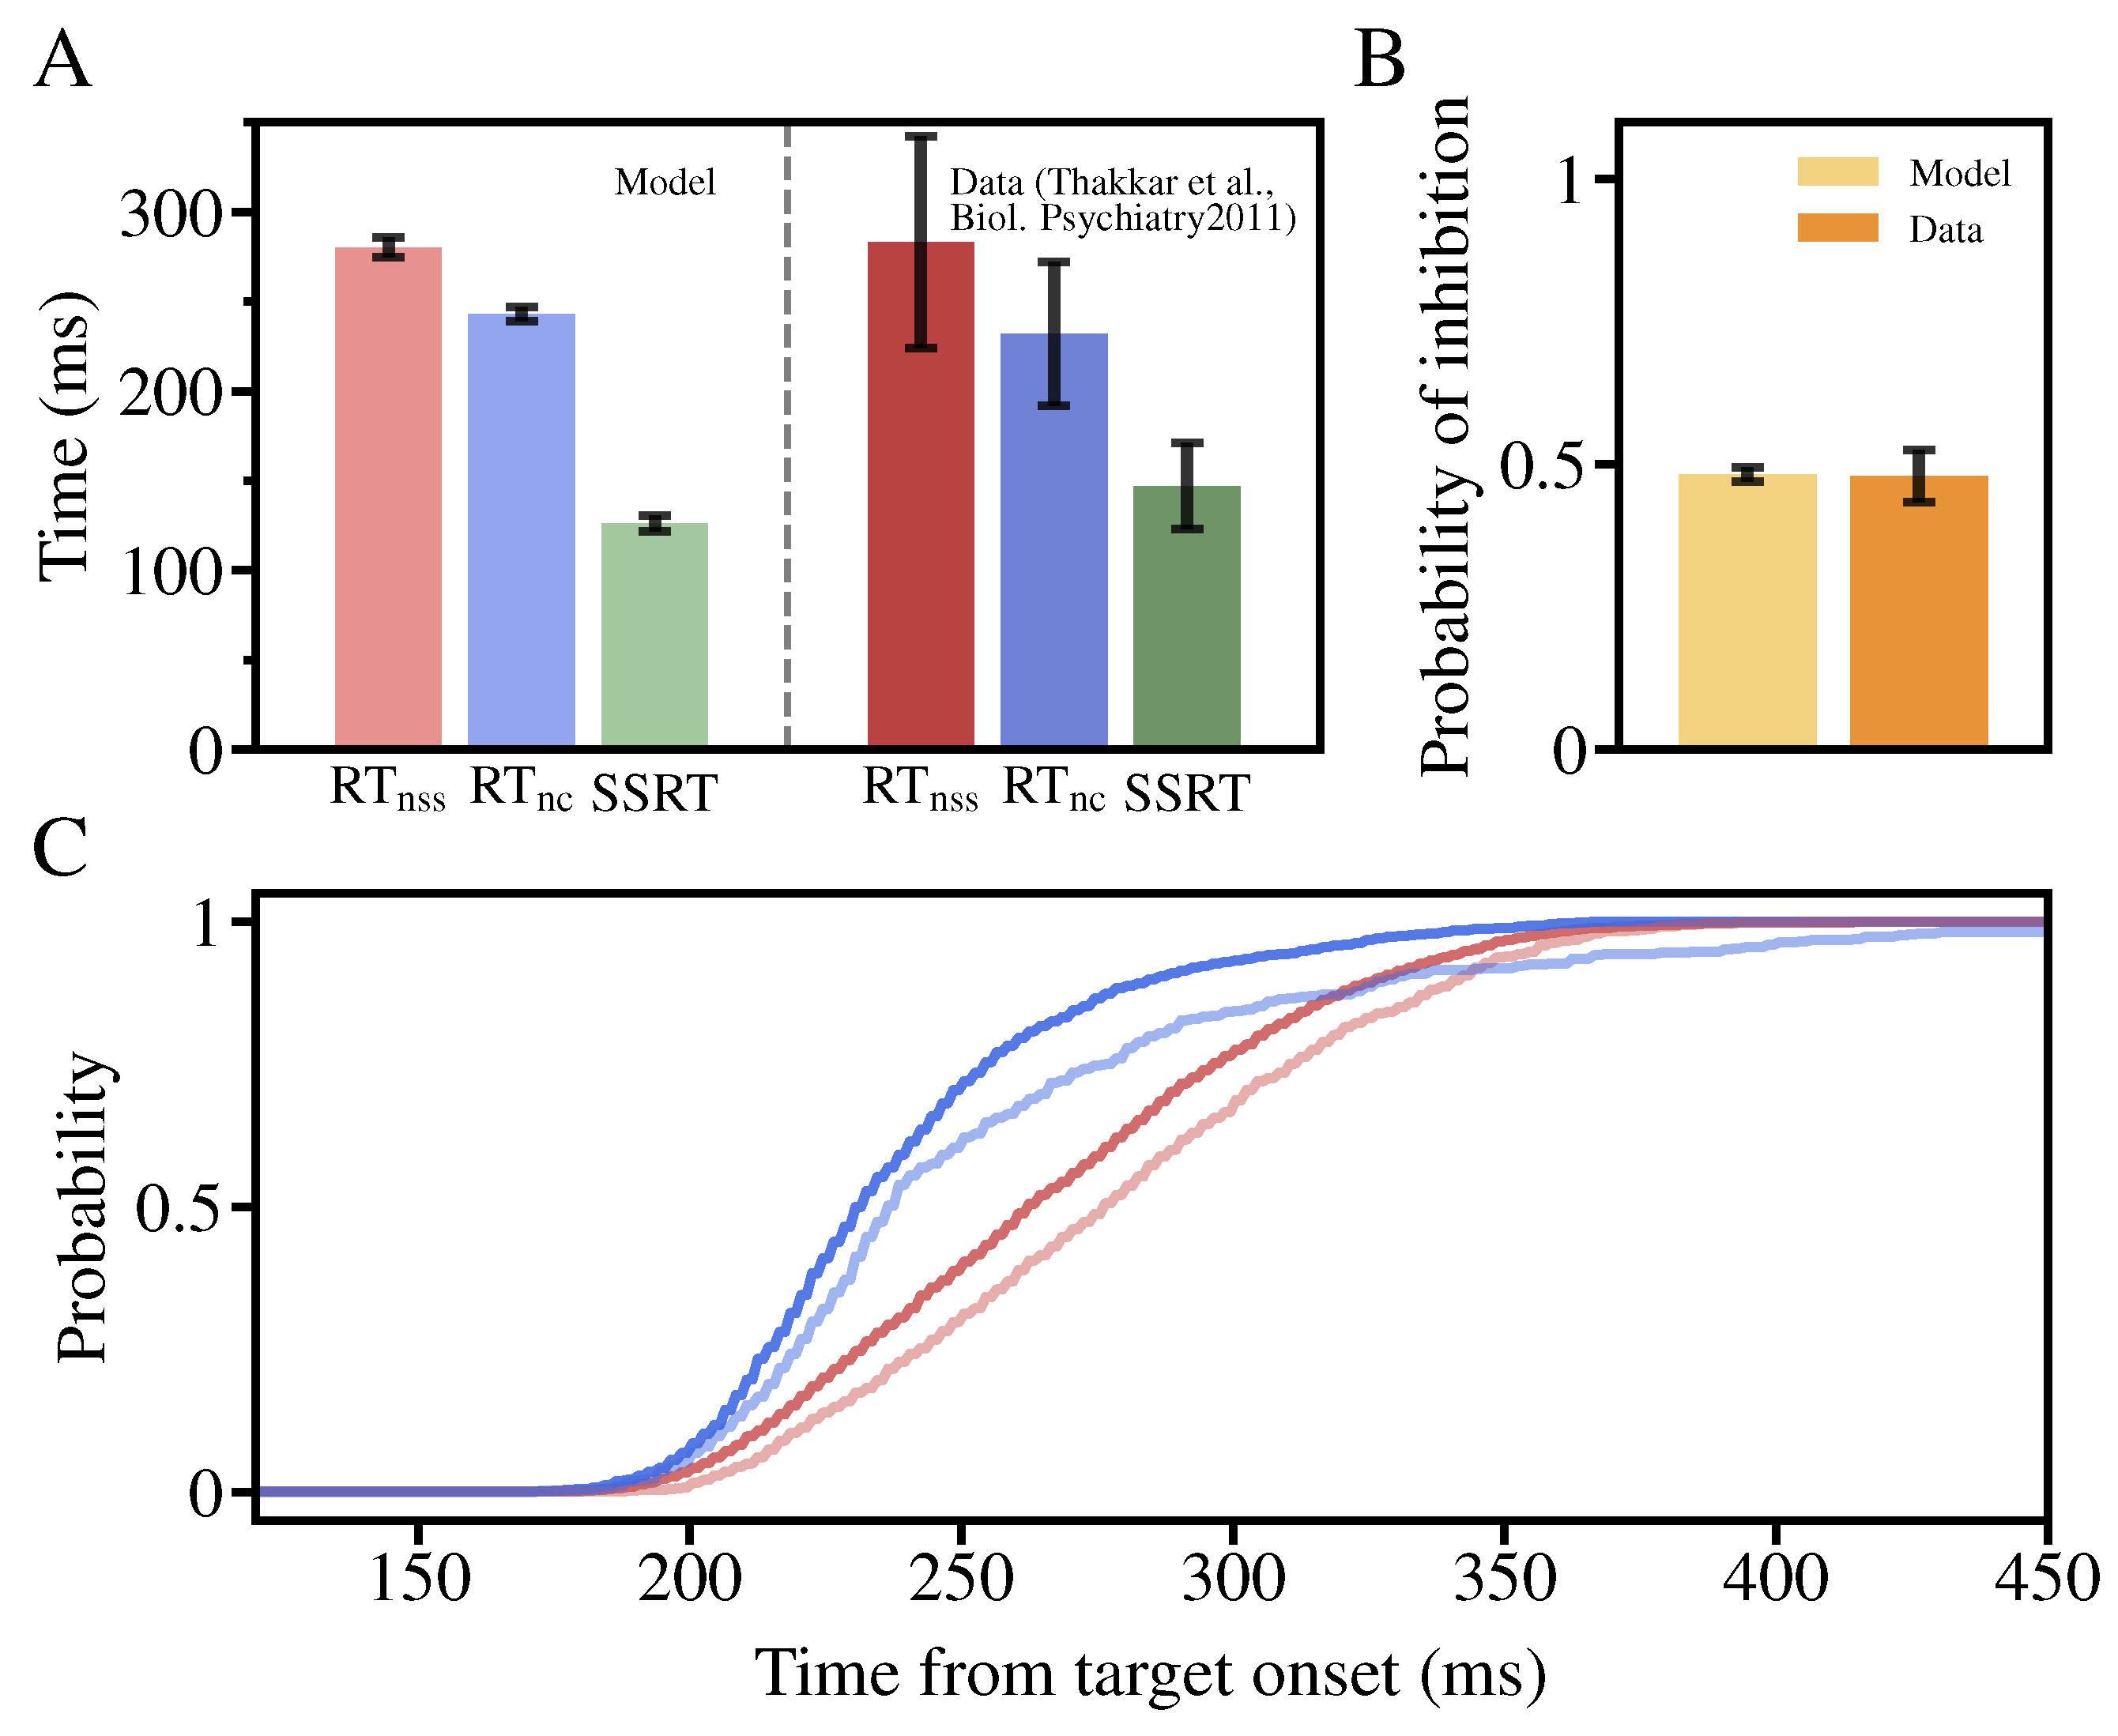
3.1. The Performance of the Neural Circuit Model in the Stop-Signal Task

We first describe the performance of the proposed model in the stop-signal task (Figure 2). In the no stop-signal trial, the FIX neurons maintain a high firing rate before the visual target onset, indicating that the model is fixating at the central spot. After the central spot vanishes and the visual target appears, the OP neurons gradually respond to the target and output a ramping-up activity. Because of NMDA-mediated slow synaptic dynamics and the inhibition from FEFI, a kind of mutual competition can be observed between OP neurons and FIX neurons. The ramping-up activity in OP makes the FIX firing rate decrease gradually. The decrease of the FIX activity results in the faster growth of the OP firing rate. Once the OP activity reaches the threshold, the SCE neurons fire many spikes instantaneously, forming a saccade movement signal which represents that the model saccades to the visual target(Figure 2A). This saccade movement signal gives an instant inhibitory signal to the OP neurons so that the OP neurons no longer integrate the orientation-preferred information and return to the baseline activity.
In the stop-signal trial, the activities of the network model are identical to the no stop-signal trial before the stop signal onset. It is uncertain whether the stop signal can inhibit the saccade movement. In the cancelled stop-signal trial, the appearance of the stop signal makes the FIX activity increase and the OP activity drops gradually. The FIX population regains the winning of the competition. These activities give rise to the absence of the saccade signal in the SCE (Figure 2B). In the noncancelled stop-signal trial, the stop signal cannot help the FIX activity suppress the OP firing rate, with the result that the OP activity grows and finally produces a saccade movement signal in the SCE (Figure 2C).
The network model can also reproduce the experimental performances in the stop-signal task. We perform the no stop-signal trial and the stop-signal trial both 5000 times, and analyze the reaction time (RT), which is defined as the time interval between the onset time of the visual target and the peak time of the saccade signal in SCE. In the stop-signal trials, because the cancelled trials do not produce the saccade signal, we only analyze the RTs of the noncancelled trials. For comparing on the same scale, the saccade probabilities of the RT distribution in both trials are calculated as the ratio of the saccade number in a time zone and the total saccade number of the no stop-signal trial. In Figure 3A, it can be observed that the RTs of the no stop-signal trials distribute in the range of 156 to 410 ms, while the RTs of the noncancelled stop-signal trials distribute in the range of 153 to 360 ms. Additionally, the saccade probabilities between 220 and 360 ms in noncancelled stop-signal trials are much smaller than those in the no stop-signal trial, indicating that a large number of trials that should have produced a saccade movement during this period are suppressed by the stop signal. The ability of inhibitory control is usually estimated by the stop-signal reaction time (SSRT), the time required for inhibiting saccade after the stop signal onset. The SSRT cannot be directly obtained in the cancelled stop-signal trials, but need to compute by combining the RT distributions of the no stop-signal trial and the noncancelled stop-signal trial. Based on the data in Figure 3A, we calculate the cumulative saccade probabilities in both tasks. In Figure 3B, we can see that the maximal cumulative probability of the noncancelled stop-signal trial is 50%. When drawing a green horizontal line along 50%, the intersection with the cumulative probability of the no stop-signal trial indicates the time required for cancelling the saccade movement on average. The SSRT, which is the difference between this cancelled time and the SSD, is estimated as 115.4 ms. Another inhibitory ability indicator is the probability of inhibition, which is defined as the ratio of the number of the cancelled stop-signal trial and the total stop-signal trial. The probability of inhibition is 50%. For eliminating the effects of the stochastic factors, we repeat the above simulations 10 times and compare the results to the experimental data (Figure 3C,D). The mean RT of the no stop-signal trial is 266.94 ms, while that in the noncancelled stop-signal trial is 229.43 ms, and the mean SSRT is 115 ms, the probability of inhibition is 49.6%. These results are all in agreement with experimental results [7].

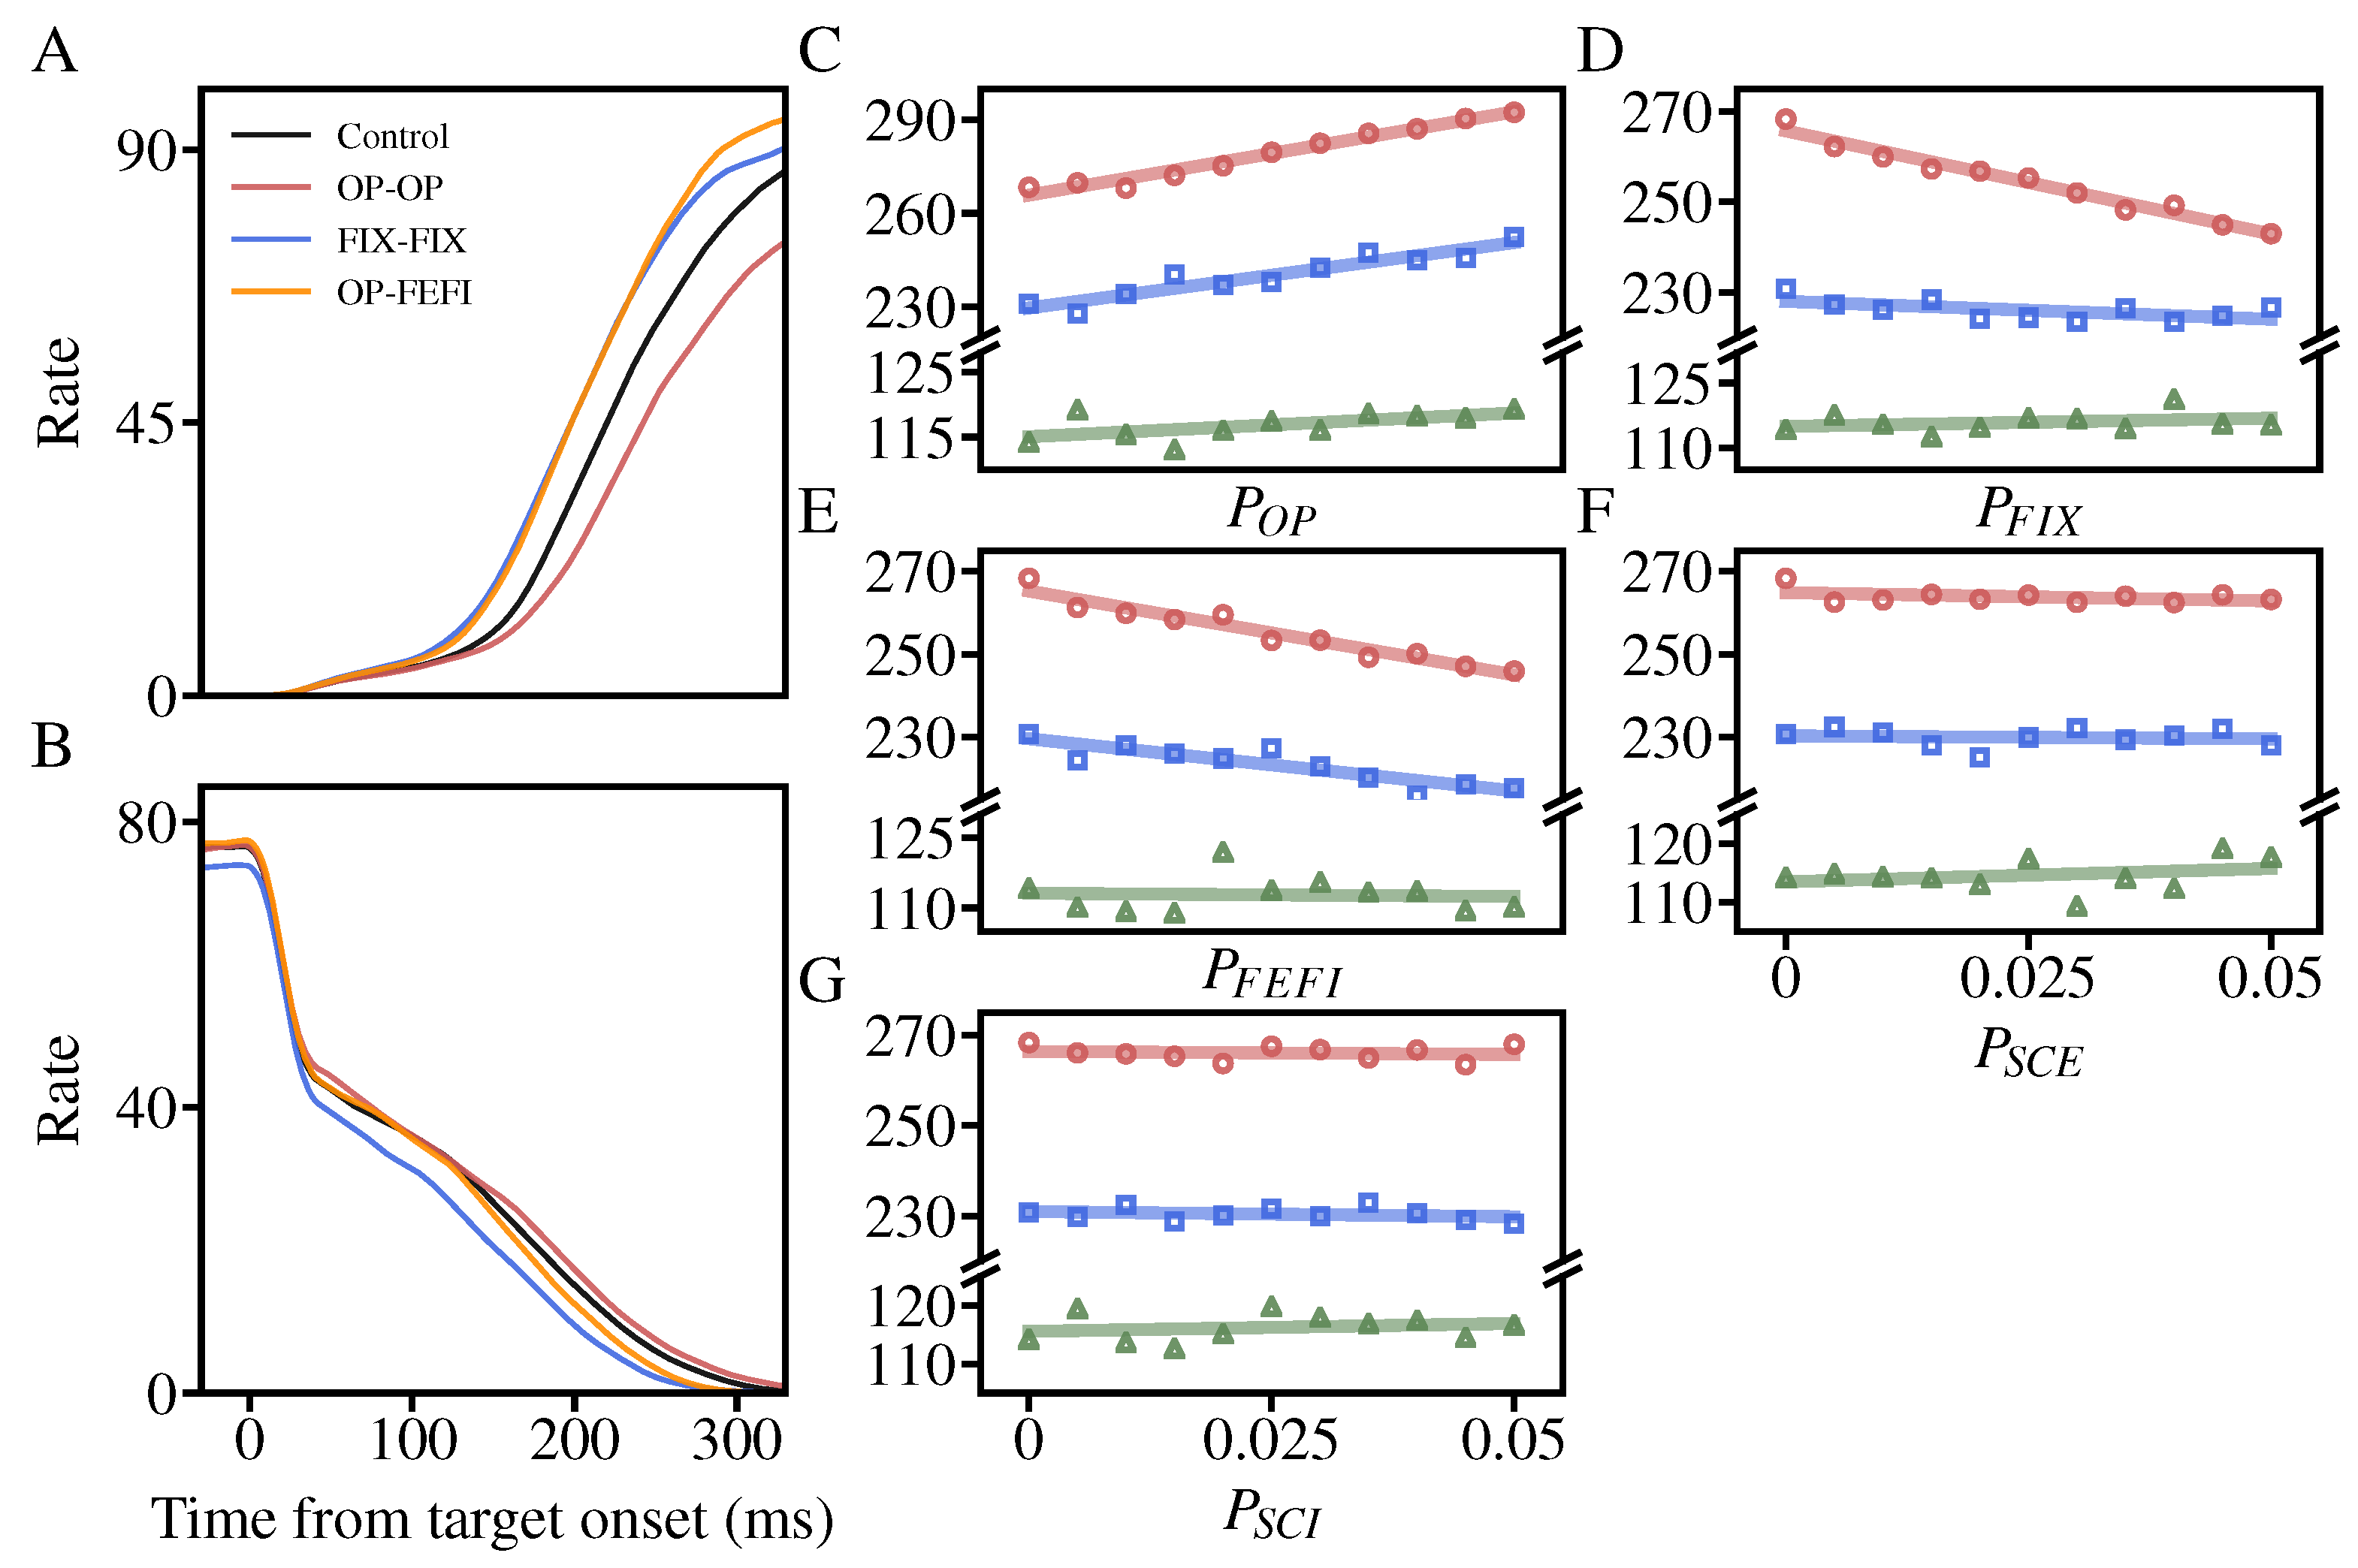
3.2. The Effects of NMDA Receptor Hypofunction on the Inhibitory Control

To study the effects of NMDA receptor hypofunction on the inhibitory control, we set different NMDA receptor hypofunction rates P O P , P F I X , P F E F I , P S C E , P S C I for the five NMDA-mediated synapses in the model: the recurrent synapse in OP (OP-OP), the recurrent synapse in FIX (FIX-FIX), the synapse from OP to FEFI (OP-FEFI), the recurrent synapse in SCE (SCE-SCE), the synapse from SCE to SCI (SCE-SCI). For knowing how NMDA receptor hypofunction affects the network activities, 500 no stop-signal trials are performed in four cases: the control model ( P O P = 0), P O P = 0.05, P F I X = 0.05 and P F E F I = 0.05. Figure 4A,B illustrate the average firing rate of OP and FIX over 1000 trials in four cases.
(1)
Compared to the control model, NMDA receptor hypofunction on OP-OP makes the ramping-up activity less activated and increases with a slower speed, while the corresponding activity in FIX becomes more activated because of the competition between OP and FIX. Naturally, the weakening of the excitatory input to OP results in a decrease in population activity.
(2)
In contrast, the NMDA receptor hypofunction on OP-FEFI and FIX-FIX mainly enhances the OP activities and reduce the FIX responses.
These model activities reveal that the NMDA receptor hypofunction has an impact on both the cortical pyramidal neurons and the GABAergic interneurons, which is consistent with the recent observations about the NMDA receptor hypofunction [10,39].
While the NMDA receptor hypofunction has an effect on the network activities, a natural question is how the NMDA receptor hypofunction influences the performance of the stop-signal task. To answer this question, we let these NMDA receptor hypofunction rates vary from 0 to 0.05, and compute the SSRT and the mean RTs of no stop-signal trials and noncancelled stop-signal trials in different hypofunction cases (Figure 4C–G). Elevating P O P makes both the R T N S S and the R T N C increase, resulting in the corresponding increment of the SSRT. The weakened ramping-up activity caused by the NMDA receptor hypofunction on OP-OP prolongs the required time of reaching the threshold so that the reaction time and the cancelled time increase. In addition, with the increase of P F I X , the R T N S S drops sharply but the R T N C and the SSRT both exhibit no obvious trend. P F E F I shows an apparent decreasing effect on the performance of the stop-signal task. The R T N S S , the R T N C and the SSRT all decrease with P F E F I increasing. It seems that P S C E and P S C I have a small effect on the task performance. The decrease of the R T N S S and the growth of the SSRT caused by the increments of P S C E and P S C I are both slight, and the R T N C in both cases exhibit no obvious change.
Except for the NMDA receptor hypofunction of a single synapse, we also consider that a pair of NMDA receptor hypofunction rates vary simultaneously. According to the above results, the NMDA receptor hypofunction rates P O P versus P F I X and P O P versus P F E F I are chosen. In the ( P O P , P F I X ) plane, the R T N S S and the R T N C all exhibit the increasing trends along the diagonal line P F I X = P O P + 0.05 . However, the SSRT increases along the back-diagonal line P F I X = P O P . It is notable that the R T N C and the SSRT do not show an obvious trend with the increment of P F I X when P O P is low (Figure 4D and Figure 5B). In the ( P O P , P F E F I ) plane, both R T N S S and R T N C increase along the diagonal line P F E F I = P O P + 0.05 (Figure 6A,B). Although the variations of R T N S S and R T N C are similar to those in the ( P O P , P F I X ) plane, the SSRT shows a different trend which is also increasing along the diagonal line P F E F I = P O P + 0.05 other than the back-diagonal line P F E F I = P O P (Figure 6C).

3.3. The Stop-Signal Task Performance in the Two-Layer Neural Circuit Model

The effects of NMDA receptor hypofunction indicate that the stop-signal task performances in ( P O P , P F I X ) plane is close to the corresponding experimental data in schizophrenia. When P O P = 0.05 and P F I X = 0.04, the R T N S S , R T N C , and the SSRT of the model are 280.18 ms, 239.86 ms, and 127.28 ms, respectively (Figure 7A). The probability of inhibition is 48.26% (Figure 7A). These results are in agreement with the experimental data [7]. Compared to the control state, the model in the schizophrenia state exhibits a longer SSRT, requiring more time to suppress a saccade movement (Figure 7C). This decline of inhibitory control ability can be explained by the NMDA receptor hypofunction in OP-OP synapse and FIX-FIX synapse. The OP neurons control the “go” process and the FIX neurons control the “stop” process. The NMDA receptor hypofunctions in OP-OP synapse and FIX-FIX synapse make the excitatory inputs to the neurons weaken, resulting that the “go” process and the “stop” process need more time to complete. Thus, the R T N S S and the R T N C both increase, making the SSRT rise.

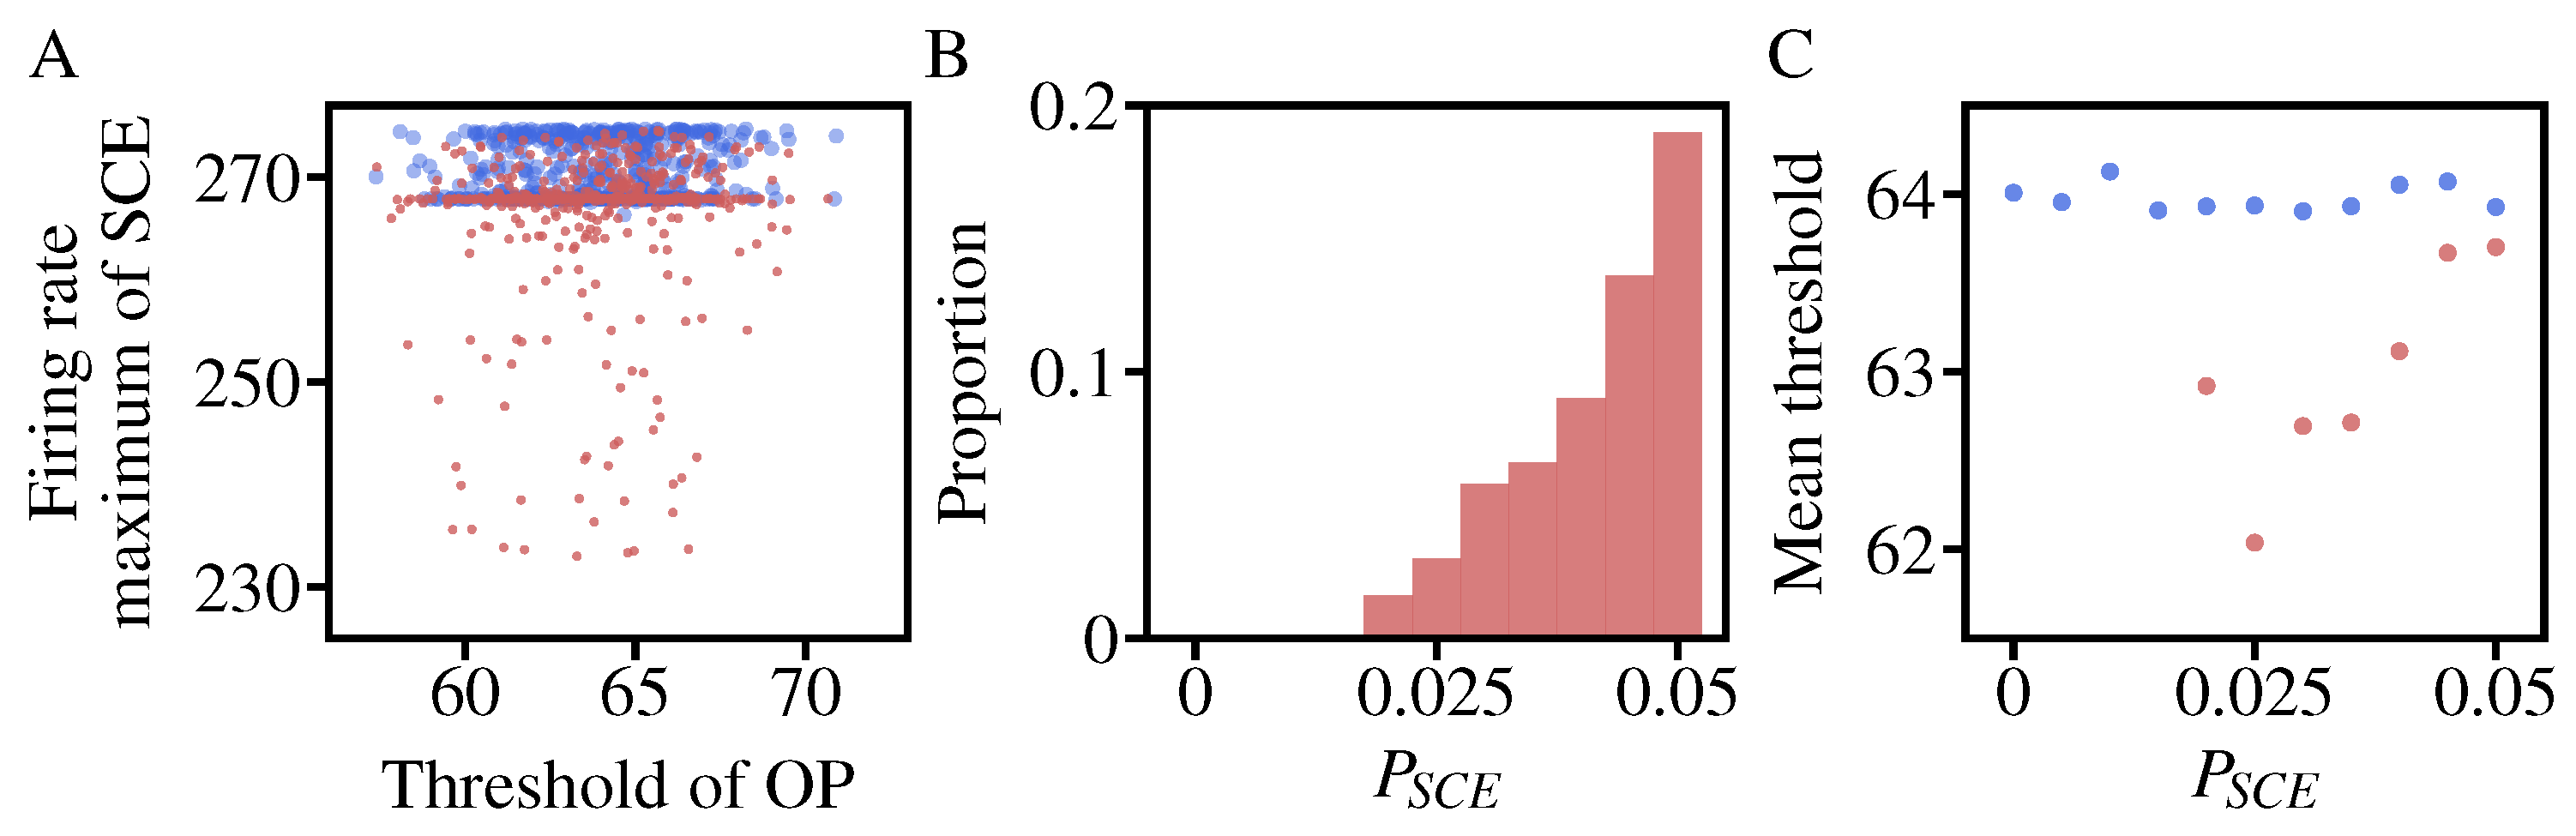
3.4. Changes of the Saccade Threshold While Varying the NMDA Hypofunction Rate

Although the above results reveal that the NMDA hypofunctions in SC have little impact on the performances of the stop-signal task, we find that the saccade threshold is affected by the NMDA hypofunction in SCE-SCE. As is shown in Figure 8A, in the control model, the firing rate maximums of SCE in different trials are in the range of 266.34 Hz to 274.70 Hz. When the NMDA hypofunction occurs in SCE-SCE, we could observe the firing rate maximums of SCE are below 266.34 Hz in a portion of no stop-signal trials, ranging between 230 Hz to 266.34 Hz. The weakened recurrent NMDA-mediated synaptic inputs to SCE induced by the NMDA hypofunction in SCE-SCE make the SCE neurons produce fewer spikes in a number of no stop-signal trials, resulting in the decrease of the peak firing rate. This phenomenon can be observed when P S C E > 0.02, the proportion of which increases along with the increment of P S C E . Additionally, the decrease in the SCE firing rate can affect the saccade threshold of OP. We divide the no stop-signal trials into two groups: the trials of normal SCE firing rate (normal trials) and the trials of decreased SCE firing rate (decreased trials) and calculate the corresponding mean saccade thresholds of OP for the two kinds of trials. It can be seen that the mean saccade threshold of the normal trials maintains about 64 Hz, while that in the decrease trials is below 64 Hz. This result exhibits that the NMDA hypofunction in SCE-SCE can make the subjects easier to produce a saccade movement to the visual target, indicating a kind of threshold-adjustment mechanism to modulate the saccade threshold in the abnormal state.

4. Conclusions and Discussion

In this study, a two-layer neural circuit model was developed to research the effects of NMDAR hypofunction on the inhibitory control function in the stop-signal task. To find the possible NMDAR hypofunction effects in schizophrenia, all NMDA-mediated synapses in the model were set to have NMDAR hypofunction in different degrees. We found that the performances of the stop-signal task were close to the experimental results in schizophrenia when NMDAR hypofunction happened in neurons of two populations that controlled the “go” process and the “stop” process of the stop-signal task. The competition between the “go” process and the “stop” process in the impaired state makes the local neural circuit evolve toward a new balanced state. In this new balanced state, the performances of the circuit model in the stop-signal task exhibit the impairment of inhibitory control. These results implied that the impairment of inhibitory control function in schizophrenia was not simply related to the inhibitory process, but more likely the interactive consequence between the impaired execution and impaired inhibition of behaviors.
The excitation–inhibition balance is a fundamental mechanism for regulating the cognitive functions to adapt to the daily tasks [40,41]. The NMDAR hypofunction can reduce the excitatory synaptic inputs to neurons and break the excitation–inhibition balance. It has been reported that both lowering and elevating excitation–inhibition ratio, through NMDAR hypofunction at excitatory neurons and inhibitory neurons, could impair the performances of decision-making in a similar way [29,42]. Although similar results were obtained in the present study, we found that the performances of the stop-signal task, when elevating the excitation–inhibition ratio via NMDAR hypofunction at inhibitory neurons, were not able to fit the experimental data. This observation hints at a possible mechanism of impairing inhibitory control by the NMDAR hypofunction is lowering the excitation–inhibition ratio to disrupt the excitation–inhibition balance.
Although the NMDAR hypofunction at SC neurons does not change the task performances, it influences the saccade threshold. While receiving less recurrent excitatory synaptic input to SCE neurons with NMDAR hypofunction, the maximum firing rates of SCE will decrease in a part of the trials. Less excitatory input than in the normal condition is sufficient for SCE to generate a saccade movement signal. Thus, the saccade thresholds of the OP population decrease in this part of the trials. This phenomenon may be a threshold-adjustment mechanism to correct some abnormal conditions. Actually, the threshold-adjustment mechanisms have already been reported in cognitive functions. For example, in decision-making, the brain can modulate the decision threshold to dynamically adjust speed and accuracy [43,44]. Confirmation of the threshold-adjustment mechanism in the present study still needs further behavioral and neural experiments.
Increasing research suggest that other brain areas like basal ganglia may be involve in inhibitory control [45,46]. In future work, a larger neural circuit model involving more populations of other brain areas can be developed to acquire a more comprehensive understanding of the NMDAR hypofunction effects. Additionally, the inhibitory control ability can also be estimated in other tasks such as the anti-saccade task [47,48]. Estimating multiple task performances is instrumental in confirming the common computational mechanisms. With the development of artificial intelligence technology, such as Large Language Models, and its applications in various classical problems [49,50,51,52], more complex models combined with experimental data can also contribute to the investigation of these neural mechanisms.

Author Contributions

Conceptualization, W.Y.; methodology, W.Y.; software, W.Y.; validation, W.Y.; formal analysis, W.Y.; investigation, W.Y. and X.C.; resources, W.Y.; data curation, W.Y. and X.C.; writing—original draft preparation, W.Y. and X.C.; writing—review and editing, W.Y.; visualization, W.Y.; supervision, W.Y.; project administration, W.Y.; funding acquisition, W.Y. All authors have read and agreed to the published version of the manuscript.

Funding

This research was funded by the National Natural Science Foundation of China (No. 11702064 and No. 12301269), the Science and Technology Program of Guangzhou, China (No. 202102020830).

Data Availability Statement

No new data were created.

Conflicts of Interest

The authors declare no conflict of interest.

References

  1. Schall, J.; Palmeri, T.; Logan, G. Models of inhibitory control. Philos. Trans. R. Soc. Biol. Sci. 2017, 372, 20160193. [Google Scholar] [CrossRef] [PubMed]
  2. Middlebrooks, P.; Schall, J. Response inhibition during perceptual decision making in humans and macaques. Atten. Percept. Psychophys. 2014, 76, 353–366. [Google Scholar] [CrossRef] [PubMed]
  3. Ethridge, L.; Soilleux, M.; Nakonezny, P.; Reilly, J.; Kristian Hill, S.; Keefe, R.; Gershon, E.; Pearlson, G.; Tamminga, C.; Keshavan, M.; et al. Behavioral response inhibition in psychotic disorders: Diagnostic specificity, familiality and relation to generalized cognitive deficit. Schizophr. Res. 2014, 159, 491–498. [Google Scholar] [CrossRef] [PubMed]
  4. Thakkar, K.; Schall, J.; Logan, G.; Park, S. Cognitive control of gaze in bipolar disorder and schizophrenia. Psychiatry Res. 2015, 225, 254–262. [Google Scholar] [CrossRef] [PubMed]
  5. Schall, J.; Hanes, D.; Taylor, T. Neural control of behavior: Countermanding eye movements. Psychol. Res. 2000, 63, 299–307. [Google Scholar] [CrossRef] [PubMed]
  6. Verbruggen, F.; Aron, A.; Band, G.; Beste, C.; Bissett, P.; Brockett, A.; Brown, J.; Chamberlain, S.; Chambers, C.; Colonius, H.; et al. A consensus guide to capturing the ability to inhibit actions and impulsive behaviors in the stop-signal task. eLife 2019, 8, e46323. [Google Scholar] [CrossRef]
  7. Thakkar, K.; Schall, J.; Boucher, L.; Logan, G.; Park, S. Response Inhibition and Response Monitoring in a Saccadic Countermanding Task in Schizophrenia. Biol. Psychiatry 2011, 69, 55–62. [Google Scholar] [CrossRef]
  8. Kort, N.; Ford, J.; Roach, B.; Gunduz-Bruce, H.; Krystal, J.; Jaeger, J.; Reinhart, R.; Mathalon, D. Role of N-Methyl-D-Aspartate Receptors in Action-Based Predictive Coding Deficits in Schizophrenia. Biol. Psychiatry 2017, 81, 514–524. [Google Scholar] [CrossRef]
  9. Lee, G.; Zhou, Y. NMDAR Hypofunction Animal Models of Schizophrenia. Front. Mol. Neurosci. 2019, 12, 1–26. [Google Scholar] [CrossRef]
  10. Nakazawa, K.; Sapkota, K. The origin of NMDA receptor hypofunction in schizophrenia. Pharmacol. Ther. 2020, 205, 107426. [Google Scholar] [CrossRef]
  11. Willetts, J.; Balster, R. The discriminative stimulus effects of N-methyl-d-aspartate antagonists in phencyclidine-trained rats. Neuropharmacology 1988, 27, 1249–1256. [Google Scholar] [CrossRef] [PubMed]
  12. Krystal, J.; Karper, L.; Seibyl, J.; Freeman, G.; Delaney, R.; Bremner, J.; Heninger, G.; Bowers, M.B.J.; Charney, D. Subanesthetic Effects of the Noncompetitive NMDA Antagonist, Ketamine, in Humans: Psychotomimetic, Perceptual, Cognitive, and Neuroendocrine Responses. Arch. Gen. Psychiatry 1994, 51, 199–214. [Google Scholar] [CrossRef] [PubMed]
  13. Kovacic, P.; Somanathan, R. Clinical Physiology and Mechanism of Dizocilpine (MK-801): Electron Transfer, Radicals, Redox Metabolites and Bioactivity. Oxid. Med. Cell. Longev. 2010, 3, 530859. [Google Scholar] [CrossRef] [PubMed]
  14. Coronel-Oliveros, C.; Pacheco-Calderon, R. Prenatal exposure to ketamine in rats: Implications on animal models of schizophrenia. Dev. Psychobiol. 2018, 60, 30–42. [Google Scholar] [CrossRef]
  15. Szlachta, M.; Pabian, P.; Kusmider, M.; Solich, J.; Kolasa, M.; Zurawek, D.; Dziedzicka-Wasylewska, M.; Faron-Górecka, A. Effect of clozapine on ketamine-induced deficits in attentional set shift task in mice. Psychopharmacology 2017, 234, 2103–2112. [Google Scholar] [CrossRef] [PubMed]
  16. Barnes, S.; Pinto-Duarte, A.; Kappe, A.; Zembrzycki, A.; Metzler, A.; Mukamel, E.; Lucero, J.; Wang, X.; Sejnowski, T.; Markou, A.; et al. Disruption of mGluR5 in parvalbumin-positive interneurons induces core features of neurodevelopmental disorders. Mol. Psychiatry 2015, 20, 1161–1172. [Google Scholar] [CrossRef]
  17. Boucher, L.; Palmeri, T.; Logan, G.; Schall, J. Inhibitory control in mind and brain: An interactive race model of countermanding saccades. Psychol. Rev. 2007, 114, 376–397. [Google Scholar] [CrossRef]
  18. Logan, G.; Yamaguchi, M.; Schall, J.; Palmeri, T. Inhibitory control in mind and brain 2.0: Blocked-input models of saccadic countermanding. Psychol. Rev. 2015, 122, 115–147. [Google Scholar] [CrossRef]
  19. Lo, C.; Boucher, L.; Pare, M.; Schall, J.; Wang, X. Proactive inhibitory control and attractor dynamics in countermanding action: A spiking neural circuit model. J. Neurosci. 2009, 29, 9059–9071. [Google Scholar] [CrossRef]
  20. Wang, X. Decision making in recurrent neuronal circuits. Neuron 2008, 60, 215–234. [Google Scholar] [CrossRef]
  21. Lundqvist, M.; Compte, A.; Lansner, A. Bistable, Irregular Firing and Population Oscillations in a Modular Attractor Memory Network. PLoS Comp. Biol. 2010, 6, e1000803. [Google Scholar] [CrossRef] [PubMed]
  22. Carrillo, J.; Cordier, S.; Deco, G.; Mancini, S. Complexity Reduction of Rate-Equations Models for Two-Choice Decision-Making. PLoS ONE 2013, 8, e80820. [Google Scholar] [CrossRef] [PubMed]
  23. Rodriguez, G.; Sarazin, M.; Clemente, A.; Holden, S.; Paz, J.; Delord, B. Conditional bistability, a generic cellular mnemonic mechanism for robust and flexible working memory computations. J. Neurosci. 2018, 38, 5209–5219. [Google Scholar] [CrossRef] [PubMed]
  24. Seeholzer, A.; Deger, M.; Gerstner, W. Stability of working memory in continuous attractor networks under the control of short-term plasticity. PLoS Comp. Biol. 2019, 15, e1006928. [Google Scholar] [CrossRef]
  25. Ye, W. Dynamics of a revised neural mass model in the stop-signal task. Chaos Solitons Fractals 2020, 139, 110004. [Google Scholar] [CrossRef]
  26. Li, P.; Lu, Y.; Xu, C.; Ren, J. Insight into Hopf Bifurcation and Control Methods in Fractional Order BAM Neural Networks Incorporating Symmetric Structure and Delay. Cogn. Comput. 2023, 1–43. [Google Scholar] [CrossRef]
  27. Xu, C.; Liu, Z.; Li, P.; Yan, J.; Yao, L. Bifurcation Mechanism for Fractional-Order Three-Triangle Multi-delayed Neural Networks. Neural Process. Lett. 2022, 1–27. [Google Scholar] [CrossRef]
  28. Li, P.; Peng, X.; Xu, C.; Han, L.; Shi, S. Novel extended mixed controller design for bifurcation control of fractional-order Myc/E2F/miR-17-92 network model concerning delay. Math. Methods Appl. Sci. 2023, 1–21. [Google Scholar] [CrossRef]
  29. Lam, N.; Borduqui, T.; Hallak, J.; Roque, A.; Anticevic, A.; Krystal, J.; Wang, X.; Murray, J. Effects of Altered excitation–inhibition Balance on Decision Making in a Cortical Circuit Model. J. Neurosci. 2022, 42, 1035–1053. [Google Scholar] [CrossRef]
  30. Murray, J.; Anticevic, A.; Gancsos, M.; Ichinose, M.; Corlett, P.; Krystal, J.; Wang, X. Linking Microcircuit Dysfunction to Cognitive Impairment: Effects of Disinhibition Associated with Schizophrenia in a Cortical Working Memory Model. Cereb Cortex 2012, 24, 859–872. [Google Scholar] [CrossRef]
  31. Yizhar, O.; Fenno, L.; Prigge, M.; Schneider, F.; Davidson, T.; O’Shea, D.; Sohal, V.; Goshen, I.; Finkelstein, J.; Paz, J.; et al. Neocortical excitation/inhibition balance in information processing and social dysfunction. Nature 2011, 477, 171–178. [Google Scholar] [CrossRef] [PubMed]
  32. Pare, M.; Hanes, D. Controlled Movement Processing: Superior Colliculus Activity Associated with Countermanded Saccades. J. Neurosci. 2003, 23, 6480–6489. [Google Scholar] [CrossRef] [PubMed]
  33. Verbruggen, F.; Logan, G. Automatic and controlled response inhibition: Associative learning in the go/no-go and stop-signal paradigms. J. Exp. Psychol. Gen. 2008, 137, 649–672. [Google Scholar] [CrossRef] [PubMed]
  34. McCormick, D.; Connors, B.; Lighthall, J.; Prince, D. Comparative electrophysiology of pyramidal and sparsely spiny stellate neurons of the neocortex. J. Neurophysiol. 1985, 54, 782–806. [Google Scholar] [CrossRef] [PubMed]
  35. Brunel, N.; Wang, X. Effects of Neuromodulation in a Cortical Network Model of Object Working Memory Dominated by Recurrent Inhibition. J. Comput. Neurosci. 2001, 11, 63–85. [Google Scholar] [CrossRef]
  36. Wang, X. Probabilistic Decision Making by Slow Reverberation in Cortical Circuits. Neuron 2002, 36, 955–968. [Google Scholar] [CrossRef]
  37. Tuckwell, H.; Wan, F.; Rospars, J. A spatial stochastic neuronal model with Ornstein-Uhlenbeck input current. Biol. Cybern. 2002, 86, 137–145. [Google Scholar] [CrossRef]
  38. Wong, K.; Wang, X. A recurrent network mechanism of time integration in perceptual decisions. J. Neurosci. 2006, 26, 1314–1328. [Google Scholar] [CrossRef]
  39. Nakao, K.; Jeevakumar, V.; Jiang, S.; Fujita, Y.; Diaz, N.; Pretell Annan, C.; Eskow Jaunarajs, K.; Hashimoto, K.; Belforte, J.; Nakazawa, K. Schizophrenia-Like Dopamine Release Abnormalities in a Mouse Model of NMDA Receptor Hypofunction. Schizophr. Bull. 2018, 45, 138–147. [Google Scholar] [CrossRef]
  40. Van Vreeswijk, C.; Sompolinsky, H. Chaos in neuronal networks with balanced excitatory and inhibitory activity. Science 1996, 274, 1724–1726. [Google Scholar] [CrossRef]
  41. Shu, Y.; Hasenstaub, A.; McCormick, D. Turning on and off recurrent balanced cortical activity. Nature 2003, 423, 288–293. [Google Scholar] [CrossRef] [PubMed]
  42. Cavanagh, S.; Lam, N.; Murray, J.; Hunt, L.; Kennerley, S. A circuit mechanism for decision-making biases and NMDA receptor hypofunction. eLife 2020, 9, e53664. [Google Scholar] [CrossRef] [PubMed]
  43. Lo, C.; Wang, C.; Wang, X. Speed-accuracy tradeoff by a control signal with balanced excitation and inhibition. J. Neurophysiol. 2015, 114, 650–661. [Google Scholar] [CrossRef] [PubMed]
  44. Derosiere, G.; Thura, D.; Cisek, P.; Duque, J. Trading accuracy for speed over the course of a decision. J. Neurophysiol. 2021, 126, 361–372. [Google Scholar] [CrossRef] [PubMed]
  45. Wei, W.; Wang, X. Inhibitory Control in the Cortico-Basal Ganglia-Thalamocortical Loop: Complex Regulation and Interplay with Memory and Decision Processes. Neuron 2016, 92, 1093–1105. [Google Scholar] [CrossRef]
  46. Jahanshahi, M.; Obeso, I.; Rothwell, J.; Obeso, J. A fronto-striato-subthalamic-pallidal network for goal-directed and habitual inhibition. Nat. Rev. Neurosci. 2015, 16, 719–732. [Google Scholar] [CrossRef] [PubMed]
  47. Everling, S.; Dorris, M.; Munoz, D. Reflex suppression in the anti-saccade task is dependent on prestimulus neural processes. J. Neurophysiol. 1998, 80, 1584–1589. [Google Scholar] [CrossRef] [PubMed]
  48. Munoz, D.; Everling, S. Look away: The anti-saccade task and the voluntary control of eye movement. Nat. Rev. Neurosci. 2004, 5, 218–228. [Google Scholar] [CrossRef] [PubMed]
  49. Thirunavukarasu, A.; Ting, D.; Elangovan, K.; Gutierrez, L.; Tan, T.; Ting, D. Large language models in medicine. Nat. Med. 2023, 29, 1930–1940. [Google Scholar] [CrossRef]
  50. de Curto, J.; de Zarza, I.; Roig, G.; Cano, J.; Manzoni, P.; Calafate, C. LLM-Informed Multi-Armed Bandit Strategies for Non-Stationary Environments. Electronics 2023, 12, 2814. [Google Scholar] [CrossRef]
  51. de Zarza, I.; de Curto, J.; Roig, G.; Calafate, C. LLM Adaptive PID Control for B5G Truck Platooning Systems. Sensors 2023, 23, 5899. [Google Scholar] [CrossRef] [PubMed]
  52. de Zarza, I.; de Curto, J.; Roig, G.; Manzoni, P.; Calafate, C. Emergent Cooperation and Strategy Adaptation in Multi-Agent Systems: An Extended Coevolutionary Theory with LLMs. Electronics 2023, 12, 2722. [Google Scholar] [CrossRef]
Figure 1. (A) The architecture of the two-layer network model. OP represents the excitatory orientation-preferred neuron population, FIX is the excitatory fixation neuron population, and E is the excitatory population in the SC layer (SCE), I denote the inhibitory populations in the FEF layer (FEFI) and the SC layer (SCI). (B) The paradigms of the stop-signal task. The filled circle is the stimulus, the dashed circle represents the fixating position of eyes.
Mathematics 11 04063 g001
Figure 2. The task performances of three trials: No stop signal trial (A), cancelled stop signal trial (B), and noncancelled stop signal trial (C). In each chart, the upper panel displays the raster plot of spikes in different populations. The middle and lower panels exhibit the corresponding population firing rates. In all panels, FIX is blue, OP is red and SCE is yellow.
Mathematics 11 04063 g002
Figure 3. (A) The reaction time distributions of the no stop-signal trial (red) and the noncancelled stop-signal task (blue). (B) The cumulative saccade probability of no stop-signal trial (red) and noncancelled stop-signal task (blue) correspond to panel (A). (C,D) The comparison on the mean reaction times of no stop-signal trial (red) and noncancelled stop-signal task (blue), the stop-signal reaction time (green), and the probability of inhibition (orange) between model and experimental data previously reported by Thakkar et al. [7].
Mathematics 11 04063 g003
Figure 4. (A,B) The averaged firing rates of OP (A) and FIX (B) when they are in four conditions: the control model (black), NMDAR hypofunction in OP-OP synapses (red), NMDAR hypofunction in FIX-FIX synapses (blue), NMDAR hypofunction in OP-FEFI synapses (orange). (CG) The variations of the mean reaction times of the no stop-signal trial (red) and the noncancelled stop-signal task (blue) as well as the stop-signal reaction time (green) when different NMDAR hypofunction rates change: P O P (C), P F I X (D), P F E F I (E), P S C E (F), P S C I (G). The straight lines in each panel are the fitted curves.
Mathematics 11 04063 g004
Figure 5. The changes of the mean reaction times of the no stop-signal trial (A) and the noncancelled stop-signal trial (B) as well as the stop-signal reaction time (C) in the ( P O P , P F I X ) plane.
Mathematics 11 04063 g005
Figure 6. The changes of the mean reaction times of the no stop-signal trial (A) and the noncancelled stop-signal trial (B) as well as the stop-signal reaction time (C) in the ( P O P , P F E F I ) plane.
Mathematics 11 04063 g006
Figure 7. (A,B) The comparison on the mean reaction times of no stop-signal trial (red) and noncancelled stop-signal task (blue), the stop-signal reaction time (green), and the probability of inhibition (orange) between model and experimental data previously reported by Thakkar et al. [7] when P O P = 0.05 and P F I X = 0.04. (C) The cumulative saccade probability of the no stop-signal trial (deep color) and the noncancelled stop-signal task (light color) in the control state (blue) and the schizophrenia state (red).
Mathematics 11 04063 g007
Figure 8. (A) The OP saccade threshold versus the SCE firing rate maximum of different trials in the control state (blue) and the schizophrenia state (red). (B) The proportion of low firing rate trials at different P S C E . (C) The mean saccade threshold at different P S C E in the control state (blue) and schizophrenia state (red).
Mathematics 11 04063 g008
Disclaimer/Publisher’s Note: The statements, opinions and data contained in all publications are solely those of the individual author(s) and contributor(s) and not of MDPI and/or the editor(s). MDPI and/or the editor(s) disclaim responsibility for any injury to people or property resulting from any ideas, methods, instructions or products referred to in the content.

