Abstract
The work is devoted to the development of a maximum entropy estimation method with soft randomization for restoring the parameters of probabilistic mathematical models from the available observations. Soft randomization refers to the technique of adding regularization to the functional of information entropy in order to simplify the optimization problem and speed up the learning process compared to the classical maximum entropy method. Entropic estimation makes it possible to restore probability distribution functions for model parameters without introducing additional assumptions about the likelihood function; thus, this estimation method can be used in problems with an unspecified type of measurement noise, such as analysis and forecasting of time series.
MSC:
68Q87; 62F35; 62D20
1. Introduction
This work is devoted to the development of a maximum entropy estimation method with soft randomization for restoring the values of the parameters of probabilistic mathematical models from the available observations. Soft randomization is understood as the technique of adding regularization to the information entropy functional in order to simplify the optimization problem and speed up the learning process was originally proposed in a recent work [1].
When solving regression problems, it is generally accepted to separate the classical statistical approach, in which the model parameters are considered deterministic, and their values are estimated, for example, using the least squares method (LS) or the maximum likelihood method (ML) [2] and the probabilistic approach, according to which the model parameters are assumed to be random variables, and the result of estimation is their probabilistic characteristics [3]. This approach corresponds, for example, to Bayesian estimation and entropy-robust estimation—the general maximum entropy method (GME) [4]. One of the differences between the statistical and probabilistic approaches is that the latter allows the use of probabilistic characteristics and properties of random variables to refine estimates and subsequent forecasts using them.
In practice, the transition to probabilistic estimation is most common in problems where the prerequisites of the classical least squares method and the Gauss–Markov theorem [5] are violated. Examples are problems with a small amount of input data, when it becomes difficult to test statistical hypotheses, and problems with non-standard types of errors or, in general, unstructured noise. Estimates obtained by probabilistic methods for such problems may turn out to be biased, but more efficient than classical methods estimates, such as LS, in terms of the mean square error of estimates [6].
It is worth noting that entropy and other entropy-based metrics are widely used in the field of data analysis, in general, and time series analysis, in particular. For instance, in works [7,8,9,10], the entropy concepts are used as measures of time series dependence as an alternative to correlation-based metrics.
In [11,12], the concept of soft entropy estimation was considered, including obtaining entropy-optimal probability density functions for model parameters in general form, and the effectiveness of the proposed method of approximate maximum entropy estimation was also investigated. This method was compared with the maximum likelihood method and Bayesian estimation method, both experimentally and theoretically for special cases. Estimation methods were tested on the example of a linear regression problem with various types of errors. The experiments carried out make it possible to distinguish a class of problems in which the proposed method is more efficient than its analogs. These problems include cases where the distribution of model errors differs from the standard normal distribution in terms of skewness and kurtosis. In addition, the efficiency of maximum entropy estimation becomes more noticeable under the conditions of a small amount of input data.
This paper presents the results of a study of the practical applicability of the soft maximum entropy method in the problems of analysis and forecasting of time series. The aim of this study is to analyze the effectiveness of the proposed approach for solving practical problems of time series analysis.
The rest of the article is organized as follows: in Section 2 and Section 3, we provide a brief time series analysis review and revisit ARMA model estimation methods; in Section 4, we present a variation of traditional maximum entropy method and apply it to the ARMA model estimation problem; Section 5 and Section 6 contain the results of experiments with synthetic data and real data, respectively; and Section 7 is the conclusion and final summary of the presented work.
2. Time Series Analysis Review
One of the most versatile and widely used models for time series analysis is the autoregressive moving average, or ARMA model for short [13,14]. This model is used to build a functional dependence of some target variable based on its past values and on the values of the noise of the model.
There is also a modification of the classical ARMA model with the addition of an integrated component of the series (Autoregressive Integrated Moving Average—ARIMA) in order to model non-stationary series by calculating the differences in a certain order from its original values [15,16]. To restore dependence on other variables, terms for the regressors of the model (ARIMAX) are added to the model, traditionally denoted by the X matrix. In other words, the construction of the most universal time series models is based on the classical ARMA model.
A second widely known group of models for time series analysis is the autoregressive conditional heteroscedasticity (ARCH) models and generalized ARCH (GARCH) models [17,18]. This type of model is used to restore the dependence of the conditional variance of a series on its past values. That is, they are rather models for analyzing the type and distribution of the errors in a series, and, therefore, are often used in conjunction with models of the series itself, such as ARMA/ARIMA [19].
In this paper, we propose a new estimation method for restoring the model parameters of some functional dependence of the time series; therefore, in the future, we will consider the ARMA model as one of the most universal for time series analysis.
3. Building an ARMA Model and Estimation Methods
The ARMA model is a combination of simpler models, namely, the autoregressive model (AR) and the moving average (MA) model, which, in general, have the following form:
Correspondingly:
Here, p and q are the hyperparameters of the model. The orders of the model are chosen, as a rule, by analyzing the plots of the autocorrelation function (ACF) and partial autocorrelation function (PCF) [20]. Another way to choose the order of the model is to calculate the information criteria Akaike’s information criterion (AIC) and Bayesian information criterion (BIC) [21]. The preferred models are those that exhibit lower values of these criteria.
We restrict ourselves here to this brief description of the methods for choosing the model order without detailed formulas for autocorrelation functions and information criteria, which is due to the fact that the object of study in this paper is the method of estimating the model parameter, and not its order or structure.
The estimation of the model parameters is understood as the restoration of the values of the parameters and from a sample of available observations. Unlike classical linear regression, the traditional least squares method becomes inapplicable for the ARMA model due to the recursive structure of the model itself.
The most common method for estimating the parameters of an ARMA model is the maximum likelihood method (maximum likelihood estimation—MLE); this method is the “standard” for building ARMA models in most development environments, such as R, Python, MATLAB, etc. [22,23]. The method uses the likelihood or log-likelihood function and computational algorithms to find the maximum point. Despite the widespread use of the MLE method, it has two significant drawbacks that make it difficult to apply in practice.
The first disadvantage is the need to make assumptions about the true form of the likelihood function for the model noise. The traditional choice here is the normal distribution; however, there are problems in time series analysis in which the errors are distributed differently, or the size of the input data sample is insufficient to build and test such hypotheses [24,25]. This feature is characteristic of all estimation methods that use a predetermined form of the likelihood function for optimization, that is, for Bayesian estimation too [26].
Another disadvantage of the MLE method is the point nature of the resulting estimates. As a result of solving the optimization problem, one single point will be selected; this point will set the vector of model parameters and determine one single curve along which the process can develop. On the other hand, in Bayesian estimation, the result of the estimate is the distribution functions for the model parameters, which allows building confidence intervals in order to refine the forecasts.
Among the alternative methods for estimating the parameters of ARMA models, one can distinguish the method of moments based on the use of the values of the ACF/PCF characteristics and sample moments [27], the method based on the Yule–Walker estimation equations, and the analytical derivation of a solution for the model parameters [28], as well as the so-called innovations algorithm based on successive recursive approximation of the solution [29]. Some of the most recent works in the field of robust parameter estimation for time series models are [30,31].
Another alternative for searching for the parameters of the ARMA model can be the method of soft maximum entropy estimation proposed in this study. This method is an approximation of the classical maximum entropy method [32,33] in order to simplify the optimization problem and speed up calculations [1].
4. Method of Soft Maximum Entropy Estimation for ARMA Model
The method of approximate maximum entropy estimation proposed in this paper is formulated for the regression recovery problem of the following type:
where F is a vector function and are measurement noise.
The traditional maximum entropy estimation method is formulated as follows [4]:
under the constraints to the average model output (first-moment balance):
The optimization problem listed above has the solution in the general form using Lagrange multipliers the search for which is the main computational task carried out by the substitution of the solution for P and Q into the balance constraints, i.e., the system of integral equations.
The accelerated variation of the maximum entropy estimation method [1] consists of optimizing the modified information entropy functional with the addition of regularization terms:
Here, and are the average values for the Hölder model output norm and noise norm:
That is:
Thus, the idea of so-called soft maximum entropy estimation is to calculate the approximate maximum of the entropy functional with the minimization of the average model error norm instead of solving the system of balance constraints.
In [11,12], the solution of the optimization problem for the soft maximum entropy estimation method was obtained in the general form:
The function can be treated as a posterior distribution function of the parameters and, similar to the Bayesian approach, can be used to calculate the average values of the parameters or MAP estimates, while additional assumptions regarding the error likelihood function were not used to obtain them.
A feature of the proposed estimation method is the presence of a direct functional dependence, . If the autoregressive component of the time series model corresponds to this structure and is observable, then the presence of the lag terms of the moving average greatly complicates such a representation, as a result of which the general maximum entropy estimation method becomes inapplicable for the ARMA model explicitly.
Let us consider the representation of the ARMA model through the lag operator, L:
Then, omitting (without loss of generality) the constant, the autoregressive models for the variable x will have the following form:
Similarly, we transform the moving average models:
By combining the representations for AR(p) and MA(q), we obtain:
Here, we consider the important property of the invertibility of the ARMA model using the example of individual first-order models.
For example, for AR(1), the following statement is true:
where , and .
The proof of this fact follows from the following expression, if we substitute the required form of the coefficients, :
Furthermore, similarly, for MA(1), it is true:
where , and .
The proof is carried out in a similar way, substituting the required form of the coefficients, :
The considered statements demonstrate the invertibility property for autoregressive models when the autoregressive component can be represented as an infinite series of moving average terms and vice versa.
It turns out that the more general models AR(p) and MA(q) are also invertible under certain restrictions on the values of the coefficients [34]. In general, the condition for the invertibility of the ARMA(p,q) model is the absence of identical roots of the characteristic polynomials, and , and roots exceeding modulo 1, similar to the considered cases for a single coefficient in AR(1) and MA(1).
Then, we can represent the general ARMA model in the following form:
or vice versa:
Thus, it is possible to represent the ARMA model in such a way that all its terms are observable, except for one single term for the residuals of the model, similar to the classical regression problem.
It is on the possibility of such a representation that the Hannan–Rissanen algorithm is based on iterative calculation of parameter estimates for the ARMA model [35]. By analogy with this algorithm, we represent the problem of maximum entropy estimation for the ARMA model as a sequence of several stages:
- 1.
- Build an AR model of a higher order (for example, for the original ARMA(p,q) model at this stage, starting with an estimate of AR(p+q));
- 2.
- Calculate, using the model from step 1, the values of the residuals, , for each time, t;
- 3.
- Using a sample of values of the target variable X and the found values of the residuals, build an ARMA(p,q) model:
After step 3, new estimates for the residuals of the model can be used to further improve the estimates of the parameters.
Thus, at each stage, the parameters of the model are estimated, in which all terms are observable values: first, this is the target variable itself and its past values; then, the calculated values of the residuals of the model. Accordingly, this algorithm can use the maximum entropy estimation method, with both based on the original maximum entropy method (general maximum entropy—GME) and its modification proposed in this paper—the soft maximum entropy estimation method.
5. Results of Experiments with Model Data
This section presents the results of testing the performance and efficiency of the proposed algorithm in model experiments on synthetic datasets.
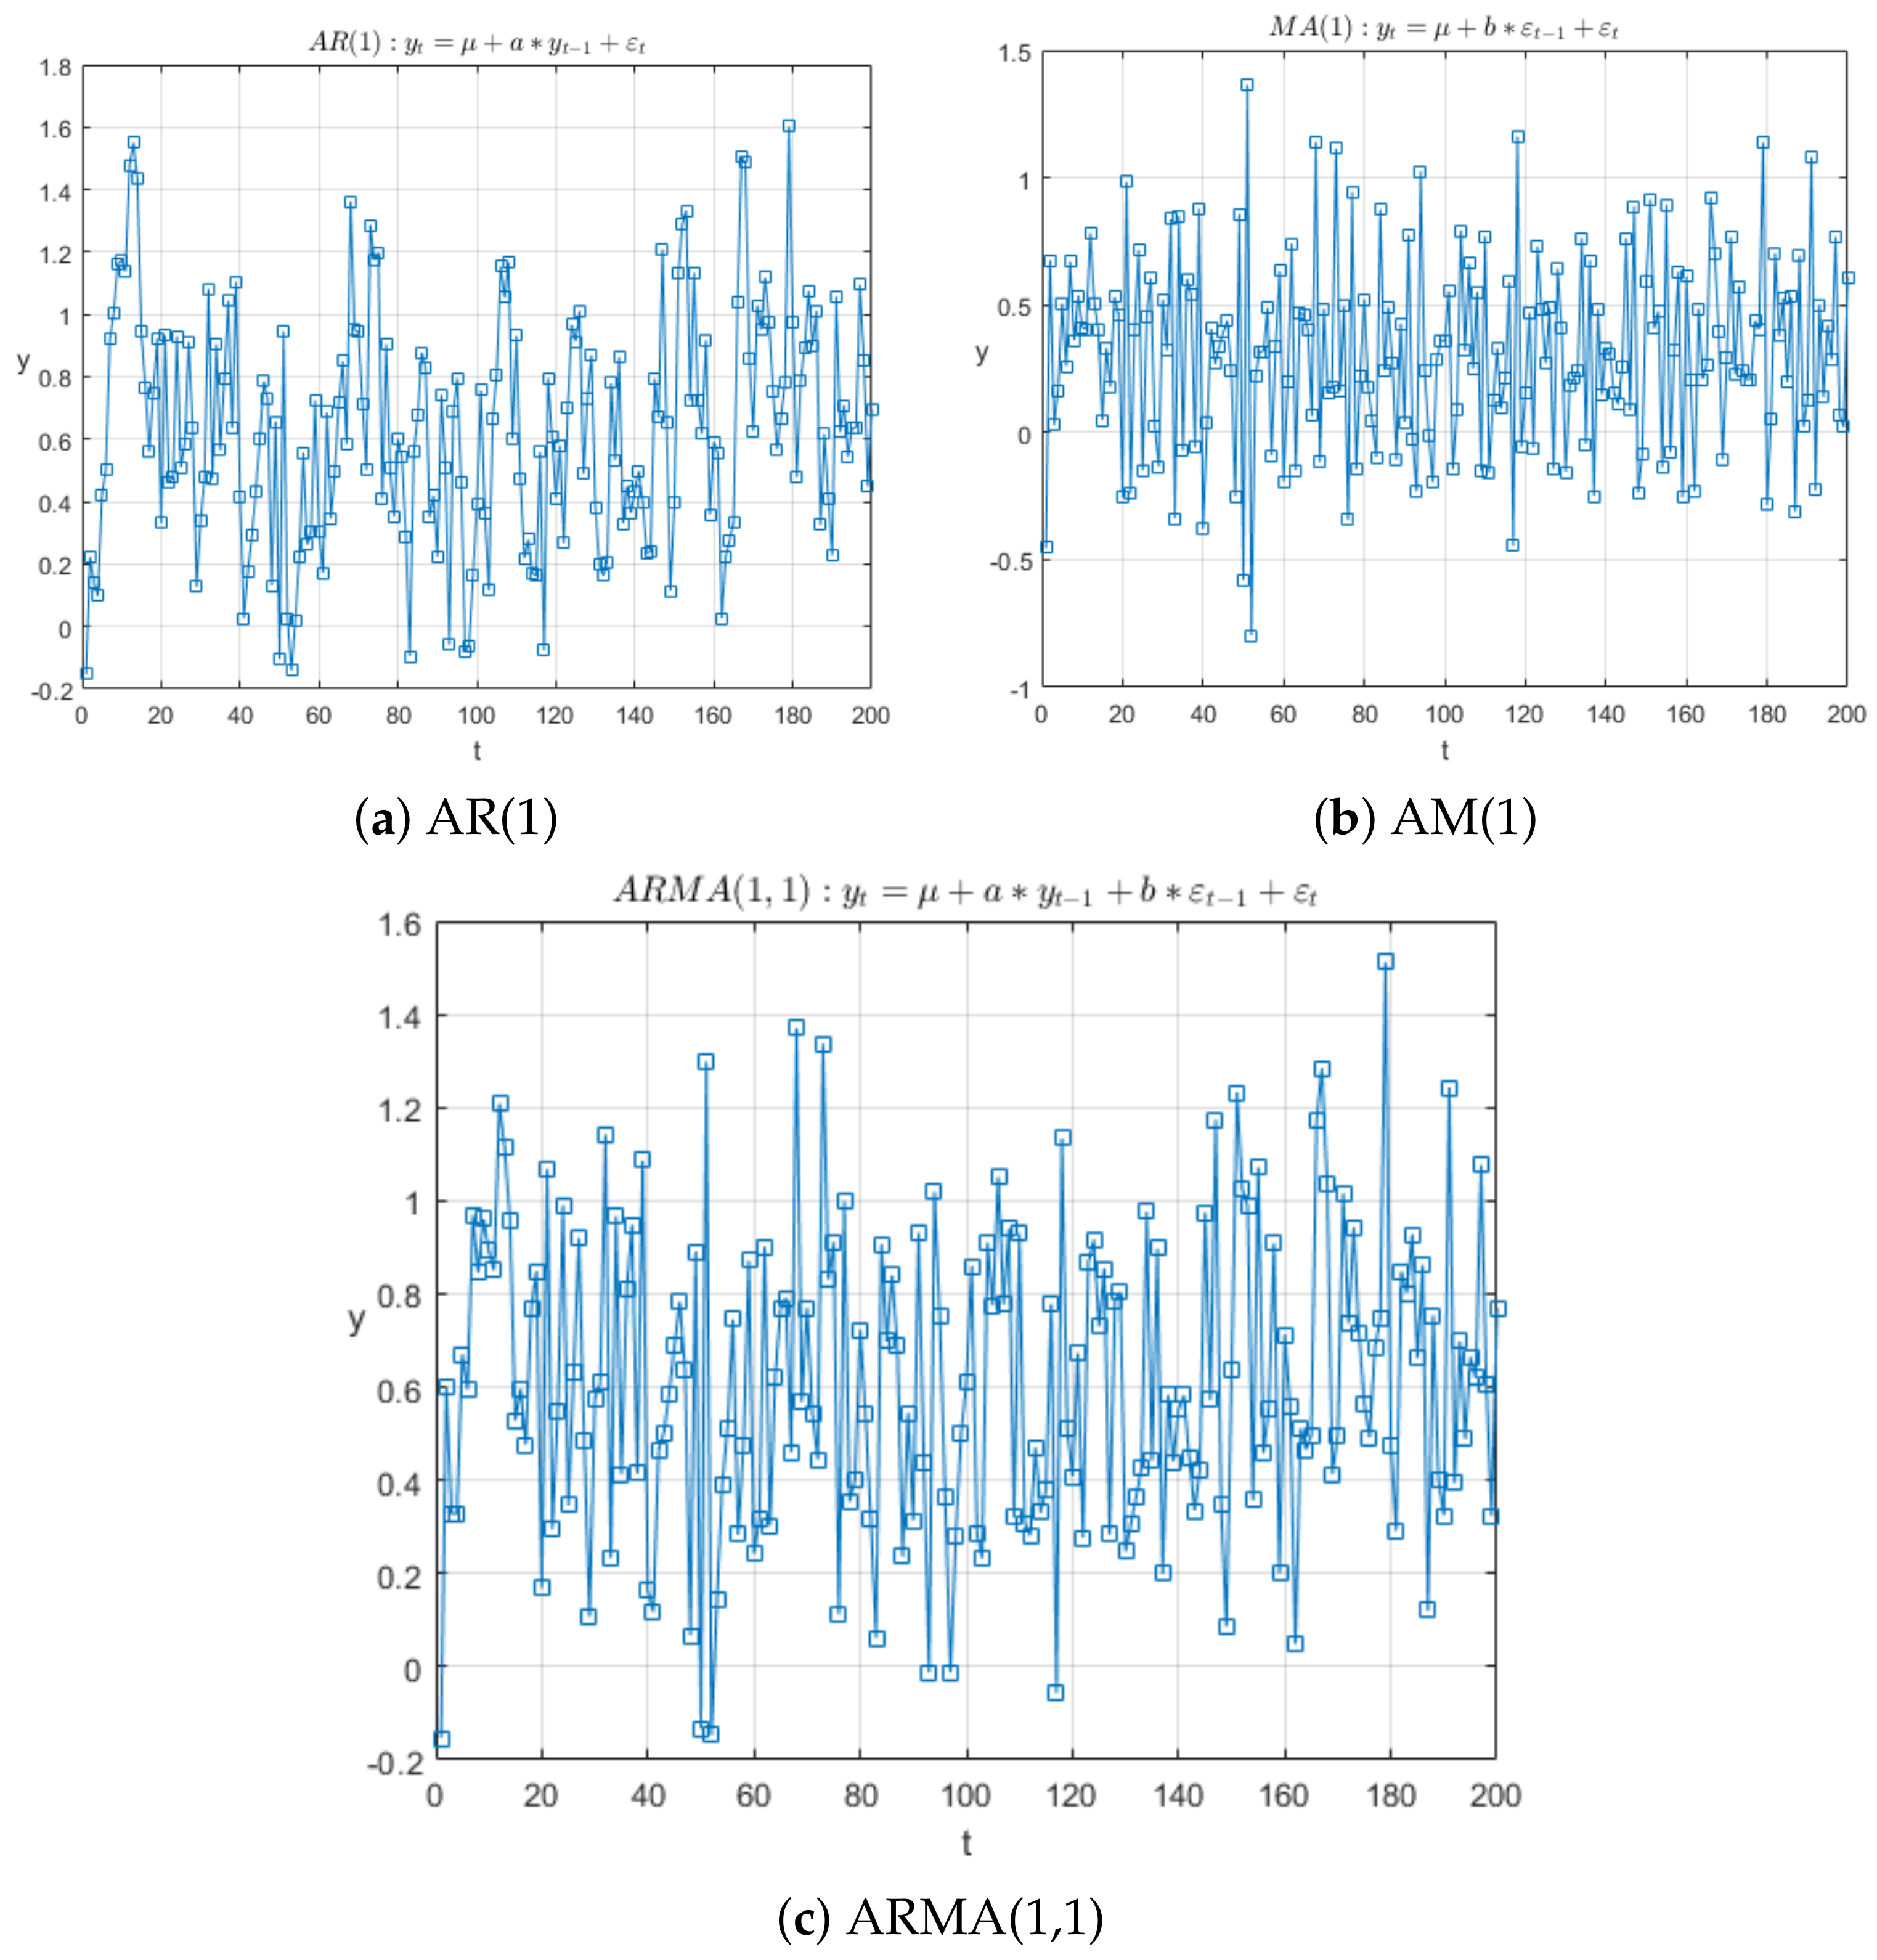
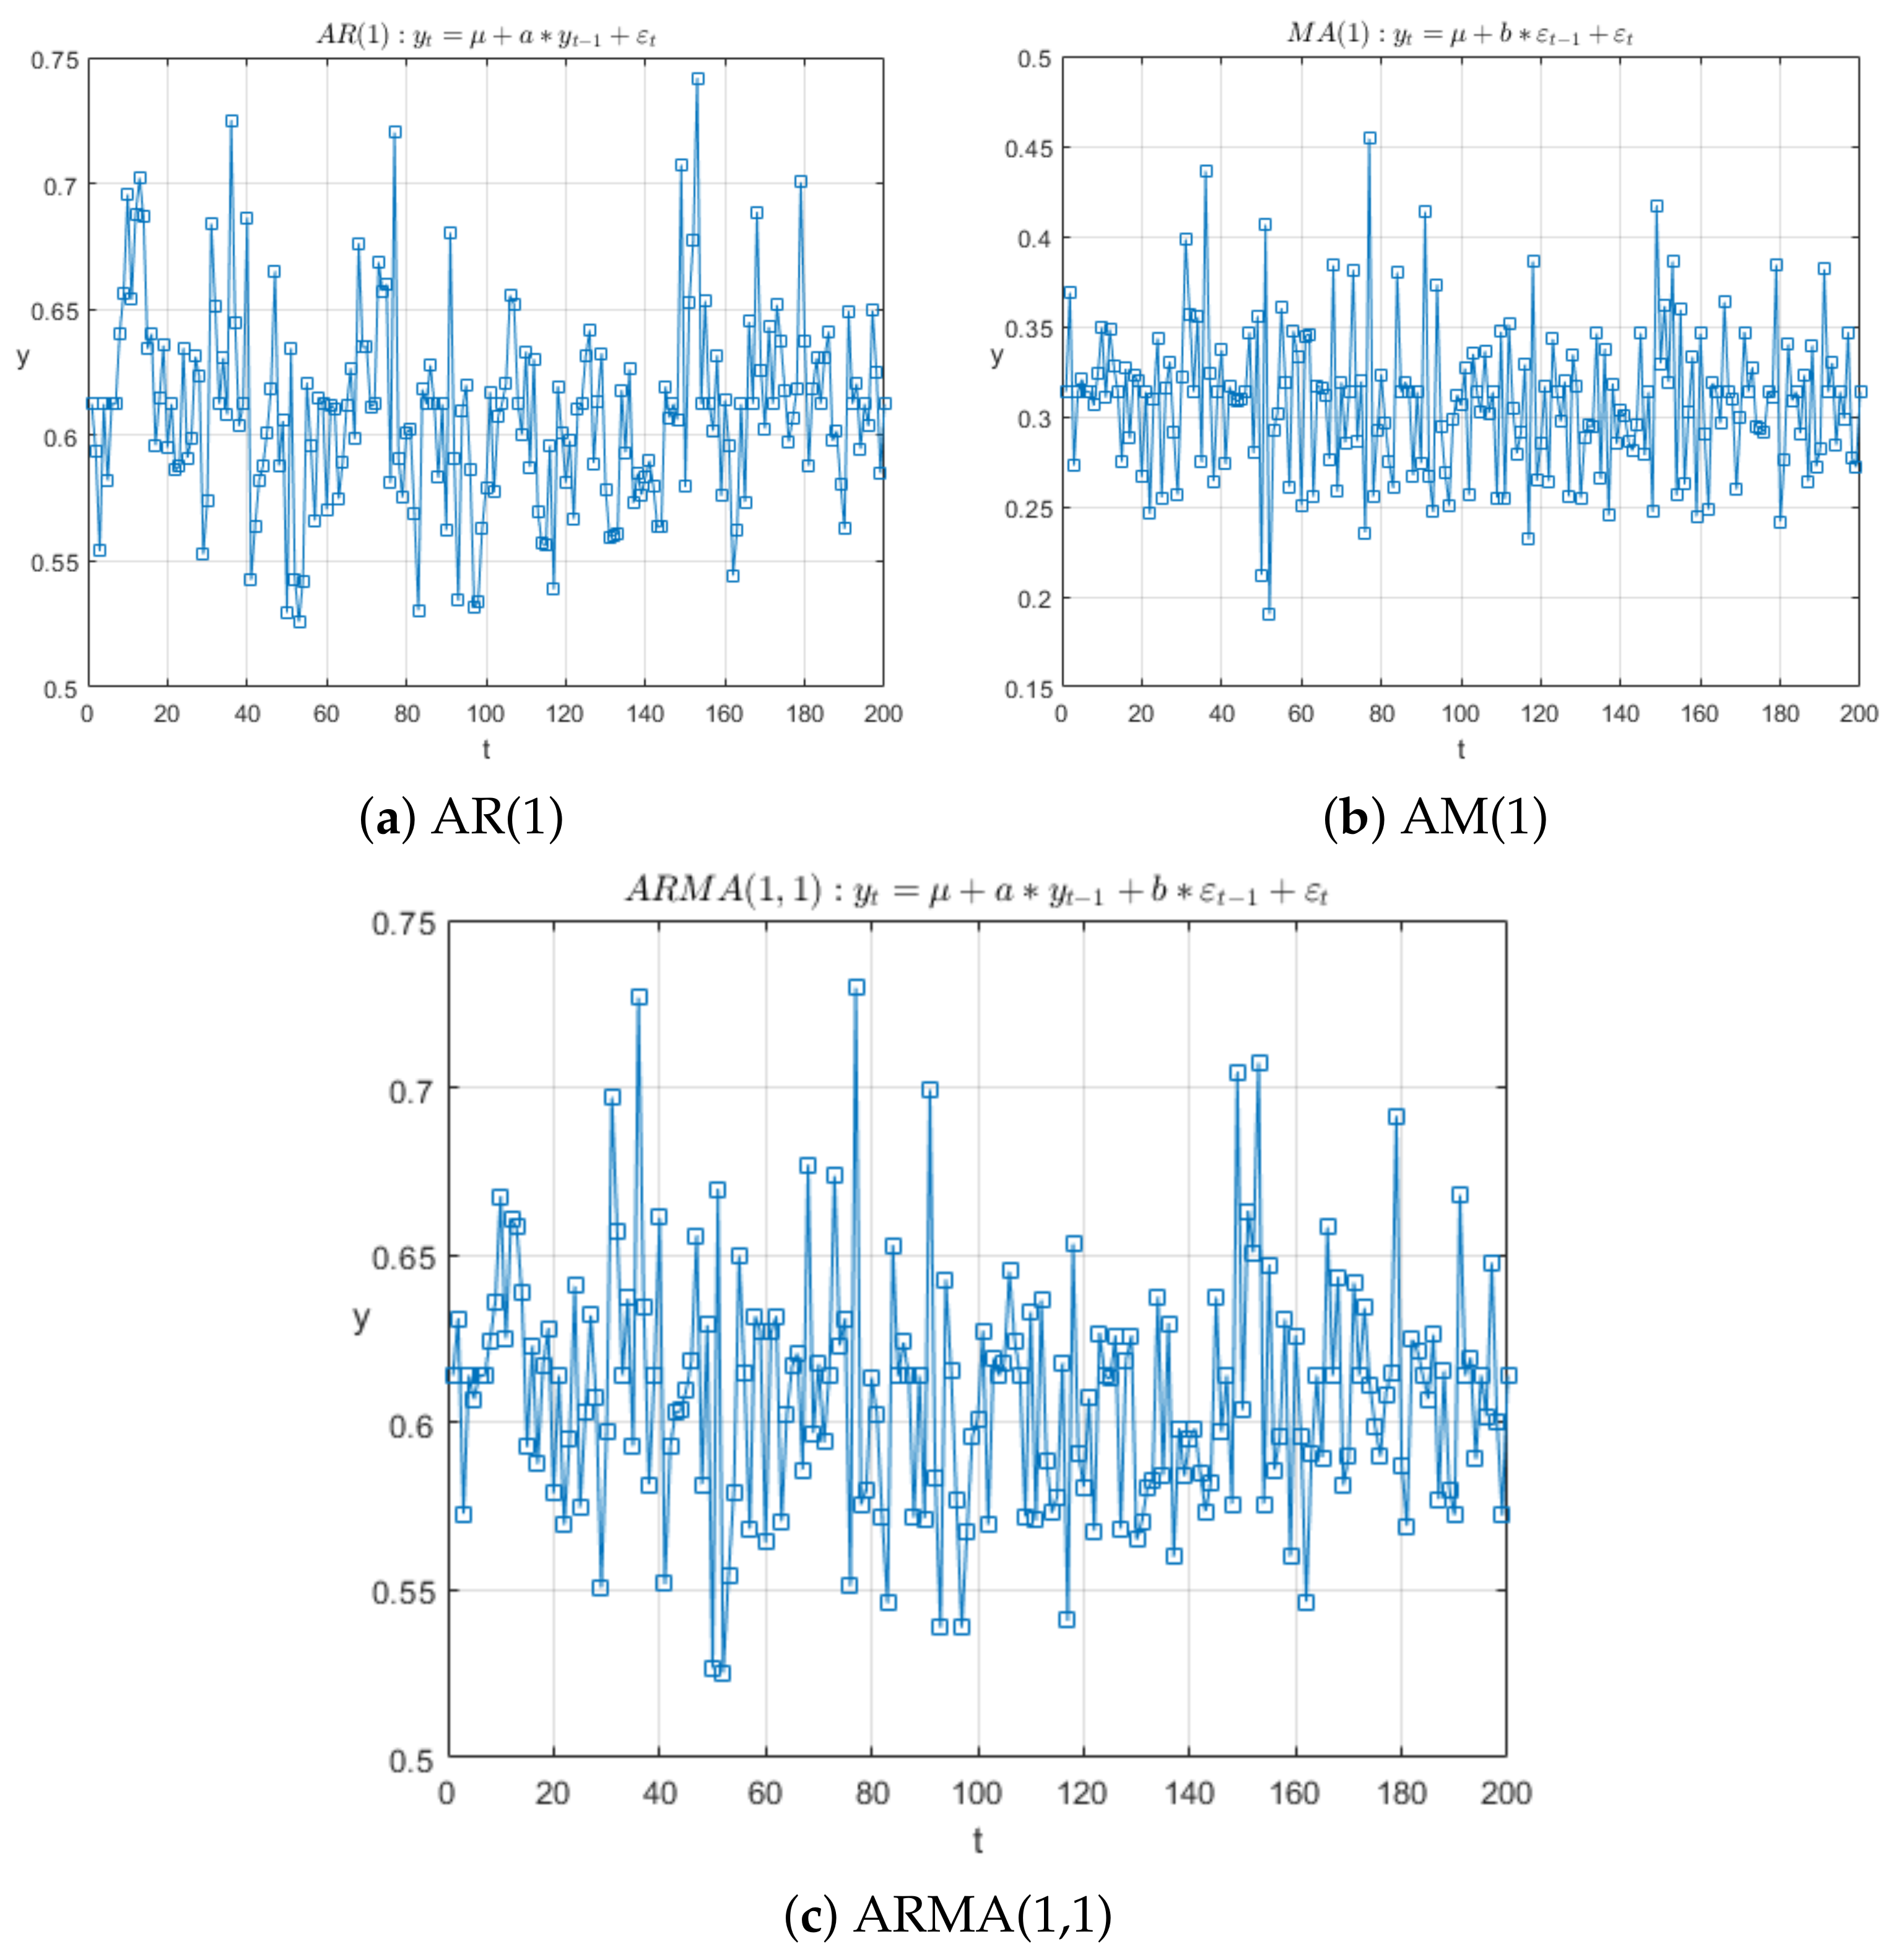
Testing is carried out on several time series models: AR(1), MA(1), ARMA(1,1), and, in the general case, implementation for ARMA(p,q), which is possible. In the first series of experiments, time series data with a given model are generated under standard noise corresponding to a normal distribution, , as shown in Figure 1. In the second series of experiments, the distribution of measurement errors is replaced by a non-standard and asymmetric chi-square distribution—, with examples of noisy data that include outlier processing shown in Figure 2. Finally, the third series of experiments demonstrates the example of other non-standard errors, in this case, exponential distribution . The purpose of the experiments is to compare the effectiveness of various estimation methods under the conditions of different non-standard measurement noises.
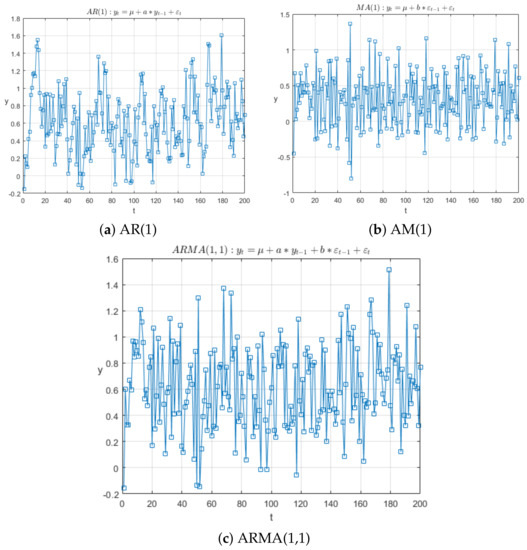
Figure 1.
Examples of standard time series models: AR(1) first-order autoregressive model (a), MA(1) first-order moving average model (b), and ARMA(1,1) combined model (c).
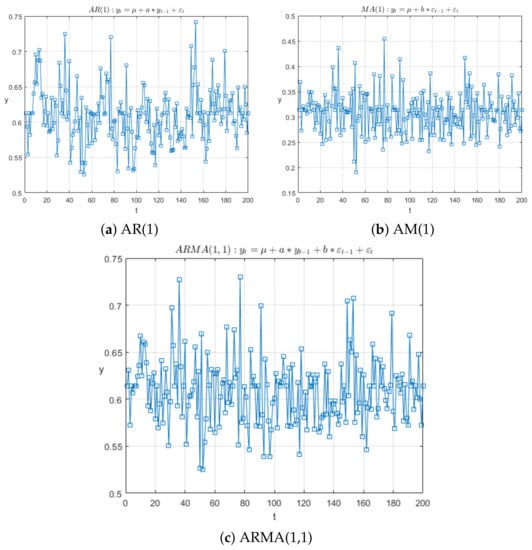
Figure 2.
Examples of time series models with asymmetric measurement errors: first-order autoregressive model AR(1) (a), first-order moving average model MA(1) (b), and combined model ARMA(1,1) (c); the errors correspond to the chi-square distribution.
As can be seen in Figure 1 and Figure 2, visually noisy data are practically indistinguishable from a series with standard errors; however, this can significantly affect the results of estimating model parameters, for example, due to the use of an incorrect likelihood function in the MLE method, or under assumptions about the normality of the residuals in the OLS method.
Software development and experimental testing is carried out on a standard PC with an Intel(R) Core(TM) i7-9700F CPU 3.00 Hz and 32 GB of RAM in a MATLAB software environment, version R2019b, and Econometrics Toolbox is used to generate and evaluate ARMA models. In addition, by setting the initial position of the random number generator (rng(2022)), all the results obtained are reproducible within the standard deviations.
The results of the first series of experiments are shown in Table 1, Table 2 and Table 3 for the AR(1), MA(1), and ARMA(1,1) models, respectively. The tables for each estimation method show the mean values (mean) of the estimated parameters and their standard deviation (MSE) from the true values based on the result of a series of 500 experiments with a sample size of 200 points. The estimation methods used are designated as MLE (maximum likelihood method), SME L2 (soft maximum entropy estimation method with quadratic regularization norm), and SME L1 + L2 using a linear combination of the L1 and L2 norms.

Table 1.
Estimation results for the AR(1) model.

Table 2.
Estimation results for the MA(1) model.

Table 3.
Estimation results for the ARMA(1,1) model.
Before proceeding to the analysis of the results given in Table 1, Table 2 and Table 3, it is worth noting that the application of the soft maximum entropy estimation method with the L2 norm is equivalent to the application of the least squares method. In addition, with normal errors, the maximum likelihood estimates are also the same as the least squares estimates. Therefore, in this series of experiments, where normal errors are used, the first two lines in Table 1, Table 2 and Table 3 practically coincide. The results obtained are consistent with the results of a similar experiment in [36], which also used 200 points of the time series and 500 repetitions for the same models with the same parameter values: the MSE value for the model parameters is about 0.004, and for the constant, it about 0.002.
As can be seen in the data in Table 1, Table 2 and Table 3, the standard MLE method turned out to be the most effective estimation method in all three models because this method shows the lowest MSE error. The method of soft maximum entropy estimation with a quadratic norm coincides with this result, and with a combined norm it is slightly inferior in efficiency in terms of MSE. This result is quite natural and expected since it is known that in the case of normal errors, it is the classical estimation methods (OLS and MLE) that are unbiased and most effective for estimating regression parameters. However, the method proposed in this paper based on approximate maximum entropy estimation shows results that are close in efficiency, which proves its efficiency for time series models.
Table 4, Table 5 and Table 6 show the experimental results for the same AR(1), MA(1), and ARMA(1,1) models, but under the conditions of non-standard measurement noise corresponding to a chi-square distribution. Likewise, the results of experiments with exponential measurement noise are demonstrated Table 7, Table 8 and Table 9. In this series of experiments, the classical OLS and MLE estimation methods turn out to be less effective due to the violation of the hypothesis about the normality of regression residuals.

Table 4.
Estimation results for the AR(1) model under -noise.

Table 5.
Estimation results for the MA(1) model under -noise.

Table 6.
Estimation results for the ARMA(1,1) model under -noise.

Table 7.
Estimation results for the AR(1) model under exp-noise.

Table 8.
Estimation results for the MA(1) model under exp-noise.

Table 9.
Estimation results for the ARMA(1,1) model under exp-noise.
From the results of Table 4, Table 5, Table 6, Table 7, Table 8 and Table 9, it can be noted that in this experiment all estimates are biased due to the asymmetry of errors; however, it is the estimates using the soft maximum entropy estimation method that show the smallest deviation from the true values, although their bias does not differ in order of magnitude from the rest of the methods. Under conditions of -noise (Table 4, Table 5 and Table 6), all estimation methods showed a comparable decrease in efficiency compared to similar experiments in Table 1, Table 2 and Table 3, so the value of the dispersion of estimates increased by about 1.5–2 times for the autoregressive model AR(1) and for the moving average model MA(1). To a lesser extent, the combined ARMA(1,1) model is prone to errors, which is probably due to the nature of the Hannan–Rissanen estimates, where the moving average component is restored through the estimates of autoregressive models of higher orders. The estimation results in Table 7, Table 8 and Table 9 are highly biased relative to the true values due to the asymmetry and tailness of the exponential distribution with significant mean value. In this case, all the methods under consideration suffer a considerable drop in efficiency as well as estimation bias.
Next, using the asymptotic normality of the estimates by the method of soft maximum entropy, we analyze the statistical significance of the results obtained for -noise by testing the hypothesis that the means of two normal distributions are equal. To do this, for each estimated parameter, the null hypothesis, , is tested against the alternative hypothesis about the inequality of means, , using Student’s t-test. In this case, the symbols denote not the average values of the parameters, but their average deviations (the so-called bias) from the true values given in Table 1, Table 2, Table 3, Table 4, Table 5 and Table 6 for all tested models. The results of hypothesis testing are presented in Table 10. The solid black circle indicates cases in which the null hypothesis is rejected at a significance level of 95%; therefore, the difference in the results of the estimates is significant.

Table 10.
Statistical significance of the estimation results for -noise.
During the calculations, the statistical significance of the difference in the estimation results was confirmed not in all of the experiments and not for all of the parameters. So, for example, estimates of all three parameters of the ARMA model turned out to be indistinguishable for the likelihood method and entropy estimation with the L2 regularization norm. On the other hand, entropy estimation with the combined norm shows more stable results, and the improvement in estimates was recorded in five cases out of seven. Therefore, this method will also be applied to experiments with real data.
6. Results of Experiments with Real Data
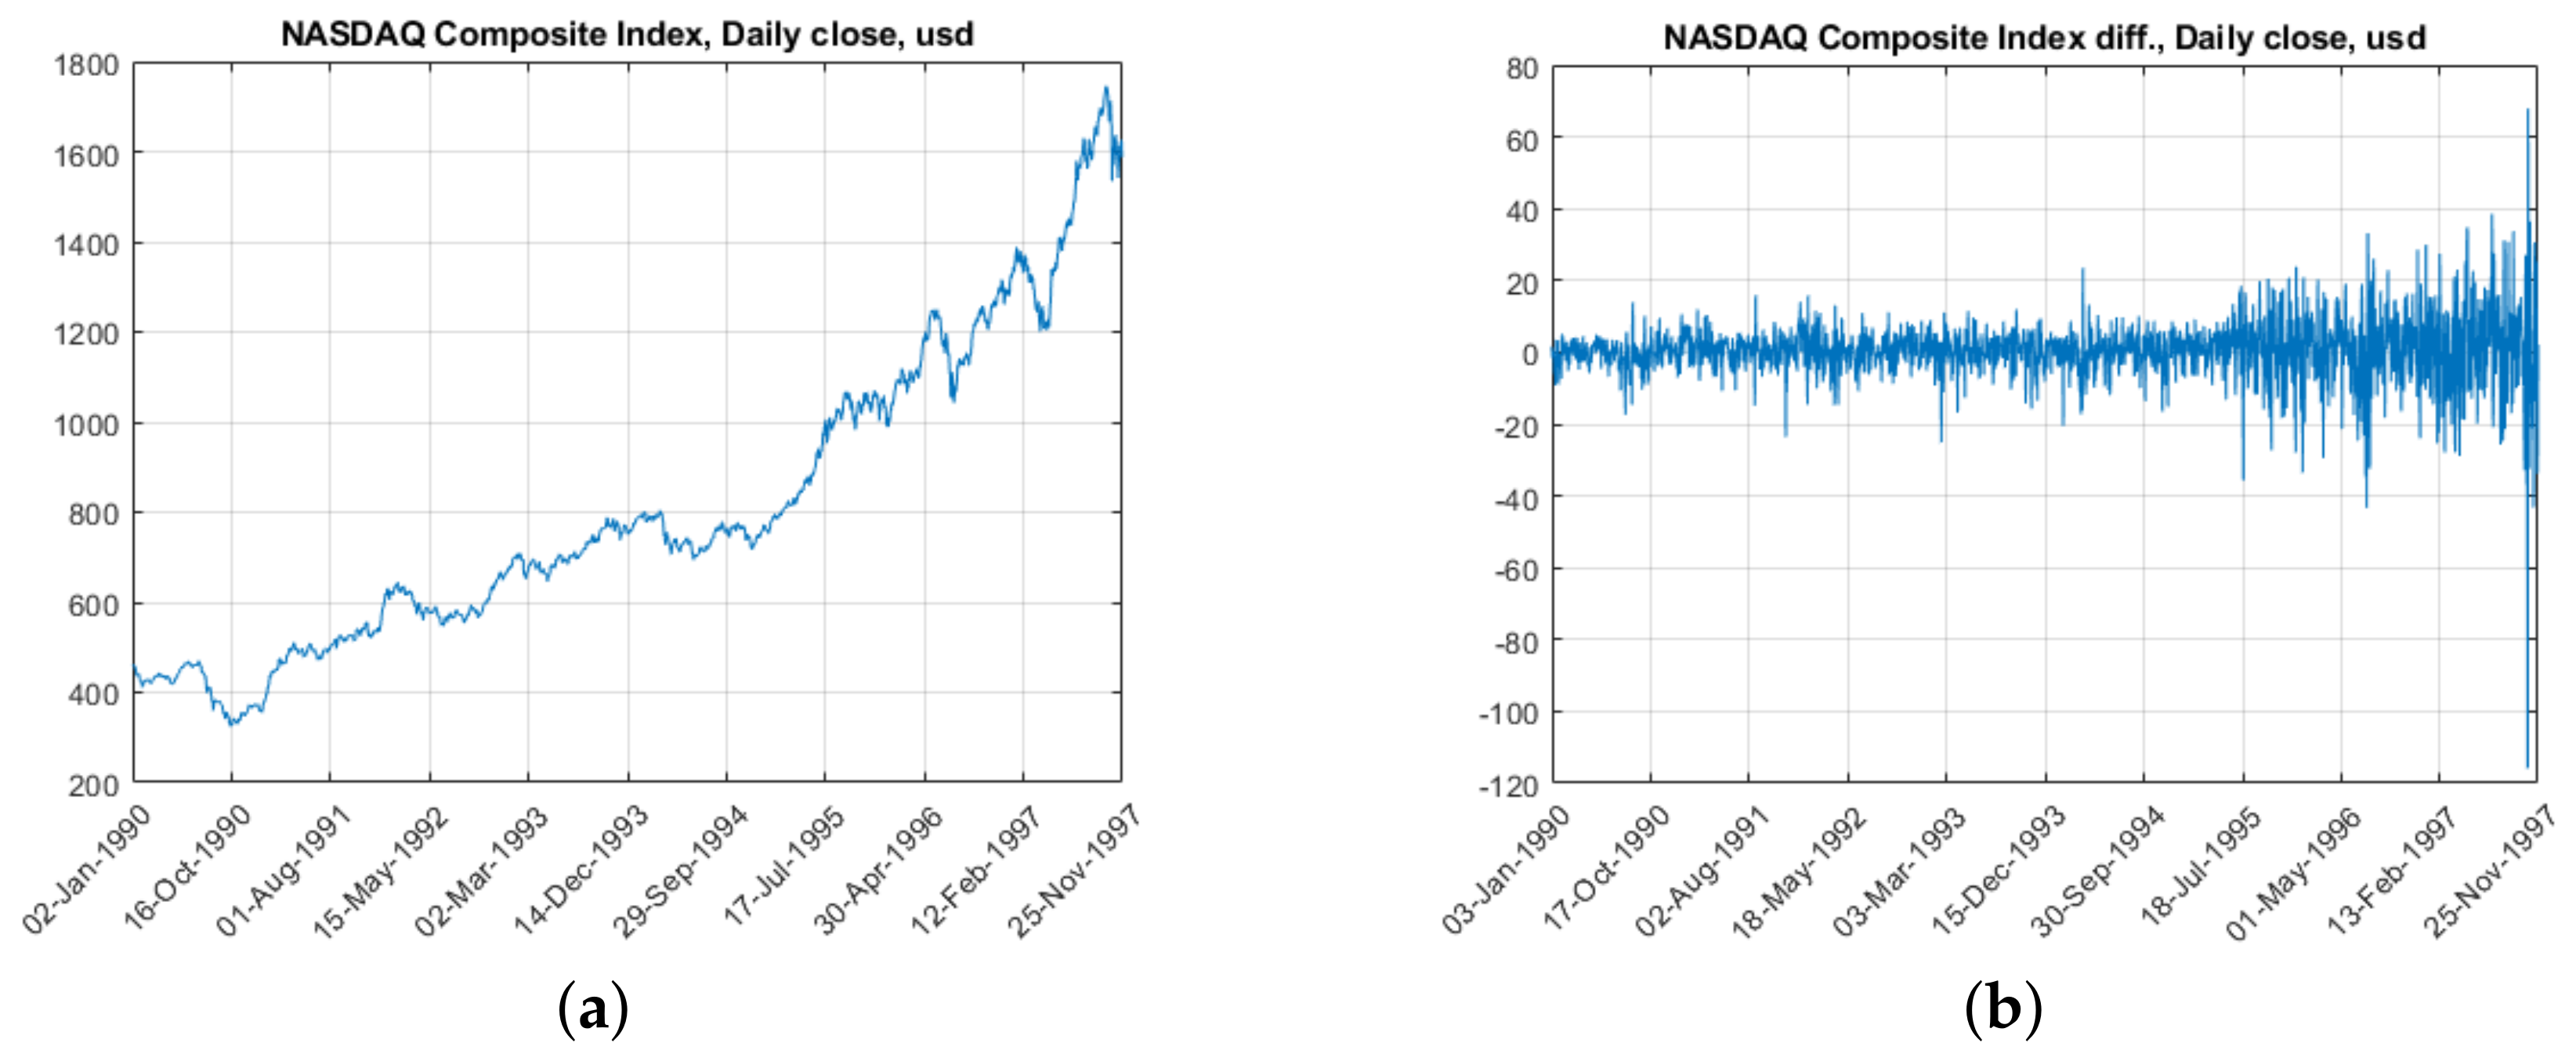
As an example of real data, we will use the NASDAQ stock exchange composite index data collection (Data_EquityIdx dataset in MATLAB since version R2012). The time series is the consecutive daily values of the index at the close of the exchange, and there are no gaps in the data. A graph of the NASDAQ index values from January 1990 to November 1997 is shown in Figure 3a, and A corresponding plot of the first difference in values is shown in Figure 3b.
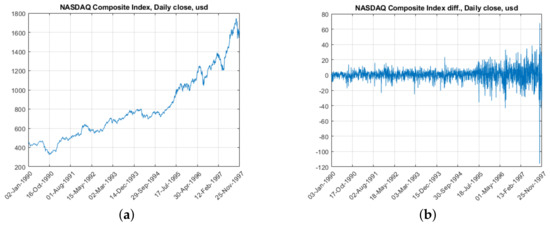
Figure 3.
Graphs of daily values (a) and the first difference in values (b) of the NASDAQ index from 2 January 1990 to 25 November 1997.
The selected segment is 2000 time reports, and we will use it to test the proposed estimation method. To do this, the sample is divided in a ratio of 80% and 20% into the training set, by which the model will be evaluated, and into the test set, by which we will calculate the average forecast error.
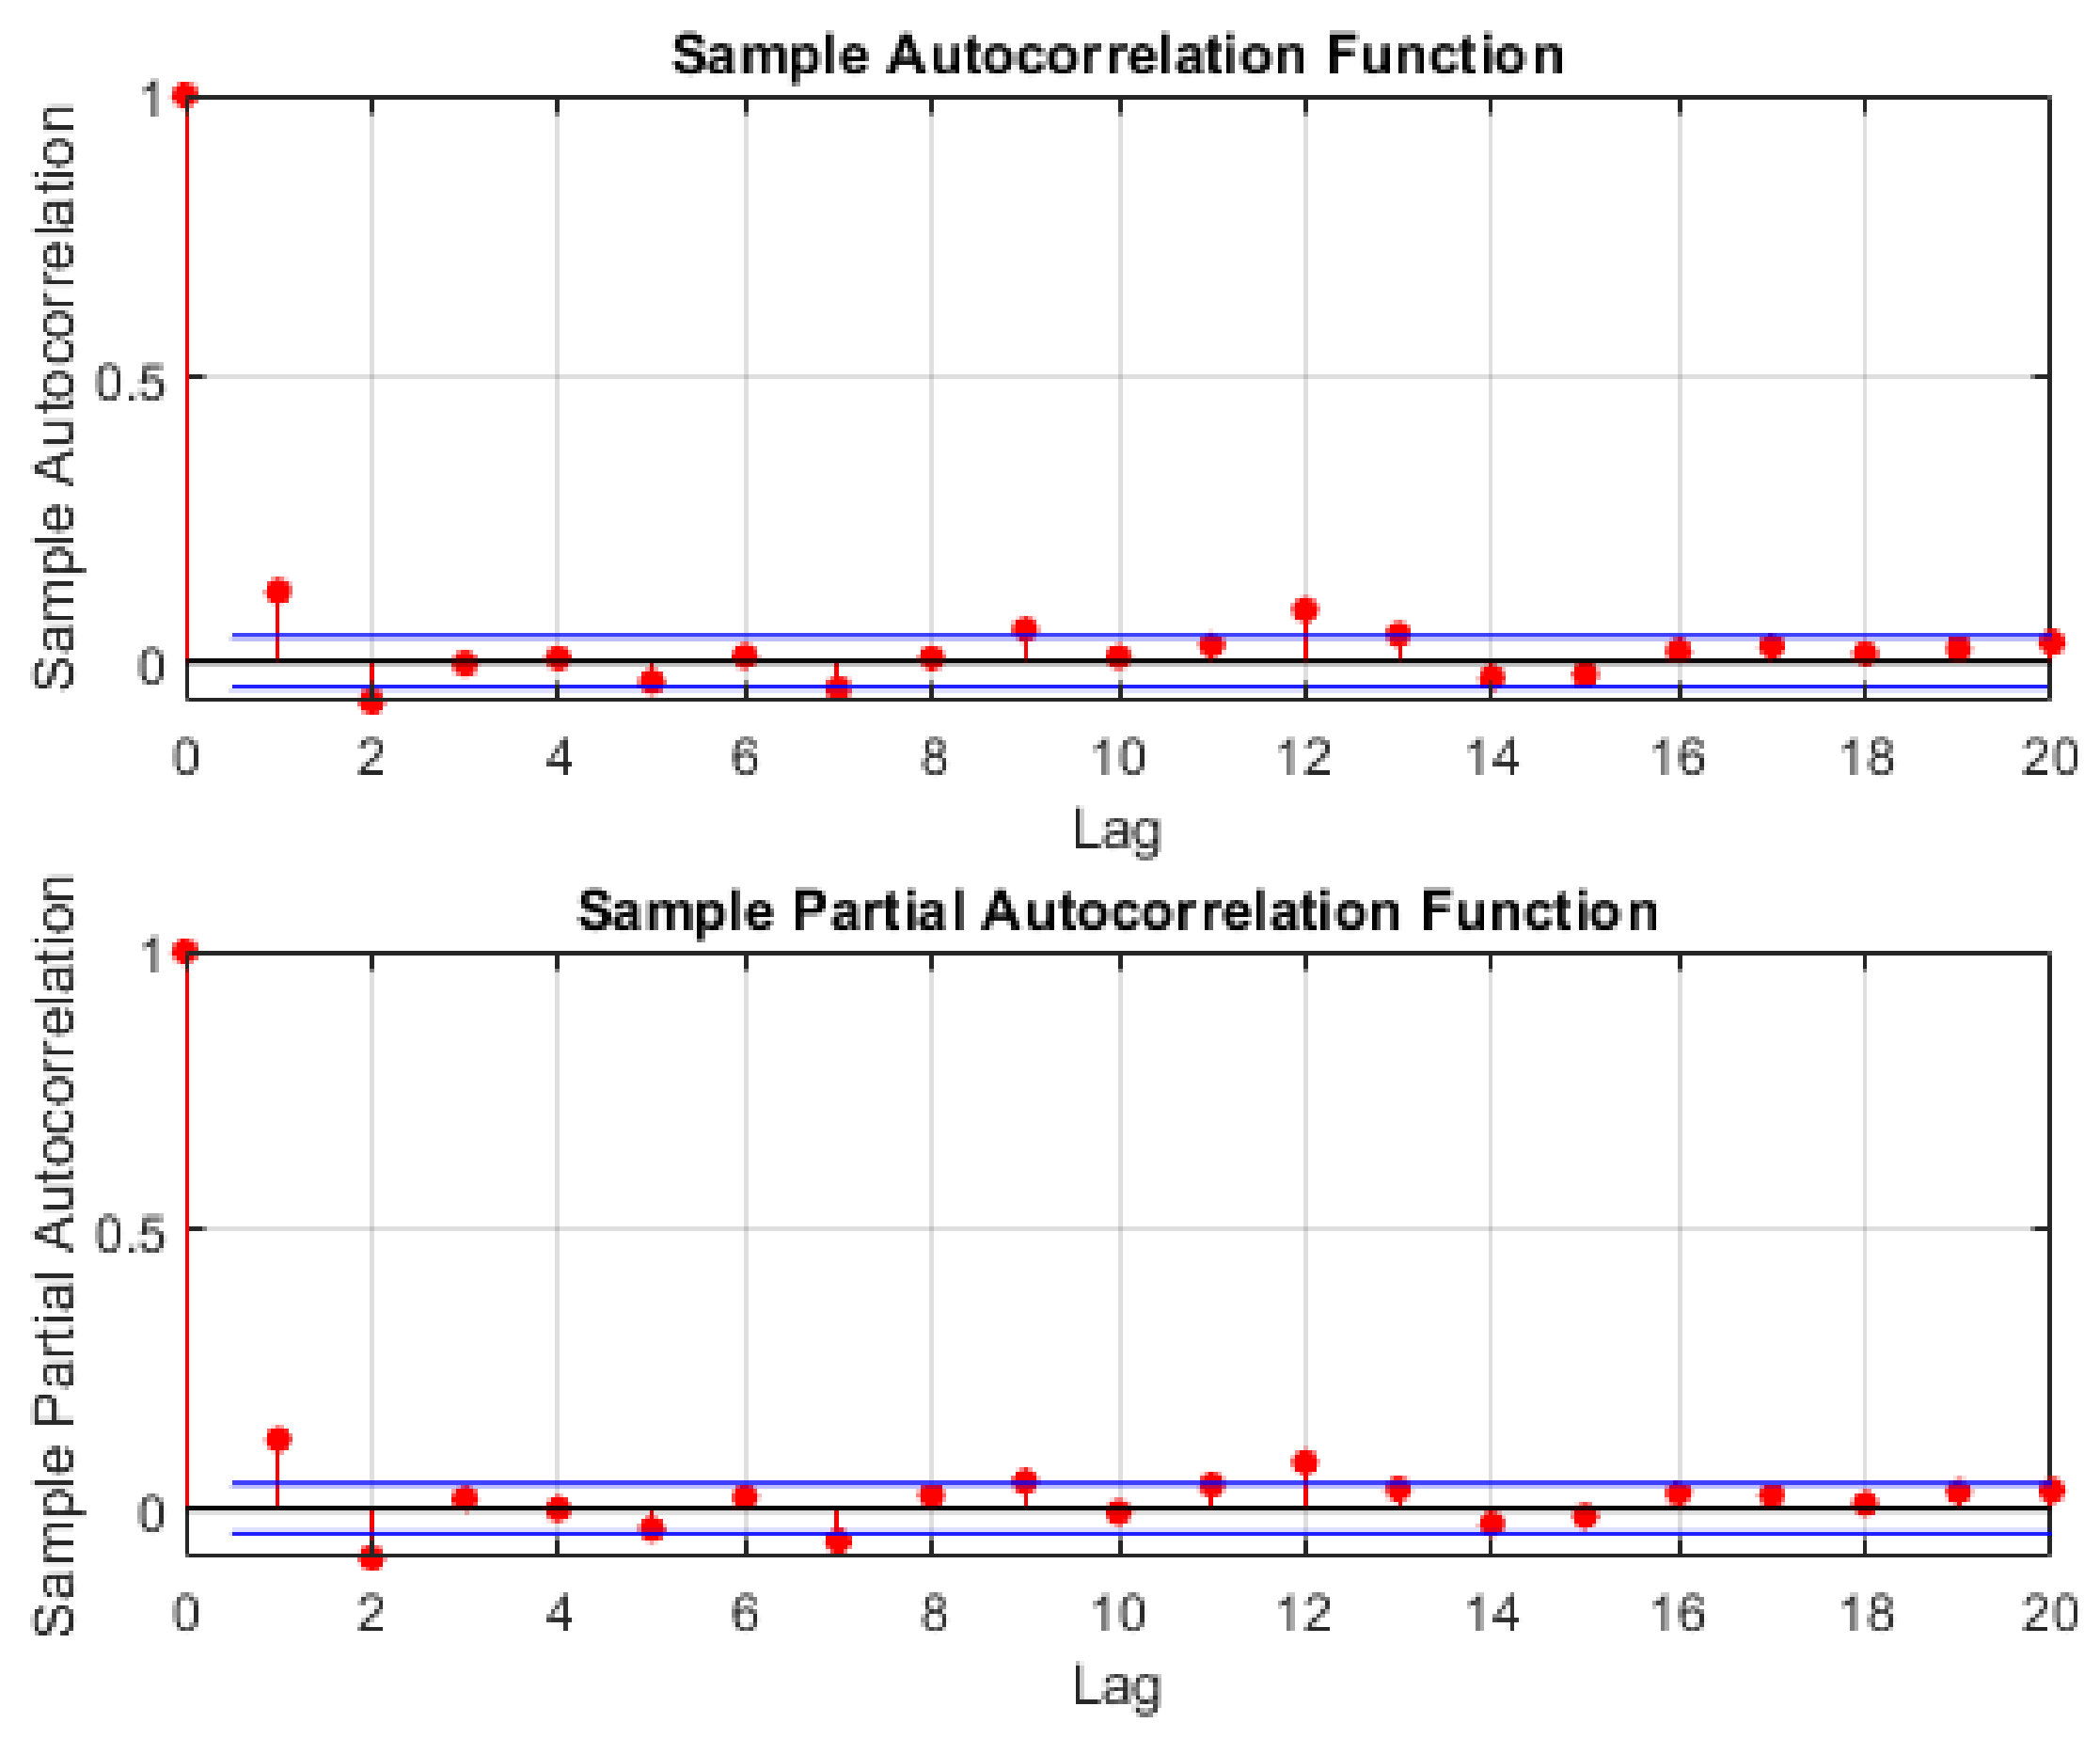
The model is chosen according to the Box–Jenkins methodology [37] based on the values of autocorrelation (ACF) and partial autocorrelation (PCF) functions. Graphs of the corresponding functions for the difference in index values are shown in Figure 4. Analysis of these graphs shows a probable ARMA(1,1) model or, taking into account the previously calculated difference from the original values, we obtain the ARIMA(1,1,1) model.
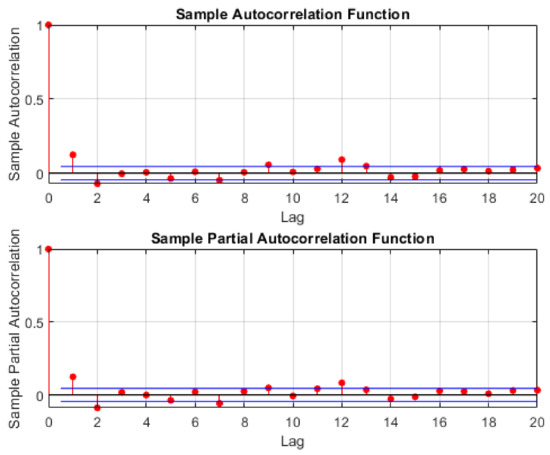
Figure 4.
Plots of autocorrelation (top) and partial autocorrelation (bottom) functions, where red dots are functions values and blue lines are confidence bound.
The model parameters are estimated in three ways: the first and second are the soft maximum entropy estimation (SME) method proposed in this paper with regularization norm and combined norm, and the third is the maximum likelihood method (MLE), which is standard for constructing ARMA models in MATLAB (arima function from Econometric Toolbox). The calculation results are shown in Table 11.

Table 11.
Parameter estimation results for the ARMA(1,1) model.
On the estimation interval, all three methods showed similar results, the values of the parameters are in the range of 5–10%, and the variance in the residuals differs slightly. Moreover, the parameter a for the first-order autoregression in all three cases turned out to be insignificant (using Student’s t-test).
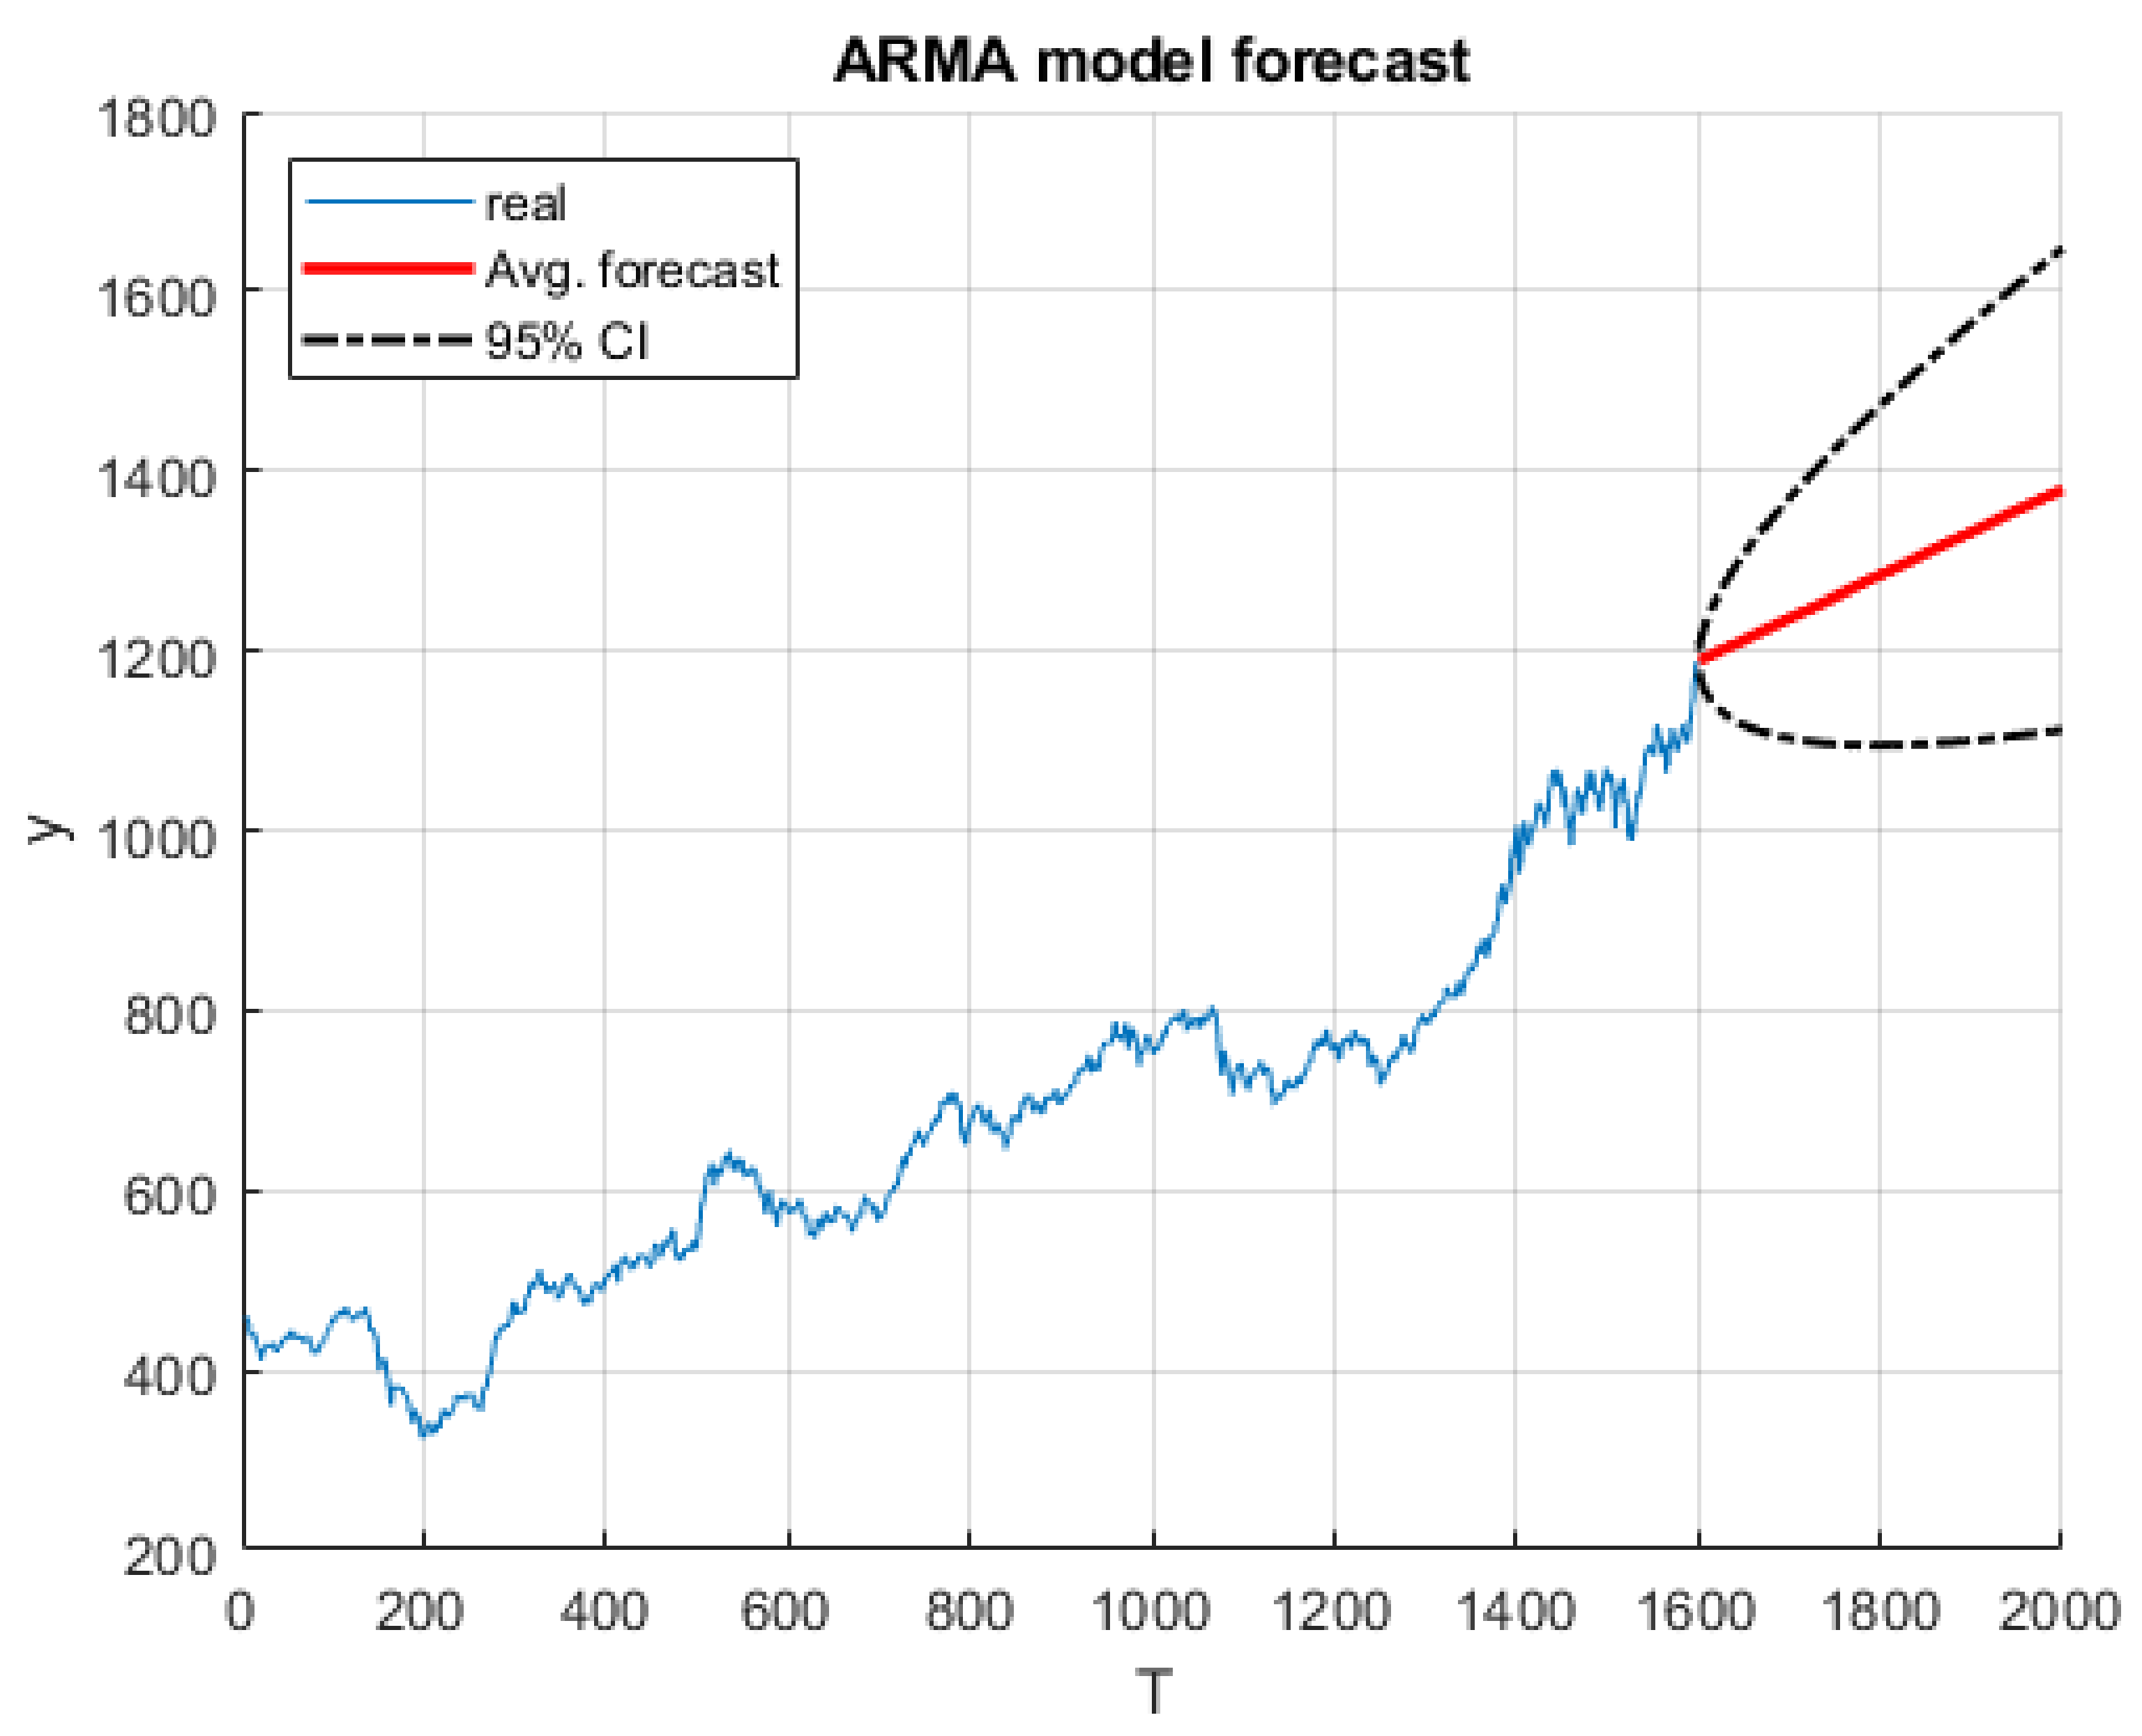
The resulting estimates were used to build a forecast and compare with real values from the remaining 20% of the data sample. In Figure 5, the forecast results are presented using estimates obtained by the soft maximum entropy estimation method, and the average curve (Avg. forecast) and the 95% confidence interval tube (95% CI) are marked on the graph. The maximum point of the posterior distribution density (MAP) obtained by sampling the entropy-optimal density for the model parameters was used as a point estimate of the model parameters, and the 95 percent interval was calculated over the entire ensemble of sampled values.
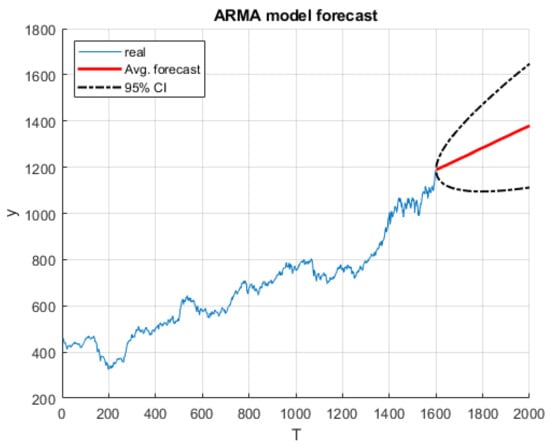
Figure 5.
Prediction result with ARMA(1,1) model.
As in the estimation interval, during testing, all the obtained models also showed close results; on the graph, they would be indistinguishable at a given scale. Thus, the value of the root-mean-square error RMSE for all points of the forecasting stage was 151.73 for estimates using the MLE method, and for estimates using the SME method, the values were 151.06 and 147.61 using the L2 and L1 + L2 norms, respectively.
Taking into account the true values of the NASDAQ index in this interval, we can say that the three forecasts received are within 2–3% of each other. The normalized root-mean-square error (NRMSE) values obtained by dividing by the mean of the predictor are 0.1124, 0.1119, and 0.1093 for the MLE, SME L2, and SME L1 + L2 estimates, respectively.
7. Conclusions
In this work, the concept of applying the method of soft maximum entropy estimation to build time series models, such as an autoregressive model, a moving average model, and a combined ARMA model, was developed. The main advantage of the proposed method compared to the traditional maximum entropy estimation method is the elimination of solving the system of balance constraints. The disadvantage of the proposed method is the necessity for explicit regression form with observed variables.
Experimental testing of the proposed approach was carried out, both for synthetic data and for real data on the NASDAQ exchange index. The simulation of synthetic data was carried out in the presence of measurement noise, both according to the law of the standard normal distribution, and noise of a non-standard asymmetric type, according to the chi-square law. The results of the experiments demonstrate the operability of the proposed approach and an efficiency close to the classical methods of estimation.
Author Contributions
Conceptualization, Y.A.D. and A.V.B.; data curation, Y.A.D.; methodology, A.V.B.; software, Y.A.D.; supervision, A.V.B.; writing—original draft, Y.A.D. and A.V.B. All authors have read and agreed to the published version of the manuscript.
Funding
This research was funded by the Ministry of Science and Higher Education of the Russian Federation (project no.: 075-15-2020-799).
Institutional Review Board Statement
Not applicable.
Informed Consent Statement
Not applicable.
Data Availability Statement
Not applicable.
Conflicts of Interest
The authors declare no conflict of interest.
References
- Popkov, Y.S. Soft Randomized Machine Learning. Dokl. Math. 2018, 98, 646–647. [Google Scholar] [CrossRef]
- Huang, D.S. Regression and Econometric Methods; John Wiley & Sons: New York, NY, USA, 1970; pp. 127–147. [Google Scholar]
- Hazewinkel, M. (Ed.) Bayesian approach to statistical problems. In Encyclopedia of Mathematics; Springer: Berlin/Heidelberg, Germany, 2001. [Google Scholar]
- Golan, A.; Judge, G.; Miller, D. Maximum Entropy Econometrics: Robust Estimation with Limited Data; John Wiley and Sons Ltd.: Chichester, UK, 1996. [Google Scholar]
- Dougherty, C. Introduction to Econometrics, 2nd ed.; Oxford University Press: Oxford, UK, 2004; 419p. [Google Scholar]
- Wu, X. A Weighted Generalized Maximum Entropy Estimator with a Data-driven Weight. Entropy 2009, 11, 917–930. [Google Scholar] [CrossRef]
- Pernagallo, G. An entropy-based measure of correlation for time series. Inf. Sci. 2023, 643, 119272. [Google Scholar] [CrossRef]
- Darbellay, G.A.; Wuertz, D. The entropy as a tool for analysing statistical dependences in financial time series. Phys. A Stat. Mech. Appl. 2000, 287, 429–439. [Google Scholar] [CrossRef]
- Marcelo, F.; Néri, B. Nonparametric entropy-based tests of independence between stochastic processes. Econom. Rev. 2009, 29, 276–306. [Google Scholar]
- Hong, Y.; White, H. Asymptotic distribution theory for nonparametric entropy measures of serial dependence. Econometrica 2005, 73, 837–901. [Google Scholar] [CrossRef]
- Dubnov, Y.A.; Boulytchev, A.V. Approximate estimation using the accelerated maximum entropy method. Part 1. Problem statement and implementation for the regression problem. Inf. Technol. Comput. Syst. 2022, 4, 69–80. [Google Scholar]
- Dubnov, Y.A.; Bulychev, A.V. Approximate estimation using the accelerated maximum entropy method. Part 2: Study of properties of estimates. Inf. Technol. Comput. Syst. 2023, 1, 71–81. [Google Scholar]
- Brockwell, P.J.; Davis, R.A. Introduction to Time Series and Forecasting, 2nd ed.; Springer-Verlag Inc.: New York, NY, USA, 1996; 449p. [Google Scholar]
- Shumway, R.H. Time Series Analysis and Its Applications; Stoffer, D.S., Ed.; Springer: New York, NY, USA, 2000; p. 98. ISBN 0-387-98950-1. [Google Scholar]
- Ayvazyan, S.A. Applied Statistics. Fundamentals of Econometrics; Unity-Dana: Moscow, Russia, 2001; Volume 2, 432p. [Google Scholar]
- Asteriou, D.; Hall, S.G. ARIMA Models and the Box–Jenkins Methodology. In Applied Econometrics, 2nd ed.; Palgrave MacMillan: London, UK, 2011; pp. 265–286. ISBN 978-0-230-27182-1. [Google Scholar]
- Bollerslev, T. Generalized autoregressive conditional heteroskedasticity. J. Econom. 1986, 52, 5–59. [Google Scholar] [CrossRef]
- Zhou, B.; He, D.; Sun, Z. Traffic predictability based on ARIMA/GARCH model. In Proceedings of the 2nd Conference on Next Generation Internet Design and Engineering, NGI ’06, Valencia, Spain, 3–5 April 2006; pp. 199–207. [Google Scholar] [CrossRef]
- Sathe, A.M.; Upadhye, N.S. Upadhye Estimation of the parameters of symmetric stable ARMA and ARMA–GARCH models. J. Appl. Stat. 2022, 49, 2964–2980. [Google Scholar] [CrossRef]
- Enders, W. Applied Econometric Time Series, 2nd ed.; J. Wiley: Hoboken, NJ, USA, 2004; pp. 65–67. ISBN 0-471-23065-0. [Google Scholar]
- Akaike, H. A new look at the statistical model identification. IEEE Trans. Autom. Control. 1974, 19, 716–723. [Google Scholar] [CrossRef]
- Mauricio, J.A. Exact maximum likelihood estimation of stationary vector ARMA models. J. Am. Stat. Assoc. 1995, 90, 282–291. [Google Scholar] [CrossRef]
- Andrews, B.; Davis, R.A.; Breidt, F.J. Maximum likelihood estimation for all-pass time series models. J. Multivar. Anal. 2006, 97, 1638–1659. [Google Scholar] [CrossRef][Green Version]
- Brockwell, P.J.; Davis, R.A. Introduction to Time Series and Forecasting; Springer: Berlin/Heidelberg, Germany, 2002. [Google Scholar]
- Stock, J.H.; Watson, M.W. Evidence on structural instability in macroeconomic time series relations. J. Bus. Econ. Stat. 1996, 14, 11–30. [Google Scholar]
- Chib, S.; Greenberg, E. Bayes inference in regression models with ARMA(p, q) errors. J. Econom. 1994, 64, 183–206. [Google Scholar] [CrossRef]
- Chumacero, R. Estimating ARMA models efficiently. Stud. Nonlinear Dyn. Econom. 2001, 5, 1074. [Google Scholar] [CrossRef][Green Version]
- Stoica, P. Generalized Yule-Walker equations and testing the orders of multivariate time series. Int. J. Control. 1983, 37, 159–1166. [Google Scholar] [CrossRef]
- Mikosch, T.; Gadrich, T.; Kluppelberg, C.; Adler, R.J. Parameter Estimation for ARMA Models with Infinite Variance Innovations. Ann. Statist. 1995, 23, 305–326. [Google Scholar] [CrossRef]
- Liu, Y. Robust parameter estimation for stationary processes by an exotic disparity from prediction problem. Stat. Probab. Lett. 2017, 129, 120–130. [Google Scholar] [CrossRef]
- Liu, Y.; Xue, Y.; Taniguchi, M. Robust linear interpolation and extrapolation of stationary time series in Lp. J. Time Ser. Anal. 2020, 41, 229–248. [Google Scholar] [CrossRef]
- Jaynes, E.T. Information Theory and Statistical Mechanics. In Statistical Physics; Ford, K., Ed.; Benjamin: New York, NY, USA, 1963; p. 181. [Google Scholar]
- Cover, T.M.; Thomas, J.A. Information Theory; Wiley: New York, NY, USA, 1991. [Google Scholar]
- Ayvazyan, S.A.; Mkhitaryan, V.S. Prikladnaya Statistika i Osnovy Ekonometriki; Uchebnik Dlya Vuzov. M.: Moscow, Russia, 1998; 1022p. [Google Scholar]
- Hannan, E.; Rissanen, J. Recursive Estimation of Mixed Autoregressive-Moving Average Order. Biometrika 1982, 69, 81–94. [Google Scholar] [CrossRef]
- Muler, N.; Pena, D.; Yohai, V.J. Robust estimation for ARMA models. Ann. Stat. 2009, 37, 816–840. [Google Scholar] [CrossRef]
- Box, G.E.; Jenkins, G.M.; Reinsel, G.C.; Ljung, G.M. Time Series Analysis: Forecasting and Control, 3rd ed.; Prentice Hall: Englewood Cliffs, NJ, USA, 1994. [Google Scholar]
Disclaimer/Publisher’s Note: The statements, opinions and data contained in all publications are solely those of the individual author(s) and contributor(s) and not of MDPI and/or the editor(s). MDPI and/or the editor(s) disclaim responsibility for any injury to people or property resulting from any ideas, methods, instructions or products referred to in the content. |
© 2023 by the authors. Licensee MDPI, Basel, Switzerland. This article is an open access article distributed under the terms and conditions of the Creative Commons Attribution (CC BY) license (https://creativecommons.org/licenses/by/4.0/).

